Joe Gomes, Managing Director, Equity Research Analyst, Generalist , Noble Capital Markets, Inc.
Joshua Zoepfel, Research Associate, Noble Capital Markets, Inc.
Refer to the full report for the price target, fundamental analysis, and rating.
Overview. The momentum exhibited in 2022 carried over into 2023 as Lifeway reported its 14th consecutive quarter of topline expansion. Higher pricing, accelerating kefir unit volume, and additional distribution drove the top line. Gross margin increased by 530 basis points y-o-y, reflecting higher pricing and volumes as well as favorable milk pricing.
1Q23 Results. Revenue totaled $37.9 million, up 11.2% year-over-year. Gross profit margin was 21.7%, compared to 16.4% in 1Q22. Lifeway reported net income of $830,000, or EPS of $0.06 per share, versus a net loss of $895,000, or a loss of $0.06/sh last year. We had forecast revenue of $36 million, gross margin of 22.2%, and net income of $1.26 million, or EPS of $0.08/sh.
Equity Research is available at no cost to Registered users of Channelchek. Not a Member? Click ‘Join’ to join the Channelchek Community. There is no cost to register, and we never collect credit card information.
This Company Sponsored Research is provided by Noble Capital Markets, Inc., a FINRA and S.E.C. registered broker-dealer (B/D).
*Analyst certification and important disclosures included in the full report. NOTE: investment decisions should not be based upon the content of this research summary. Proper due diligence is required before making any investment decision.
For more than 45 years, 1-800-Flowers.com has offered truly original floral arrangements, plants and unique gifts to celebrate birthdays, anniversaries, everyday occasions, and seasonal holidays, and to deliver comfort during times of grief. Backed by a caring team obsessed with service, 1-800-Flowers.com provides customers thoughtful ways to express themselves and connect with the most important people in their lives. 1-800-Flowers.com is part of the 1-800-FLOWERS.COM, Inc. family of brands. Shares in 1-800-FLOWERS.COM, Inc. are traded on the NASDAQ Global Select Market, ticker symbol: FLWS.
Michael Kupinski, Director of Research, Equity Research Analyst, Digital, Media & Technology , Noble Capital Markets, Inc.
Jacob Mutchler, Research Associate, Noble Capital Markets, Inc.
Refer to the full report for the price target, fundamental analysis, and rating.
Margins improve. The company reported $417.6 million in revenue, 1.9% below our estimate of $425.8 million. But, importantly, adj EBITDA in the quarter was negative $5.5 million, beating our estimate of a loss of $13.1 million by 57.5%. Improved margins in the quarter were attributed to reduced ocean freight costs and some commodity price decreases.
Raises fiscal 2023 adj. EBITDA guidance. Management provided full year fiscal 2023 guidance of revenue down 8% and adj. EBITDA to be in the range of $85 million to $90 million, an increase from its previous guidance of $75 million to $80 million. In addition, the company reiterated that it will exceed $75 million in free cash flow.
Equity Research is available at no cost to Registered users of Channelchek. Not a Member? Click ‘Join’ to join the Channelchek Community. There is no cost to register, and we never collect credit card information.
This Company Sponsored Research is provided by Noble Capital Markets, Inc., a FINRA and S.E.C. registered broker-dealer (B/D).
*Analyst certification and important disclosures included in the full report. NOTE: investment decisions should not be based upon the content of this research summary. Proper due diligence is required before making any investment decision.
FatburgerGains Momentum,Great American Cookies, Marble Slab Creamery,Buffalo’s Express Make Debut
LOS ANGELES, May 11, 2023 (GLOBE NEWSWIRE) — FAT (Fresh. Authentic. Tasty.) Brands Inc., parent company of Fatburger, Buffalo’s Express, Great American Cookies, Marble Slab Creamery, and 13 other restaurant concepts, announces a new development deal to open 22 new franchised locations in Iraq. In partnership with Global Vita USA LLC, 12 co-branded Fatburger and Buffalo’s Express locations will open throughout the country outside of the Kurdistan region over the next five years with the first units set to open in 2024. Ten co-branded Great American Cookies and Marble Slab Creamery units will also arrive throughout the country, opening in the next five years with the first locations set to open in 2024.
“With four units already operating in the Kurdistan region, Fatburger has established a strong following in the country,” said Taylor Wiederhorn, Chief Development Officer of FAT Brands. “Now, as we look to further expand the brand with Global Vita USA, we can reach even more fans that crave our all-American, custom-built burgers. This is new territory for Great American Cookies, Marble Slab Creamery, and Buffalo’s Express, however, the brands have had a presence in the Middle East for some time, so this is a natural progression for the concepts to strengthen their foothold in the region.”
Ever since the first Fatburger opened in Los Angeles 70 years ago, the chain has been known for its delicious, grilled-to-perfection and cooked-to-order burgers. Founder Lovie Yancey believed that a big burger with everything on it is a meal in itself; at Fatburger “everything” is not just the usual roster of toppings. Burgers can be customized with everything from bacon and eggs to chili and onion rings. In addition to its famous burgers, the Fatburger menu also includes Fat and Skinny Fries, sweet potato fries, scratch-made onion rings, Impossible™ Burgers, turkeyburgers, hand-breaded crispy chicken sandwiches, and hand-scooped milkshakes made from 100% real ice cream.
A perfect complement to Fatburger, Buffalo’s Express menu includes delicious bone-in and boneless chicken wings accompanied by a range of original sauces. All of Buffalo’s Express’ wings are accompanied by celery, carrots, and blue cheese, ranch or honey mustard dressing.
For nearly 40 years, Marble Slab Creamery has been an innovator in the ice cream space, dreaming up the frozen slab technique and offering homemade, small-batch ice cream with free unlimited mix-ins, shakes in a variety of flavors, and ice cream cakes.
Since 1977, Great American Cookies has baked up a reputation for not only being the creator of the Original Cookie Cake, but also for its famous chocolate chip cookie recipe. Other crave-able menu items include brownies and Double Doozies™, delectable icing sandwiched between two cookies.
About FAT (Fresh. Authentic. Tasty.) Brands FAT Brands (NASDAQ: FAT) is a leading global franchising company that strategically acquires, markets, and develops fast casual, quick-service, casual dining, and polished casual dining concepts around the world. The Company currently owns 17 restaurant brands: Round Table Pizza, Fatburger, Marble Slab Creamery, Johnny Rockets, Fazoli’s, Twin Peaks, Great American Cookies, Hot Dog on a Stick, Buffalo’s Cafe & Express, Hurricane Grill & Wings, Pretzelmaker, Elevation Burger, Native Grill & Wings, Yalla Mediterranean and Ponderosa and Bonanza Steakhouses, and franchises and owns over 2,300 units worldwide. For more information on FAT Brands, please visit www.fatbrands.com.
About Fatburger
An all-American, Hollywood favorite, Fatburger is a fast-casual restaurant serving big, juicy, tasty burgers, crafted specifically to each customer’s liking. With a legacy spanning 70 years, Fatburger’s extraordinary quality and taste inspire fierce loyalty amongst its fan base, which includes a number of A-list celebrities and athletes. Featuring a contemporary design and ambience, Fatburger offers an unparalleled dining experience, demonstrating the same dedication to serving gourmet, homemade, custom-built burgers as it has since 1952 – The Last Great Hamburger Stand™.
About Buffalo’s Express
Founded in 1985 in Roswell, Georgia, Buffalo’s Express is a fast-casual chain known for its world-famous chicken wings and proprietary wing sauces. Co-branded with over 100 Fatburger restaurants to date, Buffalo’s Express’ significant growth can be attributed to its high-quality menu offerings and unparalleled dining experience. Featuring a contemporary design and ambience, whether guests are dining-in or having take-out/delivery, Buffalo’s Express offers friends and families the flexibility to enjoy their world-famous chicken wings however they prefer. Buffalo’s Express – Where Everyone is Family™.
About Great American Cookies
Founded on a family chocolate chip cookie recipe in 1977, Great American Cookies believes that pure, simple delight is part of living a full life. Serving the Original Cookie Cake, fresh baked cookies in a variety of flavors, brownies, and Double Doozies™, we promise to treat you to bites of bliss that prove how sweet life can be. With more than 370 bakeries across the country and internationally in Bahrain, Guam, Saudi Arabia, and treats available to ship right to your door, the sweet spot is always close to home. For more information, visit www.greatamericancookies.com.
About Marble Slab Creamery Since dreaming up the frozen slab technique and serving fresh homemade, small-batch ice cream in-store since 1983, Marble Slab Creamery has always known how to dream big. We sprinkle our customers with imagination and promise to inspire with infinite ice cream possibilities to feed your curiosity and capture cravings. With our free unlimited mix-in philosophy, delicious ice cream and shakes in a variety of flavors, hand-rolled waffle cones, and ice cream cakes, imagination has no limits. Today, Marble Slab Creamery is enjoyed by consumers across the globe with locations in Bahrain, Bangladesh, Canada, Kuwait, Pakistan, Saudi Arabia, Guam, Puerto Rico, and the United States. For more information, visit www.marbleslab.com.
Forward Looking Statements
This press release contains forward-looking statements within the meaning of the Private Securities Litigation Reform Act of 1995, including statements relating to the timing and performance of new store openings. Forward-looking statements reflect expectations of FAT Brands Inc. (“we”, “our” or the “Company”) concerning the future and are subject to significant business, economic and competitive risks, uncertainties and contingencies, including but not limited to uncertainties surrounding the severity, duration and effects of the COVID-19 pandemic. These factors are difficult to predict and beyond our control, and could cause our actual results to differ materially from those expressed or implied in such forward-looking statements. We refer you to the documents that we file from time to time with the Securities and Exchange Commission, such as our reports on Form 10-K, Form 10-Q and Form 8-K, for a discussion of these and other factors. We undertake no obligation to update any forward-looking statement to reflect events or circumstances occurring after the date of this press release.
Generates Net Revenues of $417.6 million and a Net Loss of $71.0 million, which Net Loss Includes an After-Tax, Non-Cash Goodwill and Intangible Asset Impairment Charge of $53.1 million
Adjusted Net Loss(1) Improves to $17.8 million, Compared with an Adjusted Net Loss of $21.0 million in the Prior Year Period
Adjusted EBITDA(1)Loss Improves to $5.5 million, Compared with an Adjusted EBITDA Loss of $12.0 million in the Prior Year Period, as Gross Margin Improvement and Operating Efficiencies Mitigate Revenue Decline
Updates Fiscal 2023 Outlook
(1) Refer to “Definitions of Non-GAAP Financial Measures” and the tables attached at the end of this press release for reconciliation of non-GAAP results to applicable GAAP results.
JERICHO, N.Y.–(BUSINESS WIRE)– 1-800-FLOWERS.COM, Inc. (NASDAQ: FLWS), a leading provider of gifts designed to help inspire customers to give more, connect more, and build more and better relationships, today reported results for its fiscal 2023 third quarter, ended April 2, 2023.
Fiscal 2023 Third Quarter Highlights
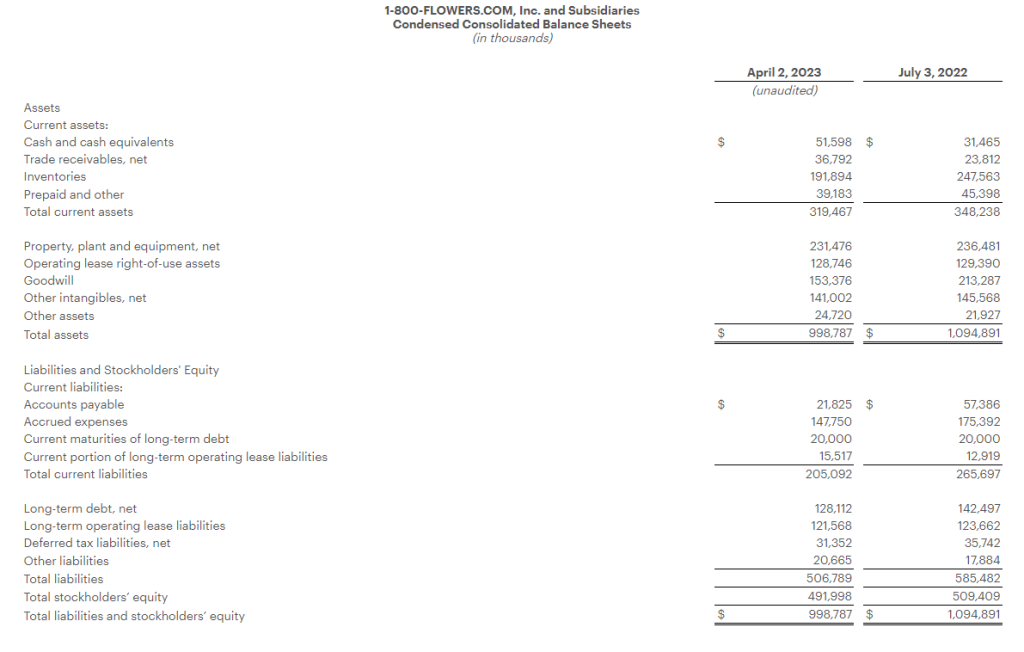
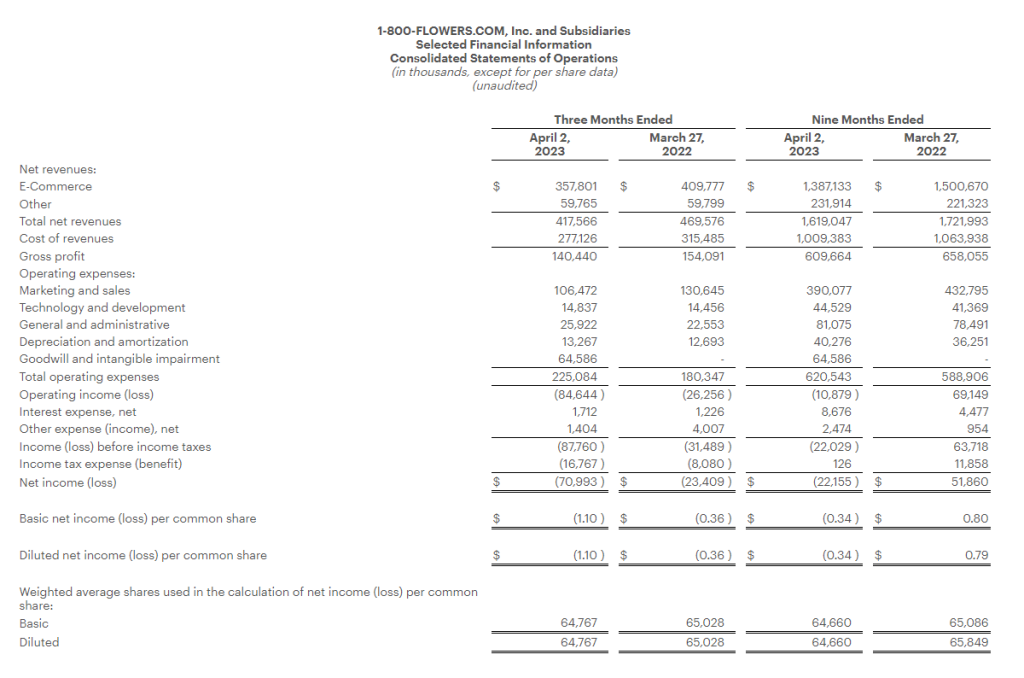
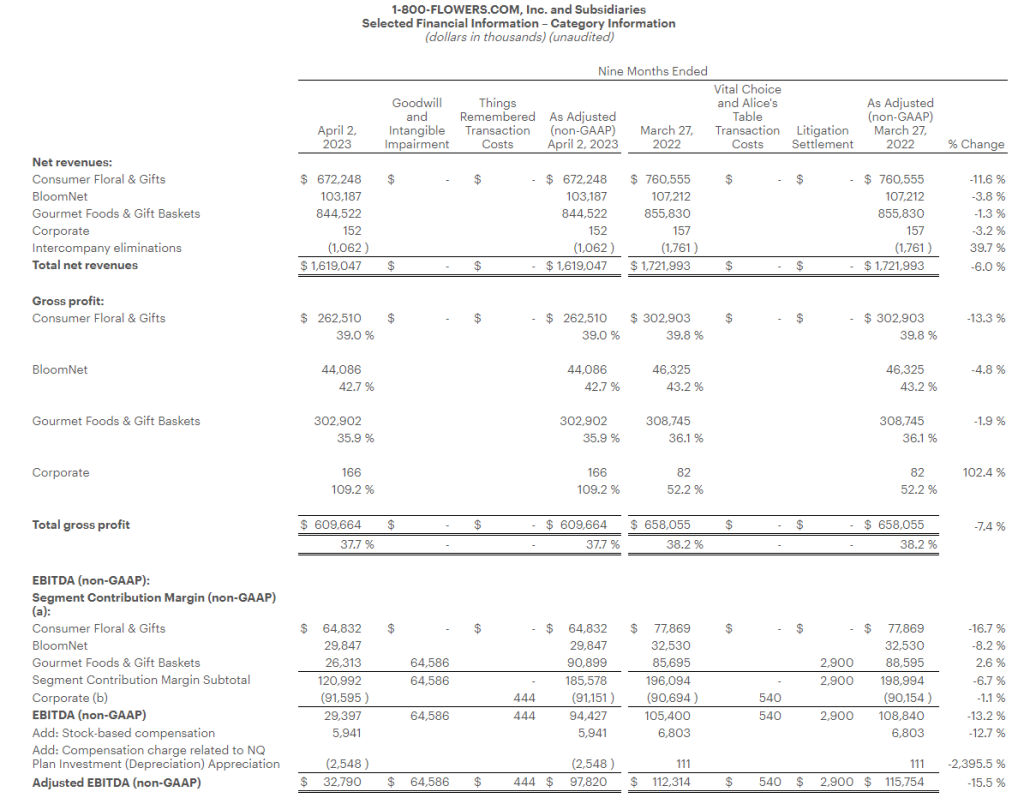
Total consolidated revenues decreased 11.1% to $417.6 million, compared with total consolidated revenues of $469.6 million in the prior year period.
Gross profit margin for the quarter increased 80 basis points to 33.6%, compared with 32.8% in the prior year period.
Operating expenses increased $44.7 million from the prior year period, including a $64.6 million non-cash goodwill and intangible assets impairment charge. Excluding the impact of this charge, operating expenses declined $19.8 million or 11.0%, as compared with the prior year period.
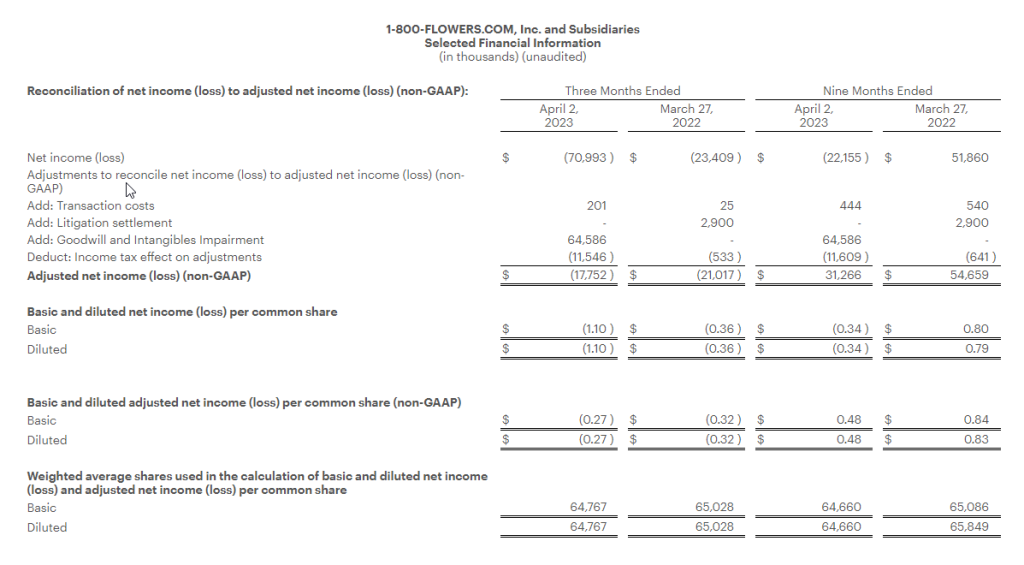
Net loss for the quarter was $71.0 million, or $1.10 per share, which includes an after-tax non-cash goodwill and intangible assets impairment charge of $53.1 million or $0.82 per share. Adjusted Net Loss1 was $17.8 million, or $0.27 per share.
Adjusted EBITDA1 for the quarter was a loss of $5.5 million, as compared with an Adjusted EBITDA1 loss of $12.0 million in the prior year period.
Chris McCann, CEO of 1-800-FLOWERS.COM, Inc., said “Our third quarter results reflect a continuation of the trends that we have experienced throughout this fiscal year. In this challenging consumer environment, we are executing on our strategy to invest in and develop stronger customer relationships, while continuing to identify operating efficiencies to reduce expenses. As a result of our expense optimization efforts, combined with improving gross margin, we exceeded our Adjusted EBITDA1 expectations for the quarter and are raising our full year Adjusted EBITDA1 guidance.”
McCann added, “We will continue to optimize operating expenses in this environment, while simultaneously investing in the long-term growth of our business, as evidenced by the recent acquisitions of Things Remembered® and SmartGift®. We believe these efforts position us well once the broader consumer environment improves and reinforce our company as a premier gifting destination that helps our customers connect with the important people in their lives.”
Third Quarter 2023 Financial Results
Total consolidated revenues decreased 11.1% to $417.6 million, as compared with total consolidated revenues of $469.6 million in the prior year period.
Gross profit margin for the quarter was 33.6%, increasing 80 basis points from the prior year period led by the Consumer Floral and Gifts and BloomNet® segments. Operating expenses, excluding the impairment charge noted above, stock-based compensation, appreciation-or-depreciation of investments in the Company’s non-qualified compensation plan, and the costs associated with a legal settlement in the prior year period, were 38.1% of total sales, or flat with the prior year period, as lower advertising and labor costs were offset by higher depreciation and amortization due to our capital investments in technology and automation.
As a result, the Company generated a net loss of $71.0 million, or ($1.10) per share, and an Adjusted Net Loss1 of $17.8 million, or ($0.27) per share, compared with a net loss of $23.4 million, or ($0.36) per share, and an Adjusted Net Loss1 of $21.0 million, or ($0.32) per share, in the prior year period.
Adjusted EBITDA1 for the quarter was a loss of $5.5 million, as compared with an Adjusted EBITDA1 loss of $12.0 million in the prior year period.
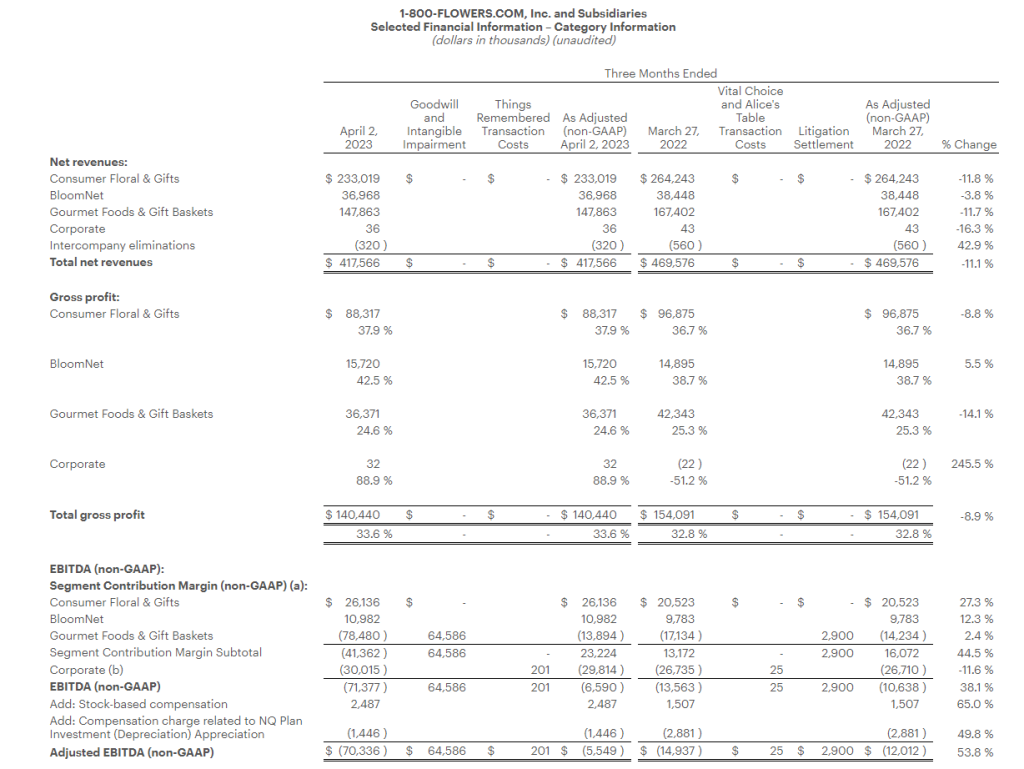
Segment Results
The Company provides selected financial results for its Gourmet Foods and Gift Baskets, Consumer Floral and Gifts, and BloomNet segments in the tables attached to this release and as follows:
Gourmet Foods and Gift Baskets: Revenues for the quarter decreased 11.7% to $147.9 million, compared with $167.4 million in the prior year period. Gross profit margin was 24.6%, compared with 25.3% in the prior year period, declining on continued higher commodity costs, increased promotional activity and overhead cost deleveraging. Segment contribution margin1 without the impairment charge was a loss of $13.9 million, compared with an adjusted loss1 of $14.2 million a year ago.
Consumer Floral and Gifts: Revenues decreased 11.8% to $233.0 million, compared with $264.2 million in the prior year period. Gross profit margin increased to 37.9%, compared with 36.7% in the prior year period, on strategic pricing initiatives and lower cost of merchandise in part due to lower ocean freight costs. Segment contribution margin1 was $26.1 million, compared with $20.5 million the prior year.
BloomNet: Revenues for the quarter decreased 3.8% to $37.0 million, compared with $38.4 million in the prior year period. Gross profit margin increased to 42.5%, compared with 38.7% in the prior year on strategic pricing initiatives and lower ocean freight costs. Segment contribution margin1 was $11.0 million, compared with $9.8 million in the prior year period.
Company Guidance
Based on its third quarter performance and outlook for the balance of the year, the Company is updating its Fiscal 2023 guidance. This outlook includes a continuation of the challenging consumer environment, which is expected to be mitigated by the Company’s expense management efforts.
The Company expects:
total revenues to decline approximately 8% as compared with the prior year;
adjusted EBITDA1 to be in a range of $85 million to $90 million; and
Free Cash Flow1 to exceed $75 million.
Conference Call
The Company will conduct a conference call to discuss the above details and attached financial results today, Thursday, May 11, at 8:00 a.m. (ET). The conference call will be webcast from the Investors section of the Company’s website at www.1800flowersinc.com. A recording of the call will be posted on the Investors section of the Company’s website within two hours of the call’s completion. A telephonic replay of the call can be accessed beginning at 2:00 p.m. (ET) today through May 18, 2023, at: (US) 1-877-344-7529; (Canada) 855-669-9658; (International) 1-412-317-0088; enter conference ID #: 4785326.
Definitions of non-GAAP Financial Measures:
We sometimes use financial measures derived from consolidated financial information, but not presented in our financial statements prepared in accordance with U.S. generally accepted accounting principles (“GAAP”). Certain of these are considered “non-GAAP financial measures” under the U.S. Securities and Exchange Commission rules. Non-GAAP financial measures referred to in this document are either labeled as “non-GAAP” or designated as such with a “1”. See below for definitions and the reasons why we use these non-GAAP financial measures. Where applicable, see the Selected Financial Information below for reconciliations of these non-GAAP measures to their most directly comparable GAAP financial measures. Reconciliations for forward-looking figures would require unreasonable efforts at this time because of the uncertainty and variability of the nature and amount of certain components of various necessary GAAP components, including, for example, those related to compensation, tax items, amortization or others that may arise during the year, and the Company’s management believes such reconciliations would imply a degree of precision that would be confusing or misleading to investors. For the same reasons, the Company is unable to address the probable significance of the unavailable information. The lack of such reconciling information should be considered when assessing the impact of such disclosures.
EBITDA and Adjusted EBITDA:
We define EBITDA as net income (loss) before interest, taxes, depreciation, and amortization. Adjusted EBITDA is defined as EBITDA adjusted for the impact of stock-based compensation, Non-Qualified Plan Investment appreciation/depreciation, and for certain items affecting period-to-period comparability. See Selected Financial Information for details on how EBITDA and Adjusted EBITDA were calculated for each period presented. The Company presents EBITDA and Adjusted EBITDA because it considers such information meaningful supplemental measures of its performance and believes such information is frequently used by the investment community in the evaluation of similarly situated companies. The Company uses EBITDA and Adjusted EBITDA as factors to determine the total amount of incentive compensation available to be awarded to executive officers and other employees. The Company’s credit agreement uses EBITDA and Adjusted EBITDA to determine its interest rate and to measure compliance with certain covenants. EBITDA and Adjusted EBITDA are also used by the Company to evaluate and price potential acquisition candidates. EBITDA and Adjusted EBITDA have limitations as analytical tools and should not be considered in isolation or as a substitute for analysis of the Company’s results as reported under GAAP. Some of the limitations are: (a) EBITDA and Adjusted EBITDA do not reflect changes in, or cash requirements for, the Company’s working capital needs; (b) EBITDA and Adjusted EBITDA do not reflect the significant interest expense, or the cash requirements necessary to service interest or principal payments, on the Company’s debts; and (c) although depreciation and amortization are non-cash charges, the assets being depreciated and amortized may have to be replaced in the future and EBITDA does not reflect any cash requirements for such capital expenditures. EBITDA and Adjusted EBITDA should only be used on a supplemental basis combined with GAAP results when evaluating the Company’s performance.
Segment Contribution Margin and Adjusted Segment Contribution Margin
We define Segment Contribution Margin as earnings before interest, taxes, depreciation, and amortization, before the allocation of corporate overhead expenses. Adjusted Contribution Margin is defined as Contribution Margin adjusted for certain items affecting period-to-period comparability. See Selected Financial Information for details on how Segment Contribution Margin and Adjusted Segment Contribution Margin were calculated for each period presented. When viewed together with our GAAP results, we believe Segment Contribution Margin and Adjusted Segment Contribution Margin provide management and users of the financial statements meaningful information about the performance of our business segments. Segment Contribution Margin and Adjusted Segment Contribution Margin are used in addition to and in conjunction with results presented in accordance with GAAP and should not be relied upon to the exclusion of GAAP financial measures. The material limitation associated with the use of Segment Contribution Margin and Adjusted Segment Contribution Margin is that they are an incomplete measure of profitability as they do not include all operating expenses or non-operating income and expenses. Management compensates for this limitation when using these measures by looking at other GAAP measures, such as Operating Income and Net Income.
Adjusted Net Income (Loss) and Adjusted or Comparable Net Income (Loss) Per Common Share:
We define Adjusted Net Income (Loss) and Adjusted or Comparable Net Income (Loss) Per Common Share as Net Income (Loss) and Net Income (Loss) Per Common Share adjusted for certain items affecting period-to-period comparability. See Selected Financial Information below for details on how Adjusted Net Income (Loss) Per Common Share and Adjusted or Comparable Net Income (Loss) Per Common Share were calculated for each period presented. We believe that Adjusted Net Income (Loss) and Adjusted or Comparable Net Income (Loss) Per Common Share are meaningful measures because they increase the comparability of period-to-period results. Since these are not measures of performance calculated in accordance with GAAP, they should not be considered in isolation of, or as a substitute for, GAAP Net Income (Loss) and Net Income (Loss) Per Common share, as indicators of operating performance and they may not be comparable to similarly titled measures employed by other companies.
Free Cash Flow:
We define Free Cash Flow as net cash provided by operating activities less capital expenditures. The Company considers Free Cash Flow to be a liquidity measure that provides useful information to management and investors about the amount of cash generated by the business after the purchases of fixed assets, which can then be used to, among other things, invest in the Company’s business, make strategic acquisitions, strengthen the balance sheet, and repurchase stock or retire debt. Free Cash Flow is a liquidity measure that is frequently used by the investment community in the evaluation of similarly situated companies. Since Free Cash Flow is not a measure of performance calculated in accordance with GAAP, it should not be considered in isolation or as a substitute for analysis of the Company’s results as reported under GAAP. A limitation of the utility of Free Cash Flow as a measure of financial performance is that it does not represent the total increase or decrease in the Company’s cash balance for the period.
About 1-800-FLOWERS.COM, Inc.
1-800-FLOWERS.COM, Inc. is a leading provider of gifts designed to help inspire customers to give more, connect more, and build more and better relationships. The Company’s e-commerce business platform features an all-star family of brands, including: 1-800-Flowers.com®, 1-800-Baskets.com®, Cheryl’s Cookies®, Harry & David®, PersonalizationMall.com®, Shari’s Berries®, FruitBouquets.com®, Things Remembered®, Moose Munch®, The Popcorn Factory®, Wolferman’s Bakery®, Vital Choice®, Stock Yards® and Simply Chocolate®. Through the Celebrations Passport® loyalty program, which provides members with free standard shipping and no service charge across our portfolio of brands, 1-800-FLOWERS.COM, Inc. strives to deepen relationships with customers. The Company also operates BloomNet®, an international floral and gift industry service provider offering a broad-range of products and services designed to help members grow their businesses profitably; Napco℠, a resource for floral gifts and seasonal décor; DesignPac Gifts, LLC, a manufacturer of gift baskets and towers; and Alice’s Table®, a lifestyle business offering fully digital livestreaming and on demand floral, culinary and other experiences to guests across the country. 1-800-FLOWERS.COM, Inc. was recognized among the top 5 on the National Retail Federation’s 2021 Hot 25 Retailers list, which ranks the nation’s fastest-growing retail companies, and was named to the Fortune 1000 list in 2022. Shares in 1-800-FLOWERS.COM, Inc. are traded on the NASDAQ Global Select Market, ticker symbol: FLWS. For more information, visit 1800flowersinc.com or follow @1800FLOWERSInc on Twitter.
FLWS–COMP FLWS-FN
Special Note Regarding Forward Looking Statements:
This press release contains forward-looking statements within the meaning of the Private Securities Litigation Reform Act of 1995. These forward-looking statements represent the Company’s current expectations or beliefs concerning future events and can generally be identified using statements that include words such as “estimate,” “expects,” “project,” “believe,” “anticipate,” “intend,” “plan,” “foresee,” “forecast,” “likely,” “will,” “target” or similar words or phrases. These forward-looking statements are subject to risks, uncertainties, and other factors, many of which are outside of the Company’s control, which could cause actual results to differ materially from the results expressed or implied in the forward-looking statements, including, but not limited to, statements regarding the Company’s ability to achieve its guidance for the full Fiscal year; the Company’s ability to leverage its operating platform and reduce its operating expense ratio; its ability to sell through existing inventories; its ability to successfully integrate acquired businesses and assets; its ability to successfully execute its strategic initiatives; its ability to cost effectively acquire and retain customers; the outcome of contingencies, including legal proceedings in the normal course of business; its ability to compete against existing and new competitors; its ability to manage expenses associated with sales and marketing and necessary general and administrative and technology investments; its ability to reduce promotional activities and achieve more efficient marketing programs; and general consumer sentiment and industry and economic conditions that may affect levels of discretionary customer purchases of the Company’s products. The Company undertakes no obligation to publicly update any of the forward-looking statements, whether because of new information, future events or otherwise, made in this release or in any of its SEC filings. Consequently, you should not consider any such list to be a complete set of all potential risks and uncertainties. For a more detailed description of these and other risk factors, refer to the Company’s SEC filings, including the Company’s Annual Reports on Form 10-K and its Quarterly Reports on Form 10-Q.
Note: The following tables are an integral part of this press release without which the information presented in this press release should be considered incomplete.
Joe Gomes, Managing Director, Equity Research Analyst, Generalist , Noble Capital Markets, Inc.
Joshua Zoepfel, Research Associate, Noble Capital Markets, Inc.
Refer to the full report for the price target, fundamental analysis, and rating.
CEO Stepping Down. Yesterday, CVG announced CEO Harold Bevis is resigning from his role as President and CEO, as well as a Board member, effective May 19th to become CEO of another company. The Company noted Mr. Bevis’ resignation did not result from any disagreement with the Company on any matter.
Interim CEO. Current Chairman of the Board Robert Griffin will step into an interim CEO role. On the Board since 2005, Mr. Griffin worked closely with Mr. Bevis in designing and implementing the Company’s strategy. Mr. Griffin has an extensive financial background, including as Head of Investment Banking for Barclays Capital. Other Board members with a more operational and manufacturing background will assist Mr. Griffin. CVG will be in good hands during the transition, in our view.
Equity Research is available at no cost to Registered users of Channelchek. Not a Member? Click ‘Join’ to join the Channelchek Community. There is no cost to register, and we never collect credit card information.
This Company Sponsored Research is provided by Noble Capital Markets, Inc., a FINRA and S.E.C. registered broker-dealer (B/D).
*Analyst certification and important disclosures included in the full report. NOTE: investment decisions should not be based upon the content of this research summary. Proper due diligence is required before making any investment decision.
FAT Brands (NASDAQ: FAT) is a leading global franchising company that strategically acquires, markets, and develops fast casual, quick-service, casual dining, and polished casual dining concepts around the world. The Company currently owns 17 restaurant brands: Round Table Pizza, Fatburger, Marble Slab Creamery, Johnny Rockets, Fazoli’s, Twin Peaks, Great American Cookies, Hot Dog on a Stick, Buffalo’s Cafe & Express, Hurricane Grill & Wings, Pretzelmaker, Elevation Burger, Native Grill & Wings, Yalla Mediterranean and Ponderosa and Bonanza Steakhouses, and franchises and owns over 2,300 units worldwide. For more information on FAT Brands, please visit www.fatbrands.com.
Joe Gomes, Managing Director, Equity Research Analyst, Generalist , Noble Capital Markets, Inc.
Joshua Zoepfel, Research Associate, Noble Capital Markets, Inc.
Refer to the full report for the price target, fundamental analysis, and rating.
1Q23 Results. FAT Brands reported 1Q23 revenue of $105.7 million, up 8.5% y-o-y from $97.4 million in the year ago quarter. System-wide sales growth was 9.9%. Same Store Sales were up 4.3%. FAT reported adjusted EBITDA of $19.2 million in the quarter, up from $15.1 million in 1Q22. Adjusted net loss for the quarter was $23.5 million, or a loss of $1.43 per share, compared to a net loss of $18.5 million, or a loss of $1.13 per share, last year. We had projected revenue of $105 million and a net loss of $17.3 million, or a loss of $1.04 per share.
Organic Growth. Organic growth at FAT Brands remains strong. A total of 41 new units were opened during 1Q and plans are to open 45 additional units in 2Q. For the full year, a total of 175 new units are expected to open, representing over 25% growth from last year. The pipeline remains robust with development agreements for more than 1,000 new locations.
Equity Research is available at no cost to Registered users of Channelchek. Not a Member? Click ‘Join’ to join the Channelchek Community. There is no cost to register, and we never collect credit card information.
This Company Sponsored Research is provided by Noble Capital Markets, Inc., a FINRA and S.E.C. registered broker-dealer (B/D).
*Analyst certification and important disclosures included in the full report. NOTE: investment decisions should not be based upon the content of this research summary. Proper due diligence is required before making any investment decision.
ACCO Brands Corporation is one of the world’s largest designers, marketers and manufacturers of branded academic, consumer and business products. Our widely recognized brands include AT-A-GLANCE®, Esselte®, Five Star®, GBC®, Kensington®, Leitz®, Mead®, PowerA®, Quartet®, Rapid®, Rexel®, Swingline®, Tilibra®, and many others. Our products are sold in more than 100 countries around the world. More information about ACCO Brands, the Home of Great Brands Built by Great People, can be found at www.accobrands.com.
Joe Gomes, Managing Director, Equity Research Analyst, Generalist , Noble Capital Markets, Inc.
Joshua Zoepfel, Research Associate, Noble Capital Markets, Inc.
Refer to the full report for the price target, fundamental analysis, and rating.
A Return to Normalcy? We are hopeful 2023 will transition back to a normal operating environment after nearly three years of COVID impacted results. We are already seeing positive signs of normalcy in the back-to-school business and chip availability should help return PowerA back to its pre-COVID growth trajectory.
Cash Flows. Operating cash flow for the first three months was a use of cash of $23.2 million, compared to cash used of $104.2 million in the prior year due to improved working capital. Management continues to expect free cash flow for 2023 to exceed $100 million.
Equity Research is available at no cost to Registered users of Channelchek. Not a Member? Click ‘Join’ to join the Channelchek Community. There is no cost to register, and we never collect credit card information.
This Company Sponsored Research is provided by Noble Capital Markets, Inc., a FINRA and S.E.C. registered broker-dealer (B/D).
*Analyst certification and important disclosures included in the full report. NOTE: investment decisions should not be based upon the content of this research summary. Proper due diligence is required before making any investment decision.
ACCO Brands Corporation is one of the world’s largest designers, marketers and manufacturers of branded academic, consumer and business products. Our widely recognized brands include AT-A-GLANCE®, Esselte®, Five Star®, GBC®, Kensington®, Leitz®, Mead®, PowerA®, Quartet®, Rapid®, Rexel®, Swingline®, Tilibra®, and many others. Our products are sold in more than 100 countries around the world. More information about ACCO Brands, the Home of Great Brands Built by Great People, can be found at www.accobrands.com.
Joe Gomes, Managing Director, Equity Research Analyst, Generalist , Noble Capital Markets, Inc.
Joshua Zoepfel, Research Associate, Noble Capital Markets, Inc.
Refer to the full report for the price target, fundamental analysis, and rating.
First Quarter Results. ACCO exceeded top and bottom-line expectations for 1Q23. Revenue was $402.6 million, an 8.8% decrease over last year’s $441.6 million but above our estimate at $390 million. Adverse foreign exchange reduced sales by $10.6 million, or 2.4%. Comparable sales fell 6.4%. Operating income was at $10.1 million compared to $6.8 million the prior year, and the Company reported a net loss of $3.7 million, or a loss of $0.04/sh, compared to a loss of $2.7 million, or $0.03/sh, last year. We estimated operating income of $4 million and net loss of $7.3 million, or $0.08/sh.
Revenue Segments. North America had sales of $176.7 million down from $208.5 million last year, with operating income of $5.2 million compared to $13.9 million. EMEA had sales of $135.8 million compared to $156.1 million and operating income of $7.8 million versus $5.6 million. International had sales of $90.1 million versus $77.0 million last year, with operating income of $9.0 million up from $4.2 million last year.
Equity Research is available at no cost to Registered users of Channelchek. Not a Member? Click ‘Join’ to join the Channelchek Community. There is no cost to register, and we never collect credit card information.
This Company Sponsored Research is provided by Noble Capital Markets, Inc., a FINRA and S.E.C. registered broker-dealer (B/D).
*Analyst certification and important disclosures included in the full report. NOTE: investment decisions should not be based upon the content of this research summary. Proper due diligence is required before making any investment decision.
Joe Gomes, Managing Director, Equity Research Analyst, Generalist , Noble Capital Markets, Inc.
Joshua Zoepfel, Research Associate, Noble Capital Markets, Inc.
Refer to the full report for the price target, fundamental analysis, and rating.
The Strategy is Working. Posting record quarterly revenue and improved margins for the quarter indicates management’s growth strategy is working. We believe CVG is at an inflection point for improved growth and margins. The Company is well on its way to achieving its 2027 goal of $1.5 billion in revenue and 9% adjusted EBITDA margin, in our view.
Volume, Price Driving Top Line. Record first quarter revenue was driven by a combination of volume and price, with volume contributing about 60% of top line growth in the quarter and price the other 40%. CVG spent considerable energy in 2022 seeking out more favorable pricing to reflect current operating realities. The final major contract was redone in the first quarter of 2023 and began contributing at the beginning of April.
Equity Research is available at no cost to Registered users of Channelchek. Not a Member? Click ‘Join’ to join the Channelchek Community. There is no cost to register, and we never collect credit card information.
This Company Sponsored Research is provided by Noble Capital Markets, Inc., a FINRA and S.E.C. registered broker-dealer (B/D).
*Analyst certification and important disclosures included in the full report. NOTE: investment decisions should not be based upon the content of this research summary. Proper due diligence is required before making any investment decision.
Joe Gomes, Managing Director, Equity Research Analyst, Generalist , Noble Capital Markets, Inc.
Joshua Zoepfel, Research Associate, Noble Capital Markets, Inc.
Refer to the full report for the price target, fundamental analysis, and rating.
Strong Results. CVGI had a strong quarter with record revenues of $262.7 million versus $244.4 million the prior year, an increase of 7.5%. We had revenue of $245 million. The higher revenue was driven by increased pricing to offset material cost increases and increased sales volume, offset by sales volume decreases in the Industrial Automation segment. Foreign currency translation also unfavorably impacted first quarter of 2023 revenues by $3.6 million, or 1.5%.
Continued Strong Results. Operating income for the Company totaled $14.6 million compared to $8.4 million the previous year. Net income for the Company was at $8.7 million, or $0.26 per diluted share, versus $4.0 million, or $0.12, last year. Adjusted net income was $9.2 million, or $0.28 adjusted diluted EPS compared to $5.3 million in the previous year, or $0.16. Adjusted EBITDA was $19.8 million compared to $13.5 million.
Equity Research is available at no cost to Registered users of Channelchek. Not a Member? Click ‘Join’ to join the Channelchek Community. There is no cost to register, and we never collect credit card information.
This Company Sponsored Research is provided by Noble Capital Markets, Inc., a FINRA and S.E.C. registered broker-dealer (B/D).
*Analyst certification and important disclosures included in the full report. NOTE: investment decisions should not be based upon the content of this research summary. Proper due diligence is required before making any investment decision.
Newegg Commerce, Inc. (NASDAQ: NEGG), founded in 2001 and based in the City of Industry, Calif., near Los Angeles, is a leading global online retailer for PC hardware, consumer electronics, gaming peripherals, home appliances, automotive and lifestyle technology. Newegg also serves businesses’ e-commerce needs with marketing, supply chain and technical solutions in a single platform. For more information, please visit Newegg.com.
Michael Kupinski, Director of Research, Equity Research Analyst, Digital, Media & Technology , Noble Capital Markets, Inc.
Patrick McCann, Research Associate, Noble Capital Markets, Inc.
Refer to the full report for the price target, fundamental analysis, and rating.
Solid Q4 results. The company reported better-than-expected Q4 results. Total revenue of $480.6 million beat our estimate of $439.2 million by 9%, and adj. EBITDA of $5.1 million was significantly better than our forecast of $0.1 million.
Still a challenging sales environment. Following a difficult 2022, persistent macroeconomic concerns appear to be putting pressure on the consumer electronics market. As such, management noted that 2023 could face similar challenges to 2022. The company initiated cost-cutting measures with the aim of offsetting some of the adverse revenue impacts on cash flow.
Equity Research is available at no cost to Registered users of Channelchek. Not a Member? Click ‘Join’ to join the Channelchek Community. There is no cost to register, and we never collect credit card information.
This Research is provided by Noble Capital Markets, Inc., a FINRA and S.E.C. registered broker-dealer (B/D).
*Analyst certification and important disclosures included in the full report. NOTE: investment decisions should not be based upon the content of this research summary. Proper due diligence is required before making any investment decision.
FAT Brands (NASDAQ: FAT) is a leading global franchising company that strategically acquires, markets, and develops fast casual, quick-service, casual dining, and polished casual dining concepts around the world. The Company currently owns 17 restaurant brands: Round Table Pizza, Fatburger, Marble Slab Creamery, Johnny Rockets, Fazoli’s, Twin Peaks, Great American Cookies, Hot Dog on a Stick, Buffalo’s Cafe & Express, Hurricane Grill & Wings, Pretzelmaker, Elevation Burger, Native Grill & Wings, Yalla Mediterranean and Ponderosa and Bonanza Steakhouses, and franchises and owns over 2,300 units worldwide. For more information on FAT Brands, please visit www.fatbrands.com.
Joe Gomes, Managing Director, Equity Research Analyst, Generalist , Noble Capital Markets, Inc.
Joshua Zoepfel, Research Associate, Noble Capital Markets, Inc.
Refer to the full report for the price target, fundamental analysis, and rating.
Co-CEOs. FAT Brands announced Ken Kuick and Rob Rosen as Co-CEOs, effective May 5, 2023. As previously announced, Andy Wiederhorn will step down as CEO and continue in his role as Chairman of the Board, where he will focus on the strategic direction of the company, the allocation of capital, and ensuring the management team executes the Company’s business plan while maintaining quality restaurant operations.
Staying In-House. Currently, Mr. Kuick is Chief Financial Officer of the Company and Mr. Rosen holds the position of Executive Vice President of Capital Markets. Both played an integral role alongside Mr. Wiederhorn in driving the growth of FAT Brands. Both will continue in their current roles as well as assuming the Co-CEO role. With their in-depth knowledge and contribution to the growth of FAT Brands, we believe the choice of Mr. Kuick and Mr. Rosen to be a win for the Company.
Equity Research is available at no cost to Registered users of Channelchek. Not a Member? Click ‘Join’ to join the Channelchek Community. There is no cost to register, and we never collect credit card information.
This Company Sponsored Research is provided by Noble Capital Markets, Inc., a FINRA and S.E.C. registered broker-dealer (B/D).
*Analyst certification and important disclosures included in the full report. NOTE: investment decisions should not be based upon the content of this research summary. Proper due diligence is required before making any investment decision.
SeniorFAT BrandsExecutivesAppointed to Lead Global Restaurant Franchising Company
LOS ANGELES, May 01, 2023 (GLOBE NEWSWIRE) — FAT (Fresh. Authentic. Tasty.) Brands Inc. announces Ken Kuick and Rob Rosen as Co-CEOs, effective May 5, 2023. As previously announced, Andy Wiederhorn will step down as CEO and continue in his role as Chairman of the Board, where he will focus on the strategic direction of the company, the allocation of capital, and ensuring the management team executes the Company’s business plan while maintaining quality restaurant operations.
Joining FAT Brands in 2021, Mr. Kuick, Chief Financial Officer, and Mr. Rosen, Executive Vice President of Capital Markets, have both played an integral role in the growth of the Company with a focus on strategic growth initiatives, including acquisitions and driving company profitability. Mr. Kuick and Mr. Rosen will also continue in their respective roles as Chief Financial Officer and Executive Vice President of Capital Markets while assuming the Co-CEO role. Together, they will focus on driving forward the Company’s overarching goals of increasing organic growth through new store openings, growing the utilization of its manufacturing facility, and bolstering the success of high-growth brands, including Twin Peaks.
Mr. Kuick’s past roles include Chief Financial Officer, Noodles & Company, Chief Accounting Officer, VICI Properties, and Chief Accounting Officer, Caesars Entertainment Operating Company, a subsidiary of Caesars Entertainment. Mr. Rosen is a Wall Street veteran with over 30 years of experience in structured finance, banking, lending, and portfolio management. Mr. Rosen has held positions at Fleet Bank, Kidder Peabody, and Bank of Tokyo, and has 20 years of experience with Black Diamond Capital Management in a variety of management, board-level, and advisory capacities.
“Over the last few years, Ken and Rob have played a tremendous role in the unprecedented growth of FAT Brands,” said Andy Wiederhorn, CEO of FAT Brands. “Their financial acumen and track record for hitting key company benchmarks make them well-positioned to take on the CEO role together. I look forward to continuing to work with Ken and Rob in the Chairman of the Board position to aid in the continued success of FAT Brands.”
“Andy is a great leader and I’m extremely humbled to take on this new responsibility and drive forward the key goals of the company,” said Ken Kuick, Chief Financial Officer of FAT Brands. “We are fortunate to have such a talented team at FAT Brands and I see great opportunity ahead in building upon our positioning as one of the largest restaurant companies in the U.S.”
“I’m honored to take on the Co-CEO position of a company that continues to surpass growth expectations,” said Rob Rosen, Executive Vice President of Capital Markets at FAT Brands. “In the near term, Ken and I will look to build on the strong foundation FAT Brands has already laid, which includes our robust growth pipeline, exciting innovations, and a commitment to our franchisees and customers.”
FAT Brands (NASDAQ: FAT) is a leading global franchising company that strategically acquires, markets, and develops fast casual, quick-service, casual dining, and polished casual dining concepts around the world. The Company currently owns 17 restaurant brands: Round Table Pizza, Fatburger, Marble Slab Creamery, Johnny Rockets, Fazoli’s, Twin Peaks, Great American Cookies, Hot Dog on a Stick, Buffalo’s Cafe & Express, Hurricane Grill & Wings, Pretzelmaker, Elevation Burger, Native Grill & Wings, Yalla Mediterranean and Ponderosa and Bonanza Steakhouses, and franchises and owns over 2,300 units worldwide. For more information on FAT Brands, please visit www.fatbrands.com.
Forward Looking Statements
This press release contains forward-looking statements within the meaning of the Private Securities Litigation Reform Act of 1995. Forward-looking statements reflect expectations of FAT Brands Inc. (“we”, “our” or the “Company”) concerning future events and are subject to significant business, economic and competitive risks, uncertainties and contingencies, including but not limited to uncertainties surrounding the severity, duration and effects of the COVID-19 pandemic. These factors are difficult to predict and beyond our control, and could cause our actual results to differ materially from those expressed or implied in such forward-looking statements. We refer you to the documents that we file from time to time with the Securities and Exchange Commission, such as our reports on Form 10-K, Form 10-Q and Form 8-K, for a discussion of these and other factors. We undertake no obligation to update any forward-looking statement to reflect events or circumstances occurring after the date of this press release.