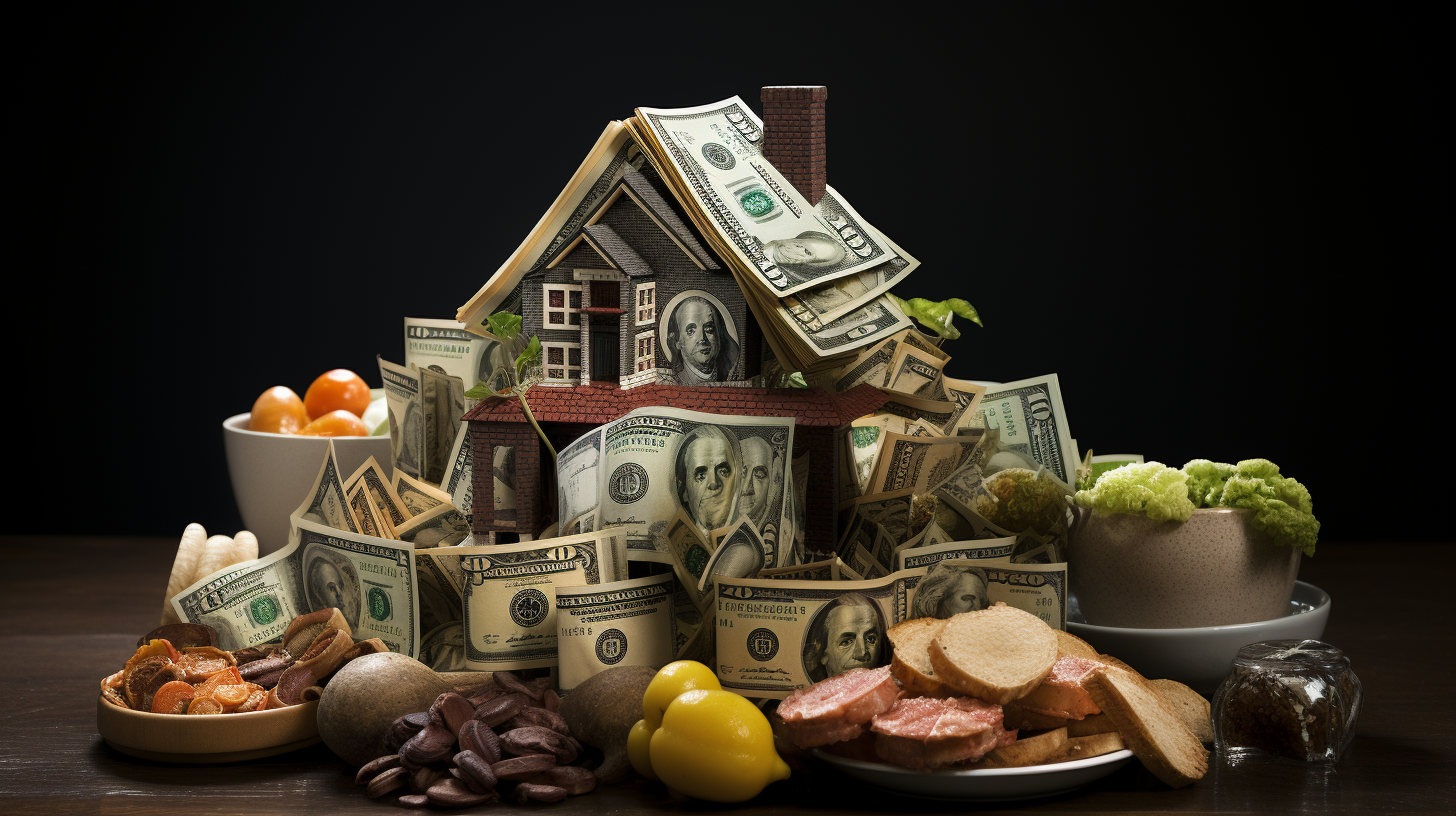
Consumer Prices Rise at Faster Pace in August

The Consumer Price Index (CPI) increased 0.6% in August on a seasonally adjusted basis, quickening from the 0.2% rise seen in July, according to the Bureau of Labor Statistics’ latest report. Over the past 12 months through August, headline CPI inflation stands at 3.7% before seasonal adjustment, up from 3.2% for the 12-month period ending in July.

The August monthly gain was primarily driven by a spike of 10.6% in the gasoline index. Gasoline was coming off a tamer 0.2% increase in July. Food prices also contributed to inflationary pressures, with the food at home index edging up 0.2% again last month. The food away from home index rose 0.3%.

Meanwhile, the energy index excluding gasoline picked up as well. Natural gas costs ticked up 0.1%, electricity prices rose 0.2%, and fuel oil prices surged 9.1%.

The core CPI, which removes volatile food and energy categories, rose 0.3% in August after a 0.2% gain in July. The shelter index has been a main driver of core inflation. It covers rental costs and owners’ equivalent rent, both of which have rapidly increased due to imbalances between housing supply and demand.

On an annual basis, the energy index has fallen 3.6%, as gasoline, natural gas and fuel oil costs are down over the past 12 months. However, the food and core indexes are up 4.3% and 4.3% year-over-year, respectively.

Within the core CPI, the main drivers have been shelter costs, up 7.3% over the last 12 months, along with auto insurance (+19.1%), recreation services (+3.5%), personal care (+5.8%) and new vehicles (+2.9%). Medical care services inflation has also accelerated to 6.6% over the past year.

Geographically, inflation varies significantly by region. The Northeast has seen 4.2% CPI inflation over the past year, the Midwest 3.9%, the South 3.7%, and the West just 2.9%. By city size, larger metropolitan areas over 1.5 million people have experienced 3.8% inflation, compared to 3.6% for mid-sized cities and 3.7% in smaller cities.

August’s monthly data shows inflation quickened after signs of cooling in July. While gasoline futures retreated in September, shelter inflation remains stubbornly high with no meaningful relief expected until mortgage rates decline substantially.

With core inflation running well above the Fed’s 2% target, further interest rate hikes are anticipated to combat still-high inflation. But the path to a soft economic landing appears increasingly narrow amid recession risks.

The next CPI update will be released in mid-October, shedding light on whether persistent pricing pressures are continuing to squeeze household budgets. For now, the August report shows inflation picking up steam after the prior month’s encouraging data.

Looking Ahead

Consumers may get temporary relief in the near term at the gas pump, as oil and gasoline futures prices pulled back in September following OPEC’s modest production cut.

Yet the larger concern remains the entrenched inflation in essentials like food, rent and medical care. Shelter inflation in particular has shown little sign of abating, as rental rates and housing prices remain disconnected from incomes.

Mortgage rates have soared above 6% in 2023 after starting the year around 3%. The sharp rise in financing costs continues to shut many homebuyers out of the market. Until mortgage rates meaningfully decline, shelter inflation is likely to persist.

And that will be challenging as long as the Fed keeps interest rates elevated. Monetary policy has lagged in responding to inflation, putting central bankers in catch-up mode. Further rate hikes are expected in the coming months absent a significant cooling in pricing pressures.

But the risks of the Fed overtightening and spurring a recession continue to intensify. The path to a soft landing for the economy is looking increasingly precarious.

For consumers, it means further inflationary pain is likely in store before a sustained moderation emerges. Budgets will remain pressured by pricier essentials, leaving less room for discretionary purchases.

While the monthly data will remain volatile, the overall trend points to stubborn inflation persisting through year-end. The Fed will be closely watching to see if their actions to date have slowed price gains enough. If not, consumers should prepare for more rate hikes and resulting economic uncertainty into 2024.

Release – Caramel Churro Crunch Ice Cream and Shake Arrive on Marble Slab Creamery Menu

Research News and Market Data on FAT

SEPTEMBER 12, 2023

Fall Flavors Get a Sweet Spin at Original Frozen Slab Concept

LOS ANGELES, Sept. 12, 2023 (GLOBE NEWSWIRE) — Marble Slab Creamery, the imaginative small-batch ice cream franchise that never fails to dream up the ultimate flavor combinations, announces its brand-new flavor offering – Caramel Churro Crunch. Available as an Ice Cream or a Shake, the autumn-inspired flavor is sure to take guests’ tastebuds straight to sweater weather.

Caramel Churro Crunch Ice Cream is made using Marble Slab Creamery’s original frozen slab technique. It starts with creamy Sweet Cream Ice Cream and is then swirled with caramel sauce and mini crunchy churros. The Marble Slab Creamery Caramel Churro Crunch Shake is a blend of Sweet Cream Ice Cream, mini crunchy churros, and a swirl of caramel sauce, all topped with whipped cream and crushed mini churros. The tasty but limited-time treat is available starting today and runs through Oct. 31.

For 40 years, Marble Slab Creamery has been an innovator in the ice cream space, creating the frozen slab technique and offering homemade, small-batch Ice Cream with always free Mix-Ins, Shakes in a variety of flavors, and Ice Cream Cakes. The leading chain boasts over 375 locations and continues to expand across the globe, most notably with its cookie sister brand, Great American Cookies, providing guests with the ultimate destination for sweet treats.

“Churro continues to be a trending flavor profile we couldn’t help but lean into for fall,” said Katie Thoms, Senior Director of Marketing at FAT Brands’ Quick Service Division. “We’re proud of this decadent flavor combination we’ve created and know our fans will love to cozy up with a cup, cone or shake.”

For more information on Marble Slab Creamery, visit www.marbleslab.com.

About FAT (Fresh. Authentic. Tasty.) Brands
FAT Brands (NASDAQ: FAT) is a leading global franchising company that strategically acquires, markets and develops fast casual, casual and polished casual dining restaurant concepts around the world. The Company currently owns 17 restaurant brands: Round Table Pizza, Fatburger, Marble Slab Creamery, Johnny Rockets, Fazoli’s, Twin Peaks, Great American Cookies, Hot Dog on a Stick, Buffalo’s Cafe & Express, Hurricane Grill & Wings, Native Grill & Wings, Pretzelmaker, Elevation Burger, Yalla Mediterranean and Ponderosa and Bonanza Steakhouses, and franchises and owns over 2,300 units worldwide. For more information on FAT Brands, please visit http://www.fatbrands.com.

About Marble Slab Creamery
Since dreaming up the frozen slab technique and serving fresh homemade, small-batch Ice Cream in-store since 1983, Marble Slab Creamery has always known how to dream big. We sprinkle our customers with imagination and promise to inspire with infinite Ice Cream possibilities to feed your curiosity and capture cravings. With our always-free mix-in philosophy, delicious Ice Cream and Shakes in a variety of flavors, hand-rolled waffle cones, and Ice Cream Cakes, imagination has no limits. Today, Marble Slab Creamery is enjoyed by consumers across the globe with locations in Bahrain, Canada, Kuwait, Saudi Arabia, Guam, Puerto Rico, and the United States. For more information, visit www.marbleslab.com.

MEDIA C ONTACT :
Ali Lloyd, FAT Brands
alloyd@fatbrands.com
435-760-6168

Source: FAT Brands Inc.

Release – Office Depot Launches New Podcast Series to Empower Small Business Owners

Research News and Market Data on ODP

The “Imagine Success” Podcast Will Help Listeners Gain Insights and Inspiration from Conversations with Industry Leaders and Small Business Owners

BOCA RATON, Fla.–(BUSINESS WIRE)–Sep. 12, 2023– Office Depot, a leading omnichannel retailer dedicated to helping its small business, home office, and education clients live more productive and organized lives through innovative products and services, today announced the launch of a new podcast series called “Imagine Success,” available now at officedepot.com/podcast and on major podcast platforms including Spotify and Apple Podcasts. The series will include thought-provoking conversations to inspire entrepreneurs and help guide them through the various stages of a business’s life cycle, from taking the leap to building a brand to identifying sources of funding, scaling for growth, conquering challenges and more.

Hosted by Kevin Moffitt, executive vice president of The ODP Corporation and president of Office Depot, the podcast series features real-world strategies and stories from industry leaders and small business owners alike. Through these stories, guests will educate and inspire others to achieve their own version of success.

“At Office Depot, we’re always striving to find new, innovative ways to enable success for small business owners,” said Moffitt. “We hope listeners of the podcast will find practical insights, valuable takeaways and actionable tips from each episode that will empower them to pursue their passions and achieve their business goals.”

As the proud son of small business owners who’ve opened four different businesses since the mid-1970s, Moffitt kicks off the podcast’s debut episode in conversation with his parents, Bertha and Victor Moffitt. The first episode of the Imagine Success podcast explores putting a business idea into motion and also features interviews with Brit Morin and Justine Pon. Morin is a venture capitalist, serial entrepreneur and founder and CEO of Brit + Co, a modern lifestyle and education company, plus Selfmade, an educational platform that Office Depot has been a proud sponsor of since 2020, that helps female founders start and grow their own businesses. Pon is the founder of The Ponnery, an arts and crafts product company that celebrates Asian American food and culture.

Visit officedepot.com/podcast to listen to the podcast and discover innovative products and helpful services designed to support small business owners.

About Office Depot

Office Depot, LLC, an operating company of The ODP Corporation, is a leading specialty retailer providing innovative products and services delivered through a fully integrated omnichannel platform of Office Depot and OfficeMax retail stores and an award-winning online presence, OfficeDepot.com, to support the productivity and organization of its small business, home office and education clients. Office Depot is committed to enabling its clients’ success, strengthening local communities and providing equal opportunities for all. For more information, visit officedepot.com, download the Office Depot app on your iPhone or Android and follow @officedepot on Facebook, Twitter, Instagram and TikTok.

Office Depot is a trademark of The Office Club, LLC. OfficeMax is a trademark of OMX, Inc. ODP and ODP Business Solutions are trademarks of ODP Business Solutions, LLC. Veyer is a trademark of Veyer, LLC. Varis is a trademark of Varis, Inc. Any other product or company names mentioned herein are the trademarks of their respective owners.

Shera Bishop
Media Relations for Office Depot
Shera.Bishop@officedepot.com

Source: Office Depot, LLC

Apple Goes Green: Tech Giant Unveils First Carbon Neutral Lineup

Apple just recently announced its first carbon neutral products – the new Apple Watch lineup. This achievement comes from innovations across Apple’s global supply chain over years to dramatically reduce emissions. It’s a major milestone toward Apple’s 2030 goal to make all products carbon neutral.

To become carbon neutral, Apple steeply cut watch emissions first via clean energy, recycled materials, and low-emission transportation. Any remaining emissions are addressed with high-quality carbon credits from nature-based projects like forests.

This shift demonstrates how companies can decarbonize operations and products through renewable electricity, material innovation, and carbon removal. If adopted widely, these strategies can significantly benefit the environment.

Apple’s progress was enabled by large investments in wind and solar energy. Their actions helped create over 15 gigawatts of new clean power. Scaling renewable energy is crucial for the transition away from fossil fuels.

Take a moment to look at more natural resources and mining companies by viewing Mark Reichman’s coverage list.

The company also pioneered using recycled metals and fibers in devices. This reduces the need for carbon-intensive mining and materials manufacturing. Broad adoption would lessen impacts on natural resources.

Additionally, Apple funded carbon removal through forest restoration. This supports nature-based solutions to sequester CO2. The climate impact could grow exponentially if more firms financed conservation projects.

In summary, Apple’s carbon neutral product milestone highlights the environmental promise of renewable energy, the circular economy, and carbon removal. It demonstrates the potential for these strategies to transform manufacturing, conserve natural resources, and fight climate change.

J.M. Smucker To Acquire Hostess Brands for $5.6 Billion

Consumer foods giant J.M. Smucker has agreed to purchase bakery company Hostess Brands for $5.6 billion in a major food industry acquisition. The deal will expand Smucker’s snacks and sweets portfolio with the addition of iconic Hostess brands such as Twinkies, Ding Dongs, and Donettes.

Under the terms of the acquisition, Smucker will pay $34.25 per share for Hostess in a cash and stock deal. This represents a premium of about 20% over Hostess’ closing share price on Friday. Smucker will also take on approximately $900 million of Hostess’ debt.

For Smucker, the deal provides an avenue for growth as demand for its key categories like jam and peanut butter has slowed. Twinkies and other Hostess snacks can tap into rising consumer appetites for nostalgic comfort foods. The acquisition also boosts Smucker’s presence in the in-store bakery section and convenience stores.

Meanwhile, Hostess Brands has faced slipping sales volumes after raising prices to offset inflationary pressures. As growth stalled, larger rivals circled with takeover interest to tap into the strong consumer awareness of brands like Twinkies. Hostess ultimately opted for Smucker’s buyout offer.

The transaction comes amid a wave of deal-making in the food industry, as companies look to acquisitions for expansion. With the Hostess deal, Smucker follows in the footsteps of rivals like Campbell Soup, Mars, and Unilever which have all acquired brands in recent months to spur growth.

The Hostess acquisition is expected to close in January 2024 after customary approvals. It will add an estimated $1.4 billion in Hostess net sales to Smucker’s portfolio upon completion.

Take a look at Fat Brands Inc., a leading global franchising company that acquires, markets and develops fast casual and casual dining restaurant concepts around the world.

Instacart Aims for $9.3 Billion Valuation in Upcoming IPO

Online grocery delivery firm Instacart is gearing up to go public and has set the terms for its initial public offering (IPO). In a regulatory filing on Monday, Instacart outlined plans to raise around $616 million through the offering of 22 million shares priced between $26 and $28 each.

The IPO would give Instacart a fully diluted valuation of up to $9.3 billion. This is below earlier estimates of a $40 billion valuation, indicating moderating growth expectations. Nonetheless, the offering could still mark one of the largest public listings this year amid a freeze on IPOs over the past year due to market volatility.

Founded in 2012, San Francisco-based Instacart has established itself as a leading online grocery platform in the U.S. It partners with grocers and retailers to deliver items to customers’ doors in as little as an hour. Instacart competes in a crowded space against entrenched firms like Walmart and Amazon as well as delivery apps like DoorDash and GoPuff.

Take a moment to look at 1-800 Flowers.com, a leading e-commerce business platform that delivers gifts designed to help inspire customers to give more, connect more, and build more relationships.

Instacart plans to sell 14.1 million newly issued shares in the IPO, with the remainder offered by existing shareholders. Multiple prominent investors have committed to buying shares in the offering, including PepsiCo, which is investing $175 million, and Norges Bank Investment Management, Norway’s sovereign wealth fund.

Proceeds from the IPO will provide funding for Instacart to invest in areas like technology, fulfillment, and advertising as it aims to turn a profit. The company posted revenues of $1.8 billion in 2020 but has yet to become profitable.

The upcoming listing will test investor appetite for high-growth tech IPOs after a yearlong freeze. Instacart’s debut performance will depend on prevailing market sentiment closer to its trading date. But a successful IPO could boost Instacart’s brand and validate its status as a leading next-generation grocery platform.

Release – Fazoli’s Makes Highly Anticipated Return to Orlando

Research News and Market Data on FAT

SEPTEMBER 07, 2023

 DOWNLOAD PDFPDF FORMAT (OPENS IN NEW WINDOW)

Fans Celebrate Arrival of Favorite Fast Casual Italian

LOS ANGELES, Sept. 07, 2023 (GLOBE NEWSWIRE) — Fazoli’s, America’s favorite fast and fresh Italian chain, is officially open in Orlando. Located at 4201 E. Colonial Dr., the location is owned by local operator Keys Restaurants Inc., and is now serving up its beloved hot and buttery breadsticks and signature Italian dishes including pastasubs, salads, pizzas and more. 

“We couldn’t be happier to reintroduce our mouthwatering, freshly made food back into the Orlando market,” said Doug Bostick, President at Fazoli’s. “We’ve been humbled by the nonstop excitement from fans and have spent countless hours preparing for the large crowds we expect at our drive-thru and can confidently say, we are ready!” 

“We are excited to have fulfilled our promise to return Fazoli’s to Orlando,” said Keys Restaurants Inc. CEO Rodney Keys. “We have a long history of excellence building franchises and local businesses in the Orlando area and are more committed than ever to our customers. When they walk into a Keys Restaurant Inc. location, they know they can expect nothing but the best.” 

The Orlando Fazoli’s is located at 4201 E. Colonial Dr., Orlando, FL. 32803. The drive-thru and dine-in is open 10:30 a.m. to 10 p.m., Sunday-Thursday, and 10:30 a.m. to 11 p.m. Friday-Saturday. For more information, visit Fazolis.com

About FAT (Fresh. Authentic. Tasty.) Brands

FAT Brands (NASDAQ: FAT) is a leading global franchising company that strategically acquires, markets, and develops fast casual, quick-service, casual dining, and polished casual dining concepts around the world. The Company currently owns 17 restaurant brands: Round Table Pizza, Fatburger, Marble Slab Creamery, Johnny Rockets, Fazoli’s, Twin Peaks, Great American Cookies, Hot Dog on a Stick, Buffalo’s Cafe & Express, Hurricane Grill & Wings, Pretzelmaker, Elevation Burger, Native Grill & Wings, Yalla Mediterranean and Ponderosa and Bonanza Steakhouses, and franchises and owns over 2,300 units worldwide. For more information on FAT Brands, please visit fatbrands.com

About Fazoli’s

Fast. Fresh. Italian. Founded in 1988 in Lexington, Ky., Fazoli’s owns and operates nearly 220 restaurants in 27 states, making it the largest QSR Italian chain in America. Fazoli’s prides itself on serving quality Italian food, fast, fresh and friendly. Menu offerings include freshly prepared pasta entrees, sub sandwiches, salads, pizza and desserts – along with its unlimited signature breadsticks. For more information, visit www.Fazolis.com.

MEDIA CONTACT:
Ali Lloyd, FAT Brands
alloyd@fatbrands.com
435-760-6168 

# # # 

Source: FAT Brands Inc.

Bassett Furniture (BSET) – A Disappointing Fiscal Third Quarter, Downgrading to Market Perform


Thursday, September 07, 2023

Bassett Furniture Industries, Incorporated manufactures, markets, and retails home furnishings in the United States. The company operates in three segments: Wholesale, Retail, and Logistical Services. It is involved in the design, manufacture, sourcing, sale, and distribution of furniture products to a network of company-owned and licensee-owned Bassett Home Furnishings (BHF) retail stores, as well as independent furniture retailers; and wood and upholstery operations. As of September 16, 2017, the company operated a network of 91 company-and licensee-owned stores. It also provides shipping, delivery, and warehousing services to customers in the furniture industry. In addition, the company owns and leases retail store properties. It also distributes its products through other multi-line furniture stores, Bassett galleries or design centers, specialty stores, and mass merchants. Bassett Furniture Industries was founded in 1902 and is based in Bassett, Virginia.

Joe Gomes, Managing Director, Equity Research Analyst, Generalist , Noble Capital Markets, Inc.

Joshua Zoepfel, Research Associate, Noble Capital Markets, Inc.

Refer to the full report for the price target, fundamental analysis, and rating.

Preliminary Results. Basset released preliminary results for the fiscal third quarter ended August 26th that are well below our and consensus estimates. A 27% drop in wholesale shipments in the quarter combined with several unusual events related to store closures and ongoing discounting of the Club Level line negatively impacted the quarter.

Details. Net sales are expected to be approximately $87 million, a 26% drop y-o-y and well below our $101 million estimate and the consensus $98.9 million estimate. The low estimate for the quarter was $97 million. The Company is projecting an operating and net loss for the quarter. We had projected net income of $1.5 million and the consensus estimate called for net income of $2.2 million.


Get the Full Report

Equity Research is available at no cost to Registered users of Channelchek. Not a Member? Click ‘Join’ to join the Channelchek Community. There is no cost to register, and we never collect credit card information.

This Company Sponsored Research is provided by Noble Capital Markets, Inc., a FINRA and S.E.C. registered broker-dealer (B/D).

*Analyst certification and important disclosures included in the full report. NOTE: investment decisions should not be based upon the content of this research summary. Proper due diligence is required before making any investment decision. 

Release – Fazoli’s Brings Back Fan Favorite Pizza Baked Pasta!

Research News and Market Data on FAT

SEPTEMBER 05, 2023

Limited Time Menu Reintroduces Italian Chain’s Most Popular Mashup

LOS ANGELES, Sept. 05, 2023 (GLOBE NEWSWIRE) — Fazoli’s, America’s favorite fast and fresh Italian chain, today announces the return of the beloved Pizza Baked Pasta to its menu for a limited time. Beginning Sept. 5, the classic dish will be available to order in three irresistible variations: Pizza Baked Pasta, Meaty Pizza Baked Pasta and Supreme Pizza Baked Pasta. Also included in the limited-time offering is Pumpkin Cheesecake made by The Cheesecake Factory Bakery®, a welcome addition to the dessert menu just in time for fall.

The classic Pizza Baked Pasta is back better than before, this time featuring a penne pasta smothered in the chain’s signature zesty Pizza Bake Sauce, loaded with mozzarella and pepperoni, and then baked to sizzling perfection. Guests can elevate the dish by opting for the Meaty Pizza Baked Pasta, which includes the classic ingredients plus Italian sausage and bacon, or the brand-new Supreme Pizza Baked Pasta, made with the classic ingredients, Italian sausage, bacon, red and green peppers, onions, and mushrooms. All three renditions of the dish are available through the end of the year – giving customers plenty of time to try all three at restaurants systemwide!

“At Fazoli’s, we’re dedicated to crafting innovative Italian dishes,” said Tisha Bartlett, Vice President of Marketing at Fazoli’s. “The return of our Pizza Baked Pastas is a celebration of that commitment, and we’re eager for our devoted fans to once again enjoy a quintessential Fazoli’s classic.”

As part of the limited-time menu, guests will also get a taste of fall with Pumpkin Cheesecake made by The Cheesecake Factory Bakery® available through Oct. 30. Made with a secret blend of spices, garnished with a rosette of whipped cream, and drizzled with Ghirardelli Salted Caramel Sauce, The Cheesecake Factory’s legendary Pumpkin Cheesecake is a delightful sweet and spiced treat that will have each forkful tasting like sweater weather.

Founded in 1988, Fazoli’s prides itself in serving quality Italian pastas, sub sandwiches, salads, pizza, and dessert. For more information on Fazoli’s, visit Fazolis.com.

About FAT (Fresh. Authentic. Tasty.) Brands
FAT Brands (NASDAQ: FAT) is a leading global franchising company that strategically acquires, markets, and develops fast casual, quick-service, casual dining, and polished casual dining concepts around the world. The Company currently owns 17 restaurant brands: Round Table Pizza, Fatburger, Marble Slab Creamery, Johnny Rockets, Fazoli’s, Twin Peaks, Great American Cookies, Hot Dog on a Stick, Buffalo’s Cafe & Express, Hurricane Grill & Wings, Pretzelmaker, Elevation Burger, Native Grill & Wings, Yalla Mediterranean and Ponderosa and Bonanza Steakhouses, and franchises and owns over 2,300 units worldwide. For more information on FAT Brands, please visit www.fatbrands.com.

About Fazoli’s: Fast. Fresh. Italian.
Founded in 1988 in Lexington, Ky., Fazoli’s owns and operates nearly 220 restaurants in 27 states, making it the largest QSR Italian chain in America. Fazoli’s prides itself on serving quality Italian food, fast, fresh and friendly. Menu offerings include freshly prepared pasta entrees, Submarinos® sandwiches, salads, pizza and desserts – along with its unlimited signature breadsticks. Fazoli’s is a winner of FastCasual and Steritech’s 2020 Excellence in Food Safety Award and ranked number seven on FastCasual’s “Top 100 Movers and Shakers” list in 2022. Additionally, it was named to Technomic’s “Top 500 Chain Restaurant Report” in 2022, selected as one of the “Top 50 Global Fast Casual Innovators in 2021” by Foodable, a “Top 200 Franchises in 2021” by Franchise Business Review, and an Entrepreneur 2018 “Franchise 500.” Fazoli’s was a recipient of the 2021 American Business Awards Gold Stevie Awards in Food & Beverage for Company of the Year.

Media Contact:
Ali Lloyd
FAT Brands
alloyd@fatbrands.com

Source: FAT Brands Inc.

Fazoli’s Brings Back Fan Favorite Pizza Baked Pasta!

SEPTEMBER 05, 2023

 DOWNLOAD PDFPDF FORMAT (OPENS IN NEW WINDOW)

Limited Time Menu Reintroduces Italian Chain’s Most Popular Mashup

LOS ANGELES, Sept. 05, 2023 (GLOBE NEWSWIRE) — Fazoli’s, America’s favorite fast and fresh Italian chain, today announces the return of the beloved Pizza Baked Pasta to its menu for a limited time. Beginning Sept. 5, the classic dish will be available to order in three irresistible variations: Pizza Baked Pasta, Meaty Pizza Baked Pasta and Supreme Pizza Baked Pasta. Also included in the limited-time offering is Pumpkin Cheesecake made by The Cheesecake Factory Bakery®, a welcome addition to the dessert menu just in time for fall.

The classic Pizza Baked Pasta is back better than before, this time featuring a penne pasta smothered in the chain’s signature zesty Pizza Bake Sauce, loaded with mozzarella and pepperoni, and then baked to sizzling perfection. Guests can elevate the dish by opting for the Meaty Pizza Baked Pasta, which includes the classic ingredients plus Italian sausage and bacon, or the brand-new Supreme Pizza Baked Pasta, made with the classic ingredients, Italian sausage, bacon, red and green peppers, onions, and mushrooms. All three renditions of the dish are available through the end of the year – giving customers plenty of time to try all three at restaurants systemwide!

“At Fazoli’s, we’re dedicated to crafting innovative Italian dishes,” said Tisha Bartlett, Vice President of Marketing at Fazoli’s. “The return of our Pizza Baked Pastas is a celebration of that commitment, and we’re eager for our devoted fans to once again enjoy a quintessential Fazoli’s classic.”

As part of the limited-time menu, guests will also get a taste of fall with Pumpkin Cheesecake made by The Cheesecake Factory Bakery® available through Oct. 30. Made with a secret blend of spices, garnished with a rosette of whipped cream, and drizzled with Ghirardelli Salted Caramel Sauce, The Cheesecake Factory’s legendary Pumpkin Cheesecake is a delightful sweet and spiced treat that will have each forkful tasting like sweater weather.

Founded in 1988, Fazoli’s prides itself in serving quality Italian pastas, sub sandwiches, salads, pizza, and dessert. For more information on Fazoli’s, visit Fazolis.com.

About FAT (Fresh. Authentic. Tasty.) Brands
FAT Brands (NASDAQ: FAT) is a leading global franchising company that strategically acquires, markets, and develops fast casual, quick-service, casual dining, and polished casual dining concepts around the world. The Company currently owns 17 restaurant brands: Round Table Pizza, Fatburger, Marble Slab Creamery, Johnny Rockets, Fazoli’s, Twin Peaks, Great American Cookies, Hot Dog on a Stick, Buffalo’s Cafe & Express, Hurricane Grill & Wings, Pretzelmaker, Elevation Burger, Native Grill & Wings, Yalla Mediterranean and Ponderosa and Bonanza Steakhouses, and franchises and owns over 2,300 units worldwide. For more information on FAT Brands, please visit www.fatbrands.com.

About Fazoli’s: Fast. Fresh. Italian.
Founded in 1988 in Lexington, Ky., Fazoli’s owns and operates nearly 220 restaurants in 27 states, making it the largest QSR Italian chain in America. Fazoli’s prides itself on serving quality Italian food, fast, fresh and friendly. Menu offerings include freshly prepared pasta entrees, Submarinos® sandwiches, salads, pizza and desserts – along with its unlimited signature breadsticks. Fazoli’s is a winner of FastCasual and Steritech’s 2020 Excellence in Food Safety Award and ranked number seven on FastCasual’s “Top 100 Movers and Shakers” list in 2022. Additionally, it was named to Technomic’s “Top 500 Chain Restaurant Report” in 2022, selected as one of the “Top 50 Global Fast Casual Innovators in 2021” by Foodable, a “Top 200 Franchises in 2021” by Franchise Business Review, and an Entrepreneur 2018 “Franchise 500.” Fazoli’s was a recipient of the 2021 American Business Awards Gold Stevie Awards in Food & Beverage for Company of the Year.

Media Contact:
Ali Lloyd
FAT Brands
alloyd@fatbrands.com

Source: FAT Brands Inc.

1·800·Flowers.com, Inc. (FLWS) – Gross Margins Surprise On The Upside


Friday, September 01, 2023

For more than 45 years, 1-800-Flowers.com has offered truly original floral arrangements, plants and unique gifts to celebrate birthdays, anniversaries, everyday occasions, and seasonal holidays, and to deliver comfort during times of grief. Backed by a caring team obsessed with service, 1-800-Flowers.com provides customers thoughtful ways to express themselves and connect with the most important people in their lives. 1-800-Flowers.com is part of the 1-800-FLOWERS.COM, Inc. family of brands. Shares in 1-800-FLOWERS.COM, Inc. are traded on the NASDAQ Global Select Market, ticker symbol: FLWS.

Michael Kupinski, Director of Research, Equity Research Analyst, Digital, Media & Technology , Noble Capital Markets, Inc.

Jacob Mutchler, Research Associate, Noble Capital Markets, Inc.

Refer to the full report for the price target, fundamental analysis, and rating.

Exceeds EBITDA estimate. The company’s fiscal Q4 results were mixed with a “miss” in revenues, but nicely beating our adj. EBITDA estimate. Revenues declined 17.9% to $398.8 million, versus our estimate of $414.2 million. Gross margins substantially improved leading to a beat in adj. EBITDA of a seasonal loss of $6.6 million versus our loss estimate of $10.1 million. 

Favorable margin outlook. We believe that a combination of lower ocean freight costs, moderating commodity prices, lower inventory write-offs, and a shift toward higher priced, higher margin products, all should allow the company to move gross margins from 37.5% in 2023 to 39.3% in fiscal 2024 and then to 39.6% in 2025. Our gross margin assumptions are conservatively below the pre-pandemic levels of 42.1% in 2019 and offer positive upside surprise potential. 


Get the Full Report

Equity Research is available at no cost to Registered users of Channelchek. Not a Member? Click ‘Join’ to join the Channelchek Community. There is no cost to register, and we never collect credit card information.

This Company Sponsored Research is provided by Noble Capital Markets, Inc., a FINRA and S.E.C. registered broker-dealer (B/D).

*Analyst certification and important disclosures included in the full report. NOTE: investment decisions should not be based upon the content of this research summary. Proper due diligence is required before making any investment decision. 

Release – Great American Cookies and Marble Slab Creamery Open Debut Location in the Pacific Northwest

Research News and Market Data on FAT

AUGUST 31, 2023

 DOWNLOAD PDFPDF FORMAT (OPENS IN NEW WINDOW)

Iconic D essert Duo Bring Cookie and Ice Cream Concept to Happy Valley

LOS ANGELES, Aug. 31, 2023 (GLOBE NEWSWIRE) — FAT (Fresh. Authentic. Tasty.) Brands Inc., parent company of Great American Cookies, Marble Slab Creamery and 15 other restaurant concepts, announces the opening of a co-branded Great American Cookies and Marble Slab Creamery location in Happy Valley, Oregon. Situated in Clackamas County, the new store marks the first Pacific Northwest location for both brands.

“We are thrilled to introduce our co-branded Great American Cookies and Marble Slab Creamery concept to the Pacific Northwest for the first time,” said Allison Lauenstein, President of the QSR Division at FAT Brands, Inc. “Both brands are known worldwide for crafting mouthwatering freshly made sweets, including Cookie Cakes, Cookies and Ice Cream that bring joy to our customers. With this opening marking the first in the region, we’re excited to create an unparalleled dessert experience that will resonate with the Happy Valley community and residents in the greater Portland area.”

For nearly 40 years, Marble Slab Creamery has been an innovator in the ice cream space, dreaming up the frozen slab technique and offering homemade, small-batch ice cream with free unlimited mix-ins, shakes in a variety of flavors, and ice cream cakes.

Since 1977, Great American Cookies has baked up a reputation for not only being the creator of the Original Cookie Cake, but also for its famous chocolate chip cookie recipe. Other craveable menu items include brownies and Double Doozies, made with delectable icing sandwiched between two cookies.

The co-branded Great American Cookies and Marble Slab Creamery is located at 13200 SE 172nd Ave., Suite 148, Happy Valley, Ore., 97086, and is open Monday through Sunday from 10:00 a.m. to 8:00 p.m. For more information on Great American Cookies, visit www.greatamericancookies.com. For more information on Marble Slab Creamery, visit www.marbleslab.com.

About FAT (Fresh. Authentic. Tasty.) Brands

FAT Brands (NASDAQ: FAT) is a leading global franchising company that strategically acquires, markets, and develops fast casual, quick-service, casual dining, and polished casual dining concepts around the world. The Company currently owns 17 restaurant brands: Round Table Pizza, Fatburger, Marble Slab Creamery, Johnny Rockets, Fazoli’s, Twin Peaks, Great American Cookies, Hot Dog on a Stick, Buffalo’s Cafe & Express, Hurricane Grill & Wings, Pretzelmaker, Elevation Burger, Native Grill & Wings, Yalla Mediterranean and Ponderosa and Bonanza Steakhouses, and franchises and owns over 2,300 units worldwide. For more information on FAT Brands, please visit www.fatbrands.com.

About Great American Cookies

Founded on a family chocolate chip cookie recipe in 1977, Great American Cookies believes that pure, simple delight is part of living a full life. Serving the Original Cookie Cake, fresh baked cookies in a variety of flavors, brownies, and Double Doozies, we promise to treat you to bites of bliss that prove how sweet life can be. With more than 400 bakeries across the country and internationally in Bahrain, Guam, Saudi Arabia, and treats available to ship right to your door, the sweet spot is always close to home. For more information, visit www.greatamericancookies.com.

About Marble Slab Creamery

Since dreaming up the frozen slab technique and serving fresh homemade, small-batch Ice Cream in-store since 1983, Marble Slab Creamery has always known how to dream big. We sprinkle our customers with imagination and promise to inspire with infinite Ice Cream possibilities to feed your curiosity and capture cravings. With our always free mix-in philosophy, delicious Ice Cream and Shakes in a variety of flavors, hand-rolled waffle cones, and Ice Cream Cakes, imagination has no limits. Today, Marble Slab Creamery is enjoyed by consumers across the globe with locations in Bahrain, Canada, Kuwait, Saudi Arabia, Guam, Puerto Rico, and the United States. For more information, visit www.marbleslab.com.

MEDIA CONTACT:
Ali Lloyd, FAT Brands
alloyd@fatbrands.com
435-760-6168

Source: FAT Brands Inc.

Release – 1-800-FLOWERS.COM, Inc. Reports Fiscal 2023 Fourth Quarter and Year-End Results

Research News and Market Data on FLWS

Aug 31, 2023

Reports Fiscal Year 2023 Revenue of $2.0 Billion and a Net Loss of $44.7 Million, which Net Loss Includes an After-Tax, Non-Cash Charge of $57.8 Million Associated with the Third Quarter Goodwill and Intangible Asset Impairment Charge

Fiscal Year 2023 Adjusted Net Income1 was $13.4 million, or $0.21 Per Share, Compared with Adjusted Net Income1 of $32.9 Million, or $0.50 Per Diluted Share, in the Prior Year Period

Generates Adjusted EBITDA1 of $91.2 Million During Fiscal Year 2023, as the Fourth Quarter Adjusted EBITDA Loss1 Improves by $10.2 Million to $6.6 Million

Reports Fiscal Year 2023 Free Cash Flow1 of $70.7 Million

Issues Fiscal Year 2024 Outlook

(1) Refer to “Definitions of Non-GAAP Financial Measures” and the tables attached at the end of this press release for reconciliation of non-GAAP results to applicable GAAP results.)

JERICHO, N.Y.–(BUSINESS WIRE)– 1-800-FLOWERS.COM, Inc. (NASDAQ: FLWS), a leading provider of gifts designed to help inspire customers to give more, connect more, and build more and better relationships, today reported results for its fiscal 2023 fourth quarter and full year ended July 2, 2023.

Fiscal 2023 Fourth Quarter Highlights

  • Total consolidated revenues decreased 17.9% to $398.8 million, compared with total consolidated revenues of $485.9 million in the prior year period, which included a 53rd week. Excluding the impact of the 53rd week in the prior year period, revenues declined 14.8%.

  • Gross profit margin increased 340 basis points to 37.1%, compared with 33.7% in the prior year period. This continues the trend of improving gross margin since the fiscal first quarter led by improvements across the Company’s three business segments, which benefited from lower ocean freight costs, the Company’s strategic pricing initiatives, and a decline in certain commodity costs.

  • Operating expenses declined $18.7 million, or 9.8%, from $190.7 million in the prior year period to $172.0 million. On a percentage basis, operating expenses increased to 43.1% of sales, compared with 39.3% in the prior year period, primarily due to sales deleverage and the performance of our non-qualified deferred compensation plan, which was partially mitigated by marketing efficiencies.

  • Net loss for the quarter was $22.5 million, or ($0.35) per share, compared with a net loss of $22.3 million, or ($0.34) per share, in the prior year period. Net loss and net loss per share in the current year period were impacted by the tax treatment of the impairment charge recorded during the fiscal third quarter. Adjusted net loss1 was $17.8 million, or ($0.28) per share, compared with an adjusted net loss1 of $21.8 million, or ($0.34) per share, in the prior year period.

  • Adjusted EBITDA1 for the quarter was a loss of $6.6 million, improving $10.2 million, as compared with an adjusted EBITDA1 loss of $16.8 million in the prior year period.

Fiscal Year 2023 Highlights

  • Total consolidated revenues decreased 8.6% to $2.02 billion, compared with total consolidated revenues of $2.21 billion in the prior year period, which included a 53rd week. Excluding the impact of the 53rd week in the prior year period, revenues declined 7.9%.

  • Gross profit margin increased 30 basis points to 37.5%, compared with 37.2% in the prior year period. After declining 720 basis points during the fiscal first quarter on significantly increased costs for labor, shipping, and commodities, gross profit margin increased 90 basis points during the second quarter, 80 basis points during the third quarter, and 340 basis points during the fourth quarter, as compared with the prior year periods, benefiting from lower ocean freight costs combined with the Company’s strategic pricing initiatives.

  • Operating expenses increased $12.9 million from the prior year period, including a $64.6 million non-cash goodwill and intangible assets impairment charge that was recorded during the fiscal third quarter. Excluding the impact of this charge, operating expenses declined $51.7 million or 6.6%, compared with the prior year period. Operating expenses as percent of sales, excluding the third quarter impairment charge noted above, increased 80 basis points to 36.1%, compared with 35.3% in the prior year period, primarily due to sales deleverage, which was partially mitigated by marketing efficiencies.

  • Net loss for the fiscal year was $44.7 million, or ($0.69) per share, which includes an after-tax non-cash goodwill and intangible assets impairment charge of $57.8 million, or ($0.89) per share, compared with net income of $29.6 million, or $0.45 per diluted share, in the prior year period. Adjusted net income1 was $13.4 million, or $0.21 per share, compared with adjusted net income1 of $32.9 million, or $0.50 per diluted share, in the prior year period.

  • Adjusted EBITDA1 for the fiscal year was $91.2 million, as compared with $99.0 million in the prior year period, reflecting the significant improvement in adjusted EBITDA of $14.9 million in the second, third and fourth quarters, collectively, after the $22.7 million decline in the first quarter.

  • Generated Free Cash Flow1 of $70.7 million during fiscal 2023, an improvement of $131.9 million over the prior year.

Jim McCann, Chairman and Chief Executive Officer of 1-800-FLOWERS.COM, Inc., said “We successfully mitigated the impact of a softer sales environment during Fiscal 2023 through our expense optimization efforts coupled with the improvement in our gross margin. Simultaneously, we executed on our strategic initiatives to offer customers an expanding array of gift giving options across multiple price points, we invested in our technology platform to enhance the customer experience, and we expanded our product portfolio, both organically and through acquisitions, which positions us well as a premier gift giving destination once the broader consumer environment improves.”

McCann added, “As we look beyond the current horizon, we believe that the actions we have taken to enhance the customer experience, improve margins, and optimize expenses, combined with an improved consumer environment, will enable us to achieve our historical sales growth, gross profit margin and adjusted EBITDA margin rates.”

Segment Results
The Company provides Fiscal 2023 fourth quarter and full year selected financial results for its Gourmet Foods and Gift Baskets, Consumer Floral and Gifts, and BloomNet segments in the tables attached to this release and as follows:

  • Gourmet Foods and Gift Baskets: Revenues for the quarter were $120.7 million, declining 18.7% compared with $148.4 million in the prior year period. Gross profit margin was 28.1%, compared with 23.2% percent in the prior year period. Segment contribution margin1 loss was $13.4 million, compared with segment contribution margin1 loss of $23.7 million in the prior year period. This primarily reflects the gross margin improvement combined with more efficient marketing spend.

    For the full fiscal year, revenue in this segment decreased 3.9% to $965.2 million, compared with $1.0 billion in the prior year. Gross profit margin for the year was 34.9%, compared with 34.2% in the prior year. Segment contribution margin for the year, without the impairment charge, was $77.5 million, compared with $64.9 million in the prior year.

  • Consumer Floral & Gifts: Revenues for the quarter were $248.3 million, declining 17.0% compared with $299.0 million in the prior year period. Gross profit margin was 40.6%, compared with 38.0% percent in the prior year period. Segment contribution margin1 was $30.7 million, compared with segment contribution margin1 of $26.5 million in the prior year period. This primarily reflects gross profit margin improvement combined with marketing efficiencies that more than offset the revenue decline.

    For the full fiscal year, revenues decreased 13.1% to $920.5 million, compared with $1.06 billion in the prior year. Gross profit margin was 39.5%, compared with 39.3% in the prior year. Segment contribution margin1 was $95.5 million, compared with $104.3 million in the prior year.

  • BloomNet: Revenues for the quarter decreased 22.1% to $30.0 million, compared with $38.5 million in the prior year period. Gross profit margin was 42.6%, compared with 39.6% in the prior year period, primarily reflecting lower ocean freight costs as well as product mix. Segment contribution margin1 was $7.4 million, compared with $10.0 million in the prior year period.

    For the year, revenues decreased 8.6% to $133.2 million, compared with $145.7 million in the prior year. Gross profit margin was 42.7%, compared with 42.3% in the prior year. Segment contribution margin1 for the year was $37.2 million, compared with $42.5 million in the prior year.

Company Guidance
For fiscal 2024, the Company expects revenues to remain pressured by a challenging consumer environment early in the year, but then rebound during the holiday period and into the second half of the fiscal year. The Company also expects continued improvement in gross margin. Additionally, the guidance assumes increased compensation expense, including the restoration of 100 percent bonus payout, compared with a partial payout in fiscal 2023.

As a result, the Company expects Fiscal 2024:

  • total revenues on a percentage basis to decline in the mid-single digits, as compared with the prior year;
  • adjusted EBITDA1 to be in a range of $95 million to $100 million; and
  • Free Cash Flow1 to be in a range of $60 million to $65 million.

Conference Call
The Company will conduct a conference call to discuss the above details and attached financial results today, August 31, at 8:00 a.m. (ET). The conference call will be webcast from the Investors section of the Company’s website at www.1800flowersinc.com. A recording of the call will be posted on the Investors section of the Company’s website within two hours of the call’s completion. A telephonic replay of the call can be accessed beginning at 2:00 p.m. (ET) today through September 7, 2023, at: (US) 1-877-344-7529; (Canada) 855-669-9658; (International) 1-412-317-0088; enter conference ID #: 7782036.

Definitions of non-GAAP Financial Measures:
We sometimes use financial measures derived from consolidated financial information, but not presented in our financial statements prepared in accordance with U.S. generally accepted accounting principles (“GAAP”). Certain of these are considered “non-GAAP financial measures” under the U.S. Securities and Exchange Commission rules. Non-GAAP financial measures referred to in this document are either labeled as “non-GAAP” or designated as such with a “1”. See below for definitions and the reasons why we use these non-GAAP financial measures. Where applicable, see the Selected Financial Information below for reconciliations of these non-GAAP measures to their most directly comparable GAAP financial measures. Reconciliations for forward-looking figures would require unreasonable efforts at this time because of the uncertainty and variability of the nature and amount of certain components of various necessary GAAP components, including, for example, those related to compensation, tax items, amortization or others that may arise during the year, and the Company’s management believes such reconciliations would imply a degree of precision that would be confusing or misleading to investors. For the same reasons, the Company is unable to address the probable significance of the unavailable information. The lack of such reconciling information should be considered when assessing the impact of such disclosures.

EBITDA and Adjusted EBITDA:
We define EBITDA as net income (loss) before interest, taxes, depreciation, and amortization. Adjusted EBITDA is defined as EBITDA adjusted for the impact of stock-based compensation, Non-Qualified Plan Investment appreciation/depreciation, and for certain items affecting period-to-period comparability. See Selected Financial Information for details on how EBITDA and Adjusted EBITDA were calculated for each period presented. The Company presents EBITDA and Adjusted EBITDA because it considers such information meaningful supplemental measures of its performance and believes such information is frequently used by the investment community in the evaluation of similarly situated companies. The Company uses EBITDA and Adjusted EBITDA as factors to determine the total amount of incentive compensation available to be awarded to executive officers and other employees. The Company’s credit agreement uses EBITDA and Adjusted EBITDA to determine its interest rate and to measure compliance with certain covenants. EBITDA and Adjusted EBITDA are also used by the Company to evaluate and price potential acquisition candidates. EBITDA and Adjusted EBITDA have limitations as analytical tools and should not be considered in isolation or as a substitute for analysis of the Company’s results as reported under GAAP. Some of the limitations are: (a) EBITDA and Adjusted EBITDA do not reflect changes in, or cash requirements for, the Company’s working capital needs; (b) EBITDA and Adjusted EBITDA do not reflect the significant interest expense, or the cash requirements necessary to service interest or principal payments, on the Company’s debts; and (c) although depreciation and amortization are non-cash charges, the assets being depreciated and amortized may have to be replaced in the future and EBITDA does not reflect any cash requirements for such capital expenditures. EBITDA and Adjusted EBITDA should only be used on a supplemental basis combined with GAAP results when evaluating the Company’s performance.

Segment Contribution Margin and Adjusted Segment Contribution Margin
We define Segment Contribution Margin as earnings before interest, taxes, depreciation, and amortization, before the allocation of corporate overhead expenses. Adjusted Contribution Margin is defined as Contribution Margin adjusted for certain items affecting period-to-period comparability. See Selected Financial Information for details on how Segment Contribution Margin and Adjusted Segment Contribution Margin were calculated for each period presented. When viewed together with our GAAP results, we believe Segment Contribution Margin and Adjusted Segment Contribution Margin provide management and users of the financial statements meaningful information about the performance of our business segments. Segment Contribution Margin and Adjusted Segment Contribution Margin are used in addition to and in conjunction with results presented in accordance with GAAP and should not be relied upon to the exclusion of GAAP financial measures. The material limitation associated with the use of Segment Contribution Margin and Adjusted Segment Contribution Margin is that they are an incomplete measure of profitability as they do not include all operating expenses or non-operating income and expenses. Management compensates for this limitation when using these measures by looking at other GAAP measures, such as Operating Income and Net Income.

Adjusted Net Income (Loss) and Adjusted or Comparable Net Income (Loss) Per Common Share:
We define Adjusted Net Income (Loss) and Adjusted or Comparable Net Income (Loss) Per Common Share as Net Income (Loss) and Net Income (Loss) Per Common Share adjusted for certain items affecting period-to-period comparability. See Selected Financial Information below for details on how Adjusted Net Income (Loss) Per Common Share and Adjusted or Comparable Net Income (Loss) Per Common Share were calculated for each period presented. We believe that Adjusted Net Income (Loss) and Adjusted or Comparable Net Income (Loss) Per Common Share are meaningful measures because they increase the comparability of period-to-period results. Since these are not measures of performance calculated in accordance with GAAP, they should not be considered in isolation of, or as a substitute for, GAAP Net Income (Loss) and Net Income (Loss) Per Common share, as indicators of operating performance and they may not be comparable to similarly titled measures employed by other companies.

Free Cash Flow:
We define Free Cash Flow as net cash provided by operating activities less capital expenditures. The Company considers Free Cash Flow to be a liquidity measure that provides useful information to management and investors about the amount of cash generated by the business after the purchases of fixed assets, which can then be used to, among other things, invest in the Company’s business, make strategic acquisitions, strengthen the balance sheet, and repurchase stock or retire debt. Free Cash Flow is a liquidity measure that is frequently used by the investment community in the evaluation of similarly situated companies. Since Free Cash Flow is not a measure of performance calculated in accordance with GAAP, it should not be considered in isolation or as a substitute for analysis of the Company’s results as reported under GAAP. A limitation of the utility of Free Cash Flow as a measure of financial performance is that it does not represent the total increase or decrease in the Company’s cash balance for the period.

About 1-800-FLOWERS.COM, Inc.
1-800-FLOWERS.COM, Inc. is a leading provider of gifts designed to help inspire customers to give more, connect more, and build more and better relationships. The Company’s e-commerce business platform features an all-star family of brands, including: 1-800-Flowers.com®, 1-800-Baskets.com®, Cheryl’s Cookies®, Harry & David®, PersonalizationMall.com®, Shari’s Berries®, FruitBouquets.com®, Things Remembered®, Moose Munch®, The Popcorn Factory®, Wolferman’s Bakery®, Vital Choice®, and Simply Chocolate®. Through the Celebrations Passport® loyalty program, which provides members with free standard shipping and no service charge across our portfolio of brands, 1-800-FLOWERS.COM, Inc. strives to deepen relationships with customers. The Company also operates BloomNet®, an international floral and gift industry service provider offering a broad-range of products and services designed to help members grow their businesses profitably; Napco, a resource for floral gifts and seasonal décor; DesignPac Gifts, LLC, a manufacturer of gift baskets and towers; and Alice’s Table®, a lifestyle business offering fully digital floral, culinary and other experiences to guests across the country. 1-800-FLOWERS.COM, Inc. was recognized among the top 5 on the National Retail Federation’s 2021 Hot 25 Retailers list, which ranks the nation’s fastest-growing retail companies, and was named to the Fortune 1000 list in 2022. Shares in 1-800-FLOWERS.COM, Inc. are traded on the NASDAQ Global Select Market, ticker symbol: FLWS. For more information, visit 1800flowersinc.com or follow @1800FLOWERSInc on Twitter.

FLWS–COMP
FLWS-FN

Special Note Regarding Forward Looking Statements:
This press release contains forward-looking statements within the meaning of the Private Securities Litigation Reform Act of 1995. These forward-looking statements represent the Company’s current expectations or beliefs concerning future events and can generally be identified using statements that include words such as “estimate,” “expects,” “project,” “believe,” “anticipate,” “intend,” “plan,” “foresee,” “forecast,” “likely,” “will,” “target” or similar words or phrases. These forward-looking statements are subject to risks, uncertainties, and other factors, many of which are outside of the Company’s control, which could cause actual results to differ materially from the results expressed or implied in the forward-looking statements, including, but not limited to, statements regarding the Company’s ability to achieve its guidance for the full Fiscal year; the Company’s ability to leverage its operating platform and reduce its operating expense ratio; its ability to sell through existing inventories; its ability to successfully integrate acquired businesses and assets; its ability to successfully execute its strategic initiatives; its ability to cost effectively acquire and retain customers; the outcome of contingencies, including legal proceedings in the normal course of business; its ability to compete against existing and new competitors; its ability to manage expenses associated with sales and marketing and necessary general and administrative and technology investments; its ability to reduce promotional activities and achieve more efficient marketing programs; and general consumer sentiment and industry and economic conditions that may affect levels of discretionary customer purchases of the Company’s products. The Company undertakes no obligation to publicly update any of the forward-looking statements, whether because of new information, future events or otherwise, made in this release or in any of its SEC filings. Consequently, you should not consider any such list to be a complete set of all potential risks and uncertainties. For a more detailed description of these and other risk factors, refer to the Company’s SEC filings, including the Company’s Annual Reports on Form 10-K and its Quarterly Reports on Form 10-Q.

Note: The following tables are an integral part of this press release without which the information presented in this press release should be considered incomplete.

 
1-800-FLOWERS.COM, Inc. and Subsidiaries Condensed Consolidated Balance Sheets (in thousands)
 July 2, 2023  July 3, 2022 
   (unaudited)     
Assets        
Current assets:        
Cash and cash equivalents $126,807  $31,465 
Trade receivables, net  20,419   23,812 
Inventories  191,334   247,563 
Prepaid and other  34,583   45,398 
Total current assets  373,143   348,238 
        
Property, plant and equipment, net  234,569   236,481 
Operating lease right-of-use assets  124,715   129,390 
Goodwill  153,376   213,287 
Other intangibles, net  139,888   145,568 
Other assets  25,739   21,927 
Total assets $1,051,430  $1,094,891 
        
Liabilities and Stockholders’ Equity       
Current liabilities:       
Accounts payable $52,588  $57,386 
Accrued expenses  141,914   175,392 
Current maturities of long-term debt  10,000   20,000 
Current portion of long-term operating lease liabilities  15,759   12,919 
Total current liabilities  220,261   265,697 
        
Long-term debt, net  186,391   142,497 
Long-term operating lease liabilities  117,330   123,662 
Deferred tax liabilities, net  31,134   35,742 
Other liabilities  24,471   17,884 
Total liabilities579,587   585,482 
Total stockholders’ equity  471,843   509,409 
Total liabilities and stockholders’ equity $1,051,430  $1,094,891 
1-800-FLOWERS.COM, Inc. and Subsidiaries Selected Financial Information Consolidated Statements of Operations (in thousands, except for per share data) (unaudited)
  Three Months Ended  Years Ended 
  July 2, 2023  July 3, 2022  July 2, 2023  July 3, 2022 
Net revenues:                
E-Commerce $357,489  $433,978  $1,744,622  $1,934,648 
Other  41,317   51,914   273,231   273,237 
Total net revenues  398,806   485,892   2,017,853   2,207,885 
Cost of revenues  250,944   322,209   1,260,327   1,386,147 
Gross profit  147,862   163,683   757,526   821,738 
Operating expenses:              
Marketing and sales  110,763   138,866   500,840   571,661 
Technology and development  16,162   15,192   60,691   56,561 
General and administrative  31,672   23,846   112,747   102,337 
Depreciation and amortization  13,397   12,827   53,673   49,078 
Goodwill and intangible impairment        64,586    
Total operating expenses  171,994   190,731   792,537   779,637 
Operating income (loss)  (24,132)  (27,048)  (35,011)  42,101 
Interest expense, net  2,270   1,190   10,946   5,667 
Other expense (income), net  (1,669)  4,378   805   5,332
Income (loss) before income taxes  (24,733)  (32,616)  (46,762)  31,102 
Income tax (benefit) expense  (2,186)  (10,366)  (2,060)  1,492 
Net income (loss) $(22,547) $(22,250) $(44,702) $29,610 
               
Basic net income (loss) per common share $(0.35) $(0.34) $(0.69) $0.46 
                 
Diluted net income (loss) per common share $(0.35) $(0.34) $(0.69) $0.45 
               
Weighted average shares used in the calculation of net income (loss) per common share:              
Basic  64,773   64,583   64,688   64,977 
Diluted  64,773   64,583   64,688   65,617 
1-800-FLOWERS.COM, Inc. and Subsidiaries Selected Financial Information Consolidated Statements of Cash Flows (in thousands) (unaudited)
   Years Ended 
   July 2, 2023   July 3, 2022 
         
Operating activities:        
Net income (loss) $(44,702) $29,610  
Adjustments to reconcile net income (loss) to net cash provided by operating activities:        
Goodwill and intangible asset impairment  64,586     
Depreciation and amortization  53,673   49,078  
Amortization of deferred financing costs  1,834   1,269  
Deferred income taxes  (4,608)  1,579  
Bad debt expense  3,991   (411) 
Stock-based compensation  8,334   7,947  
Other non-cash items  95   3,194  
Changes in operating items:        
Trade receivables  (597)  (2,452) 
Inventories  57,591   (85,047) 
Prepaid and other  12,554   6,731  
Accounts payable and accrued expenses  (38,623)  (6,595) 
Other assets and liabilities  1,223   286  
Net cash provided by operating activities  115,351   5,189  
         
Investing activities:        
Acquisitions, net of cash acquired  (6,151)  (21,280) 
Capital expenditures, net of non-cash expenditures  (44,646)  (66,408) 
Purchase of equity investments  (32)  (2,000) 
Net cash used in investing activities  (50,829)  (89,688) 
         
Financing activities:        
Acquisition of treasury stock  (1,239)  (38,171) 
Proceeds from exercise of employee stock options     846  
Proceeds from bank borrowings  395,900   125,000  
Repayment of notes payable and bank borrowings  (360,900)  (145,000) 
Debt issuance cost  (2,941)  (284) 
Net cash provided by (used in) financing activities  30,820   (57,609) 
         
Net change in cash and cash equivalents  95,342   (142,108) 
Cash and cash equivalents:        
Beginning of period  31,465   173,573  
End of period $126,807  $31,465  
 
1-800-FLOWERS.COM, Inc. and Subsidiaries Selected Financial Information – Category Information (dollars in thousands) (unaudited)
Three Months Ended
July 2, 2023July 3, 2022% Change
Net revenues:
Consumer Floral & Gifts$248,262 $299,015 -17.0%
BloomNet 29,996  38,490 -22.1%
Gourmet Foods & Gift Baskets 120,669  148,442 -18.7%
Corporate 223  44 406.8%
Intercompany eliminations (344) (99)-247.5%
Total net revenues$398,806 $485,892 -17.9%
 
Gross profit:
Consumer Floral & Gifts$100,832 $113,688 -11.3%
 40.6% 38.0%
 
BloomNet 12,793  15,237 -16.0%
 42.6% 39.6%
 
Gourmet Foods & Gift Baskets 33,862  34,418 -1.6%
 28.1% 23.2%
 
Corporate 375  340 10.3%
 168.2% 772.7%
  
Total gross profit$147,862 $163,683 -9.7%
 37.1% 33.7%
 
EBITDA (non-GAAP):
Segment Contribution Margin (non-GAAP) (a):
Consumer Floral & Gifts$30,703 $26,450 16.1%
BloomNet 7,350  9,985 -26.4%
Gourmet Foods & Gift Baskets (13,418) (23,674)43.3%
Segment Contribution Margin Subtotal 24,635  12,761 93.0%
Corporate (b) (35,370) (26,982)-31.1%
EBITDA (non-GAAP) (10,735) (14,221)24.5%
Add: Stock-based compensation 2,393  1,144 109.2%
Add: Compensation charge related to NQ Plan Investment Appreciation (Depreciation) 1,726  (3,694)146.7%
Adjusted EBITDA (non-GAAP)$(6,616)$(16,771)60.6%
1-800-FLOWERS.COM, Inc. and Subsidiaries Selected Financial Information – Category Information (dollars in thousands) (unaudited)
Years Ended
July 2, 2023Goodwill and Intangible ImpairmentThings Remembered Transaction CostsAs Adjusted (non-GAAP) July 2, 2023July 3, 2022Vital Choice and Alice’s Table Transaction CostsLitigation SettlementAs Adjusted (non-GAAP) July 3, 2022% Change
Net revenues:
Consumer Floral & Gifts$920,510 $$$920,510 $1,059,570 $$$1,059,570 -13.1%
BloomNet 133,183  133,183  145,702  145,702 -8.6%
Gourmet Foods & Gift Baskets 965,191  965,191  1,004,272  1,004,272 -3.9%
Corporate 375  375  201  201 86.6%
Intercompany eliminations (1,406)   (1,406) (1,860)   (1,860)24.4%
Total net revenues$2,017,853 $$$2,017,853 $2,207,885 $$$2,207,885 -8.6%
 
Gross profit:
Consumer Floral & Gifts$363,342 $$$363,342 $416,591 $$$416,591 -12.8%
 39.5% 39.5% 39.3% 39.3%
 
BloomNet 56,879  56,879  61,562  61,562 -7.6%
 42.7% 42.7% 42.3% 42.3%
 
Gourmet Foods & Gift Baskets 336,764  336,764  343,163  343,163 -1.9%
 34.9% 34.9% 34.2% 34.2%
 
Corporate 541  541  422  422 28.2%
 144.3% 144.3% 210.0% 210.0%
        
Total gross profit$757,526 $$$757,526 $821,738 $$$821,738 -7.8%
 37.5%   37.5% 37.2%   37.2%
 
EBITDA (non-GAAP):
Segment Contribution Margin (non-GAAP) (a):
Consumer Floral & Gifts$95,535 $$$95,535 $104,319 $$$104,319 -8.4%
BloomNet 37,197  37,197  42,515  42,515 -12.5%
Gourmet Foods & Gift Baskets 12,895  64,586  77,481  62,021   2,900 64,921 19.3%
Segment Contribution Margin Subtotal 145,627  64,586  210,213  208,855   2,900 211,755 -0.7%
Corporate (b) (126,965)  444 (126,521) (117,676) 540  (117,136)-8.0%
EBITDA (non-GAAP) 18,662  64,586 444 83,692  91,179  540 2,900 94,619 -11.5%
Add: Stock-based compensation 8,334  8,334  7,947  7,947 4.9%
Add: Compensation charge related to NQ Plan Investment (Depreciation) Appreciation (822) (822) (3,583) (3,583)77.1%
Adjusted EBITDA (non-GAAP)$26,174 $64,586$444$91,204 $95,543 $540$2,900$98,983 -7.9%
 
1-800-FLOWERS.COM, Inc. and Subsidiaries Selected Financial Information (in thousands) (unaudited)
Reconciliation of net income (loss) to adjusted net income (loss) (non-GAAP):Three Months EndedYears Ended
July 2, 2023July 3, 2022July 2, 2023July 3, 2022
 
Net income (loss)$(22,547)$(22,250)$(44,702)$29,610 
Adjustments to reconcile net income (loss) to adjusted net income (loss) (non-GAAP)
Add: Transaction costs     444  540 
Add: Litigation settlement       2,900 
Add: Goodwill and Intangibles Impairment     64,586   
Deduct: Income tax effect on adjustments 4,710  476  (6,899) (165)
Adjusted net income (loss) (non-GAAP)$(17,837)$(21,774)$13,429 $32,885 
 
Basic and diluted net income (loss) per common share
Basic$(0.35)$(0.34)$(0.69)$0.46 
Diluted$(0.35)$(0.34)$(0.69)$0.45 
 
 
Basic and diluted adjusted net income (loss) per common share (non-GAAP)
Basic$(0.28)$(0.34)$0.21 $0.51 
Diluted$(0.28)$(0.34)$0.21 $0.50 
 
Weighted average shares used in the calculation of basic and diluted net income (loss) and adjusted net income (loss) per common share
Basic 64,773  64,583  64,688  64,977 
Diluted 64,773  64,583  64,688  65,617 
 
 
1-800-FLOWERS.COM, Inc. and Subsidiaries Selected Financial Information (in thousands) (unaudited)
Reconciliation of net income (loss) to adjusted EBITDA (non-GAAP):Three Months EndedYears Ended
July 2, 2023July 3, 2022July 2, 2023July 3, 2022
 
Net income (loss)$(22,547)$(22,250)$(44,702)$29,610 
Add: Interest expense and other, net 601  5,568  11,751  10,999 
Add: Depreciation and amortization 13,397  12,827  53,673  49,078 
Add: Income tax expense (benefit) (2,186) (10,366) (2,060) 1,492 
EBITDA (10,735) (14,221) 18,662  91,179 
Add: Stock-based compensation 2,393  1,144  8,334  7,947 
Add: Compensation charge related to NQ plan investment appreciation (depreciation) 1,726  (3,694) (822) (3,583)
Add: Goodwill and Intangible Impairment     64,586   
Add: Transaction costs     444  540 
Add: Litigation settlement       2,900 
Adjusted EBITDA$(6,616)$(16,771)$91,204 $98,983 
 
        
(a) Segment performance is measured based on segment contribution margin or segment Adjusted EBITDA, reflecting only the direct controllable revenue and operating expenses of the segments, both of which are non-GAAP measurements. As such, management’s measure of profitability for these segments does not include the effect of corporate overhead, described above, depreciation and amortization, other income (net), and other items that we do not consider indicative of our core operating performance.
        
(b) Corporate expenses consist of the Company’s enterprise shared service cost centers, and include, among other items, Information Technology, Human Resources, Accounting and Finance, Legal, Executive and Customer Service Center functions, as well as Stock-Based Compensation. In order to leverage the Company’s infrastructure, these functions are operated under a centralized management platform, providing support services throughout the organization. The costs of these functions, other than those of the Customer Service Center, which are allocated directly to the above categories based upon usage, are included within corporate expenses as they are not directly allocable to a specific segment.

Investors:

Andy Milevoj

(516) 237-4617

amilevoj@1800flowers.com

Media:

Cherie Gallarello

cgallarello@1800flowers.com

Source: 1-800-FLOWERS.COM

Vera Bradley (VRA) – Second Quarter Results Reported; Raising Price Target


Thursday, August 31, 2023

Joe Gomes, Managing Director, Equity Research Analyst, Generalist , Noble Capital Markets, Inc.

Joshua Zoepfel, Research Associate, Noble Capital Markets, Inc.

Refer to the full report for the price target, fundamental analysis, and rating.

2QFY24. Net revenue of $128.2 million, compared to $130.4 million in 2Q23, below our and consensus estimates of $132 million and $130.90 million, respectively. Net income of $9.3 million, or $0.30/sh ($0.33/sh adjusted) compared to a loss of $29.8 million, or a loss of $0.95/sh (adjusted EPS of $0.08). We had forecasted net income of $3.4 million, or $0.11/sh.

Programs Impacting Bottom Line. While Vera Bradley has yet to see overall positive revenue increases, actions taken by management and the elimination of the post COVID operating environment are positively impacting margins and the bottom line. 2Q24 gross margin improved to 56.2% from an adjusted 52.0% last year, while SG&A as a percentage of revenue fell to 45.5% versus 49.1%, both adjusted for one-time items.


Get the Full Report

Equity Research is available at no cost to Registered users of Channelchek. Not a Member? Click ‘Join’ to join the Channelchek Community. There is no cost to register, and we never collect credit card information.

This Company Sponsored Research is provided by Noble Capital Markets, Inc., a FINRA and S.E.C. registered broker-dealer (B/D).

*Analyst certification and important disclosures included in the full report. NOTE: investment decisions should not be based upon the content of this research summary. Proper due diligence is required before making any investment decision.