Research News and Market Data on EDRY
February 24, 2025 07:34 ET
ATHENS, Greece, Feb. 24, 2025 (GLOBE NEWSWIRE) — EuroDry Ltd. (NASDAQ: EDRY, the “Company” or “EuroDry”), an owner and operator of drybulk vessels and provider of seaborne transportation for drybulk cargoes, announced today its results for the three and twelve-month periods ended December 31, 2024.
Fourth Quarter 2024 Highlights:
- Total net revenues of $14.5 million.
- Net loss attributable to controlling shareholders, of $3.3 million or $1.20 loss per share basic and diluted.
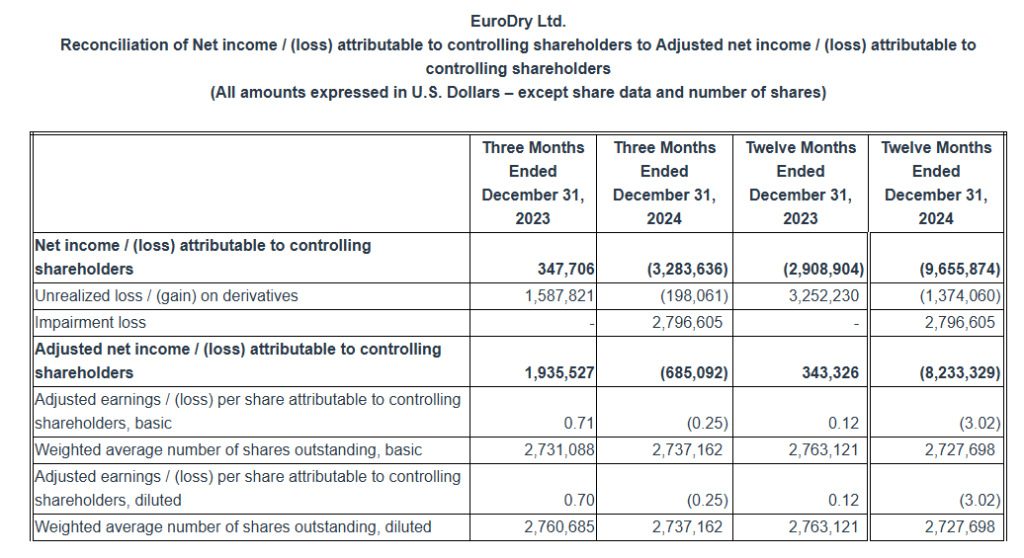
- Adjusted net loss1 attributable to controlling shareholders, for the quarter of $0.7 million, or, $0.25 per share basic and diluted which excludes among other items an impairment charge of $2.8 million on one of our vessels.
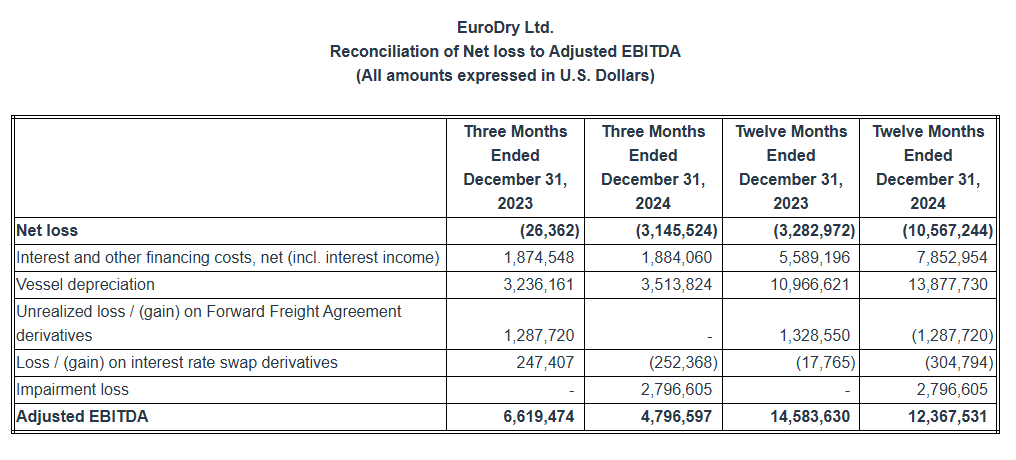
- Adjusted EBITDA1 was $4.8 million.
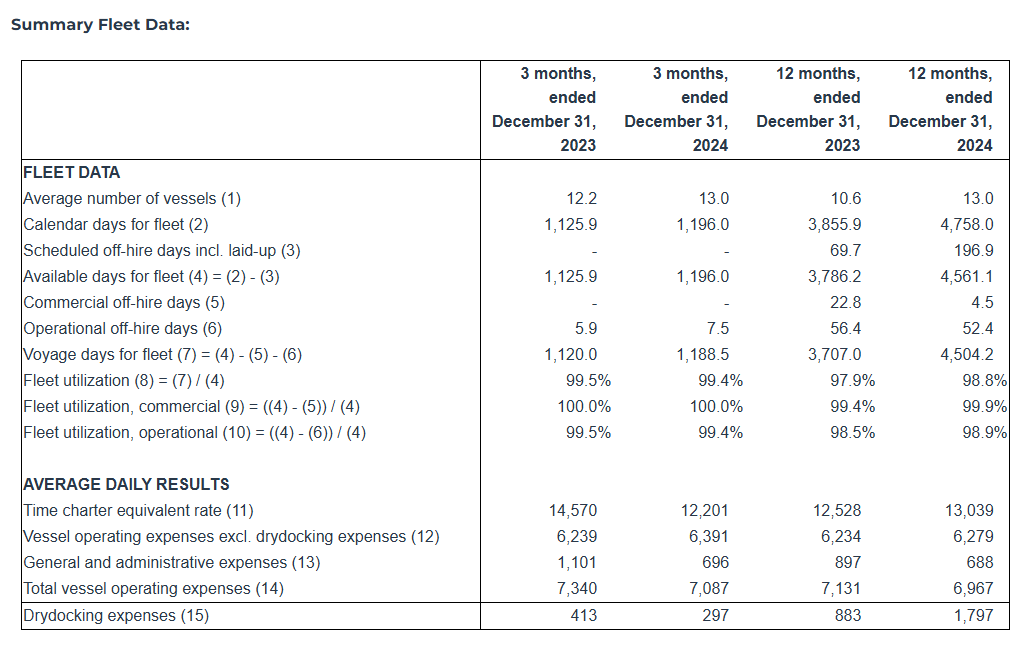
- An average of 13.0 vessels were owned and operated during the fourth quarter of 2024 earning an average time charter equivalent rate of $12,201 per day.
- To date, about $5.3 million has been used to repurchase 334,674 shares of the Company, under our share repurchase plan of up to $10 million, announced in August 2022.
Recent developments:
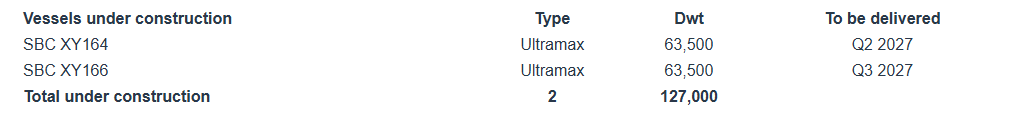
- In November 2024, the Company signed two contracts with Nantong Xiangyu Shipbuilding for the construction of two 63,500 DWT ultramax bulk carriers. Both vessels are geared, eco, and are built to EEDI phase 3 design standard. The two newbuildings are scheduled to be delivered during the second and third quarters of 2027. The total consideration for the two newbuilding contracts is approximately $71.8 million and will be financed with a combination of debt and equity.
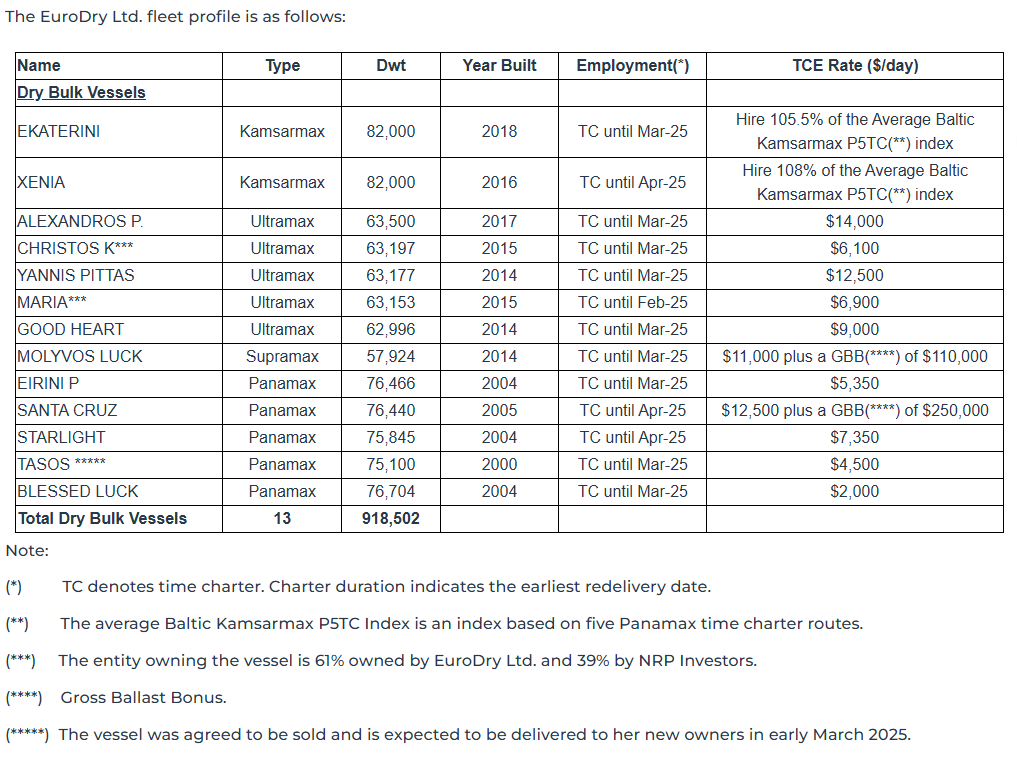
- The Company on January 29, 2025, signed an agreement to sell M/V Tasos, a 75,100 dwt drybulk vessel, built in 2000, for demolition, for approximately $5 million. The vessel is expected to be delivered to its buyers, an unaffiliated third party, until early-March 2025, upon completion of her present charter. As a result of the vessel sale, we expect to record a gain of approximately $2.1million.
Full Year 2024 Highlights:
- Total net revenues of $61.1 million.
- Net loss attributable to controlling shareholders, of $9.7 million, or $3.54 loss per share basic and diluted.
- Adjusted net loss1 attributable to controlling shareholders, for the period was $8.2 million or $3.02 adjusted loss per share basic and diluted.
- Adjusted EBITDA1 was $12.4 million.
- An average of 13.0 vessels were owned and operated during the twelve months of 2024 earning an average time charter equivalent rate of $13,039 per day.
Aristides Pittas, Chairman and CEO of EuroDry commented: “During the last couple of months of 2024 and during January and February of 2025, the drybulk market dropped to rates not seen since the early days of the COVID pandemic and touched decade-long lows last seen in 2016. It appears that a combination of low trade volumes due to low demand from China combined with a record low percentage of the fleet tied up in ports more than counterbalanced the low fleet growth during the period. There is some expectation, though, that the various stimuli packages released by the Chinese government during the fourth quarter of 2024 would start showing results in the near future; such stimuli combined with the typical seasonal recovery of the drybulk markets during the second quarter could lead to a noticeable recovery of the charter rates as already indicated by the forward (“FFA”) market.
“The low market of the fourth quarter was reflected in our results for the period although our vessels achieved better charters than market averages indicate. And while the low market of January and February 2025 will affect our first quarter results, we expect a recovery of the market in March and during the second quarter of 2025 to return us to profitability as our fleet is positioned to take full advantage of it having passed most drydockings in 2024. At the same time, as prices for vessels have also weakened, we are diligent in searching for potential investment opportunities; and to help finance such opportunities should they arise, we have committed to sell our eldest vessel M/V Tasos, as we recently announced.”
Tasos Aslidis, Chief Financial Officer of EuroDry commented: “In the fourth quarter of 2024 the Company operated an average of 13.0 vessels, versus 12.2 vessels during the same period last year. Our net revenues decreased to $14.5 million in the fourth quarter of 2024 compared to $15.9 million during the same period of last year. Our vessels earned in the fourth quarter of 2024 approximately 16.3% lower time charter equivalent rates compared to the corresponding period of 2023. At the same time, total daily vessel operating expenses, including management fees, general and administrative expenses but excluding drydocking costs, during the fourth quarter of 2024, averaged $7,087 per vessel per day, as compared to $7,340 for the same period of last year and $6,967 per vessel per day for the year 2024 as compared to $7,131 per vessel per day for the same period of 2023. The decreased total vessel operating expenses in the recent periods are attributable to the significantly lower daily general and administrative expenses. General and administrative expenses for the same period of 2023 included additional costs incurred in relation to the formation of a partnership with a number of investors represented by NRP Project Finance AS (“NRP Investors”) regarding the ownership of the entities owning M/V Christos K and M/V Maria (the “Partnership”).
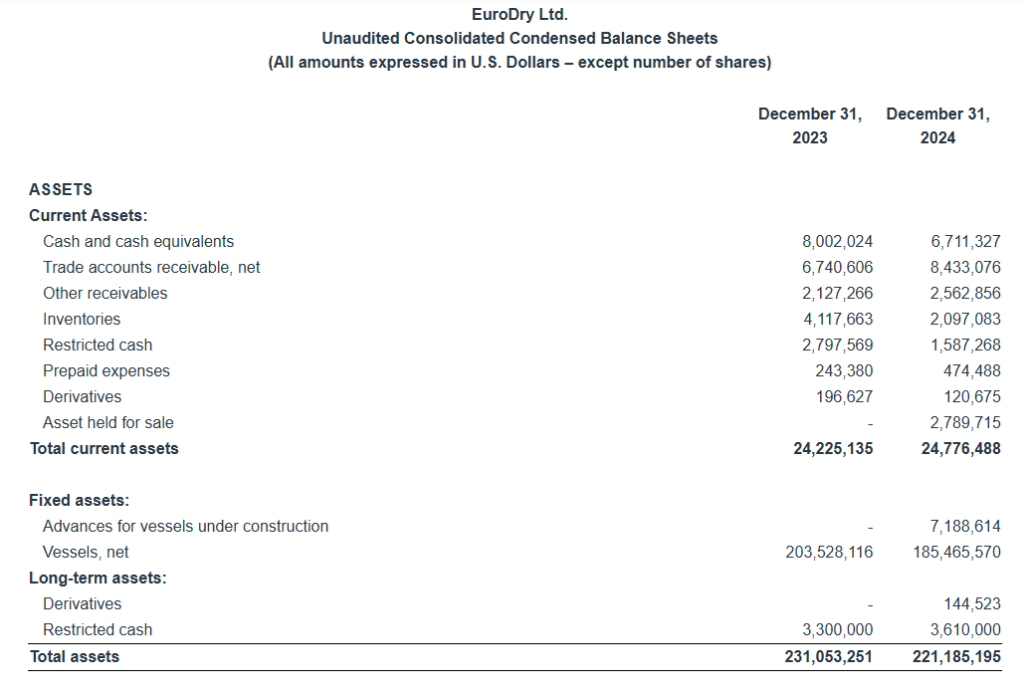
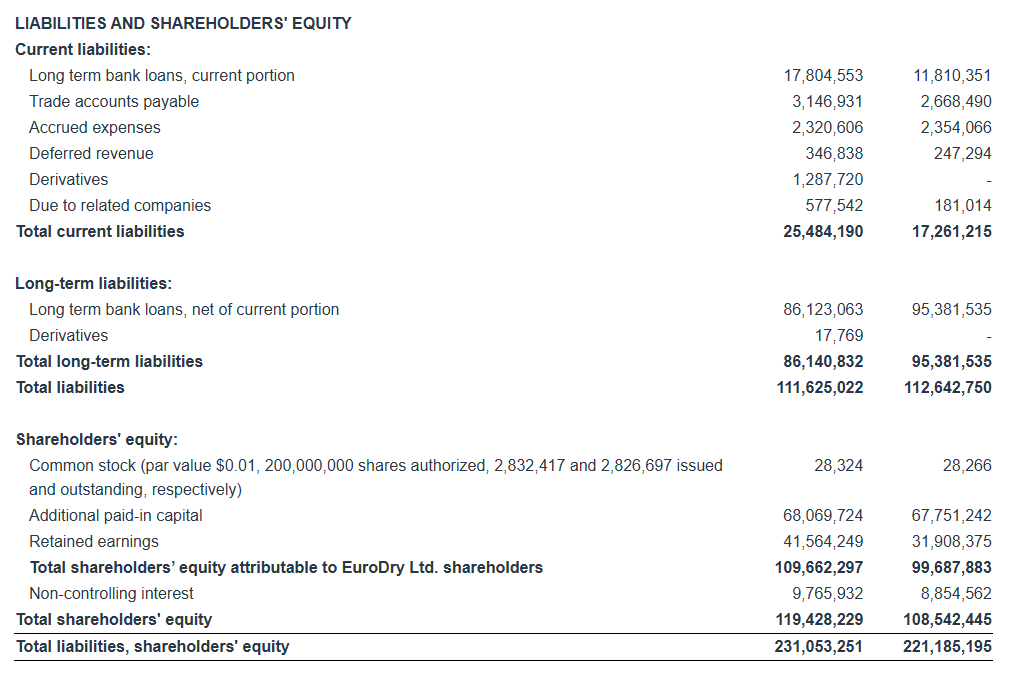
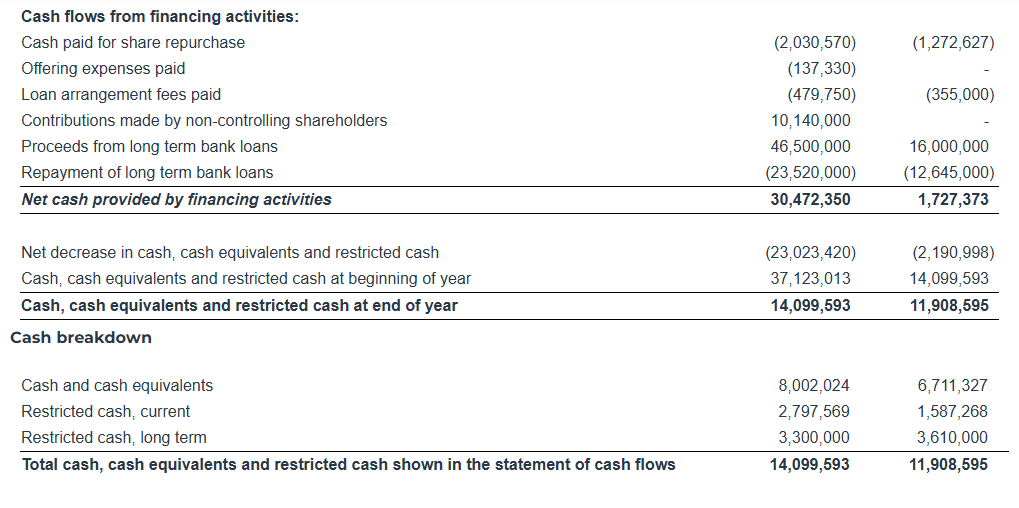
“Adjusted EBITDA during the fourth quarter of 2024 was $4.8 million versus $6.6 million in the fourth quarter of last year, and $12.4 million versus $14.6 million for the respective twelve-month periods of 2024 and 2023, respectively. As of December 31, 2024, our outstanding debt (excluding the unamortized loan fees) was $108.2 million versus unrestricted and restricted cash of $11.9 million. As of the same date, our scheduled debt repayments over the next 12 months amounted to about $12.1 million (excluding the unamortized loan fees).”
Fourth Quarter 2024 Results:
For the fourth quarter of 2024, the Company reported total net revenues of $14.5 million representing a 8.8% decrease over total net revenues of $15.9 million during the fourth quarter of 2023. This was the result of the lower time charter rates our vessels earned in the fourth quarter of 2024, partly offset by the higher average number of vessels operated compared to the same period of 2023. On average, 13.0 vessels were owned and operated during the fourth quarter of 2024 earning an average time charter equivalent rate of $12,201 per day compared to 12.2 vessels in the same period of 2023 earning on average $14,570 per day.
For the fourth quarter of 2024, voyage expenses, net amounted to $0.9 million and mainly relate to vessels repositioning between charters and expenses during operational off-hire time. For the same period of 2023 voyage expenses net amounted to $0.6 million.
Vessel operating expenses were $6.6 million for the fourth quarter of 2024 as compared to $6.1 million for the same period of 2023. The increase is mainly attributable to the increased number of vessels operating in the fourth quarter of 2024 compared to the corresponding period in 2023.
Depreciation expense for the fourth quarter of 2024 amounted to $3.5 million, as compared to $3.2 million for the same period of 2023. This increase is again due to the higher number of vessels operating in the fourth quarter of 2024 as compared to the same period of 2023.
General and administrative expenses for the fourth quarter of 2024 were $0.8 million compared to $1.2 million of the fourth quarter of 2023. The decrease is mainly attributable to an additional cost of $0.44 million that was incurred during the last quarter of 2023 in relation to the formation of the Partnership.
Related party management fees for the fourth quarter of 2024 increased to $1.1 million from $1.0 million for the same period of 2023 as a result of an adjustment for inflation in the daily vessel management fee, effective from January 1, 2024, increasing the daily vessel management fee from 775 Euros to 810 Euros, as well as the increased number of vessels operating in the fourth quarter of 2024 compared to the corresponding period in 2023, partly offset by the favorable movement of the euro/dollar exchange rate.
During the fourth quarter of 2024 and 2023, none of our vessels underwent drydocking. The total cost for the fourth quarter of 2024 and 2023 of $0.4 million and $0.5 million, respectively, relates to drydocking expenses incurred in relation to upcoming drydockings.
In the fourth quarter of 2024 the Company recorded an impairment charge of $2.8 million. The impairment was booked to reduce the carrying amount of a drybulk vessel (M/V “Santa Cruz”) to its estimated market value, since based on the Company’s impairment test results it was determined that its carrying amount was not recoverable. No such cost existed in the fourth quarter of 2023.
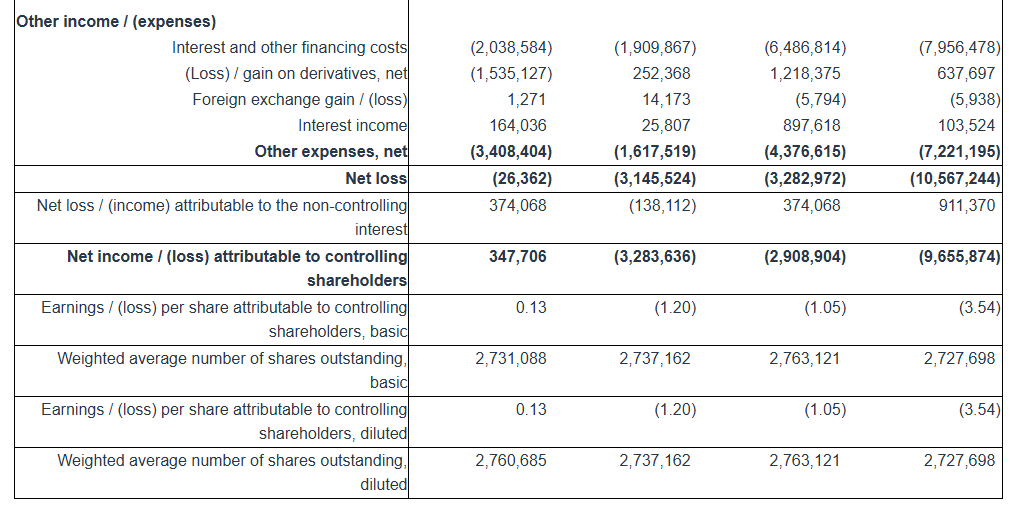
Interest and other financing costs for the fourth quarter of 2024 decreased to $1.9 million as compared to $2.0 million for the same period of 2023. Interest expense during the fourth quarter of 2024 was slightly lower mainly due to the slightly decreased benchmark rates of our loans, partly offset by the increased average debt during the period as compared to the same period of last year.
For the three months ended December 31, 2024, the Company recognized a gain on an interest rate swap of $0.25 million, as compared to a loss on an interest rate swap of $0.25 million and a loss on forward freight agreement (“FFA”) contracts of $1.3 million for the same period of 2023.
Interest income for the fourth quarter of 2024 amounted to $0.03 million compared to $0.16 million for the same period of 2023. The decrease in interest income is attributable to lower cash balances maintained during the fourth quarter of 2024 compared to the corresponding period in 2023.
The Company reported a net loss for the period of $3.1 million and a net loss attributable to controlling shareholders for the period of $3.3 million, as compared to a net loss of $0.03 million and a net income attributable to controlling shareholders of $0.3 million for the same period of 2023. The net income attributable to the non-controlling interest of $0.1 million in the fourth quarter of 2024 represents the income attributable to the 39% ownership of the Partnership.
Adjusted EBITDA for the fourth quarter of 2024 was $4.8 million compared to $6.6 million achieved during the fourth quarter of 2023.
Basic and diluted loss per share attributable to controlling shareholders for the fourth quarter of 2024 was $1.20 calculated on 2,737,162 basic and diluted weighted average number of shares outstanding, compared to earnings per share of $0.13, calculated on 2,731,088 basic and 2,760,685 diluted weighted average number of shares outstanding for the fourth quarter of 2023.
Excluding the effect on the net loss attributable to controlling shareholders for the quarter of the unrealized loss / (gain) on derivatives and the impairment loss on a vessel, the adjusted loss per share attributable to controlling shareholders for the quarter ended December 31, 2024 would have been $0.25 basic and diluted, compared to adjusted earnings of $0.71 and $0.70 per share basic and diluted, respectively, for the quarter ended December 31, 2023. Usually, security analysts do not include the above items in their published estimates of earnings per share.
Full Year 2024 Results:
For the full year of 2024, the Company reported total net revenues of $61.1 million representing a 28.3% increase over total net revenues of $47.6 million during the twelve months of 2023, as a result of the increased number of vessels operated during the year and the slightly higher time charter equivalent rates earned by our vessels in the twelve months of 2024 compared to the same period of 2023. On average, 13.0 vessels were owned and operated during the twelve months of 2024 earning an average time charter equivalent rate of $13,039 per day compared to 10.6 vessels in the same period of 2023 earning on average $12,528 per day.
For the twelve months of 2024, voyage expenses, net, were $6.1 million and mainly relate to vessels repositioning between charters and expenses during operational off-hire time. For the same period of 2023, voyage expenses, net, were $4.0 million and mainly relate to expenses incurred by one of our vessels while employed under a voyage charter, vessels repositioning between charters and expenses during the detention of one of our vessels in Corpus Christi.
Vessel operating expenses were $25.7 million for the twelve months of 2024 as compared to $20.8 million for the same period of 2023. The increase is mainly attributable to the increased number of vessels operating in 2024 compared to the corresponding period in 2023.
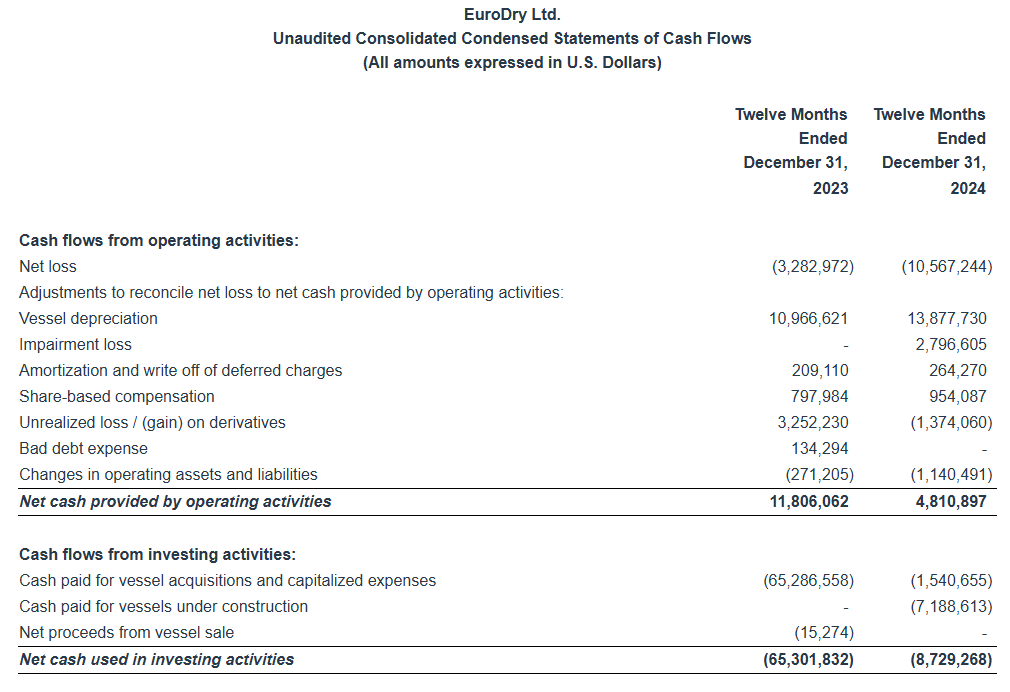
Depreciation expense for the year 2024 was $13.9 million compared to $11.0 million during the same period of 2023, again, mainly due to the higher number of vessels operating in the same period.
Related party management fees for the year of 2024 were increased to $4.2 million from $3.3 million for the same period of 2023 as a result of an adjustment for inflation in the daily vessel management fee, effective from January 1, 2024, increasing the daily vessel management fee from 775 Euros to 810 Euros and the increased number of vessels operated.
General and administrative expenses during the twelve months of 2024 were $3.3 million compared to $3.5 million during the same period in 2023. The decrease is attributable to an additional cost of $0.44 million that was incurred during the last quarter of 2023 in relation to the formation of the Partnership, partly offset by the increased cost of our stock incentive plan in 2024.
During the twelve months of 2023, we recorded a provision of $0.5 million for anticipated costs related to the detention of one of our vessels in Corpus Christi presented as other operating loss.
In 2023, we wrote-off certain trade receivables by recording a bad debt expense of $0.1 million. In 2024, we had no bad debt expense.
In the twelve months of 2024, seven of our vessels completed their special survey with drydocking for a total cost of $8.5 million. In the twelve months of 2023, three of our vessels completed their special or intermediate survey with drydocking and one vessel passed her intermediate survey in water (in lieu of drydock), for a total cost of $3.4 million.
Interest and other financing costs for the twelve months of 2024 amounted to $8.0 million compared to $6.5 million for the same period of 2023. Interest expense for the twelve months of 2024 was higher due to the increased average debt as compared to the same period of last year.
For the twelve months ended December 31, 2024, the Company recognized a $0.1 million unrealized gain and a $0.2 million realized gain on one interest rate swap, as well as a 1.3 million unrealized gain and a $1.0 million realized loss on FFA contracts as compared to a $1.9 million unrealized loss and a $1.9 million realized gain on interest rate swaps, as well as a 1.3 million unrealized loss and a $2.5 million realized gain on FFA contracts for the same period of 2023.
Interest income for 2024 amounted to $0.1 million compared to $0.9 million interest income for the same period of 2023. The decrease of interest income is attributable to lower cash balances maintained during the twelve months of 2024 compared to the corresponding period in 2023.
The Company reported a net loss for the period of $10.6 million and a net loss attributable to controlling shareholders of $9.7 million, as compared to a net loss of $3.3 million and a net loss attributable to controlling shareholders of $2.9 million, for the same period of 2023. The net loss attributable to the non-controlling interest of $0.9 million in 2024 represents the loss attributable to the 39% ownership of the Partnership.
Adjusted EBITDA for the twelve months of 2024 was $12.4 million compared to $14.6 million achieved during the twelve months of 2023.
Basic and diluted loss per share attributable to controlling shareholders for the twelve months of 2024 was $3.54, calculated on 2,727,698 basic and diluted weighted average number of shares outstanding, compared to basic and diluted loss per share attributable to controlling shareholders for the twelve months of 2023 of $1.05, calculated on 2,763,121 basic and diluted weighted average number of shares outstanding.
Excluding the effect on the net loss attributable to controlling shareholders for the year of the unrealized loss / (gain) on derivatives and the impairment loss on a vessel, the adjusted loss per share attributable to controlling shareholders for the year ended December 31, 2024 would have been $3.02 basic and diluted, compared to adjusted earnings per share of $0.12 basic and diluted for the same period of 2023. As previously mentioned, usually, security analysts do not include the above items in their published estimates of earnings per share.
(1) Average number of vessels is the number of vessels that constituted the Company’s fleet for the relevant period, as measured by the sum of the number of calendar days each vessel was a part of the Company’s fleet during the period divided by the number of calendar days in that period.
(2) Calendar days. We define calendar days as the total number of days in a period during which each vessel in our fleet was owned by us including off-hire days associated with major repairs, drydockings or special or intermediate surveys or days of vessels in lay-up. Calendar days are an indicator of the size of our fleet over a period and affect both the amount of revenues and the amount of expenses that we record during that period.
(3) The scheduled off-hire days including vessels laid-up are days associated with scheduled repairs, drydockings or special or intermediate surveys or days of vessels in lay-up.
(4) Available days. We define available days as the total number of Calendar days in a period net of scheduled off-hire days incl. laid up. We use available days to measure the number of days in a period during which vessels were available to generate revenues.
(5) Commercial off-hire days. We define commercial off-hire days as days a vessel is idle without employment.
(6) Operational off-hire days. We define operational off-hire days as days associated with unscheduled repairs or other off-hire time related to the operation of the vessels.
(7) Voyage days. We define voyage days as the total number of days in a period during which each vessel in our fleet was in our possession net of commercial and operational off-hire days. We use voyage days to measure the number of days in a period during which vessels actually generate revenues or are sailing for repositioning purposes.
(8) Fleet utilization. We calculate fleet utilization by dividing the number of our voyage days during a period by the number of our available days during that period. We use fleet utilization to measure a company’s efficiency in finding suitable employment for its vessels and minimizing the amount of days that its vessels are off-hire for reasons such as unscheduled repairs or days waiting to find employment.
(9) Fleet utilization, commercial. We calculate commercial fleet utilization by dividing our available days net of commercial off-hire days during a period by our available days during that period.
(10) Fleet utilization, operational. We calculate operational fleet utilization by dividing our available days net of operational off-hire days during a period by our available days during that period.
(11) Time charter equivalent rate, or TCE, is a measure of the average daily net revenue performance of our vessels. Our method of calculating TCE is determined by dividing time charter revenue and voyage charter revenue net of voyage expenses by voyage days for the relevant time period. Voyage expenses primarily consist of port, canal and fuel costs that are unique to a particular voyage, which would otherwise be paid by the charterer under a time charter contract, or are related to repositioning the vessel for the next charter. TCE provides additional meaningful information in conjunction with time charter revenue and voyage charter revenue, the most directly comparable GAAP measure, because it assists our management in making decisions regarding the deployment and use of our vessels and because we believe that it provides useful information to investors regarding our financial performance. TCE is a standard shipping industry performance measure used primarily to compare period-to-period changes in a shipping company’s performance despite changes in the mix of charter types (i.e., spot voyage charters, time charters, pool agreements and bareboat charters) under which the vessels may be employed between the periods. Our definition of TCE may not be comparable to that used by other companies in the shipping industry.
(12) We calculate daily vessel operating expenses, which include crew costs, provisions, deck and engine stores, lubricating oil, insurance, maintenance and repairs and related party management fees by dividing vessel operating expenses and related party management fees by fleet calendar days for the relevant time period. Drydocking expenses are reported separately.
(13) Daily general and administrative expenses are calculated by us by dividing general and administrative expenses by fleet calendar days for the relevant time period.
(14) Total vessel operating expenses, or TVOE, is a measure of our total expenses associated with operating our vessels. We compute TVOE as the sum of vessel operating expenses, related party management fees and general and administrative expenses; drydocking expenses are not included. Daily TVOE is calculated by dividing TVOE by fleet calendar days for the relevant time period.
(15) Daily drydocking expenses are calculated by us by dividing drydocking expenses by the fleet calendar days for the relevant period. Drydocking expenses include expenses during drydockings that would have been capitalized and amortized under the deferral method. Drydocking expenses could vary substantially from period to period depending on how many vessels underwent drydocking during the period. The Company expenses drydocking expenses as incurred.
Conference Call and Webcast:
Today, February 24, 2025 at 9:00 a.m. Eastern Time, the Company’s management will host a conference call and webcast to discuss the results.
Conference Call details:
Participants should dial into the call 10 minutes before the scheduled time using the following numbers: 877 405 1226 (US Toll-Free Dial In) or +1 201 689 7823 (US and Standard International Dial In). Please quote “EuroDry” to the operator and/or conference ID 13751962. Click here for additional participant International Toll -Free access numbers.
Alternatively, participants can register for the call using the call me option for a faster connection to join the conference call. You can enter your phone number and let the system call you right away. Click here for the call me option.
Audio webcast – Slides Presentation:
There will be a live and then archived webcast of the conference call and accompanying slides, available on the Company’s website. To listen to the archived audio file, visit our website http://www.eurodry.gr and click on Company Presentations under our Investor Relations page. Participants to the live webcast should register on the website approximately 10 minutes prior to the start of the webcast.
The slide presentation for the fourth quarter ended December 31, 2024, will also be available in PDF format 10 minutes prior to the conference call and webcast, accessible on the company’s website (www.eurodry.gr) on the webcast page. Participants to the webcast can download the PDF presentation.

Adjusted EBITDA Reconciliation:
EuroDry Ltd. considers Adjusted EBITDA to represent net loss before interest and other financing costs, income taxes, depreciation, unrealized loss / (gain) on Forward Freight Agreement derivatives (“FFAs”), loss / (gain) on interest rate swap derivatives and impairment loss. Adjusted EBITDA does not represent and should not be considered as an alternative to net loss, as determined by United States generally accepted accounting principles, or GAAP. Adjusted EBITDA is included herein because it is a basis upon which the Company assesses its financial performance because the Company believes that this non-GAAP financial measure assists our management and investors by increasing the comparability of our performance from period to period by excluding the potentially disparate effects between periods of, financial costs, unrealized loss / (gain) on FFAs, loss / (gain) on interest rate swap derivatives, depreciation and impairment loss. The Company’s definition of Adjusted EBITDA may not be the same as that used by other companies in the shipping or other industries.
Adjusted net income / (loss) attributable to controlling shareholders and Adjusted earnings / (loss) per share attributable to controlling shareholders Reconciliation:
EuroDry Ltd. considers Adjusted net income / (loss) attributable to controlling shareholders, to represent net income / (loss) before unrealized loss / (gain) on derivatives, which includes FFAs and interest rate swaps, and impairment loss. Adjusted net income / (loss) attributable to controlling shareholders and Adjusted earnings / (loss) per share attributable to common shareholders are included herein because we believe they assist our management and investors by increasing the comparability of the Company’s fundamental performance from period to period by excluding the potentially disparate effects between periods of the aforementioned items , which may significantly affect results of operations between periods. Adjusted net income / (loss) attributable to controlling shareholders and Adjusted earnings / (loss) per share attributable to common shareholders do not represent and should not be considered as an alternative to net income / (loss) attributable to controlling shareholders or earnings / (loss) per share attributable to common shareholders, as determined by GAAP. The Company’s definition of Adjusted net income / (loss) attributable to controlling shareholders and Adjusted earnings / (loss) per share attributable to common shareholders may not be the same as that used by other companies in the shipping or other industries. Adjusted net income / (loss) attributable to controlling shareholders and Adjusted earnings / (loss) per share attributable to common shareholders are not adjusted for all non-cash income and expense items that are reflected in our statement of cash flows.
About EuroDry Ltd.
EuroDry Ltd. was formed on January 8, 2018 under the laws of the Republic of the Marshall Islands to consolidate the drybulk fleet of Euroseas Ltd into a separate listed public company. EuroDry was spun-off from Euroseas Ltd on May 30, 2018; it trades on the NASDAQ Capital Market under the ticker EDRY.
EuroDry operates in the dry cargo, drybulk shipping market. EuroDry’s operations are managed by Eurobulk Ltd., an ISO 9001:2008 and ISO 14001:2004 certified affiliated ship management company and Eurobulk (Far East) Ltd. Inc., which are responsible for the day-to-day commercial and technical management and operations of the vessels. EuroDry employs its vessels on spot and period charters and under pool agreements.
The Company has a fleet of 13 vessels, including 5 Panamax drybulk carriers, 5 Ultramax drybulk carriers, 2 Kamsarmax drybulk carriers and 1 Supramax drybulk carrier. EuroDry’s 13 drybulk carriers have a total cargo capacity of 918,502 dwt. After the delivery of two Ultramax vessels in 2027 and the completion of the sale of one Panamax vessel, the Company’s fleet will consist of 14 vessels with a total carrying capacity of 970,402 dwt.
Forward Looking Statement
This press release contains forward-looking statements (as defined in Section 27A of the Securities Act of 1933, as amended, and Section 21E of the Securities Exchange Act of 1934, as amended) concerning future events and the Company’s growth strategy and measures to implement such strategy; including expected vessel acquisitions and entering into further time charters. Words such as “expects,” “intends,” “plans,” “believes,” “anticipates,” “hopes,” “estimates,” and variations of such words and similar expressions are intended to identify forward-looking statements. Although the Company believes that the expectations reflected in such forward-looking statements are reasonable, no assurance can be given that such expectations will prove to have been correct. These statements involve known and unknown risks and are based upon a number of assumptions and estimates that are inherently subject to significant uncertainties and contingencies, many of which are beyond the control of the Company. Actual results may differ materially from those expressed or implied by such forward-looking statements. Factors that could cause actual results to differ materially include, but are not limited to changes in the demand for dry bulk vessels, competitive factors in the market in which the Company operates; risks associated with operations outside the United States; and other factors listed from time to time in the Company’s filings with the Securities and Exchange Commission. The Company expressly disclaims any obligations or undertaking to release publicly any updates or revisions to any forward-looking statements contained herein to reflect any change in the Company’s expectations with respect thereto or any change in events, conditions or circumstances on which any statement is based.
Visit our website www.eurodry.gr
| Company Contact | Investor Relations / Financial Media |
| Tasos Aslidis Chief Financial Officer EuroDry Ltd. 11 Canterbury Lane, Watchung, NJ07069 Tel. (908) 301-9091 E-mail: aha@eurodry.gr | Nicolas Bornozis Markella Kara Capital Link, Inc. 230 Park Avenue, Suite 1540 New York, NY10169 Tel. (212) 661-7566 E-mail: eurodry@capitallink.com |
__________________
1Adjusted EBITDA, Adjusted net income / (loss) attributable to controlling shareholders and Adjusted earnings / (loss) per share are not recognized measurements under US GAAP (GAAP) and should not be used in isolation or as a substitute for EuroDry’s financial results presented in accordance with GAAP. Refer to a subsequent section of the Press Release for the definitions and reconciliation of these measurements to the most directly comparable financial measures calculated and presented in accordance with GAAP.