The Math Behind (Winning) the Gift Stealing Game

Image Credit: Marco Verch (Flickr)

How to Play and Win the Gift-Stealing Game Bad Santa, According to a Mathematician

Christmas comes but once a year – as do Christmas party games. With such little practice it’s hard to get good at any of them.

Let me help. I’m going to share with you some expert tips, tested through mathematical modelling, on how to win one of the most popular games: Bad Santa – also known as Dirty Santa, White Elephant, Grab Bag, Yankee Swap, Thieving Secret Santa, or simply “that present-stealing game”.

This article was republished with permission from The Conversation, a news site dedicated to sharing ideas from academic experts. It represents the research-based findings and thoughts of Joel Gilmore, Associate Professor, Griffith University.

This isn’t advice on being a bad sport. It’s about being a good Bad Santa – which is the name of the game. You might even come away with a good gift and bragging rights.

How Bad Santa Works

Bad Santa is a variation of the classic Kris Kringle (or Secret Santa) game, in which each guest receives an anonymous gift bought by another guest. Part of the fun (for others) is the unwrapping of silly and useless gifts, which is done one by one.

Bad Santa spices things up. All the gifts are pooled. Guests take turns to choose one to unwrap. Or they can choose to “steal” a gift already opened by someone else. The person losing their gift then gets the same choice: open a wrapped present or steal someone else’s.

It’s a good alternative to buying a gift for everyone, and a great way to ruin friendships.

The order of players is usually determined by drawing numbers from a hat. This is important, because you’ve probably already noted the disadvantage of going first and the benefit of going last. The right rules can mitigate this. There are at least a dozen different versions of this game published online, and some are much less fair than others.

How I Tested Bad Santa

The best way to test Bad Santa rule variations and playing strategies would be to observe games in real life – say, by attending 1,000 Christmas parties (funding bodies please call me).

I did the next best thing, deploying the same type of computer modelling (known as agent-based modelling) used to understand everything from bidding in electricity markets to how the human immune system works.

In my model there are 16 virtual guests and 16 gifts. Each has different present preferences, rating opened gifts on a scale of 1 to 10. They will steal a gift they rate better than a 5. To make it interesting, three gifts are rated highly by everyone and there are three no one really wants – probably a novelty mug or something.

Christmas comes but once a year – as do Christmas party games. With such little practice it’s hard to get good at any of them. Let me help. I’m going to share with you some expert tips, tested through mathematical modelling, on how to win one of the most popular games: Bad Santa – also known as Dirty Santa, White Elephant, Grab Bag, Yankee Swap, Thieving Secret Santa, or simply “that present-stealing game”.
Image Credit Jernej Furman (Flickr)

After simulating 50,000 games with different rules, I’ve found a set of rules that seems the most fair, no matter what number you draw from the hat.

Choosing the Fairest Rules

The following graph shows the results for four different game variations.

The higher the line, the greater the overall satisfaction. The flatter the lines, the fairer the result. (If gifts were chosen randomly with no stealing, every player’s average satisfaction score would be 5).
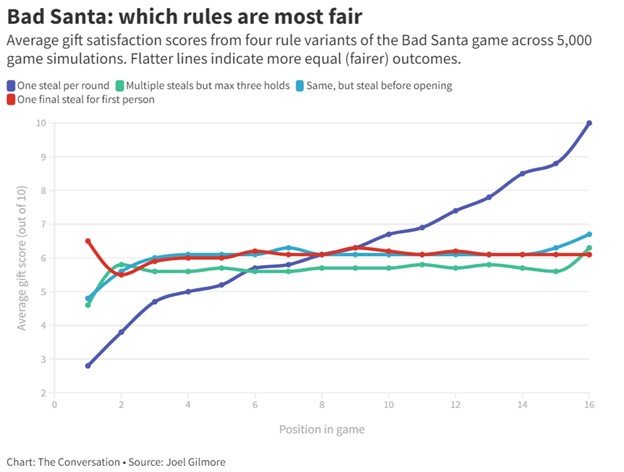
The most unfair result comes from the “dark blue rules”, which stipulate that any gift can only be stolen once in any round. This mean if you’re the last person, you’ve got the biggest choice and get to keep what you steal. If you go first, you’re bound to lose out.

Fairest and Best Bad Santa Rules

The most fair outcomes come from the “red rules”:

  • A gift can be stolen multiple times each turn. This keeps presents moving between guests, which adds to the fun.
  • Once a person holds the same gift three times it becomes “locked”, and can no longer be stolen. This evens the game out a lot. Later players still see more gifts, but earlier players have more chance to lock the gift they want. It also ensures games don’t go on for hours.
  • After the last player’s turn, there is one more round of stealing, starting with the very first player. This also gives them a chance to steal at least once – and a slight advantage. But overall, these rules provide the most even outcomes.

Like most games, the rules are’t perfect. But the maths shows they are better than the alternatives. If you want to test other scenarios using my model, you can download my source code here.
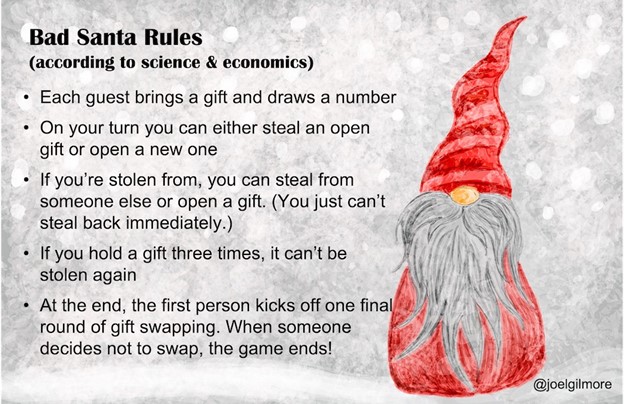
On your turn you can either steal an open gift or open a new one If you’re stolen from, you can steal from someone else or open a gift. If you hold a gift three times, it is locked. First person gets a final steal.

Three Tips on Game Strategy

The right rules help level the playing field. They don’t eliminate the need for strategic thinking to maximise your chance to get a gift you want.

As in real life, seemingly fair rules can be manipulated.

One thing you could do is team up with other players to manipulate the “three holds and locked” rule. To do this, you’ll need at least two co-conspirators.

Say your friends Donner and Blitzen have their preferred gifts, and now it’s your turn. You steal Blitzen’s gift. Blitzen in turn steals Donner’s, who steals yours, and so on. Donner and Blitzen end up holding their chosen gifts a second time, then a third. You helped them out, and then can choose another gift.

Image Credit:Steve Jurvetson (Flickr)

In competitive markets this type of co-operation is usually know as collusion – and it’s illegal. In sport, it would simply be called cheating. So I’m not saying you should do this; I am merely explaining how the strategy works. If you do this and end up on the naughty list, don’t blame me.

I haven’t yet tested rules variations in my model to see how this collusion can best be eliminated or minimised. Maybe by next Christmas. (Or maybe not – for me, cheating through maths is half the fun of the game.)

So let me leave you with two perfectly legitimate strategies.

First, and most obviously, you must steal gifts!

My modelling quantifies how necessary this is. I simulated a game in which four guests will never steal a gift. Those guests are 75% less satisfied with their final gifts than the players who do steal. They’re also much less fun at parties.

Why Central Banks Will Choose Recession Over Inflation

Image Credit: Focal Foto (Flickr)

The Difficult Reality of Rising Core and Super-Core Inflation

While many market participants are concerned about rate increases, they appear to be ignoring the largest risk: the potential for a massive liquidity drain in 2023.

Even though December is here, central banks’ balance sheets have hardly, if at all, decreased. Rather than real sales, a weaker currency and the price of the accumulated bonds account for the majority of the fall in the balance sheets of the major central banks.

In the context of governments deficits that are hardly declining and, in some cases, increasing, investors must take into account the danger of a significant reduction in the balance sheets of central banks. Both the quantitative tightening of central banks and the refinancing of government deficits, albeit at higher costs, will drain liquidity from the markets. This inevitably causes the global liquidity spectrum to contract far more than the headline amount.

Liquidity drains have a dividing effect in the same way that liquidity injections have an obvious multiplier effect in the transmission mechanism of monetary policy. A central bank’s balance sheet increased by one unit of currency in assets multiplies at least five times in the transmission mechanism. Do the calculations now on the way out, but keep in mind that government expenditure will be financed.

Our tendency is to take liquidity for granted. Due to the FOMO (fear of missing out) mentality, investors have increased their risk and added illiquid assets over the years of monetary expansion. In periods of monetary excess, multiple expansion and rising valuations are the norm.

Since we could always count on rising liquidity, when asset prices corrected over the past two decades, the best course of action was to “buy the dip” and double down. This was because central banks would keep growing their balance sheets and adding liquidity, saving us from almost any bad investment decision, and inflation would stay low.

Twenty years of a dangerous bet: monetary expansion without inflation. How do we handle a situation where central banks must cut at least $5 trillion off their balance sheets? Do not believe I am exaggerating; the $20 trillion bubble generated since 2008 cannot be solved with $5 trillion. A tightening of $5 trillion in US dollars is mild, even dovish. To return to pre-2020 levels, the Fed would need to decrease its balance sheet by that much on its own.

Keep in mind that the central banks of developed economies need to tighten monetary policy by $5 trillion, which is added to over $2.50 trillion in public deficit financing in the same countries.

The effects of contraction are difficult to forecast because traders for at least two generations have only experienced expansionary policies, but they are undoubtedly unpleasant. Liquidity is already dwindling in the riskiest sectors of the economy, from high yield to crypto assets. By 2023, when the tightening truly begins, it will probably have reached the supposedly safer assets.

In a recent interview, Bundesbank President Joachim Nagel said that the ECB will begin to reduce its balance sheet in 2023 and added that “a recession may be insufficient to get inflation back on target.” This suggests that the “anti-fragmentation tool” currently in use to mask risk in periphery bonds may begin to lose its placebo impact on sovereign assets. Additionally, the cost of equity and weighted average cost of capital increases as soon as sovereign bond spreads begin to rise.

Capital can only be made or destroyed; it never remains constant. And if central banks are to effectively fight inflation, capital destruction is unavoidable.

The prevalent bullish claim is that because central banks have learned from 2008, they will not dare to allow the market to crash. Although a correct analysis, it is not enough to justify market multiples. The fact that governments continue to finance themselves, which they will, is ultimately what counts to central banks. The crowding out effect of government spending over private sector credit access has never been a major concern for a central bank. Keep in mind that I am only estimating a $5 trillion unwind, which is quite generous given the excess produced between 2008 and 2021 and the magnitude of the balance sheet increase in 2020–21.

Central banks are also aware of the worst-case scenario, which is elevated inflation and a recession that could have a prolonged impact on citizens, with rising discontent and generalized impoverishment. They know they cannot keep inflation high just to satisfy market expectations of rising valuations. The same central banks that assert that the wealth effect multiplies positively are aware of the disastrous consequences of ignoring inflation. Back to the 1970s.

The “energy excuse” in inflation estimates will likely evaporate, and that will be the key test for central banks. The “supply chain excuse” has disappeared, the “temporary excuse” has gotten stale, and the “energy excuse” has lost some of its credibility since June. The unattractive reality of rising core and super-core inflation has been exposed by the recent commodity slump.

Central banks cannot accept sustained inflation because it means they would have failed in their mandate. Few can accurately foresee how quantitative tightening will affect asset prices and credit availability, even though it is necessary. What we know is that quantitative tightening, with a minimal decrease in central bank balance sheets, is expected to compress multiples and valuations of risky assets more than it has thus far. Given that capital destruction appears to be only getting started, the dividing effect is probably more than anticipated. And the real economy is always impacted by capital destruction

About the Author

Daniel Lacalle, PhD, economist and fund manager, is the author of the bestselling books Freedom or Equality (2020),Escape from the Central Bank Trap (2017), The Energy World Is Flat (2015), and Life in the Financial Markets (2014).

Daniel Lacalle is a professor of global economy at IE Business School in Madrid.

How Equity Analysts Can Improve Your Performance in 2023

Image Credit: Kampus Productions (Pexels)

Everything You Always Wanted to Know About Equity Analysts* (*But Were Afraid to Ask)

Determining the potential of a company stock involves more time and perhaps more understanding than the average self-directed investor can provide. Fortunately, there are investment analysts that specialize in equities and spend their days staying current on the industry, individual companies, and the risks associated with the overall market. The investment world is becoming more transparent as the work of these well-educated professionals has become more accessible to DIY investors.

Just what is it that equity analysts do, and how do individual and professional investors benefit from their work?

The Value of Equity Analysts

Equity analysts have a deep understanding of company financials. This begins with formal education, as most true analysts have an accounting background that may include an MBA and, in many cases, the highly esteemed Chartered Financial Analyst (CFA) designation.

In addition to being able to read and pull data for analysis from financials, they understand the industries they cover. This is important because external trends up or down in input prices or competition will impact the whole sector, including the companies they cover. A macro view of what is impacting the industry is foundational to understanding a company within the industry.

For individual investment opportunities, the analysts’ focus is on the equity portion of the capital structure, but understanding debt levels and factors that could impact debt financing is critical to building an overall financial picture. Comparing the financial structure to company goals and initiatives provides information on how realistic they may or may not be based on internal factors.

Using data from the past and present, an analyst will build a model tailored to the specific company. These models are usually detailed spreadsheets with many interconnections between the various categories. The models generally include industry growth trends, the company’s own numbers (past, current, and projected scenarios), and then what-if scenarios. Financial models are a tool used to estimate the valuation of the company, how it changes under various scenarios, and then compare the business to its peers.

Shocking a forecast for different risks is important to assess the overall risk to the forecast.

The main risks impact different industries differently. For example, a healthcare company may be more or less immune to inflation, a mining operation could benefit from it, and a hospitality-based business could be hurt by it. Analysts assess the potential impacts of known risks and weigh them into their evaluation.

Primary Risks

The primary risks impacting any industry could be thought of as Business Risks, the challenges of a particular company’s circumstances. This could include the ability to hire talent, legal changes that could be impactful, natural resource availability, etc.

Market Risk or systemic risk is the idea that a sinking stock market will weigh on all stocks. While an analyst may choose top performers if the price target assigned was from an evaluation under average market growth of X%, an actual experience of negative Y% is a risk to the forecast.

Sovereign Risk has become a much bigger concern as trading partners like Russia, and China has shown us that politics and business policies can greatly impact U.S. trading partners. This risk tends to be greater among large international companies.

Foreign Exchange Risk. An analyst will review the impact of conversion back to the native currency and profit impacts. They may even project whether customers could be lost if the U.S. dollar becomes too costly.

Inflation Risk, what might the impact be on the company under various possible scenarios? A company with a large inventory may actually go through a beneficial period while prices are rising.

Interest Rate Risk is the real threat of inflation because it typically raises the cost of money. If the company is a large borrower and will be rolling maturing debt at new interest rate levels, the analyst will determine how this impacts operating costs and profit going forward.

Liquidity Risk. If a company’s stock is not well followed and trades sporadically, selling shares to raise capital may be severely hindered and, therefore, negatively impact the company’s ability to finance its business plan. What is interesting to note here is that analyst coverage of a company by itself has been shown to improve a stock’s liquidity. This is because more information about companies, even if not positive, helps investors understand the company, its risks, and its value.

Equity analysts benefit investors (retail and institutional) that are looking for information and an evaluation from a professional to weigh against their own evaluation. But they also benefit issuers as their stock may get less attention if there is minimal quality information available.

Direct Access to Management

Analysts essentially have a hotline to the covered company’s CEO and CFO to ask questions and get details of any change within the company or outside change that may impact results. Most investors don’t have this, so relying on analysts takes on even more importance.

Nuances Known to Analysts

The best reason to check the thoughts and forecasts of a seasoned analyst as part of your own due diligence is that every company has so many moving parts. A good analyst will be aware of what a DIY investor won’t know about the company. For example, the veteran analysts that provide research to Channelchek. On an ongoing basis, they have their finger on the pulse of the companies they cover.

There’s an opportunity you will want to take advantage of on Wednesday, December 15. You will meet online the Wall Street Analysts who are behind the research published on Channelchek. During this no-cost meeting, the veteran analysts have been asked to uncover what they are looking at, especially as it relates to companies they are bullish on.

This could be a great kickoff to organizing your portfolio for 2023 as these analysts cover the less talked about and perhaps the most overlooked stocks – stocks with great potential and “nuance” that you may have missed.

Learn more by clicking here, or the banner above.

Paul Hoffman

Managing Editor, Channelchek 

Even Jeff Bezos Suggests Consumers Should Slow Spending, Can Holiday Spending Meet Expectations?

Image Credit: Anthony Quintano (Flickr)

Retailers May See More Red After Black Friday as Consumers Say They Plan to Pull Back on Spending

Retailers are gearing up for another blockbuster holiday shopping season, but consumers burned by the highest inflation in a generation may have other ideas.

Industry groups are predicting another record year of retail sales, with the National Retail Federation forecasting a jump of 6% to 8% over the US$890 billion consumers spent online and in stores in November and December of 2021.

But Jeff Bezos, founder and chairman of the biggest retailer of them all, seems to be anticipating a much less festive holiday for businesses. In November 2022, Amazon said it is laying off 10,000 workers, one of several big companies announcing job cuts recently. Bezos even cautioned consumers to hold off on big purchases like cars, televisions and appliances to save in case of a recession in 2023.

This article was republished with permission from The Conversation, a news site dedicated to sharing ideas from academic experts. It represents the research-based findings and thoughts of Ayalla A. Ruvio, Associate Professor of Marketing and the Director of the MS of Marketing Research program, Michigan State University and Forrest Morgeson, Assistant Professor of Marketing, Michigan State University.

Results from our new survey suggest consumers appear to be already taking Bezos’ advice, as a combination of soaring consumer prices, rising borrowing costs and growing odds of a recession weighs on their wallets. And if our survey results do pan out, it may mean the recession everyone’s worried about happens sooner than expected.

Crisis Behaviors

We conducted our survey in mid-November, about a week before Black Friday, the historical start of the holiday shopping season. The day after Thanksgiving is known as Black Friday because it signals the period when retailers hope to sell enough goods so that their income statement shows “black,” or profit, for the year rather than “red,” which refers to losses.

We asked over 500 consumers a series of questions about their spending plans, concerns and priorities during this year’s holiday season. Participants were split evenly between men and women, and almost two-thirds had a household income of $70,000 or less.

Overall, the most alarming conclusion from our research is that consumers are reporting consumption behaviors typically exhibited during an economic crisis, similar to those observed in 2009 by consultancy McKinsey during the Great Recession.

One data point stands out: An overwhelming 62% said they were concerned about their job security, while almost 35% indicated they were “very” or “extremely” worried about their financial situation.

Here are three behaviors we found in our survey that suggest consumers are behaving as if the U.S. economy is already in a recession.

1. Spending Less

Not surprisingly, cutting spending is the first thing consumers do during economic turmoil.

A study by McKinsey in early 2009 found that 90% of U.S. households cut spending due to the Great Recession, with 33% of consumers indicating a significant cut.

Similarly, respondents to our survey said they plan to spend, on average, around $700 this holiday season, substantially lower than the roughly $880 consumers spent during each of the past three seasons – including early in the pandemic in 2020.

About a third of our sample intended to spend “slightly” or “much” less than in 2021, while 35% said they would spend “about the same” – which from a retailer’s perspective means spending less because last year’s dollars don’t go as far today. The rest said they planned to spend a little or much more.

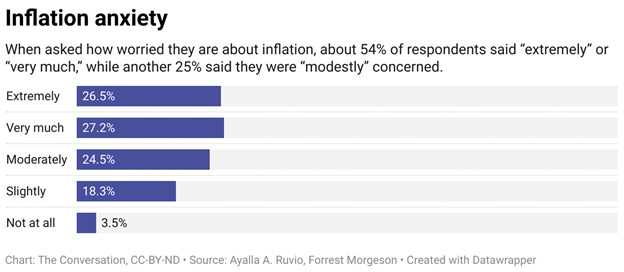
Inflation is one of the key reasons consumers say they are spending less. Almost 80% of respondents said they are either moderately, very or extremely concerned about the surge in prices, and 87% said those concerns would affect their holiday spending behavior, such as by buying gifts for fewer people or purchasing less expensive items.

Some of our respondents even said they were planning to make their own gifts or buy used goods, rather than shop for new items. The secondhand market has boomed  in the last few years, and many shoppers view this option as a way to combat inflationary pressures.

2. Planning Ahead

Another thing consumers do when they sense a troubled economy is they plan their purchases more carefully and maintain self-control over spending.

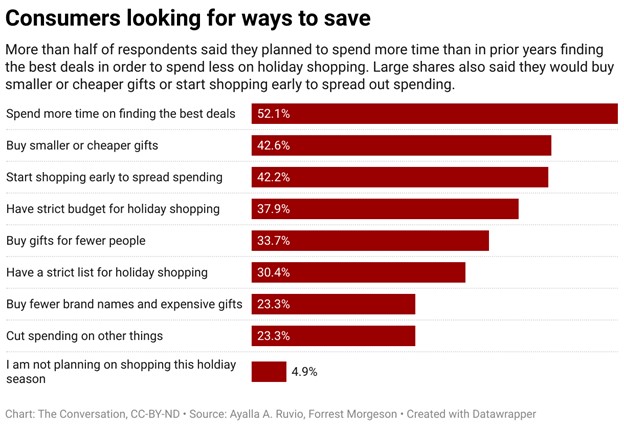
Common strategies include spending more time searching for the best deals, adhering to strict shopping lists, prioritizing necessities and making purchases earlier to spread out their spending – all of which were mentioned by our survey respondents.

We may already be seeing signs of this last strategy. Retail sales for October were up 1.3% from the previous month and up 8.3% from October 2021, which may reflect consumers’ early holiday shopping. If that is the case, this early shopping may result in slumping sales in December.

Also, purchasing early, aided by the plethora of steep discounts offered well in advance of Black Friday, allows consumers to control their shopping behavior better and reduces the risk of impulse buying. Reduction of impulse buying is a strong indicator that consumers are shopping like the economy is in recession.

In our survey, we found that over 50% of participants said that they would be using savings to cover the cost of holiday spending, with many stressing that they would pay with cash. Using cash as a primary form of payment is the main tool consumers have to control spending.

Only 15% of our respondents said that they would use buy-now-pay-later options, which to us is another sign that consumers are preferring cash over forms of credit that creates a new debt.

3. Hypersensitivity to Price

During economic crises, consumers become hypersensitive to prices, which trump most other considerations in the minds of consumers.

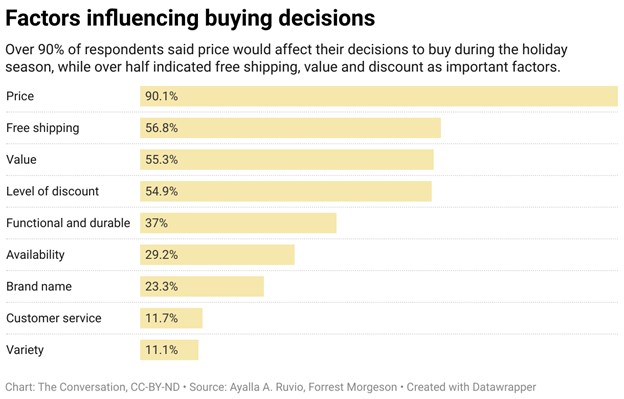
A whopping 90% of our respondents confirmed that price is their major consideration when shopping during the holidays this year. Other elements of price sensitivity are free shipping, product value and the level of discount, if any.

The singular focus of consumers on price gives retailers a wide range of potential responses, including promoting house brands and private labels that are perceived as having greater value for money. In fact, according to the 2009 McKinsey report, one of the biggest shifts in consumer behavior during and after the 2008 recession was the switch in preference from high-priced premium brands to value brands that tend to have lower prices but still decent quality. During an economic slowdown, consumers typically stop buying brands they are not strongly connected with or loyal to.

Consumers in our survey said buying brand names will be one of the least important influences on their purchases this season.

While economists debate whether a recession is coming, or even whether the U.S. is already in one, our data suggests consumers are beginning to behave like one is already here. That risks becoming a self-fulfilling prophecy as consumers tighten their belts.

To Sell or Not to Sell (Your Stocks)

Image Credit: QuoteInspector.com (Flickr)

Advice is Plentiful on When to Buy Stocks, But When Should You Sell?

During the fourth quarter of 2022, stocks have climbed dramatically. The Russell 2000 small cap index is up double-digits in percentage, and the S&P 500 is approaching a ten percent increase. This is a welcome run-up over such a short period of time. The sudden move has investors, some of whom still hold paper losses, asking themselves, do I sell now, do I add to my positions, or should I sit tight and wait?

Information on when to buy into a position is abundant. Advice on when to decide your assets are better off elsewhere is much less available. There is just less demand from readers on the topic.

Selling Considerations

First off, one does need to consider their financial plan. Is this money that is needed within the next few months, or can the value of the position or positions change without much impact on future plans? Also, is there a better use for the proceeds? If the position one is holding is still the best use of funds, then the answer, net of any emotions, may be to hold.And emotions can make for bad decisions.

Some investors that were about to pull the trigger on the sale of a position weeks ago when stocks were falling may find their position has regained much of the loss, but now they are back in greedy mode, hoping for more, despite being able to get more.

Let’s take a level-headed look at the factors involved in making the decision regarding selling.

Opportunity Cost

One fundamental question should ask themselves regularly is, do I think the risk-reward of each position and all positions taken together are best for the portfolio? If not, depending on tax consequences, if it’s determined that other opportunities might perform better, then it should be of little concern if the stock is up or down from where it was purchased. In fact, depending on what kind of investor you are, it may make sense to lighten up with the plan to re-evaluate if prices fall again.

One way to get a handle on this is to determine, does the stock underperform in a rising market. Does it fall at a faster pace than the market when the market is falling? The answers to these questions can help identify if the position should be cut loose and may be replaced by a better performer.

Moving Averages

Investors can look to moving averages for a hint as to whether the position might be overbought or oversold. Which moving average you use should be based on the expected holding period and also what works best for the stock you are reviewing. For a seldom traded portfolio with longer-term positions, its common to use a 200-day moving average, but depending on the stock’s past performance, the investor may wish to overlay different averages to guide their thoughts on whether the stock might give back recent gains and fall back in line with past performance.

Time Horizon

Many investors skip the step of determining the expected holding period before a purchase of an investment. This is like leaving for a trip without any directions to get you started. If you didn’t do this before your purchase, do it now. Ask, when do you think this will pay-off, what is the anticipated pay-off, and how do I identify if something has changed and the holding period should change? Investors with a long-term time horizon could find that over the years, they can avoid missing the up periods if they don’t get too intent on missing down periods. If your holdings closely follow the S&P 500 index, it may be down 18% this year, but last year it was up nearly 27%, and that could be a compounded increase from the 16% it was up the prior year.

If instead, your holding period is short, you may know within weeks, days, or minutes if you met your goal or if it is not playing out as expected. At that point, if you would not enter the position (whether you made money or not), getting out may be wise. Smart traders know that if they don’t stick to their plan, even if rewarded, they might be reinforcing a bad behavior that will cost them down the road.

Other Considerations

A large percentage of portfolios managed by self-directed investors are qualified accounts; that is, they are tax-deferred, so any gain does not cost the account holder until funds are taken from the account. This largely takes the tax impact question out of the decision to sell or not. However, if it is a taxable portfolio, it’s important to consider whether the tax consequences and the sale are still worthwhile. In some cases selling at a loss may even help offset gains in some other area of the portfolio owner’s financial condition.  

It’s wise to consult a tax professional to review your specific financial and tax situation before selling a stock or investment for tax purposes.

If you have made a mistake and purchased the wrong ticker, it isn’t likely the shares fit your parameters and the best time to sell is usually immediately.

Change in Ownership

Sometimes it may make sense to sell a company if it has been acquired or merges with another company. Often before an event like this, the stock price rises well above the overall market movement. The question once again is, is this the best use of one’s investible assets? The new fundamentals and cost-saving synergies between the two companies may place it in a more competitive or more profitable position, in this case, not taking the sudden profit could pay off long term.  

Selling a Portion

Did the stock you are holding just shoot up 5%-10%, and you think it is likely to back-off but don’t want to miss out if the euphoria surrounding it continues? Why not make selling a portion, perhaps with the idea that you will re-enter for that portion if the price does drop? In this way, you stand the chance of capturing some of the original run-up, and while you may miss further upward momentum, you have left yourself the opportunity of buying the shares back at a lower price from which they were sold.

Take Away

The decision on whether or not to sell an investment should be held up against the plan you had when you purchased it. Far too many investors make sensible plans entering a trade, but once in and it is either rising or falling, a less sensible side often takes over. Fear and greed are powerful emotions that can undo a good strategy.

Paul Hoffman

Managing Editor, Channelchek

Sources

https://www.thestreet.com/dictionary/m/moving-average

https://www.thestreet.com/retirement-daily/your-money/consider-tax-loss-harvesting

https://www.bankrate.com/investing/when-to-sell-stock/

Powerball Growing Prize Money is Linked to Fed Tightening

Why the Future Value of the Lottery’s Grand Prize is Significantly Higher than Last Year

There is a link between the current $1.9 billion Powerball prize money and Federal Reserve Chair Jerome Powell – and it is inflating the prize money.

A new billionaire was not minted over the weekend, at least not because of winning the enormous Powerball jackpot prize. So the weekend prize money, plus a small fortune more, is up for grabs at 10:59 PM Monday, November 7. The headline prize money, in this case, $1.9 billion, is the future value of the cash award, which, according to Powerball.com, is $929.1 million. The larger, almost two billion amount, would not have been nearly as large last year. Its sum is much bigger because the Fed has been jacking up interest rates.

To drill down a bit more, the prize calculation uses the 30-year U.S. Treasury bond interest rate to determine the annuity paid to the winner based on the cash lump sum award. The present value of that number, even if on par with a cash award a year ago, would pay a substantially larger annuity. And it is the annuity that is the advertised prize, which draws more and more players as it grows. The more players, the higher the present value or cash prize.

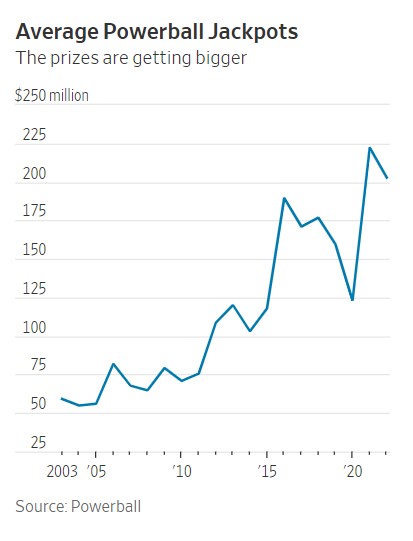
A year ago (November 8, 2021), the 30-year US Treasury bond had a yield of 1.90%. This was used to calculate the headline prize amount. Today, the same term Treasury is yielding 4.27%. This yield impact is roughly reflected in the average prizes over the years.

The Numbers Boiled Down Further

Of all ticket sales, 34% of Powerball ticket sales fund the grand prize. Another 16% fund the lower-tier prizes. (The remaining 50% goes to various state programs, operating costs, and retailer commissions.) If a winner chooses the lump sum payout, they receive the 34%. If instead, the winner chooses the jackpot in annual payments over 30 years, the prize money is invested in a portfolio of bonds.

The last time a winner chose an annuity was in 2014.

Economists who have researched lotteries have learned that once jackpots near the $500 million mark, non-regular lottery players are more likely to take a chance. The $500 million or more mark is where the media begins to make “lottery fever” a news event worth reporting on. The added publicity then feeds more money into the pot.  

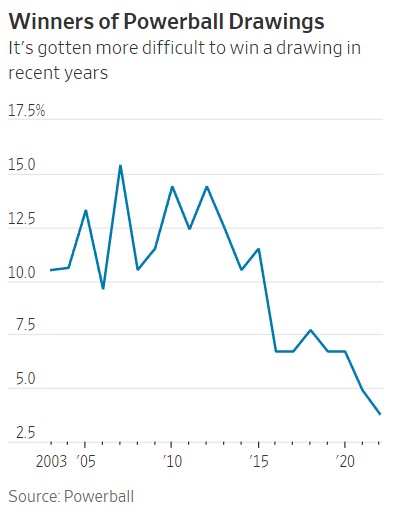
The prize pools are also growing because the games of chance have become statistically more difficult to take the top prize. In 2015, Powerball increased the cost of the ticket and altered the game to make it easier for players to win smaller prizes while reducing the odds of winning the headline prize.

Only 3.8% of drawings so far this year had had a winner, down from roughly 11% in 2014, the last full year before the change went into effect.

This is why the five times in the U.S. where $1 billion has been surpassed have all been recent. They include the biggest one, a $1.58 billion prize from Powerball in 2016, followed by a $1.53 billion Mega Millions jackpot in 2018 and this week’s $1.5 billion Powerball prize.

Lottery tickets also tend to become more popular during economic downturns and when people become more money conscious.

Even though the odds of winning Powerball are 1 in 292.2 million, players will take a shot and buy a ticket to have the fantasy.  If the prize money continues to reach over $500 million on a regular basis, it may work against the program as those who don’t normally play won’t feel it is a special event.

Good luck to those of you holding a ticket.

Paul Hoffman

Managing Editor, Channelchek

Sources:

www.powerball.com

https://www.wsj.com/articles/powerball-jackpot-lottery-federal-reserve-interest-rates-ticket-sales-11667479535?mod=hp_lead_pos12

Will Equity Investors Return Back to the Future?

Image: Statue of Liberty Torch, Circa 1882 – Ron Cogswell (Flickr)

Current Technology May Be Leading the Next Shift in Stock Market Investing

Investor exposure to the stock market has grown and evolved through different iterations over the years. There is no reason to believe that it isn’t evolving still. The main drivers of change have been the cost of ownership, technology, and convenience, which are related to the other two drivers. There seems to be a new transformation that has been happening over the past few years. And with each change, there will be those that benefit and those that fall short. So it’s important for an investor to be aware of changes that may be taking place around them.

Recent History

Your grandfather probably didn’t own stocks. If he did, he bought shares in companies his broker researched, and he then speculated they would out-earn alternative uses of his capital – this was expensive. Mutual funds later grew in popularity as computer power expanded, and an increased number of investors flocked to these managed funds – the price of entry was less than buying individual stocks. Charles Schwab and other discount brokers sprang up – they offered lower commissions than traditional brokers. Mutual funds were able to further reduce fees charged by offering easier to manage indexed funds or funds linked to a market index like the Dow 30 or S&P 500. Indexed exchange-traded funds (ETF) took the indexed fund idea one step further – they have a much lower cost of entry than either mutual funds or even discount brokerage accounts. An added benefit to indexed ETFs is they can be traded at intraday prices and provide tax benefits.

Just as Schwab ushered in an era of low-commission trades, Robinhood busted the doors open to no-commission trades, and most large online brokers followed. This change allows for almost imperceptible costs in most stock market transactions. It also changed the concept of a round-lot, or transacting in increments of 100 shares. In fact, the most popular brokers all offer fractional share ownership now.

Are Index ETFs Becoming Dinosaurs?

Funds made sense for those seeking diversification of holdings, it used to take a large sum of money to do that; investors with a $10,000 account or more can easily achieve acceptable diversification with odd-lots and fractional shares ability.

Today investors can create their own index-like “fund,” or as they called it in your grandparent’s day, “portfolio management.”

One big advantage to creating your own portfolio, even if you rely heavily on stocks from a specific index to choose from, is that you can adapt it more toward your sector or company expectations. Indexed funds are stuck with their index holdings, they have no ability to change. One may increase or decrease risk by leaving out stocks or even whole industry groups. Also, it can be managed with greater tax efficiency than an index fund tailored to your situation.

There is also the DIY thrill that one gets from creating anything themselves rather than to just buying one off the shelf. There have been a number of renowned investors like Peter Lynch and Michael Burry warning that indexed funds no longer provide expected diversification and that many of the stocks are valued higher because so many dollars are on “auto-invest” into indexes that the bad has been pushed up with the good.  

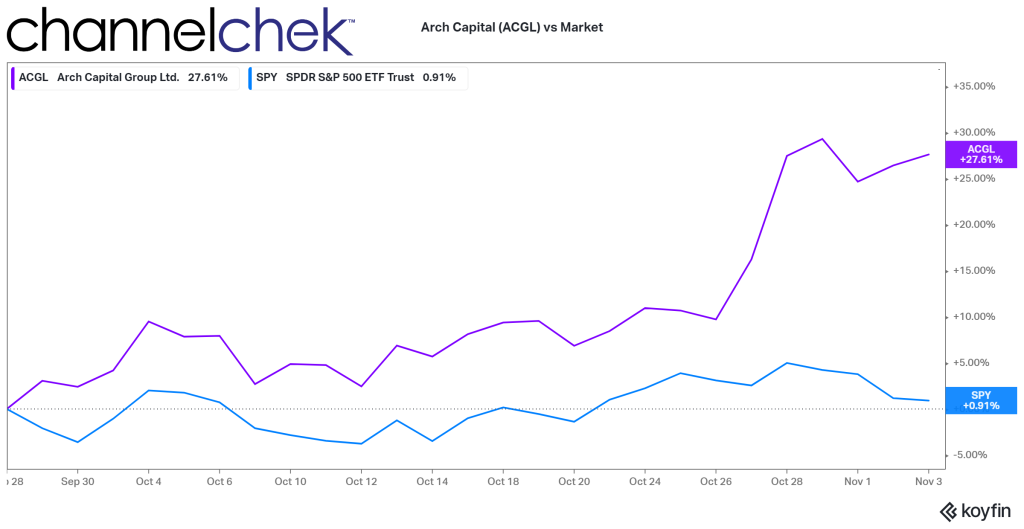
An example of what added demand does to the valuation of a company when being added to an index can be seen over the last month when it became clear that Twitter would be leaving an empty slot that would be filled by Arch Capital (ACGL). The added demand for ACGL pushed up the value by an estimated 25%. Was it undervalued before (when stand-alone), or is it over-valued now? Some stocks that are getting more attention because they are in an index could, as Michael Burry warned, be in bubble territory.

Source: Koyfin

Setting Up a Portfolio

The more you do to ensure your portfolio weightings mimic an index, the closer your performance is likely to be to that index. You may want to limit your holdings to names that are actually in the index and shift the weightings for return enhancement. Another concern often cited with indexes is the way that they weight holdings; you may choose to weight your portfolio using the market capitalization of each company to own the same percentage of the company’s value or use another method like pure cost measures or cost per P/E.

Picking Stocks

While studies suggest that market diversification can be achieved by owning as few as five stocks and doesn’t improve much after 30 holdings, the more you own, providing they aren’t overweighted in a sector, it stands to reason the more diversification protection you can achieve.

As a DIY, self-directed investor, it makes sense not to chase after whatever YouTube influencer, loud-mouthed-TV analyst, or Stocktwit tells you. This is your baby, and the results, good or bad, are yours. Do what you can to make informed decisions, even if some turn out unexpected. The benefit of this is you can lean away from stocks that are still in indexes that don’t have good future prospects and lean into more companies that do.

I’m hearing from more of my self-directed investor friends and investment advisors that more people are looking to own companies that have non-financial objectives they, as an investor, support. And for some of them, there is no standard ESG framework that they support. They have decided, because they do care, to do more portfolio management with individual stocks than before. This is so they can individually look under the hood at employee policies, or environmental stature, etc. While ESG funds exist, the investor or client of the investment advisor would prefer not to own anything they oppose if they can avoid it. What better way than being able to say no to $XYZ company because they do this, this, and this that is against my own fabric?

Channelchek is a great resource for any percentage of your personally managed fund that includes stocks in the small-cap or microcap categories. These stocks could add a bit more potential for return but could also change your risk characteristics. Sign-up to get research from FINRA-licensed analysts.

Take Away

Stock investing has evolved and become more inclusive. But the future may be more like the past, with individuals creating portfolios of stocks for themselves. You don’t have to be rich anymore to buy stocks, and you don’t have to own a fund to get affordable diversification on nearly any size account. There’s a trend toward building one’s own personalized, diversified, low-transaction portfolio. Channelchek is helping investors find possible fits with its free research platform.

Paul Hoffman

Managing Editor, Channelchek

Here is what the FOMC is Looking At

Image Credit: Dan Perl (Flickr)

The Many Factors that Come Into a Fed Rate Decision are Mind Boggling

What do the FOMC members look at as they’re changing interest rates and whipping up new policy stances?

The Federal Open Market Committee, or FOMC, meets eight times a year. There are 12 members; seven are board members of the Federal Reserve System, and five are Reserve Bank presidents, including the president of the Federal Reserve Bank of New York, who serves as president of the committee. The group, as a whole, is arguably among the most powerful entities in the world. What is it that this group, that impacts all of us, focus on? And what specifically will they weigh into their decision at the current meeting?

Labor markets and prices are top on the Fed’s list and specifically part of their mandate. Also feeding into the mandate are contributing factors like housing, growth trends, and risks to monetary policy.

Prices (Inflation Rates)

Inflation remains elevated. In September, the Consumer Price Index (CPI) picked up to 0.4%. Energy prices declined in each month of the third quarter, dropping a cumulative 11.3% since June. The Fed will have to discern if this is sustainable or a function of oil reserve releases that will need replacing. Food prices continued high, although at a slower 0.8% increase during September.  

Core CPI inflation (which strips out energy and food) started the third quarter at a somewhat slow pace—increasing just 0.3% in July. The trend went against the Fed as it rose by 0.6% in both August and September. Price growth for services was the largest contributor to an increase in core CPI in the third quarter.

One of the two mandates of the Federal Reserve is to keep inflation at bay. Chairman Powell has said they are targeting a 2% annual inflation level. While nothing that has been reported in price increases since the last meeting has approached that low of a target, the Fed also has to consider their tightening moves do not work to lower demand (especially in food and energy) rapidly.

The Federal Reserve’s preferred measure of inflation is the PCE price index; this is the measure they use with their 2% target. The PCE price index typically shows lower price growth than CPI because it uses a different methodology in its calculation, but the drivers of both measures remain similar. Over the year ending September, the headline PCE price index rose 6.2 percent, while the core PCE price index was up 5.1 percent.

Jobs (Employment and Wages)

Labor markets are still tight. The economy has added an additional 3.8 million jobs this year through September. This includes 1.1 million during the most recent quarter. During the third quarter, the U.S. economy exceeded pre-pandemic employment levels. The unemployment rate hasn’t budged much, and as of September, the rate held at a comfortable 3.5 percent rate.

The broadest measure of unemployment—the U-6 rate is a measure of labor underutilization that includes underemployment and discouraged workers, in addition to the unemployed. The U-6 rate has also remained behaved all year. It stood at 6.7 percent in September, the lowest rate in the history of the series (starting in January 1994).

When the Fed pushes on a lever for one of its mandates, in this case it is tightening to reign in inflation, it has to watch the impact on its other mandate, in this case, the job market. So far, there is nothing that has occurred on the employment side that should tell the Fed they have gone too far too fast.

.In fact, the labor numbers may suggest they should discuss whether they have moved nearly fast enough. Competition for employees continued as the economy added an additional 3.8 million through September 2022 (1.1 million during the third quarter). Notably, during the third quarter, the economy surpassed pre-pandemic employment levels as of August 2022.

Image: FOMC participants meet in Washington, D.C., for a two-day meeting on September 20-21, 2022, Federal Reserve (Flickr).

Housing Markets

Housing demand decreased in the third quarter as affordability (lending rates + prices), with economic uncertainty weighed on homebuyers. During September, 90% of all home sales were of existing homes. This pace declined 1.5 percent over the month (down 23.8 percent on a twelve-month basis). New single-family home sales dropped a large 10.9% in September; this was the seventh monthly decline.

Homes available for sale have now risen from all-time lows; this includes new and existing.

Over the past few years, home prices have increased dramatically; this was fueled by Fed policy. Prices still remain above longer-term trendlines. The Case-Shiller national house price index measures sales prices of existing homes; this was up 13% over the year ending August 2022. For reference, for the 12 months ended August 2021, prices rose 20%. The prior year they had only increased 5.8%.

Housing plays a huge role in economic health. The Fed is well aware of all the housing-related inputs to the 2008 financial crisis and the part easy money plays in market crashes. Orchestrating an orderly slowdown to the boom in housing is certainly critical to the Fed’s success.

Other Risks to Economy

Eight times a year, information related to each of the 12 Federal Reserve districts is gathered and bound in a publication known as theBeige Book. This summary of economic activity throughout the U.S. is provided approximately two weeks before each FOMC meeting, so members have a chance to evaluate economic activity over the diverse businesses the U.S. engages in.

U.S. Inflation can arise from conditions outside of the control of the U.S. For example Russia’s invasion of Ukraine has added upward pressure to inflation this year. This impact may have to be determined and netted out of calculations and policy as the Fed can’t fight this inflation pressure with monetary policy.  An example would be the Fed can’t alter global food shortages brought on by war.

Dollar strength or weakness comes from many things. One of the most impactful is the difference in interest rates net of inflation between countries and their native currency. If the Fed raises rates when a competing currency has not, there is a chance there will be more demand for the alternative currency, which would weaken the dollar. Further complicating this for the Federal Resreve is a lower dollar is inflationary as it causes import prices to rise, a stronger dollar can reduce domestic economic activity as exports fall. The U.S. dollar has been rising and is now at its strongest in 20 years.

Commodity Prices were elevated in the first half of this year, mostly by energy.  Although there was some relief from gas prices over the summer, energy is expected to rise into the colder months. They may rise further as the U.S. Strategic Petroleum Reserves are used less to control prices, this may be curtailed.  The White House’s two goals of sharply reducing Russian revenue and avoiding further disruptions to global energy supplies while at the same time reducing oil use and production within the U.S. are a tanglement the Fed needs to consider. These can be very impactful to costs and economic activity, yet The Fed has no direct levers to impact these economic inputs.  

World economies play a part in our own economic pace. If the Fed were to tighen aggressively while the global business is slowing, the impact of the tightening might be more pronounced than if the world economies are booming. Demand for goods and services impacts prices; the U.S. doesn’t live in a vacuum, and demand for our production and our demand for foreign production all must weigh on the Feds outlook for global economic health.

According to the IMF’s latest World Economic Outlook, global growth is expected to slow to 3.2 percent in 2022 and just 2.7 percent in 2023.  At the same time, central banks around the world are tightening monetary policy to fight high global rates of inflation.  In addition, there has been financial instability in some major world economies. These rising risks to the global growth outlook may feed back into the U.S. outlook by weakening international demand for U.S. goods and service exports. On the positive economic side, China is considering easing its Zero-COVID policy, which could eventually ease the supply chain impact to inflation. 

Take Away

The original question was, “What do the FOMC members look at as they’re changing interest rates and whipping up new policy stances?” The answer is they have to look at everything. The recent mix of “everything” shows growth and employment in the U.S. have sustained at an even keel. Will previous rate hikes to calm inflation eventually take their toll? This is probably the big question the FOMC will be evaluating. Other domestic issues, including housing and the financial markets, are certainly to be weighed as well – a  market crash of any magnitude could quickly slow economic activity.

The Fed has little control over what goes on overseas but must be aware of and hedge its policy to allow for.

All told, the Federal Reserve has a very difficult job. The report of the new monetary policy stance should hit the wire at 2 pm ET today (November 2).

Paul Hoffman

Managing Editor, Channelchek

Sources

https://www.bls.gov/opub/ted/2021/consumer-prices-increase-6-2-percent-for-the-year-ended-october-2021.htm

www.bea.gov

The Truth About the Fed Pivot Rumors

Image Credit: Camilo Rueda López (Flickr)

A Lack of Fed Pivot Doesn’t Have to Equate to Lower Stock Prices

The Fed is not likely to have suddenly indicated a pivot.

Despite the stock market rally and fresh news stories suggesting the Fed is indicating a more dovish stance, the notion has one problem. There are limits placed on Federal Open Market Committee (FOMC) participants and whether they can grant interviews or give speeches before policy-setting meetings. They can not interact on the subject of policy. The current blackout period began October 22nd and will carry through the November 2nd final meeting day. So, investors may wish to consider other reasons if the stock market is rallying. Earnings, oversold conditions, year-end rally, perhaps news stories created by bloggers or journalists that don’t possess experience or understanding.

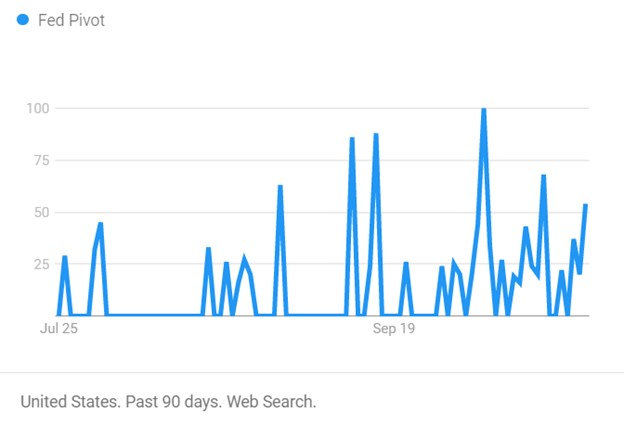
Image: Number of times “Fed Pivot” was searched using Google 

Current State of Tightening

This year the Fed has been tightening aggressively after having brought interest rates down aggressively a couple of years back. For many investors, a tightening cycle, ending with interest rates a safe margin above the inflation rate, is not something they can recall. This is because the Fed has been stabilizing employment during tricky times in a way that has lifted the markets out of whatever trouble there may have been. Rates have been well below the average 6% to 8% range. This has been going on since at least 2008 –  by some measures, way before.

There have been five times since late Spring that investors and TV’s talking heads were convinced the Fed has gone too far and will now begin bringing rates back. So far, all the hoping has done nothing to help; the track record stands at zero for five. While it remains to be seen and heard what to expect from monetary policy starting mid-next week, the current inflation rate and words that the Fed board members have said indicate another 75 bp hike in funds.

Looking Forward

Can this change? We get a look at third-quarter GDP on Thursday. This measures U.S. domestic production. A bad number could cause the Fed to rethink aggressive tightening. However, the expectations are that it will be higher than it has been all year (2.3% growth rate) which gives the Fed even greater ability to hit the brakes. Also, the PCE Price Index, viewed as the Fed’s preferred inflation indicator, is released Friday (6.3% YoY expected).

The Federal Reserve’s, monetary policy does not cater to the stock market. It does consider it because, of the wealth effect. The wealth effect is where consumers feel poorer because of declines in asset values, and while their disposable income may not have changed, they hunker down and spend less. This secondary impact to spending is the only attention the Fed officially pays to stocks.

Interest Rates

Real interest rates are still negative. Imagine buying a bond knowing that despite being exposed to maturity and credit risk, while tying up money, your spending power will almost certainly be less when it matures. This isn’t why people invest; in fact, if that scenario remains and inflation persists, the best use of savings may be to consider any large purchases you think you may incur in the coming few years and make them now. At the moment, inflation hasn’t shown signs of abating, something has to give; bond investors are going to require higher yields, Japan has already experienced a bond-buyer “strike.”

Where Do We Go from Here

For now, the consensus view is that inflation should drift back down to 3% or even lower by 2025. If energy continues to decline, supply-chain issues are resolved, and a strong U.S. dollar persists, the consensus may be correct. But one should be aware there are very bright economists that deviate from the consensus by plus or minus 300 bp or more.  

The markets may have already priced in bad news; rates heading back to normalcy (upward) doesn’t immediately mean a bad stock market. We can easily rally through the end of the year and still experience a sixth time the Fed has refrained from pivoting but instead has made sure its words were cleansed of anything that can be construed as reversing course.

Paul Hoffman

Managing Editor, Channelchek

New Home Size as a Leading Indicator for Recession

Image Credit: Tannert11 (Flickr)

Housing Is Getting Less Affordable. Governments Are Making It Worse

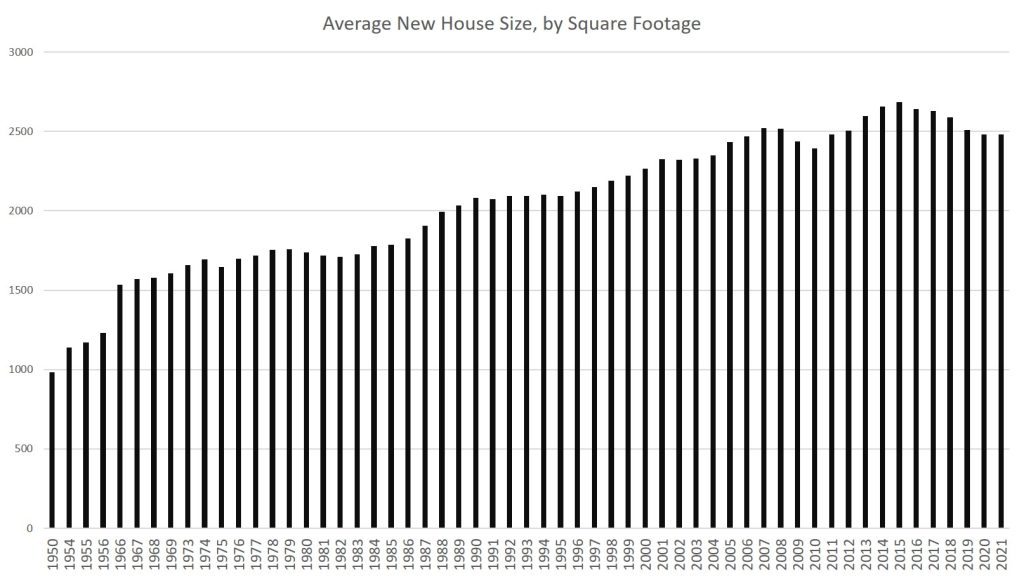
The average square footage in new single-family houses has been declining since 2015. House sizes tend to fall just during recessionary periods. It happened from 2008 to 2009, from 2001 to 2002, and from 1990 to 1991.

But even with strong economic-growth numbers well into 2019, it looks like demand for houses of historically large size may have finally peaked even before the 2020 recession and our current economic malaise.  (Square footage in new multifamily construction has also increased.)

According to Census Bureau data, the average size of new houses in 2021 was 2,480 square feet. That’s down 7 percent from the 2015 peak of 2,687.

2015’s average, by the way, was an all-time high and represented decades of near-relentless growth in house sizes in the United States since the Second World War. Indeed, in the 48 years from 1973 to 2015, the average size of new houses increased by 62 percent from 1,660 to 2,687 square feet. At the same time, the quality of housing also increased substantially in everything from insulation, to roofing materials, to windows, and to the size and availability of garages.

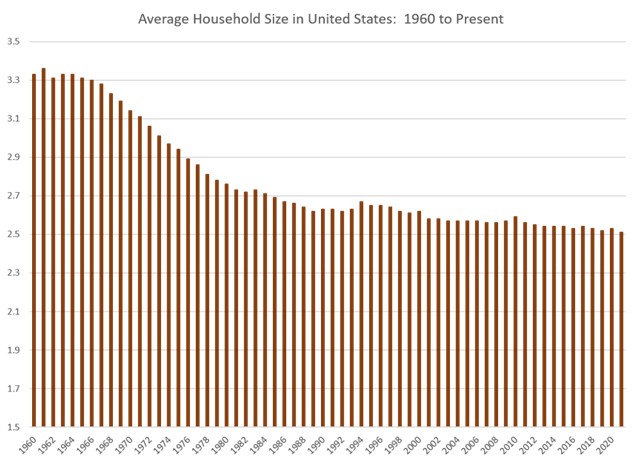
Meanwhile, the size of American households during this period decreased 16 percent from 3.01 to 2.51 people.

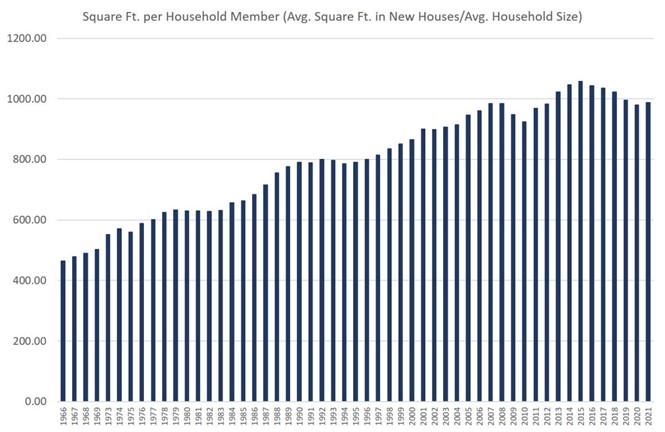
Yet, even with that 7 percent decline in house size since 2015, the average new home in America as of 2021 was still well over 50 percent larger than they were in the 1960s. Home size isn’t exactly falling off a cliff. US homes, on a square-foot-per-person basis, remain quite large by historical standards. Since 1973, square footage per person in new houses has nearly doubled, rising from 503 square feet per person in 1973 to 988 square feet person in 2021. By this measure, new house size actually increased from 2020 to 2021.

This continued drive upward in new home size can be attributed in part to the persistence of easy money over the past decade. Even as homes continued to stay big—and thus stay comparatively expensive—it was not difficult to find buyers for them. Continually falling mortgage rates to historical lows below even 3 percent in many cases meant buyers could simply borrow more money to buy big houses.

But we may have finally hit the wall on home size. In recent months we’re finally starting to see evidence of falling home sales and falling home prices. It’s only now, with mortgage rates surging, inflation soaring, and real wages falling—and thus home price affordability falling—that there are now good reasons for builders to think “wow, maybe we need to build some smaller, less costly homes.”  There are many reasons to think that they won’t, and that for-purchase homes will simply become less affordable. But it’s not the fault of the builders.

This wouldn’t be a problem in a mostly-free market in which builders could easily adjust their products to meet the market where it’s at. In a flexible and generally free market, builders would flock to build homes at a price level at which a large segment of the population could afford to buy those houses.  But that’s not the sort of economy we live in. Rather, real estate and housing development are highly regulated industries at both the federal level and at the local level. Thanks to this, it is becoming more and more difficult for builders to build smaller houses at a time when millions of potential first-time home buyers would gladly snatch them up.

How Government Policy Led to a Codification of Larger, More Expensive Houses

In recent decades, local governments have continued to ratchet up mandates as to how many units can be built per acre, and what size those new houses can be. As The Washington Post reported in 2019, various government regulations and fees, such as “impact fees,” which are the same regardless of the size of the unit, “incentivize developers to build big.” The Post continues, “if zoning allows no more than two units per acre, the incentive will be to build the biggest, most expensive units possible.”

Moreover, community groups opposed to anything that sounds like “density” or “upzoning” will use the power of local governments to crush developer attempts to build more affordable housing. However, as The Post notes, at least one developer has found “where his firm has been able to encourage cities to allow smaller buildings the demand has been strong. For those building small, demand doesn’t seem to be an issue.”

Similarly, in an article last month at The New York Times, Emily Badger notes the central role of government regulations in keeping houses big and ultimately increasingly unaffordable. She writes how in recent decades,

“Land grew more expensive. But communities didn’t respond by allowing housing on smaller pieces of it. They broadly did the opposite, ratcheting up rules that ensured builders couldn’t construct smaller, more affordable homes. They required pricier materials and minimum home sizes. They wanted architectural flourishes, not flat facades. …”

It is true that in many places empty land has increased in price, but in areas where the regulatory burden is relatively low—such as Houston—builders have nonetheless responded with more building of housing such as townhouses.

In many places, however, regulations continue to push up the prices of homes.

Badger notes that in Portland, Oregon, for example, “Permits add $40,000-$50,000. Removing a fir tree 36 inches in diameter costs another $16,000 in fees.” A lack of small “starter homes” is not due to an unwillingness on the part of builders. Governments have simply made smaller home unprofitable.

“You’ve basically regulated me out of anything remotely on the affordable side,” said Justin Wood, the owner of Fish Construction NW.

In Savannah, Ga., Jerry Konter began building three-bed, two-bath, 1,350-square-foot homes in 1977 for $36,500. But he moved upmarket as costs and design mandates pushed him there.

“It’s not that I don’t want to build entry-level homes,” said Mr. Konter, the chairman of the National Association of Home Builders. “It’s that I can’t produce one that I can make a profit on and sell to that potential purchaser.”

Those familiar with how local governments zone land and set building standards will not be surprised by this. Local governments, pressured by local homeowners, will intervene to keep lot sizes large, and to pass ordinances that keep out housing that might be seen by voters as “too dense” or “too cheap-looking.”

Yet, as much as existing homeowners and city planners would love to see nothing but upper middle-class housing with three-car garages along every street, the fact is that not everyone can afford this sort of housing. But that doesn’t mean people in the middle can only afford a shack in a shanty town either — so long as governments will allow more basic housing to be built.

But there are few signs of many local governments relenting on their exclusionary housing policies, and the result has been an ossified housing policy designed to reinforce existing housing, while denying new types of housing that is perhaps more suitable to smaller households and a more stagnant economic environment.

Eventually, though, something has to give. Either governments persist indefinitely with restrictions on “undesirable” housing — which means housing costs skyrocket — or local governments finally start to allow builders to build housing more appropriate to the needs of the middle class.

If current trends continue, we may finally see real pressure to get local governments to allow more building of more affordable single-family homes, or duplexes, or townhouses. If interest rates continue to march upward, this need will become only more urgent. Moreover, as homebuilding materials continue to become more expensive thanks to 40-year highs in inflation—thanks to the Federal Reserve—there will be even more need to find ways to cut regulatory costs in other areas.

For now, the results have been spotty. But where developers are allowed to actually build for a middle-class clientele, it looks like there’s plenty of demand.

About the Author

Ryan McMaken (@ryanmcmaken) is a senior editor at the Mises Institute. Ryan has a bachelor’s degree in economics and a master’s degree in public policy and international relations from the University of Colorado. He is the author of Breaking Away: The Case for Secession, Radical Decentralization, and Smaller Polities (forthcoming) and Commie Cowboys: The Bourgeoisie and the Nation-State in the Western Genre. He was a housing economist for the State of Colorado. 

Household Income That’s Subject to Taxes Declines Next Year

Image Credit: JD Hancock (Flickr)

These Are the New Federal Tax Brackets and Standard Deductions For 2023

Now for the inflation good news. Thankfully, as it relates to federal income taxes, the IRS makes annual adjustments to certain tax provisions. Simply put, the higher the inflation, the more tax credit benefit, which includes tax credits and taxable wages adjusted downward. So, in addition to receiving much higher COLA increases on Social Security payments and earning an interest rate in excess of 9% on U.S. Savings Bonds, those making an income in 2023 are likely to see more take-home pay.

The IRS Numbers Are In

The IRS announced the 2023 inflation adjustments to the standard deduction and other tax provisions for the 2023 tax year. The adjustments affect 60 provisions in the tax code, and leave a few key provisions unchanged.

Highlights of Changes in Revenue Procedure 2021-38

The tax year 2023 adjustments described below generally apply to tax returns filed in 2024.  A higher level of details about these annual adjustments can be found in IRS Revenue Procedure 2022-38PDF.

The standard deduction for married couples filing jointly for tax year 2023 rises to $27,700 up $1,800 from the prior year. For single taxpayers and married individuals filing separately, the standard deduction rises to $13,850 for 2023, up $900, and for heads of households, the standard deduction will be $20,800 for tax year 2023, up $1,400 from the amount for tax year 2022.

 Marginal Rates: For tax year 2023, the top tax rate remains 37% for individual single taxpayers with incomes greater than $578,125 ($693,750 for married couples filing jointly).

The other rates are:

  • 35% for incomes over $231,250 ($462,500 for married couples filing jointly);
  • 32% for incomes over $182,100 ($364,200 for married couples filing jointly);
  • 24% for incomes over $95,375 ($190,750 for married couples filing jointly);
  • 22% for incomes over $44,725 ($89,450 for married couples filing jointly);
  • 12% for incomes over $11,000 ($22,000 for married couples filing jointly).

The lowest rate is 10% for incomes of single individuals with incomes of $11,000 or less ($22,000 for married couples filing jointly).

 The Alternative Minimum Tax exemption amount for tax year 2023 is $81,300 and begins to phase out at $578,150 ($126,500 for married couples filing jointly for whom the exemption begins to phase out at $1,156,300). The 2022 exemption amount was $75,900 and began to phase out at $539,900 ($118,100 for married couples filing jointly for whom the exemption began to phase out at $1,079,800).

 The tax year 2023 maximum Earned Income Tax Credit amount is $7,430 for qualifying taxpayers who have three or more qualifying children, up from $6,935 for tax year 2022. The revenue procedure contains a table providing maximum EITC amount for other categories, income thresholds and phase-outs.

 For 2023, the monthly limitation for the qualified transportation fringe benefit and the monthly limitation for qualified parking increases to $300, up $20 from the limit for 2022.

 For the taxable years beginning in 2023, the dollar limitation for employee salary reductions for contributions to health flexible spending arrangements increases to $3,050. For cafeteria plans that permit the carryover of unused amounts, the maximum carryover amount is $610, an increase of $40 from taxable years beginning in 2022.

 For tax year 2023, participants who have self-only coverage in a Medical Savings Account, the plan must have an annual deductible that is not less than $2,650, up $200 from tax year 2022; but not more than $3,950, an increase of $250 from tax year 2022. For self-only coverage, the maximum out-of-pocket expense amount is $5,300, up $350 from 2022. For tax year 2023, for family coverage, the annual deductible is not less than $5,300, up from $4,950 for 2022; however, the deductible cannot be more than $7,900, up $500 from the limit for tax year 2022. For family coverage, the out-of-pocket expense limit is $9,650 for tax year 2023, an increase of $600 from tax year 2022.

 For tax year 2023, the foreign earned income exclusion is $120,000 up from $112,000 for tax year 2022.

 Estates of decedents who die during 2023 have a basic exclusion amount of $12,920,000, up from a total of $12,060,000 for estates of decedents who died in 2022.

 The annual exclusion for gifts increases to $17,000 for calendar year 2023, up from $16,000 for calendar year 2021.

 The maximum credit allowed for adoptions for tax year 2023 is the amount of qualified adoption expenses up to $15,950, up from $14,890 for 2022.

Brand New for 2023

The Inflation Reduction Act extended some energy-related tax breaks and indexed for inflation the energy-efficient commercial buildings deduction beginning with the tax year 2023. For 2023, the applicable dollar value used to determine the maximum allowance of the deduction is $0.54 increased by $0.02 for each percentage point by which the total annual energy and power costs for the building are certified to be reduced by a percentage greater than 25 percent (but not above $1.07). The applicable dollar value used to determine the increased deduction amount for certain property is $2.68 increased (but not above $5.36) by $0.11 for each percentage point by which the total annual energy and power costs for the building are certified to be reduced by a percentage greater than 25 percent.

Items Unaffected by Inflation Indexing

By statute, these items that were indexed for inflation in the past are currently not adjusted.

The personal exemption for tax year 2023 remains at 0, as it was for 2022, this elimination of the personal exemption was a provision in the Tax Cuts and Jobs Act.

 For 2023, as in 2022, 2021, 2020, 2019 and 2018, there is no limitation on itemized deductions, as that limitation was eliminated by the Tax Cuts and Jobs Act.

 The modified adjusted gross income amount used by joint filers to determine the reduction in the Lifetime Learning Credit provided in § 25A(d)(2) is not adjusted for inflation for taxable years beginning after December 31, 2020. The Lifetime Learning Credit is phased out for taxpayers with modified adjusted gross income in excess of $80,000 ($160,000 for joint returns).

What Else is Impacted

The maximum contribution amount for a 401(k) or similar workplace retirement plan is governed by yet another formula that uses September inflation data. It is estimated that the contribution limit will increase to $22,500 in 2023 from $20,500 this year and the catch-contribution amount for those age 50 or more will rise from $6,500 to at least $7,500.

The child tax credit under current law is $2,000 per child is not adjusted for inflation. But the additional child tax credit, which is refundable and available even to taxpayers that have no tax liability, is adjusted for inflation. It is expected to increase from $1,500 to $1,600 in 2023.

For those that look forward to capping out payments to Social Security, there is bad news. This has also increased. According to the 2022 Social Security Trustees Report, the wage base tax rate is projected to increase 5.5% from $147,000 to $155,100 in 2023.

Costs are rising, but so are deductions. It’s improbable that the reduced taxes will offset skyrocketing inflation, but at least there is one financial category that is helped by the increases.

Paul Hoffman

Managing Editor, Channelchek

Sources

https://www.irs.gov/newsroom/irs-provides-tax-inflation-adjustments-for-tax-year-2023