Was the Recession Transitory?

Image Credit: Andrea Piacquado (Pexels)

Can We Wave Goodbye to Recession Talk Now that Q3 GDP is Positive?

Gross Domestic Product (GDP), the “advance estimate,” has shown we were not in a recession during the third quarter; instead, the economy expanded. This is a dramatic turn-around from the final data for the previous first two quarters of 2022, which show the U.S. economy contracted during each. Since the Spring, in the stock market, bad economic news has been met with buying, and good news has been met with selling. This GDP report has the power to change that back to more normal investor behavior.

The third quarter production report shows the economy expanded at an annual rate of 2.6%  despite nearly 325 basis points of Fed tightening from a base close to zero earlier this year. This report should be great news for the stock market as it shows that a large part of the economy is growing even while stimulus and easy money is being removed. In addition to the headline news related to overnight bank lending rates, each Thursday after the market closes, the Fed releases information on how large its balance sheet is. This balance sheet holdings report can be viewed as how much money they have at work in the system, effectively acting as stimulus. They have been pulling money out at a pace that many expected would also doom growth. It has not, this too should be taken as a positive sign for stock market investors.

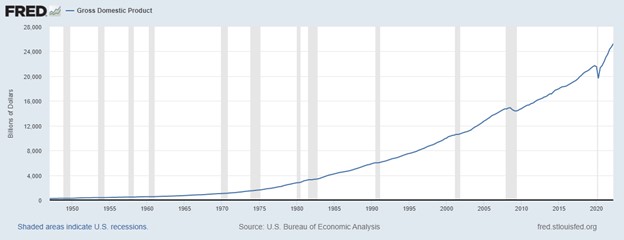
This positive GDP report also helps veterans of the market that did not like playing word games by referring to two-quarters of economic recession (lower case “r”) as something other than a Recession (upper case “R”). This definition had in the past always been automatic, without needing the National Bureau of Economic Research (NBER) to decide when to put a light-shaded bar on our economic timeline charts. We expected that they had the same definition.

GDP Plus Recessions in Gray

Image: Gross Domestic Product Product since 1947-Apris 2022. Gray bars indicate declared recessions.

In 2022 market watchers were all expected to say, “I don’t know what a recession is, I’m not an NBER economist.” This is because, for some reason,, the National Bureau of Economic Research decided not to use the standard metric and definition, it decided instead to be less scientific. The bureau, for the first time declared there is “no fixed rule about what measures contribute information to the process or how they are weighted in our decisions.” In other words, every set of economic conditions is different, and there is no specific threshold that must be met before a recession is declared. We no longer have to even talk about a recession until maybe next year.

Will they declare this quarter an Expansion (upper case “E”)? We’ll see.

Why this GDP Report is Important

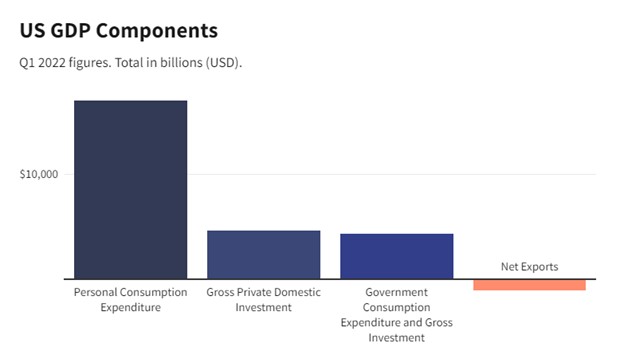
Economic growth of nations is measured as the cost of all goods and services sold and provided from domestic-based resources. After all, wealth comes from output, not increases in currency in circulation. GDP measures this output. As you might imagine, an entire economy’s worth of output is a lot of number crunching by the Bureau of Economic Analysis (BEA). So they do two preliminary numbers before the final. This allows them a couple of months to harvest all the needed data. The final GDP report for this quarter is unlikely to show 2.6% growth as it will have been revised twice, but it is likely to approximate this first look.  

Source: Investopedia

Take Away

Good news (economic strength) has been viewed harshly by the market this year as it has been looked at with an eye toward the Fed needing to be more aggressive. Bad news has been embraced and actually caused market rallies.

The most recent GDP report has the power to change this. Despite the historically aggressive Federal Reserve tightening, the economy has grown. Perhaps fears of a deeper recession will pass, and stocks will regain their historic trend of always reaching new highs.

Paul Hoffman

Managing Editor, Channelchek

Sources
https://www.forbes.com/sites/qai/2022/09/22/when-will-this-officially-be-called-a-recession/?sh=357b1a558a0b

https://fred.stlouisfed.org/series/GDP

https://www.investopedia.com/terms/g/gdp.asp#:~:text=GDP%20can%20be%20determined%20via,approach%2C%20and%20the%20income%20approach.

Small Caps are Bowling Over Large Caps – Here’s Why

Image Courtesy of Bowlero (BOWL)

Tailwinds Causing Investors to Love the Small Cap Sector

Investors have been reeling in U.S. small-cap stocks, and many have experienced the market rewarding them. As the U.S. dollar has been unrelentingly strong in 2022, the cost of products in any other currency has increased, this makes sales more difficult for multinational companies. The lower sales, of course, have the impact of weighing on the profits of U.S. companies that derive a large part of their earnings from overseas trade. This puts the smaller stocks at an advantage.

U.S. Dollar Tailwind

Goods valued in dollars, for example, using The WSJ Dollar Index which measures a basket of 16 currencies against the U.S. currency, are now up 16% on the year. This represents the minimum increase of the cost of products sold after the foreign exchange transaction, before inflation.  

This has little impact on small U.S.-based companies that don’t transact as much or at all outside the U.S. borders. This is because companies in the small-cap S&P 600 generate only 20% of their revenue outside the U.S., compared with large-cap S&P 500 stocks that generate 40% of sales internationally, according to FactSet.

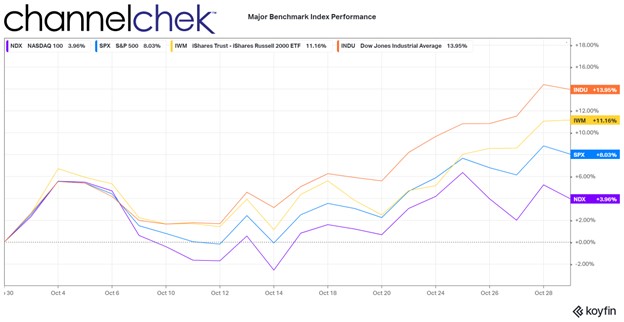
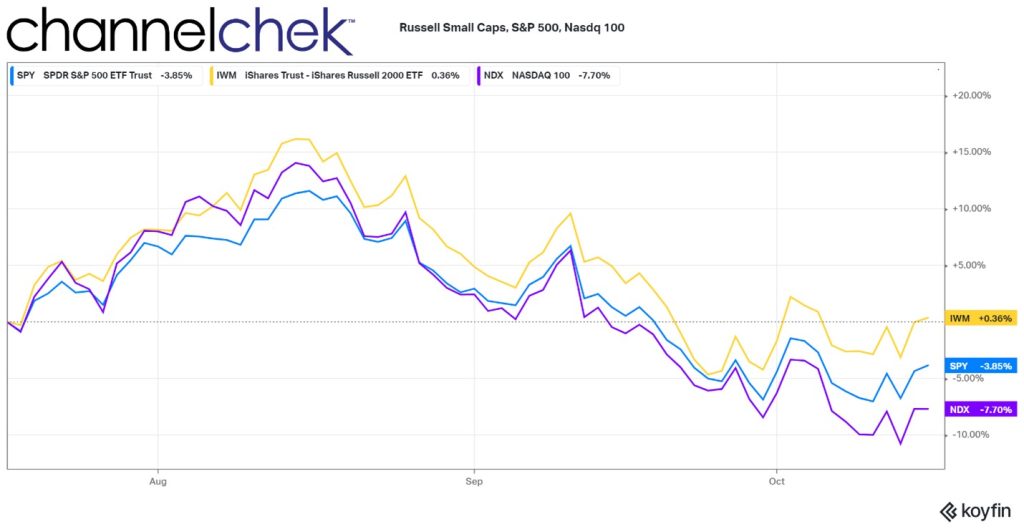
This by itself gives small-cap stocks, in the aggregate, an edge over large-cap indexes like the S&P 500. However, small-caps haven’t been unscathed by the overall negative market sentiment this year. But, in recent months, value investors have been putting more upward pressure on the smaller, more U.S.-centric companies than on companies in the Nasdaq 100 or S&P 500. In fact, the small-cap Russell index is the only one of the three indexes showing green over the past three months. It has also been outperforming in shorter periods like one month, 10 days, and 5 days.

Value Tailwind

Wall Street often uses the ratio of a company’s share price to its earnings (P/E ratio) as a gauge for whether a stock appears cheap or overpriced. The small-cap universe, by this measure, is very attractive relative to themselves in recent years and certainly relative to large-cap valuations now.

The S&P 600 is trading at 10.8 times expected earnings over the next 12 months, according to FactSet as of Friday. That is below its 20-year average of 15.5 and well below the S&P 500’s forward price/earnings ratio of 15.3.

The Russell Small-Cap 2000 is up .36% versus the S&P 500, down 3.85%, and Nasdaq 100, down 7.70%. Not shown on the graph below, the S&P 600 small cap index is flat on the period.

Source: Koyfin

According to Royce Investment’s Third Quarter Chartbook, when comparing the stock market segments, four observations stand out. According to their Market Overview, these are:

1) Small-Cap Value, Small-Cap Core, and Small-Cap Growth are the cheapest segments of U.S. equities, 2) These segments are the only ones that are below their 25-year average valuation,

3) While all three value segments (Small-Cap, Mid-Cap, and Large-Cap) have nearly identical 25-year average valuations, their current valuations are vastly different, and

4) Mid-Cap Growth and Large-Cap valuations still have a long way to fall to reach their 25-year average valuations.

The presumption is with the segments all having the same 25-year average valuations and small-cap being below its average, while mid-cap and large-cap has to go down to reach its mean, that not only is small-cheap, but the other segments are still expensive.

Individually, some of the largest companies in the U.S. have shared their individual risks brought on by fluctuations in the currency market. Nike Inc., Fastenal Co., Domino’s Pizza Inc. and some others have pointed to negative foreign-exchange impacts during recent earnings calls. Microsoft warned of these pressures back in June.

Small-Cap Examples

Some standouts, not necessarily in either the S&P 600 or Russell 2000, small-cap indices, but found on Channelchek are, Bowlero (BOWL), with a market cap of 2.4 billion and performance of up 26.6% over the same three-month period shown in the chart above.  For the same period, Comtech Telecommunications (CMTL), with a market cap of 281.5 million, and some international business, is up 12.6%. And RCI Hospitality Holdings (RICK), with a market cap of $705.9 million, has a three-month return of 45.7%. These examples can be found on Channelchek with complete, up-to-date research, alongside many other actionable opportunities.  

Take Away

If yesterday’s trade isn’t working because of factors working against it, perhaps what wasn’t working yesterday is now coming into favor. The tailwind for smaller companies is coming from a few different places; they include having a higher percentage of domestic customers and also the law of reversion to the mean. The continued headwinds for larger companies include being much more likely to have problems that include foreign customer FX, and valuations that are still sitting above the 25-year average.

When researching small-cap stocks, remember that is exactly what no-cost Channelchek was made for.

Paul Hoffman

Managing Editor, Channelchek

Sources

https://www.royceinvest.com/insights/chartbook/us-small-cap-mrkt-overview/index.html

https://www.wsj.com/podcasts/google-news-update/strong-dollar-boosts-bounceback-of-small-cap-stocks/

Is Leisure the Overlooked Market Sector?

Image Credit: Asad Photo Maldives (Pexels)

Travelers Gonna Travel!– Travel & Leisure Sector May Ignore the Recession

Economic activity in the U.S. contracted during the first half of the year. At the same time, inflation is running at 40-year highs. Investors looking to keep their money productive with reduced risk have focused on consumer staples and companies providing necessary services where demand isn’t impacted much by price. This is what experienced investors do when the economy falters. But this economy seems a bit different than previous periods of shrinking economic activity and rising prices. Jobs are still plentiful, and one industry, with a lot of pent-up demand leftover from the pandemic, is gearing up to exceed all expectations. That sector is leisure. We take a look below at the potential strength in the industry, where opportunities may be found, and how you could reduce timing risk with stocks on your shopping list.

Current State

More than half of Americans see leisure travel as a budget priority right now; in fact, 62% of Americans took at least one overnight trip between mid-May and mid-August. This is according to the latest The State of the American Traveler report compiled by Destination Analysis. Consumers continue to prioritize experiences over alternatives in their budget. As the U.S. Moves out of Fall and into the colder months, it appears the trend will continue. Chuck Artillio is co-owner of SinglesSki.com, winter-oriented travel, and leisure company. He told Channelchek, “Last year at this time, business was robust, yet bookings, as we stand now for the coming season, are already up over 100%.” Artillio added, “I’ve never seen anything like this before.”

The Destination Analysis survey also expects industrywide strength in demand for travel and leisure services in the last quarter of the year. The results show Fall and early Winter trip expectations are high. Over a quarter of Americans expect to take a trip in either October (26.6%), November (24.8%) or December (28.4%). This is up from June when 20% said they expected to take a trip in the fourth quarter of 2022.

Source: US Global Investors

The survey indicates that typical holiday travel includes visiting friends & family as the top driver for late year. However, second on the list of purposes for travel is the desire to return to a destination, followed by general atmosphere, and food & cuisine.

Source: US Global Investors

The survey produced hard data that showed Americans continue to prioritize having fun and relaxation when traveling. This, of course, can mean different things to different people. The majority said being in a quiet/peaceful location (82.5%) followed by beach time (69.7%), chilling-out poolside (67.3%), enjoying culinary experiences (65.6%), and luxury hotel experiences (60.4%).

Do Expectations Provide Opportunities?

An industry research report published this week titled, Entertainment & Leisure Industry Report: Ideas For Your Investing Shopping List, contains some ideas for interested investors. The authors of the leisure industry report include Michael Kupinski, Director of Research at Noble Capital Markets. Overall, Kupinski and Noble’s research associates find the current state of the economy as one that provides a “discount rack” of stocks that can weather a further downturn and may be the first to rise as the recovery seems imminent. He provides information and careful analysis on some stocks that he believes have favorable attributes, go here for in-depth details of these companies.

The analysts suggest investors develop a shopping list and concede that recognizing a turning point in market direction is the “hard part.” But they have suggestions for that as well. These include nibbling at the targets on your list to scale in over a period of time. This averaging in to stocks on your shopping list will lower the risk of picking one day to pile in, which may turn out to be bad timing.

Take Away

Down markets bring opportunity. They always have, and there is no reason to believe this time will be different. Finding sectors with promise, as the travel and leisure sector is now showing, then diving into research to select those in the sector with the most promise, followed by a decision to average in to the market, is one recognized way to put yourself in a position to benefit from the current “discount rack” that many stocks now seem to be on.

Paul Hoffman

Managing Editor, Channelchek

Elon Musk’s Smoking New Product

Image Credit: DonkeyHotey (Flickr)

Elon Musk’s Hair-Brained Ideas are Very Marketable

If your last name was Musk and one of your companies created a perfume, what would you name it? Perhaps Eau de Elon, or S3XY, an outlandish guess would be Neurastink, or simply Elon’s Musk. Here’s a hint, Musk’s perfume is a product of The Boring Company, the company that builds tunnels to enable rapid point-to-point transportation. Before this fragrance thrower, the company’s only other product was a flame thrower. So naturally, the company decided to call their new perfume, Burnt Hair. And it has already sold $1,000,000 worth.

Image: The Boring Company

A bottle of what his company referred to as ‘the essence of repugnant desire,’ will set you back about Ð1,666 or $100 USD. That’s if you buy it online. There is now an Ebay aftermarket where resellers are looking to fetch up to Ð16,666 for the product that was only released this week – 10,000 bottles of Burnt Hair have already been sold as of Wednesday morning.

“Just like leaning over a candle at the dinner table, but without all the hard work” – Boring Company Website

Image: The Boring Company

When he’s not tunneling, launching rockets, reinventing things on four wheels, neuralinking, or tweeting, Musk does keep busy with other strokes of brilliance. Did you know that in 2020 Tesla (TSLA) launched its own brand of tequila? That year Tesla, the world’s most valuable automaker,  also offered limited edition satin short-shorts.

Image Credit: Tesla

It isn’t clear what the inspiration was for this new product entry; developing a perfume that has earned revenue of $1,000,000 within a couple of days of launch is quite a feat, although certainly easier than colonizing Mars, and buying a microblogging social media company. Two things on Musk’s To-Do list that he seems to have fallen behind on.  

The Boring Company product page doesn’t say whether the fragrance is a limited edition item – just in time for Halloween or a long-term offering from The Boring Company. Something more exciting than a company that usually just sells holes in the ground.

Paul Hofman

Managing Editor, Channechek

Sources

https://www.boringcompany.com/burnthair

https://www.reuters.com/lifestyle/oddly-enough/elon-musk-sells-1-million-worth-quirky-new-perfume-burnt-hair-2022-10-12/

https://twitter.com/elonmusk/status/ShortShorts

Reading Between Michael Burry’s Lines

Image Source: @michaeljburry (Twitter)

Michael Burry’s Advice for Companies to Become Better Values

After my morning coffee and check on stock futures, I peruse Twitter. Coffee is necessary when you may need to translate cryptic messages from tweeters like Dr. Michael Burry. This week, the hedge fund manager, famous for his foresight and creativity in shorting subprime mortgages before the mortgage crisis in 2008, has been very active on the microblogging platform. Two tweets from October 5th are newsworthy, considering their source, their insight, and the concern they convey are described below.

The first reads: “Low price/cash flow businesses are different today vs. 2000 because they will buy back stock, buy back debt at a discount, and in general manage capital structure better. Makes them statistical value – math problems that more or less must work out.”

The second says, “Companies that are heavily leveraged but have the cash flow and termed out debt have options today, including reducing their debt loads at a significant discount brought on by higher rates. But as Graham said, in such a case, better off buying the stock.”

Taking these two tweets together, they make sense. Twenty years ago, interest rates were the lowest they had been since 1965; during the last week in December, plummeting 30-year mortgage rates had broken below 6%. Despite cheaper money, corporate treasurers and finance officers didn’t use the situation to shore up their capital structure and build a better base to grow on. The equity markets were weak from August 2000 until May 2009, after the financial crisis that in part came about because of how the cheap money was used.

Companies that are not stretched and are earning money today have the choice of strengthening their financial foundation by either buying their stock at today’s bearish prices. A stock buyback has the effect of reducing shares available in the market as they are now in the company’s treasury. Reduced float tends to increase the price and benefits shareholders. The company does have the option of selling these shares should an opportunity present itself where it would like to raise capital selling previously available shares.

Burry also mentions leveraged companies. Having just come off of 40-year lows in interest rates, it was, in many cases, prudent for companies to leverage themselves with cheap money. These loans, present-valued at today’s higher rates, can be negotiated and paid off at a discount. For companies with adequate cash flow, they may be able to substantially reduce debt for a fraction of the principal amount. Here is how to best get your head around this, if you are a lender and the borrower is paying you 2%, and rates are now 6%, how much less than the borrowed amount would the borrower have to give you in order for you to do better than breaking even? You can lend one-third of the money at 6% and earn the same cash amount. So the borrower is in a great negotiating position.

Michael Burry makes no secret of the fact that he is an avid reader. “Graham” refers to Benjamin Graham the “father of value investing.” Burry reminds us that, according to this historically significant, well-published value investor, investors and companies are generally better off buying back their own stock.

Take Away

There are showmen that are on TV and keep their jobs by keeping viewers glued to their TV sets, and there are others that comment on the market for less-commercial reasons. Those on TV and writing on well-read sites like Yahoo Finance are worth reading to understand what others are reading. Proven, outside the mainstream thinking is worth paying attention to in order to diversify the information your weighing as an investor.

You can even think of it this way; no one pays Burry for advertising on Twitter accounts used by Burry or some other well-followed investors. Whereas mainstream news only exists because of paid-for advertising from companies and industries that they cover. This doesn’t mean he will always be correct, but, who might be less biased?

Paul Hoffman

Managing Editor, Channelchek

Source

Twitter @michaeljburry

Michael Burry Sees Positive in Elon Musks Twitter Stake


Michael Burry Couldn’t Resist Tweeting a Few Words About Twitter’s Largest Shareholder


Hedge fund manager Michael Burry (recognized from the book and movie “The Big Short”) has a substantial following of investors that peruse his firm’s investment positions and analyze his Twitter musings. Last year his firm’s growing short position in Tesla (TSLA) made news. This week he openly applauded Tesla’s CEO Elon Musk after he was appointed to Twitter’s Board of Directors. Burry’s sentiments were in a Tweet to his 676 thousand followers.


Dr. Michael J. Burry

Michael Burry, who is perceived to be temperamental, will often delete
his Tweets
shortly after posting and has frequently deactivated his blue check-marked account. The Scion Asset Management founder, who is also a medical doctor, seems to see things through a different eye and uses social media to vent and express frustration – then, he usually unwinds his posts like a bad trade.

Elon Reeve Musk

Elon Musk is a frequent Twitter user and seems to revel in the attention his posts attract. He is not one to shy from controversy. Some of his posts and comments to his 81 million followers have complained about the social media platform’s content moderation and heavy and uneven handedness.

Burry’s Point of View

When Musk, currently the richest guy in the world, disclosed his 9.2% ownership stake in Twitter, Michael Burry expressed his approval on Twitter under his pseudonym “Cassandra.” The short but controversial Tweet has since been taken down. Musk’s ownership position places him as the largest shareholder of Twitter and warranted an invite to become a Board member, which he accepted.


The hedge fund manager’s response to the news that the Tesla CEO, who’s stock value he once thought was “ridiculous,” may now have a big say in the direction of Twitter was one of approval. Burry used an editorial from The Boston Globe to define his words which read, “Of course @ElonMusk buying enough shares to control Twitter would be good for America. Period.” The Tweet (see image above) has since been deleted.


Tweet from Twitter’s CEO Parag Agrawal


The Editorial

The editorial discusses how the Washington Post and the New York Times once dismissed a report in The New York Post related to the contents of the MacBook hard drive owned by the son of then-presidential candidate Joe Biden. Twitter, during the election, restricted the New York Post story from being circulated on its platform. Twitter went as far as to suspend the account of The New York Post related to the news.


Excerpt from Boston Herald, April 3, 2022


As the Boston Globe editorial points out, the Washington Post and New York Times are now admitting the laptop hard drive was genuine (18 months later). The feeling Burry seems to be expressing is that a more open social media platform would not have censored this story, and less censorship is positive for the country.

Dr. Burry seems to believe that Elon Musk will help steer the company toward a freer exchange of ideas and information.

Paul Hoffman

Managing Editor, Channelchek


Suggested Reading


Michael Burry Adjusts Tesla Position


Why Michael Burry has Better Opportunity Than Cathie Wood


Is the Index Bubble Michael Burry Warned About Still Looming?


Twitter Gets a New Board Member Who Instantly Causes Stock to Rocket


Sources

https://nypost.com/2022/04/06/big-short-investor-elon-musks-twitter-buy-good-for-america/

https://markets.businessinsider.com/news/stocks/big-short-michael-burry-twitter-elon-musk-tesla-hunter-biden-2022-4

https://www.bostonherald.com/2022/04/03/editorial-the-hunter-biden-train-wreck-rolls-over-times-post/

https://www.businessinsider.com/twitter-new-york-post-hunter-biden-article-lawfully-restricted-fec-2021-9

https://twitter.com/michaeljburry/status/1511136888664510464

https://twitter.com/elonmusk/status/1460370293978013699

https://nypost.com/2022/03/30/washington-post-admits-hunter-biden-laptop-is-real/


Stay up to date. Follow us:


Pros and Cons of a Company Like Berkshire Hathaway in your Portfolio


Image: BuffettNews.com


Berkshire Hathaway’s Annual Report Highlights Pros and Cons of Investing in a Giant


There were a few surprises in Warren Buffett’s annual letter to shareholders released Saturday, the least of these will probably garner a good deal of attention at the Berkshire Hathaway Shareholder Meeting. As announced by Mr. Buffett in the letter, “’Cousin” Jimmy Buffett has designed a pontoon “party” boat that is now being manufactured by Forest River, a Berkshire subsidiary. The boat will be introduced on April 29 at our Berkshire Bazaar of Bargains. And, for two days only, shareholders will be able to purchase Jimmy’s masterpiece at a 10% discount. Your bargain-hunting chairman will be buying a boat for his family’s use. Join me.” Other, more critical but less fun surprises are covered below.


Impact of interest Rates on Berkshire

Berkshire’s balance sheet includes $144 billion of cash and cash equivalents. Of this sum, $120 billion is held in U.S. Treasury bills. US T-bills are structured to mature in one year or less. At least two things are worth noting from this. First, T-bills as of February 25th are yielding from .03% in a one-month maturity, to 1.13% out a full year. Most expect the Fed to tighten during 2022, with some forecasters expecting as many as eight 25bp to 50bp (0.25% to 0.50%) increases each. If the Fed does tighten by only 25bp eight times it will likely serve to raise the T-bill curve levels up 2% or more. A 2% increase on the “risk free” rate would add $2.4 billion to Berkshires bottom line.  In 2021 Berkshire Hathaway reported revenue of $90 billion. The interest rate hike would be meaningful to the companies earnings. The other interesting fact worth paying attention to is that the amount Berkshire Hathaway owns in U.S. Treasuries is equal to 0.50% of the publicly held national debt of the U.S. If Berkshire should go on a buying spree and not roll their maturing T-bills, this by itself could cause upward pressure on U.S. interest rates. 

The CEO’s letter to shareholders made clear that, although they have committed to holding $30 billion in cash, they would prefer not to have as much excess cash available as they do. There is also a concern when looking to invest in public entities that interest rates that are low push the prices of all productive investments upward, whether these are stocks, real estate, farms, oil wells, etc.. Buffett writes, “Other factors influence valuations as well, but interest rates will always be important.”


Why Not Repurchase Shares?

Buffett explains there are three ways to increase investor value. First and most important is to increase the long-term earning power of Berkshire’s controlled businesses through internal growth or by making acquisitions. Currently, internal opportunities deliver better returns than acquisitions. Berkshire’s resources are far greater than available opportunities. The second method is buying stock in good companies.  While there are times when there are many attractive opportunities, Buffett writes, “Today, though, we find little that excites us.”

So, if Berkshire Hathaway is such a good investment, why not repurchase shares and allow the company to multiply its benefit to itself? In answering this question, Buffett says about share repurchase, “Through that simple act, we increase your share of the many controlled and non-controlled businesses Berkshire owns. When the price/value equation is right, this path is the easiest and most certain way for us to increase your wealth.” During the past two years, Berkshire did repurchase 9% of their outstanding shares.  Buffett says, “I want to underscore that for Berkshire repurchases to make sense, our shares must offer appropriate value. We don’t want to overpay for the shares of other companies, and it would be value-destroying if we were to overpay when we are buying Berkshire.”

Take-Away

The success of Berkshire Hathaway and the “Oracle of Omaha” that remains at the helm are worth watching if you’re an investor at any level. In addition to the decades of success, there is another story of big versus small or even young versus old. It’s the story of a company too large to efficiently benefit from its success. While their decision-making capacity may be second to none, much of their massive “firepower” remains underutilized. This makes Berkshire Hathaway worth considering as a core long-term holding in much the same way one invests in a large balanced mutual fund focused on stable growth. Investors that seek companies with maximum efficiency and capital deployment with far more growth potential should consider allocating at least a portion of their investments to smaller well researched companies. The data and research within Channelchek focus exclusively on small and microcap companies that aren’t burdened by billions in underperforming assets. Sign-up for daily emails and access to top-tier research.


Paul Hoffman

Managing Editor, Channelchek


Suggested Reading


It’s Officially Warren Buffett Season – Hints on What to Expect


Long Term Retirement Money and Fledgling Companies


Is GDP Growth Transitory and Inflation Persistent?


Why Goldman Says to Buy the Dip


Sources

https://datalab.usaspending.gov/americas-finance-guide/#_blank

https://www.cnbc.com/2022/02/26/read-warren-buffetts-annual-letter-to-berkshire-hathaway-shareholders.html

https://www.forestriverinc.com/Our-Products/Pontoon-Boats

https://omaha.com/business/warren-watch-buffett-cousins-warren-and-jimmy-share-an-on-air-moment/article_40fec2ad-c1c3-5d12-9c1b-8b6319e73670.html


Stay up to date. Follow us:


Persuasion, Trust, and Money


How Anna Sorokin “Inventing Anna” and Others Easily Con Smart Strangers


Maybe she had so much money she just lost track of it. Maybe it was all a misunderstanding.

That’s how Anna Sorokin’s marks explained away the supposed German heiress’s strange requests to sleep on their couch for the night, or to put plane tickets on their credit cards, which she would then forget to pay back.

The subject of a new Netflix series, “Inventing Anna,” Sorokin, who told people her name was Anna Delvey, conned over $250,000 out of wealthy acquaintances and high-end Manhattan businesses between 2013 and 2017. It turns out her lineage was a mirage. Instead, she was an intern at a fashion magazine who came from a working-class family of Russian immigrants.

Yet the people around her were quick to accept her odd explanations, even creating excuses for her that strained credulity. The details of the Sorokin case mirror those from another recent Netflix production, “The Tinder Swindler,” which tells the story of an Israeli conman named Simon Leviev. Leviev persuaded women he met on the dating app to lend him large sums of money with similarly unbelievable claims: He was a billionaire whose enemies were trying to track him down and, for security reasons, couldn’t use his own credit cards.


This article was republished with permission from   The Conversation, a news site dedicated to sharing ideas from academic experts. It represents the research-based findings and thoughts of Vanessa Bohns, Associate Professor of Organizational Behavior, Cornell University.


How is it that so many people could have been gullible enough to buy the fantastical stories spun by Sorokin and Leviev? And why, even when “[t]he red flags were everywhere” – as one of Sorokin’s marks put it – did people continue to believe these grifters, spend their time with them and agree to lend them money?

As a social psychologist who has written a book about our surprising power of persuasion, I don’t see this as an unusual glitch of human nature. Rather, I view the stories about Sorokin and Leviev as examples of bad actors exploiting the social processes people rely on every day for efficient and effective human communication and cooperation.


Image: Anna Sorokin in Manhattan courtroom


To Trust is to be Human

Despite the belief that people are skeptics by nature, primed to shout “gotcha!” at any mistake or faux pas, this simply isn’t the case. Research shows that people tend to default to trusting others over distrusting them, believing them over doubting them and going along with someone’s self-presentation rather than embarrassing them by calling them out.

Elle Dee, a DJ whom Delvey once asked to pick up a 35,000-euro bar tab, described the ease with which people went along with Delvey’s claims: “I don’t think she even had to try that hard. Despite her utterly unsound story, people were all-too-eager to buy it.”

It still might be hard to believe that people in Sorokin’s circle would willingly hand over their money to someone they hardly knew.

Yet psychologists have watched participants hand over their money to complete strangers for many years across hundreds of experiments. In these studies, participants are told they are taking part in various types of “investment games” in which they are given the opportunity to hand over their money to another participant in the hopes of receiving a return on their investment.

What’s fascinating about these studies is that most participants are cynical about ever seeing their money again – let alone any returns on their investment – and yet they still hand it over. In other words, despite deep reservations, they still choose to trust a complete stranger.

There’s something deeply human about this impulse. Humans are social creatures, and trusting one another is baked into our DNA. As psychologist David Dunning and his colleagues have pointed out, without trust it is hard to imagine endeavors like Airbnb, car shares or a working democracy having any success.


Lies Are the Exception, Not the Norm

Of course, Sorokin’s requests were often accompanied by elaborate explanations and justifications, and you might wonder why so few people seemed to doubt the veracity of her claims. Yet just as trust is a default of human interaction, a presumption of sincerity is a default expectation of basic communication.

This maxim of communication was first proposed by Paul Grice, an influential philosopher of language. Grice argued that communication is a cooperative endeavor. Understanding one another requires working together. And to do that, there must be some ground rules, one of which is that both parties are telling the truth.

In an era of “truthiness” and “fake news,” such a premise may seem absurd and na?ve. But people lie far less than you might think; in fact, if the default assumption were that the person you were talking to was lying, communication would be nearly impossible. If I challenged you on whether you read every book you claimed to have read, or whether the steak you had last night was really overcooked, we’d never get anywhere.

Researchers have found experimental evidence for what is sometimes called the “truth default.” In one series of studies, researchers asked participants to evaluate whether statements were true or false. Sometimes the participants were interrupted so they couldn’t fully process the statements. This allowed the researchers to get at people’s default assumption: When in doubt, would they default to belief or disbelief?

It turns out that when participants weren’t able to fully process statements, they tended to simply assume they were true.


A Reluctance to Accuse

Even if Sorokin’s marks were to doubt her story, it’s unlikely that they would have called her out on it.

The sociologist Erving Goffman’s classic theory of “facework” argues that it is as uncomfortable for us to call someone else out – to suggest they aren’t who they are presenting themselves to be – as it is to be the person called out. Even when people see someone doing something they disagree with, they’re loath to say anything.

Other studies have explored this phenomenon. One found that people hesitate to call others out for using racist language they disagree with or for sexual harassment.

As much as you’d like to believe that if you were in the shoes of Sorokin’s and Leviev’s targets you would have been emboldened to blow the lid off the whole charade, chances are that rather than make things uncomfortable for everyone, you’d simply go along with it.

The tendency to trust, believe and go along with other people’s explanations of events may seem disadvantageous. And it’s true, these inclinations can expose people. But without trust, there is no cooperation; without assuming others are telling the truth, there is no communication; and without accepting people for what they present to the world, there is no foundation on which to build a relationship.

In other words, the very features that look like glitches when exploited are in fact the very essence of what it means to be human.


Suggested Reading


Equity Markets Give a Lesson in Behavioral Psychology


Should Investors Listen to Influencers?


The Micro and Macro of Economics and Human Behavior


Why Zoom Meetings Can Leave You Fatigued


Stay up to date. Follow us:


How Reliable is the Super Bowl Indicator


Image Credit: Fabricio Trujillo (Pexels)


The Super Bowl Indicator, If You’re Long You May Want to Root For the Rams


If you’re choosing between watching
the Olympics or the Super Bowl, this may help. Sunday night around 6pm ET, the
women’s 300M speedskating relay will be competing head-to-head against Bengals
versus Rams. While the Winter Olympics only comes around once every four years
and includes countries from around the world, for investors the annual big football game between the top two cities is considered to be a remarkable harbinger for
market moves.

So if you’re concerned about what the market may do Monday morning and throughout the rest of the year, you may not want to pass up on what’s going on in Los Angeles. Many say the big game has statistical significance to the market returns for the year, and if you’re long stocks, you should be cheering for the Rams, here’s why. The Super Bowl Indicator is considered one of the most consistent market predictors of the stock market. And as most investors today will tell you, the stock market could stand to gain a few yards this year.  After all, even the Dow has returned a negative 2.91% since the beginning of the year.

Football to the Rescue?

In the late 1970s, sportswriter Leonard Koppett discovered a connection between who won the National Football League’s (NFL) championship game and how the stock market did over the following 11 months. Since then, market strategist Robert H. Stovall kept tracking it. Stovall passed away in 2020, but the tradition is alive and well.

At its most basic level, the Super Bowl Indicator predicts that if the winning team is from the National Football Conference (NFC) or was part of the NFL prior to the 1970 merger with the AFL, then stocks will be bullish for the year. If victory instead goes to the team that comes from the AFC, then the market will be bearish over the remainder of the year.

From 1967-2015, the indicator was accurate 40 times out of 49 years. That’s an accuracy rate of 82%. Hard to beat that however, over the past six years, the indicator has given some false readings. As of the 2021 Super Bowl, the indicator lost some of its magic and has been right 41 out of 55 games, that’s a 75% win rate.

During the years 2016 and 2017, when two AFC teams won, the Denver Broncos and the New England Patriots, the market defied the indicator and rose. Then in 2018, when the Philadelphia Eagles won, an NFC team, the market fell.

During the 2019 and 2020 Super Bowls, two more AFC teams won, the Patriots and the Kansas City Chiefs, and we experienced strong markets.

Finally, in 2021 after a five-year stretch where the indicator kept followers out of the market, it sent the correct signal. The Buccaneers, an NFC team, won, and the market rose about 27%.

2022 Super Bowl

The Rams are the team to pick if you’re long, whereas a Bengal win would indicate the market closes in negative territory.

It’s science, right? Sure, the same quality of science as the Santa Claus Rally that didn’t come last year. Or the sell in May folks that walked away and missed the double-digit rally that occurred through October. Or the more recent “January effect” that forgot it was supposed to lift stocks – the Superbowl indicator may be remarkable, but it probably isn’t useful.

The truth is the ability to predict market direction based on the classification of the team that spills the most Gatorade at the end is more fun than functional. What is functional is a portfolio built with solid blocking and tackling using fundamentals. There is no substitute for lining up the right players for your portfolio, then putting them in play when you think they will contribute best to your holdings. Fundamental analysis combined with any number of entry methods is what builds winning portfolios.

When choosing stocks to add to your line-up this year, let Channelchek do some of your blocking and tackling.  Sign-up for research and articles sent to your inbox throughout the day. And if you want to do some more serious scouting, the NobleCon18 Conference in April is free
to investors
.

Paul Hoffman

Managing Editor, Channelchek


Suggested Reading


Does the Fed’s Digital Currency Report Indicate They’re Dropping the Ball?


How Lovers Spend Money on Valentine’s Day


Esports: Show me the Money!


Toilet Paper Sales Unravel as Households are Flush with Paper Goods

Sources

https://en.wikipedia.org/wiki/Leonard_Koppett

https://en.wikipedia.org/wiki/Super_Bowl_indicator


Stay up to date. Follow us:


How Reliable is the Super Bowl Indicator?


Image Credit: Fabricio Trujillo (Pexels)


The Super Bowl Indicator, If You’re Long You May Want to Root For the Rams


If you’re choosing between watching
the Olympics or the Super Bowl, this may help. Sunday night around 6pm ET, the
women’s 300M speedskating relay will be competing head-to-head against Bengals
versus Rams. While the Winter Olympics only comes around once every four years
and includes countries from around the world, for investors the annual big football game between the top two cities is considered to be a remarkable harbinger for
market moves.

So if you’re concerned about what the market may do Monday morning and throughout the rest of the year, you may not want to pass up on what’s going on in Los Angeles. Many say the big game has statistical significance to the market returns for the year, and if you’re long stocks, you should be cheering for the Rams, here’s why. The Super Bowl Indicator is considered one of the most consistent market predictors of the stock market. And as most investors today will tell you, the stock market could stand to gain a few yards this year.  After all, even the Dow has returned a negative 2.91% since the beginning of the year.

Football to the Rescue?

In the late 1970s, sportswriter Leonard Koppett discovered a connection between who won the National Football League’s (NFL) championship game and how the stock market did over the following 11 months. Since then, market strategist Robert H. Stovall kept tracking it. Stovall passed away in 2020, but the tradition is alive and well.

At its most basic level, the Super Bowl Indicator predicts that if the winning team is from the National Football Conference (NFC) or was part of the NFL prior to the 1970 merger with the AFL, then stocks will be bullish for the year. If victory instead goes to the team that comes from the AFC, then the market will be bearish over the remainder of the year.

From 1967-2015, the indicator was accurate 40 times out of 49 years. That’s an accuracy rate of 82%. Hard to beat that however, over the past six years, the indicator has given some false readings. As of the 2021 Super Bowl, the indicator lost some of its magic and has been right 41 out of 55 games, that’s a 75% win rate.

During the years 2016 and 2017, when two AFC teams won, the Denver Broncos and the New England Patriots, the market defied the indicator and rose. Then in 2018, when the Philadelphia Eagles won, an NFC team, the market fell.

During the 2019 and 2020 Super Bowls, two more AFC teams won, the Patriots and the Kansas City Chiefs, and we experienced strong markets.

Finally, in 2021 after a five-year stretch where the indicator kept followers out of the market, it sent the correct signal. The Buccaneers, an NFC team, won, and the market rose about 27%.

2022 Super Bowl

The Rams are the team to pick if you’re long, whereas a Bengal win would indicate the market closes in negative territory.

It’s science, right? Sure, the same quality of science as the Santa Claus Rally that didn’t come last year. Or the sell in May folks that walked away and missed the double-digit rally that occurred through October. Or the more recent “January effect” that forgot it was supposed to lift stocks – the Superbowl indicator may be remarkable, but it probably isn’t useful.

The truth is the ability to predict market direction based on the classification of the team that spills the most Gatorade at the end is more fun than functional. What is functional is a portfolio built with solid blocking and tackling using fundamentals. There is no substitute for lining up the right players for your portfolio, then putting them in play when you think they will contribute best to your holdings. Fundamental analysis combined with any number of entry methods is what builds winning portfolios.

When choosing stocks to add to your line-up this year, let Channelchek do some of your blocking and tackling.  Sign-up for research and articles sent to your inbox throughout the day. And if you want to do some more serious scouting, the NobleCon18 Conference in April is free
to investors
.

Paul Hoffman

Managing Editor, Channelchek


Suggested Reading


Does the Fed’s Digital Currency Report Indicate They’re Dropping the Ball?


How Lovers Spend Money on Valentine’s Day


Esports: Show me the Money!


Toilet Paper Sales Unravel as Households are Flush with Paper Goods

Sources

https://en.wikipedia.org/wiki/Leonard_Koppett

https://en.wikipedia.org/wiki/Super_Bowl_indicator


Stay up to date. Follow us:


2022 Best of


Channelchek is the investment community dedicated exclusively to small and micro-cap companies and their industries. Channelchek is the nation’s top free distribution platform dedicated to providing company-sponsored equity research in the small and microcap sectors.

Were now seeking nominations for The 2022 Best Small and Microcap Blog list and also our 2022 Best Vlog for Small and Microcap Investors list. Both are articles that we will publish in March 2022. 

As we move into the new year, we’d like to recognize other top-tier content in both the written and video mediums that also benefit the informational needs of small and microcap investors.

The deadline for submissions is February 22, 2022.

Our annual “Best of…” lists seek to identify and honor bloggers and vloggers who have achieved positions of trust and influence among investors interested in companies with market caps below $3b.

Nominations may be submitted using the links below.

Any individual or organization can submit multiple nominations. Nominations may also be submitted confidentially, as indicated on the form. 

Channelchek’s editorial team may conduct additional research on nominees and their contributions and followers. We may contact nominators and nominees for more information to support a nomination.

We expect to publish both lists, The 2022 Best Small and Microcap Blog list and also our 2022 Best Vlog for Small and Microcap Investors list, during the month of February 2022.  

Make your nomination now.

 Blog / Newsletter Nomination

 Vlog Nomination

Impact of Physical Nearness on Twitter Posts


Image Credit: Liz Henry (Flickr)


New York City or Los Angeles? Where You Live Says a Lot About What and When You Tweet


The Big Apple versus The Big Orange. The City of Dreams versus The City of Angels. I’m referring, of course, to the ongoing rivalry between New York City and Los Angeles. Hilarious “survey” videos and talk shows will give you one picture of the cities. My colleagues and I decided to take a more serious look at the differences between the cities, so we studied what everyone else was talking about – on Twitter.

We set out to answer a simple research question: Are people who are located near each other likely to tweet about similar things? To do so, we analyzed millions of GPS-enabled tweets across New York City and LA. This type of study – looking at huge amounts of social media traffic by location – is useful for more than tracking pop culture memes in different cities. It could be valuable for understanding many aspects of urban life, including the effects of the COVID-19 pandemic.

If we were considering the case of a single, small community that takes pride in local events, celebrities, and culture, the answer to our research question would be a resounding “yes.” One challenge in comparing two large, international cities is the reality that globalization has led to unprecedented interaction among multiple cultures and peoples, along with Starbucks and McDonald’s seemingly in every city on the planet.

For cities that are international but also take pride in their uniqueness, the key is teasing out the extent to which local qualities or global culture dominate tweeting behavior. We designed our methods to be precise enough to account for the fact that, contrary to the fun videos, New York City and LA are quite similar. Both have high housing costs, famous educational institutions, hospitals, museums and other cultural establishments, and residents who tend to vote Democratic.


Define ‘Close’ and ‘Same’

Our study tackled two problems: There’s no simple definition of “close together,” and it’s difficult to say whether two tweets are about the same topic. We combined several definitions of “close together,” ranging from people located in the same city to the distance in miles between their coordinates, using a common formula from spatial sciences.

It’s more difficult to determine whether two tweets are talking about similar things. Looking for common hashtags might suffice, but unfortunately many people do not use hashtags or use different hashtags when talking about the same thing. To overcome this problem, we used state-of-the-art natural language processing technology. Algorithms developed in this field read and interpret sentences in a manner similar to the way humans do, and they are able to deal with nuance.

We used this technology to group tweets into clusters of topics. We then studied whether tweets falling inside the same cluster were also from people who were close together based on their GPS-enabled tweets. This allowed us to determine, for example, that clusters containing art-related words and phrases tended to arise more often in New York than LA.


Health and Wealth Versus Art and Representing

Even before we looked at who tweets about what, we found tweeting across New York City to be more evenly spread, while in LA, more tweeting happens in wealthier areas, including Calabasas – home to Kim Kardashian – Palos Verdes, West Hollywood and the coastal areas.

We also found that New Yorkers referred to themselves and their city far more often than Angelenos did. On a per capita basis, New Yorkers like to talk about art, while Angelenos like to talk about health care and hospitality.

LA generates more tweets than New York throughout the day, despite having a smaller population, but from 8 p.m. to 5 a.m. local time, the two have comparable numbers of tweets. Tweeting in New York City rises sharply from 8 p.m. to a peak at 9 p.m., whereas tweeting in LA rises steadily from 2 p.m. to a peak at 7 p.m.


Computational Social Science


Our methods are a case study in the growing field of computational social science, which aims to find insights in unique, often large, data sets using artificial intelligence models and algorithms. In contrast, traditional social science tends to rely on surveys and polls to quantify public perception about an issue. Though surveys have some distinct statistical advantages, they can be expensive and time-consuming to use for collecting quality data with good response rates.

For example, Gallup releases new survey data every few months and currently charges US$30,000 for academic licenses. Decades ago, researchers found that monetary incentives increase response rates significantly. Even today, online surveys are often accompanied by lottery-based promises of receiving an Amazon gift card. Researchers are working on combining the benefits of traditional and computational social science.

Zooming into our data, we uncovered some fascinating trends that we hope future research will explore. We found, for example, that on a per capita basis, as crime increases, so do tweets, at least at the level of ZIP codes. Why do high-crime areas tweet more? We don’t know yet, but the trend is consistent across both New York City and LA.


Tweeting, Place and COVID-19

Studying tweeting behavior by location could also be useful for understanding disparate outcomes of large-scale events. For example, our twitter analysis could help shed light on how the COVID-19 pandemic has affected people in different places.

New York City was hit hard by COVID-19 early on, showing that even major cities were affected in different ways by this terrible pandemic. New reporting is now showing that even within cities, socioeconomically disadvantaged communities were disproportionately burdened.

Recently, we released a Twitter data set covering 10 of the largest metropolitan areas in the United States to further study such disparities using computational social science. We are already using our methods across all of these cities to better understand how COVID-19 has affected certain groups, and the levels of expressed vaccine hesitancy among these groups.

Eventually, we hope to use our methods with a large set of international metropolises to study urban behavior.


This article was republished with permission from The Conversation, a news site dedicated to sharing ideas from academic experts.  It was written by and represents the research-based opinions and findings of Mayank Kejriwal Research Assistant Professor of Industrial & Systems Engineering, University of Southern California.


Suggested Reading:

Bond Market Understanding is Again Critical fo Stock Investors

Why Gain-of-Function Research is Being Conducted


Workcations Add a New Class of Traveller

Michael Burry Again Closes His Twitter Account


Stay up to date. Follow us:


Stay up to date. Follow us:

Supermoon Red Blood Lunar Eclipse Its all Happening Tonight – Here is what it Means


image credit: Tomruen/WikimediaCommons, CC BY-SA


Supermoon! Red Blood Lunar Eclipse! It’s all Happening Tonight – Here is what it Means


The first lunar eclipse of 2021 is going to happen during the early hours of May 26. But this is going to be an especially super lunar event, as it will be a supermoon, a lunar eclipse and a red blood moon all at once. So what does this all mean?

The Moon appears 12% bigger when it is closest to Earth compared with its appearance when it’s farthest away


What’s a super moon?

A supermoon occurs when a full or new moon coincides with the Moon’s closest approach to the Earth.

The Moon’s orbit is not a perfect circle as it slowly rotates around Earth. Rfassbind/WikimediaCommons

The Moon’s orbit around Earth is not perfectly circular. This means the Moon’s distance from Earth varies as it goes around the planet. The closest point in the orbit, called the perigee, is roughly 28,000 miles closer to Earth than the farthest point of the orbit. A full moon that happens near the perigee is called a supermoon.

So why is it super? The relatively close proximity of the Moon makes it seem a little bit bigger and brighter than usual, though the difference between a supermoon and a normal moon is usually hard to notice unless you’re looking at two pictures side by side.

The phases of the Moon correspond to how much of the lit–up side you can see from Earth. Orion 8/WikimediaCommons, CC BY-SA


How does a lunar eclipse work?

A lunar eclipse happens when the Earth’s shadow covers all or part of the Moon. This can only happen during a full moon, so first, it helps to understand what makes a full moon.

Like the Earth, half of the Moon is illuminated by the sun at any one time. A full moon happens when the Moon and the Sun are on opposite sides of the Earth. This allows you see the entire lit-up side, which looks like a round disc in the night sky.

If the Moon had a totally flat orbit, every full moon would be a lunar eclipse. But the Moon’s orbit is tilted by about 5 degrees relative to Earth’s orbit. So, most of the time a full moon ends up a little above or below the shadow cast by the Earth.

A lunar eclipse occurs when the Moon passes through Earth’s shadow. Sagredo/WikimediaCommons

But twice in each lunar orbit, the Moon is on the same horizontal plane as both the Earth and Sun. If this corresponds to a full moon, the Sun, the Earth and the Moon will form a straight line and the Moon will pass through the Earth’s shadow. This results in a total lunar eclipse.

To see a lunar eclipse, you need to be on the night side of the Earth while the Moon passes through the shadow. The best place to see the eclipse on May 26, 2021, will be the middle of the Pacific Ocean, Australia, the East Coast of Asia and the West Coast of the Americas. It will be visible on the eastern half of the U.S., but only the very earliest stages before the Moon sets.

The Earth’s atmosphere gives the Moon a blood-red glow during total lunar eclipses. Irvin Calicut/WikimediaCommons, CC BY-SA


Why does the moon look red?

When the Moon is completely covered by Earth’s shadow it will darken, but doesn’t go completely black. Instead, it takes on a red color, which is why total lunar eclipses are sometimes called red or blood moons.

Sunlight contains all colors of visible light. The particles of gas that make up Earth’s atmosphere are more likely to scatter blue wavelengths of light while redder wavelengths pass through. This is called Rayleigh scattering, and it’s why the sky is blue and sunrises and sunsets are often red.

In the case of a lunar eclipse, red light can pass through the Earth’s atmosphere and is refracted – or bent – toward the Moon, while blue light is filtered out. This leaves the moon with a pale reddish hue during an eclipse.

Hopefully you will be able to go see this super lunar eclipse. When you do, now you will know exactly what makes for such a special sight.


This article was republished with permission from The
Conversation
, a news
site dedicated to sharing ideas from academic experts.  Written by
Shannon Schmoll Director, Abrams Planetarium, Department of Physics and Astronomy, Michigan State University


Stay up to date. Follow us:


Stay up to date. Follow us: