Metals & Mining Third Quarter 2021 Review and Outlook
Noble Capital Markets Natural Resources Sector Review – October 2021
Source: Capital IQ as of 09/30/2021
Source: Capital IQ as of 09/30/2021; Company Filings
METALS AND MINING INDUSTRY OUTLOOK
Metals & Mining Third Quarter 2021 Review and Outlook
Precious metals miners had a rough quarter.
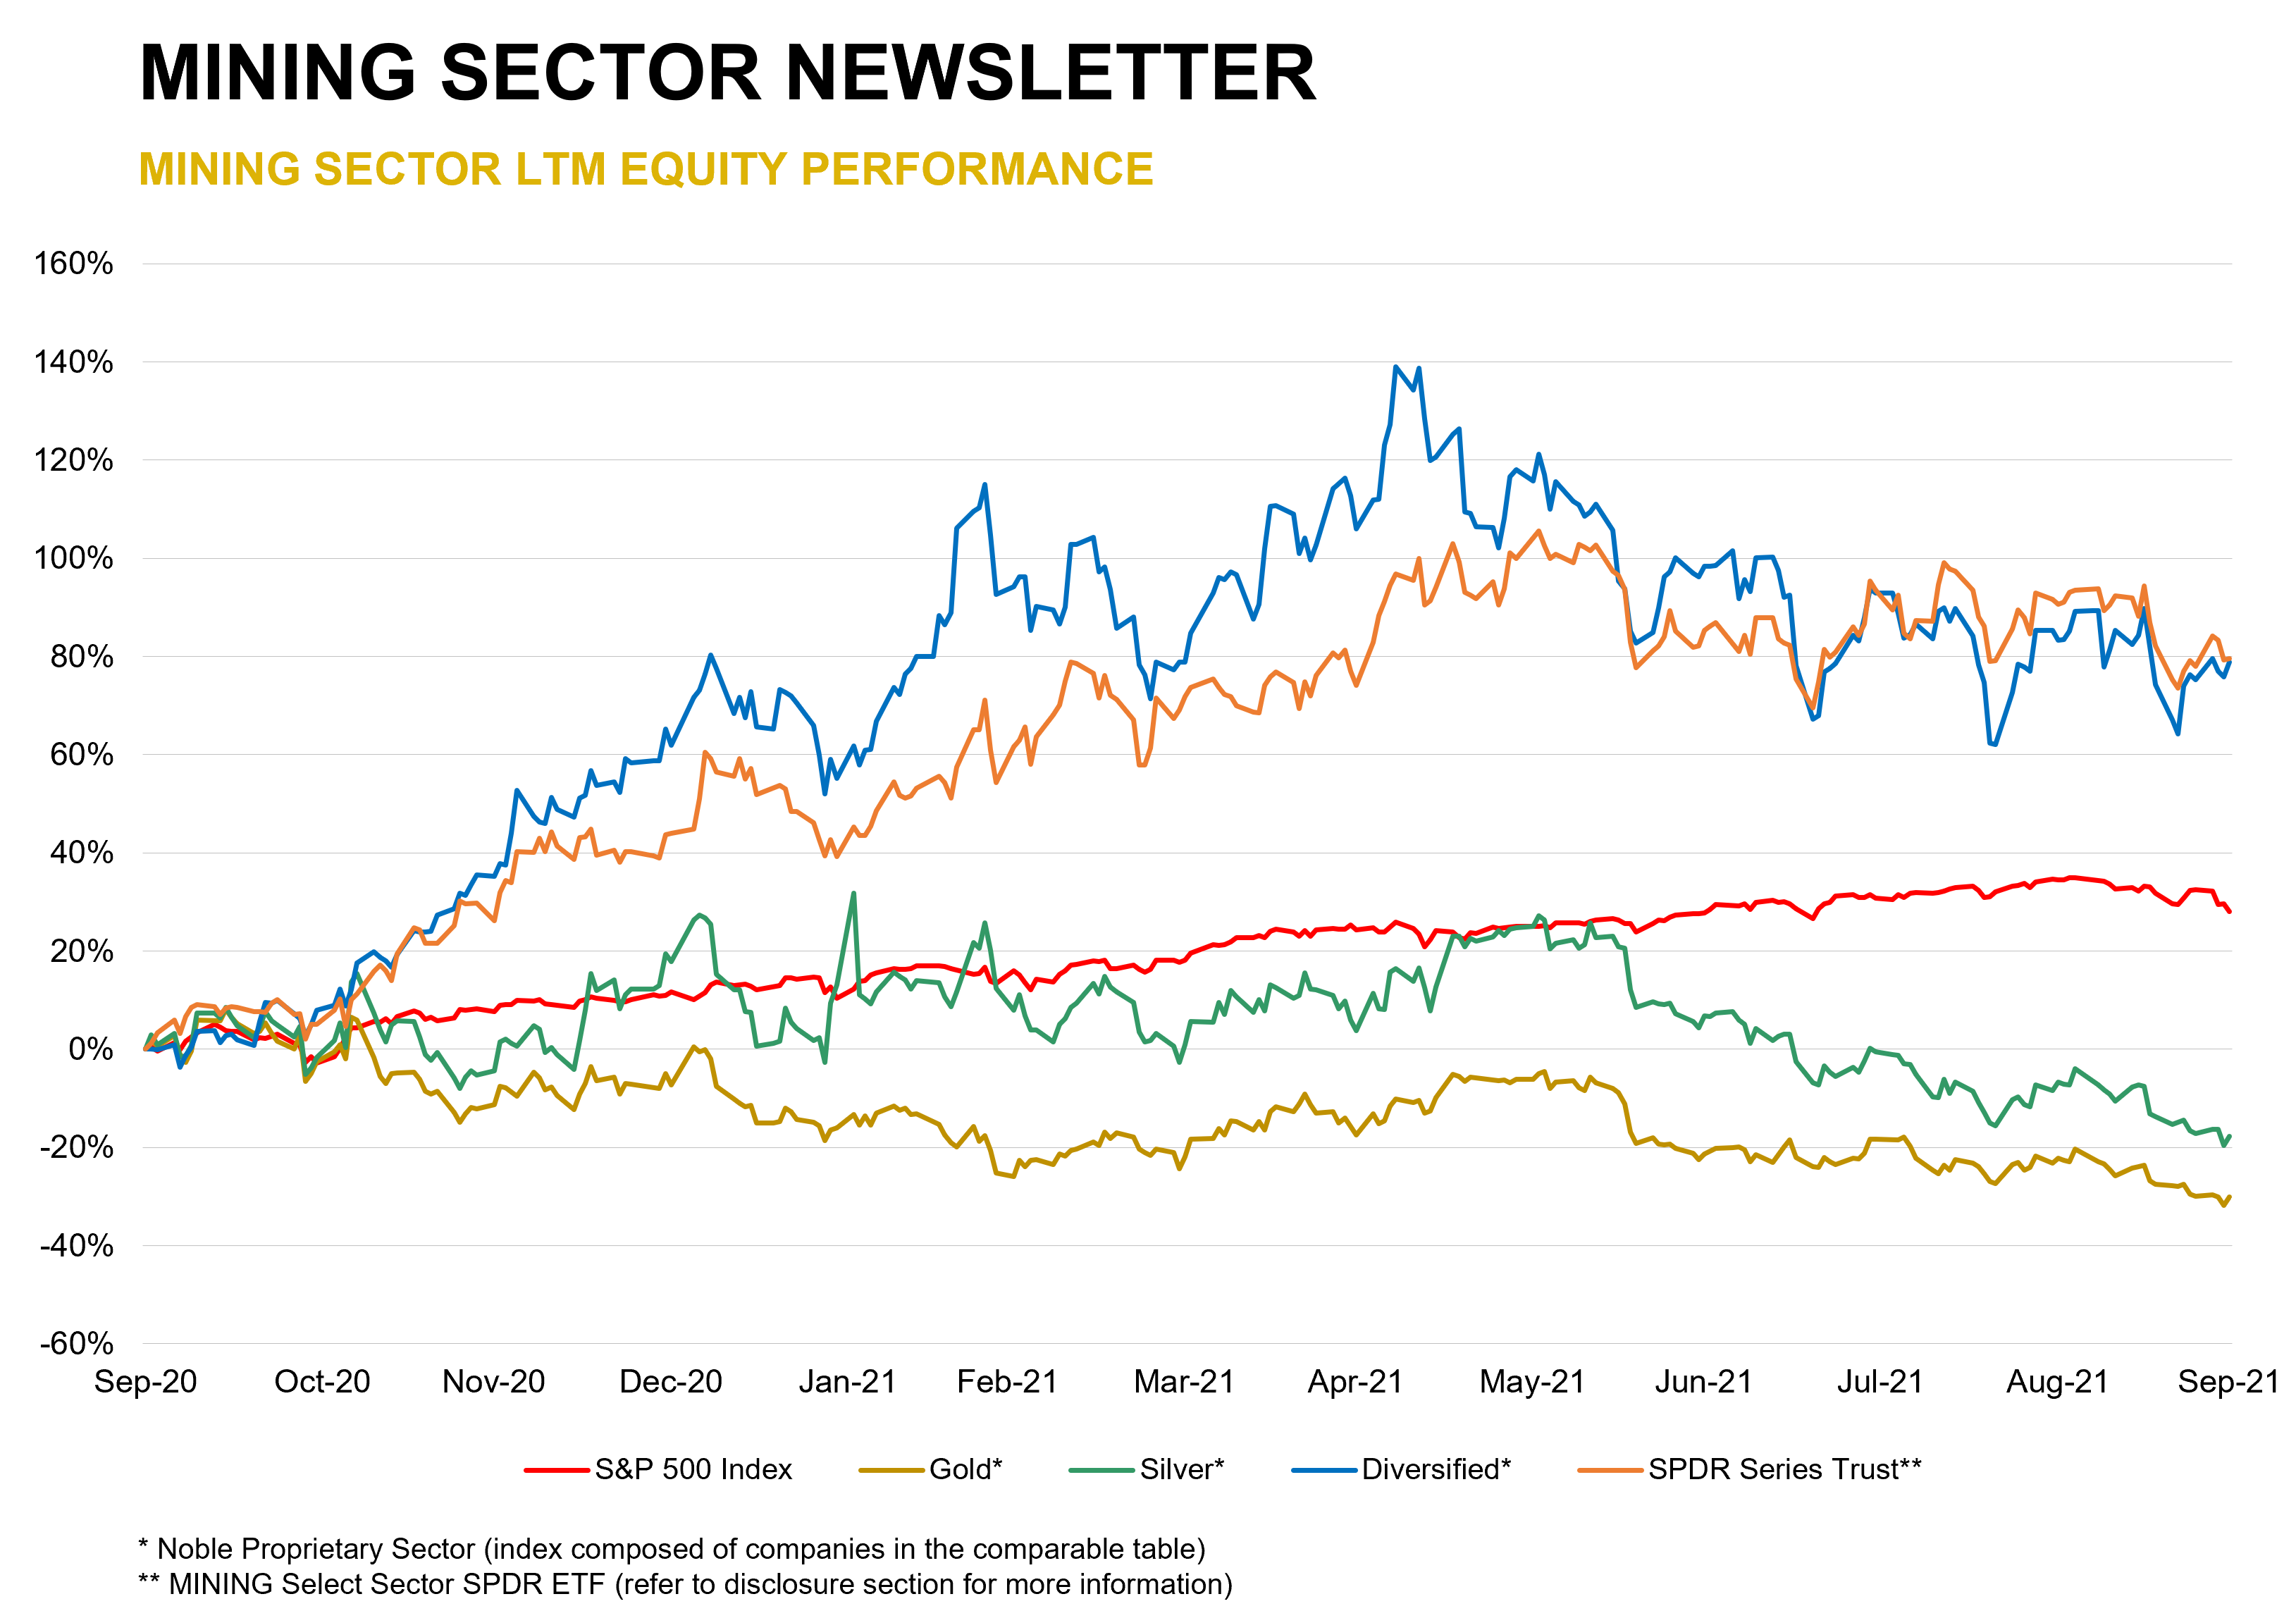
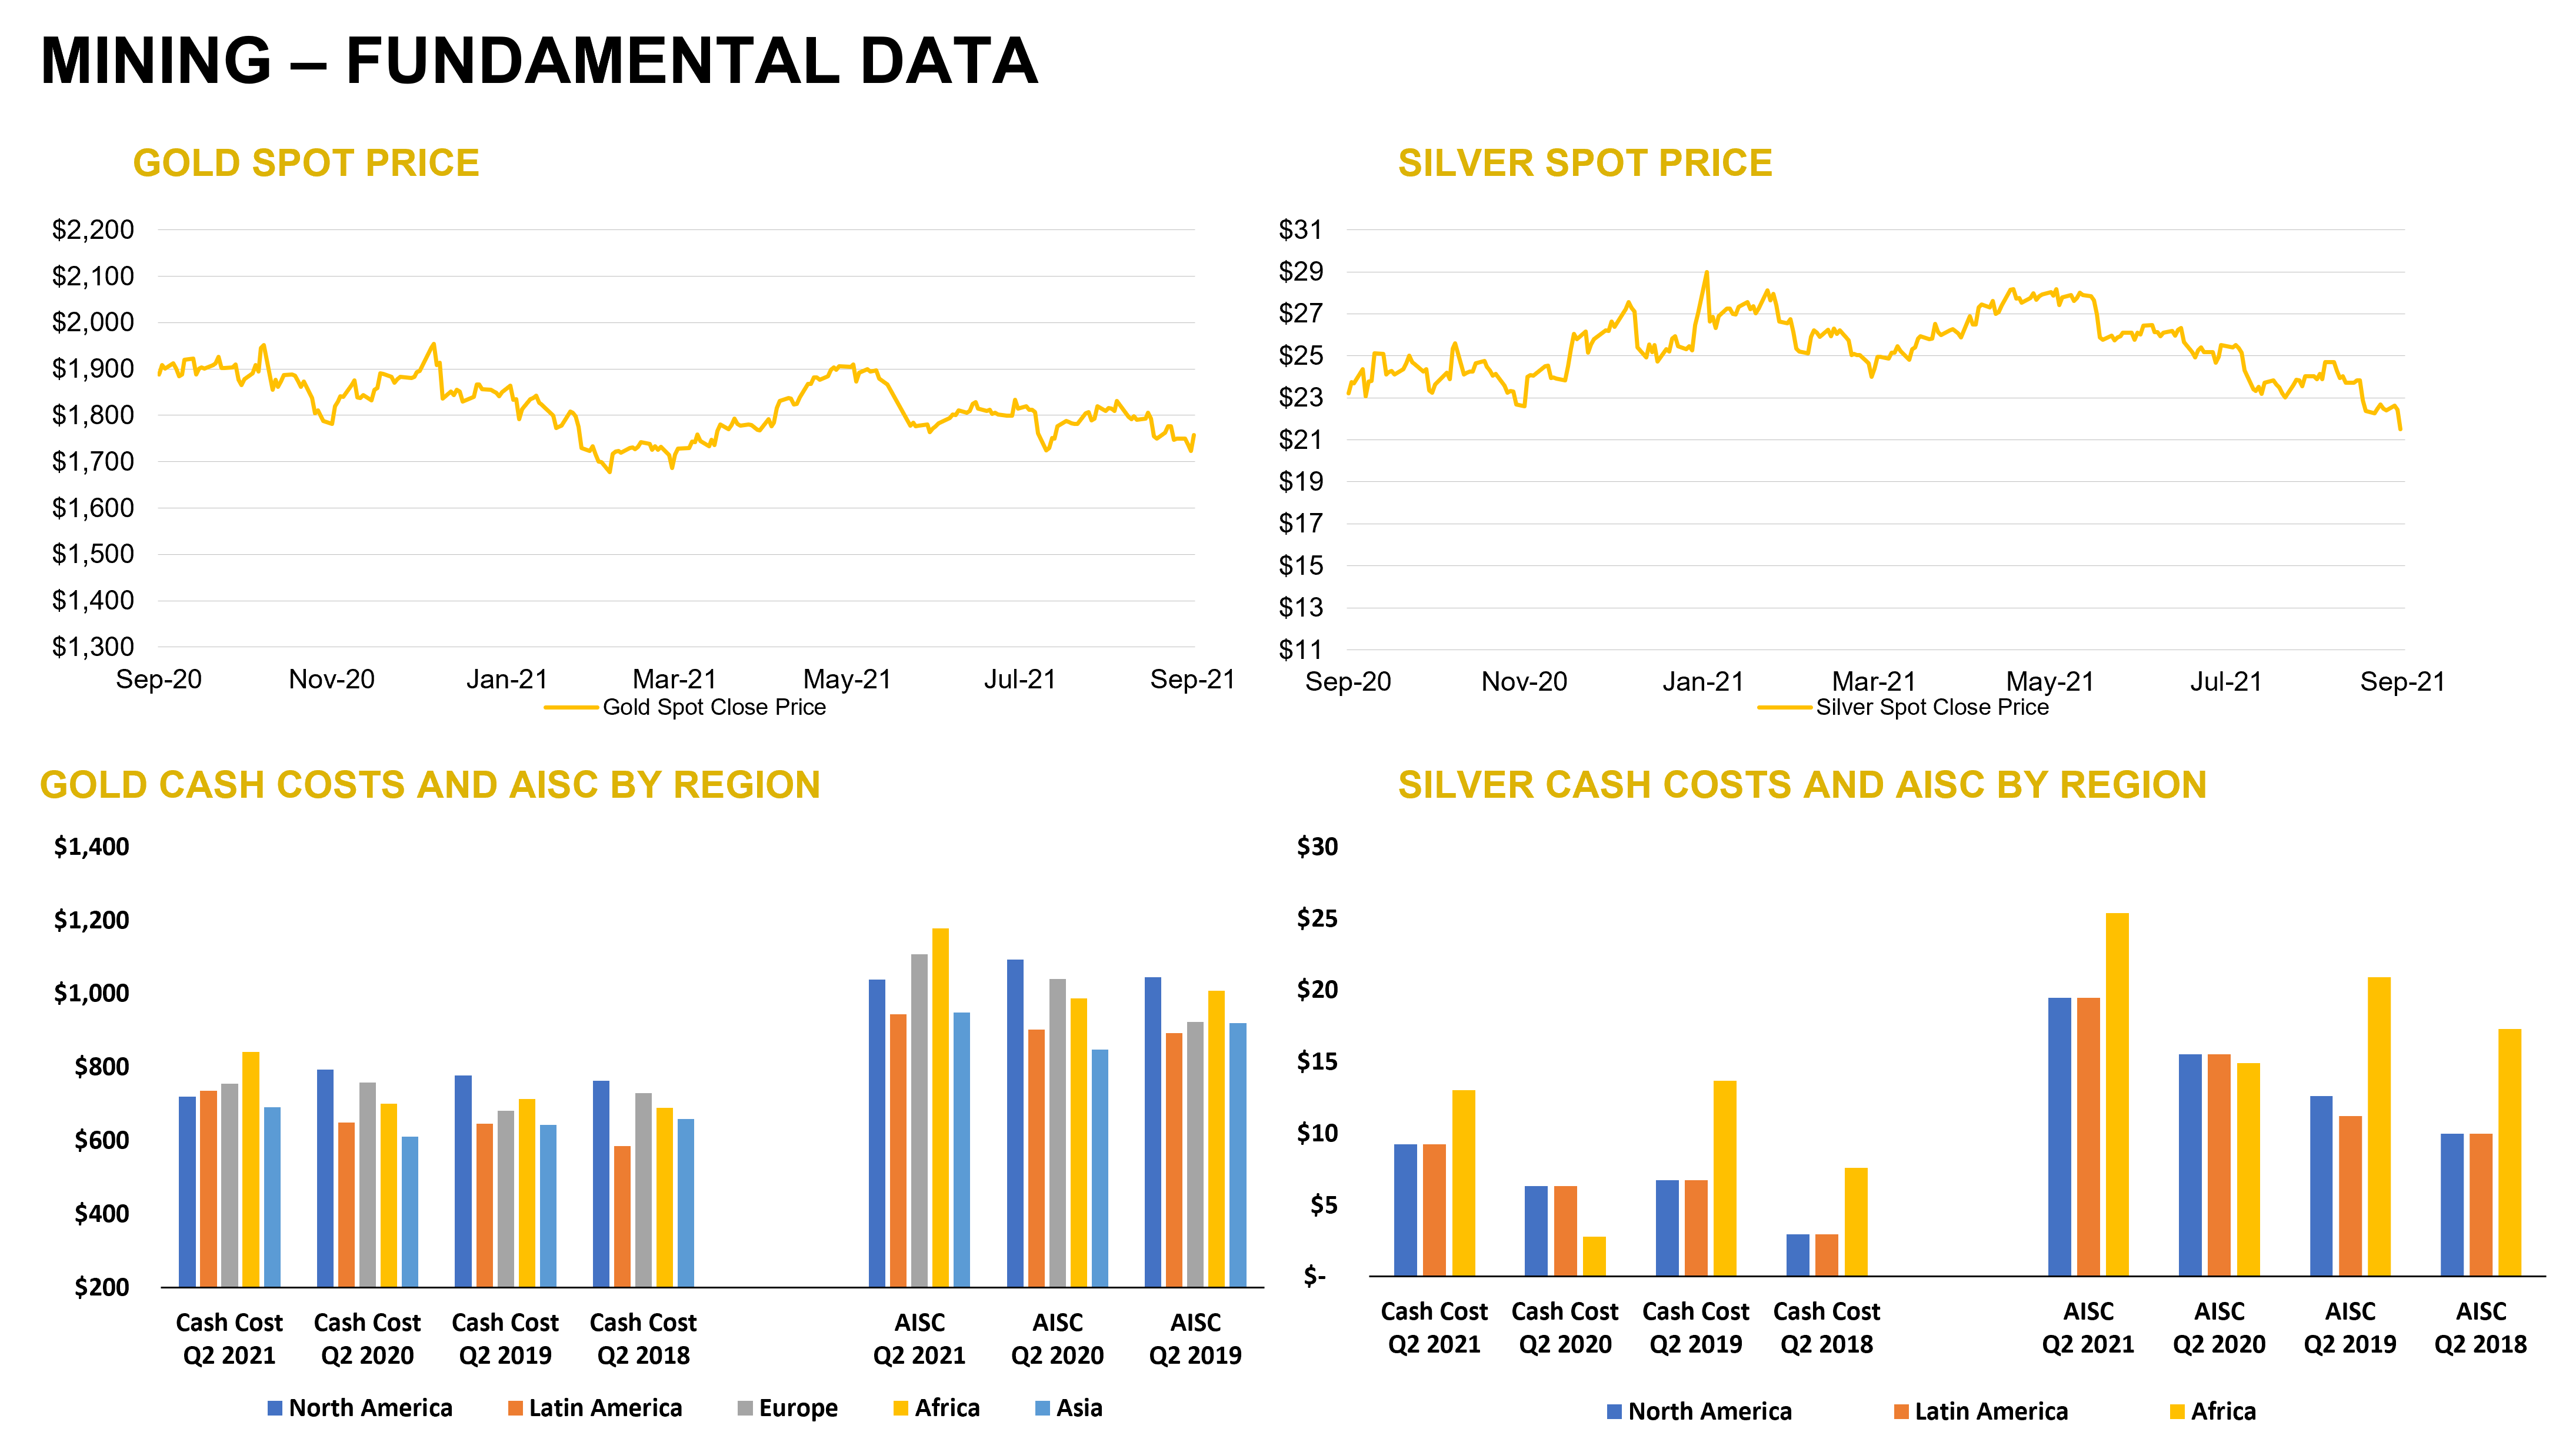
During the third quarter, mining companies (as measured by the XME) declined 3.1% compared to a gain of 0.2% for the S&P 500 index. The VanEck Vectors Gold Miners (GDX) and Junior Gold Miners (GDXJ) ETFs were down 13.3% and 18.1%, respectively. Gold, silver, and copper futures prices were down 0.8%, 15.3%, and 4.3%, respectively, while lead and zinc were up 3.6% and 4.8%. Year-to-date through September 30, gold and silver prices declined 7.8% and 16.6%, respectively, while copper, lead, and zinc prices were up 16.4%, 17.8%, and 17.3%. While our last quarterly update predicted range-bound gold and silver prices, we are growing more bullish going into 2022. Moreover, our outlook remains upbeat for industrial metals.
Growing conviction on precious metals.
During the third quarter, the U.S. Dollar Index rose 1.9% and is up 4.8% year-to-date through September 30. The yield on the 10-year rose modestly during the quarter and was up 61 basis points compared to year-end 2020. While a rise in the U.S. dollar and treasury yields are headwinds for gold, it is likely that inflation will remain elevated through 2022, real interest rates will remain low, and investors may begin to focus on rising federal deficit spending and debt levels. Less favorable year-over-year GDP growth comparisons could take momentum out of growth stocks and investors may tilt to value and defensive sectors. We think gold may be viewed more favorably as a store of value and silver could benefit from renewed interest in gold. While we value cryptocurrencies’ utility as a medium of exchange, they have become more of a speculative vehicle whose market values are untethered to intrinsic value.
Still bullish on base metals.
With respect to industrial metals, we remain bullish due to favorable supply and demand fundamentals supported by global economic growth, infrastructure spending, and trends toward electrification, decarbonization, and renewable power technologies.
Exposure to mining stocks
Investors should remain exposed to precious and base metals through mining stocks. Valuations, particularly among junior companies, remain attractive. Because large, high-quality deposits are becoming increasingly scarce, geopolitical considerations more complex, and lead times for bringing a mine into production longer, M&A activity could accelerate as large mining companies seek to bolster reserves and resources.
Source: Capital IQ as of 09/30/2021
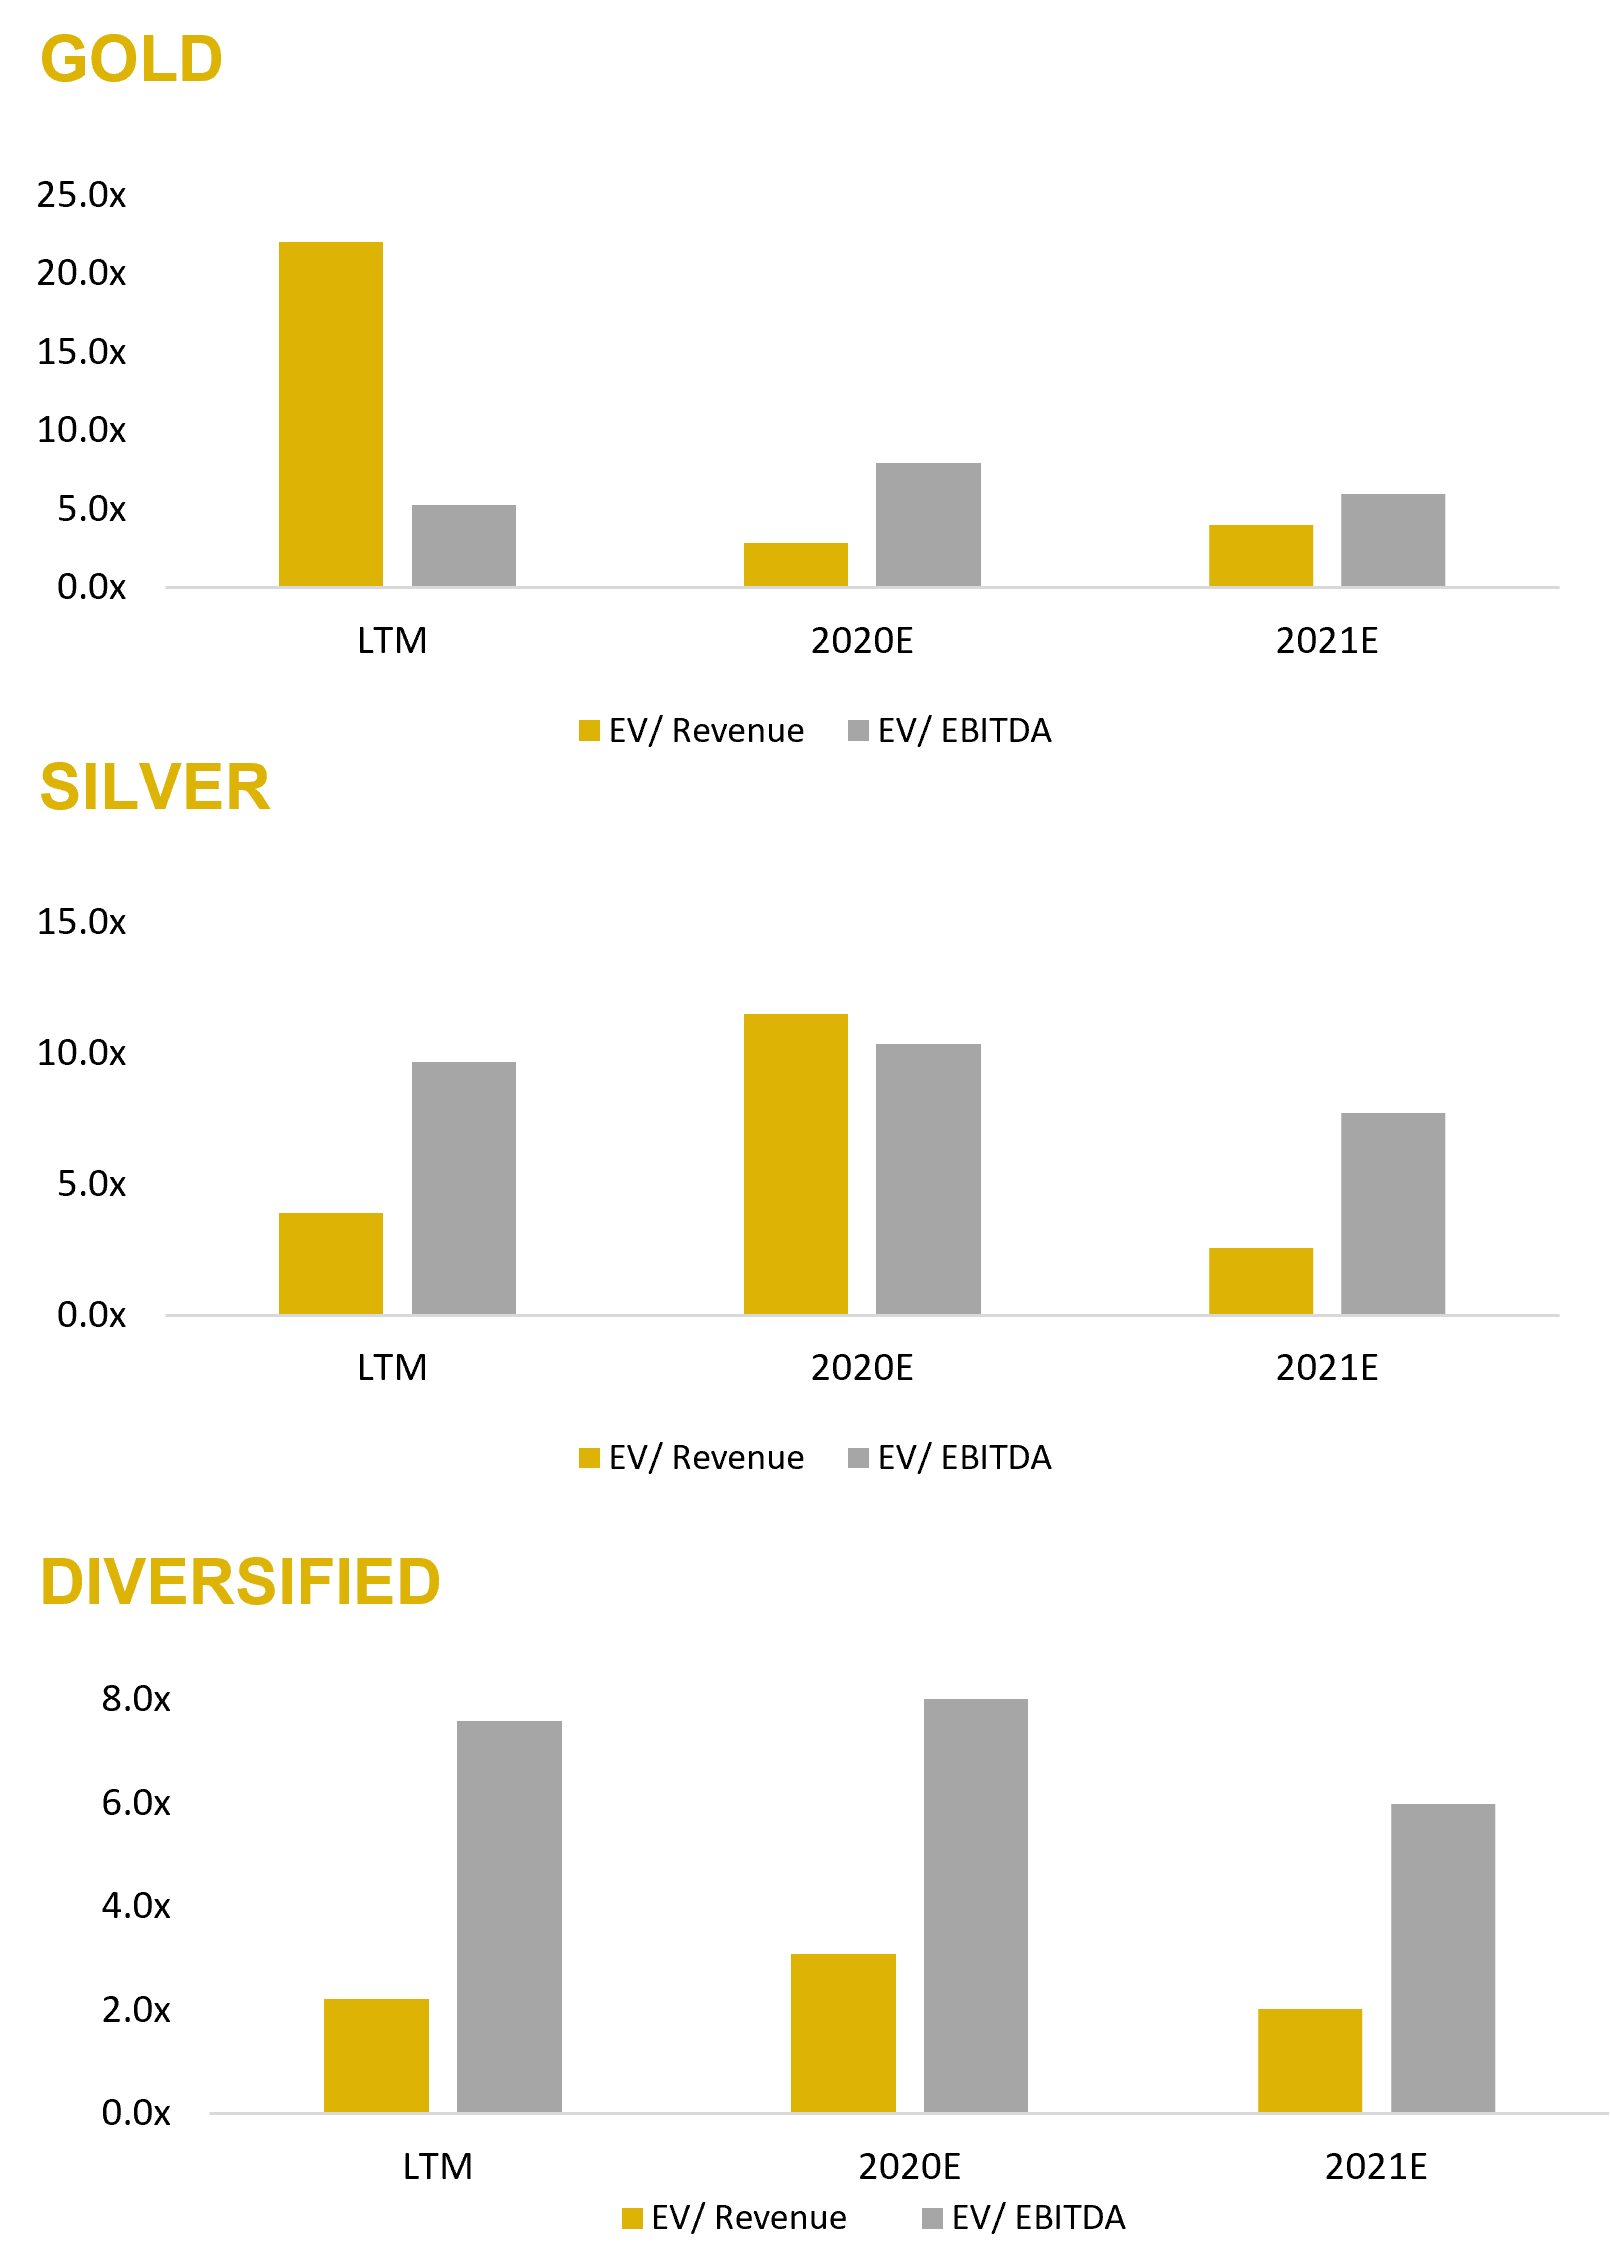
Gold Mining – Comparable Tables
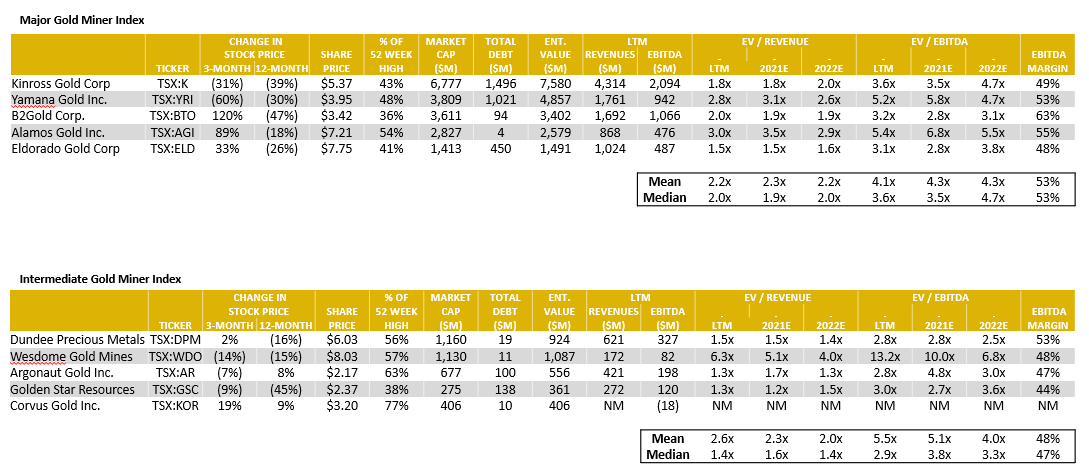
Source: Capital IQ as of 09/30/2021
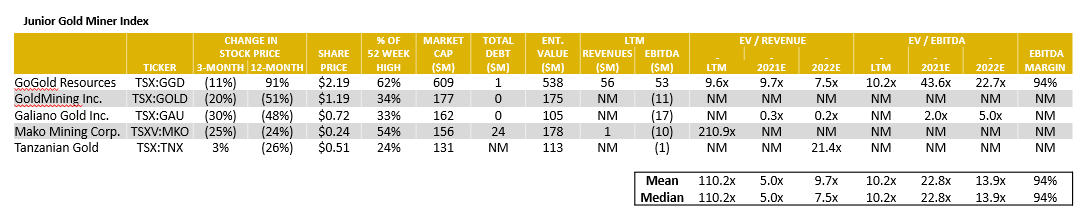
Gold Mining – LTM Equity Performance
Source: Capital IQ as of 09/30/2021
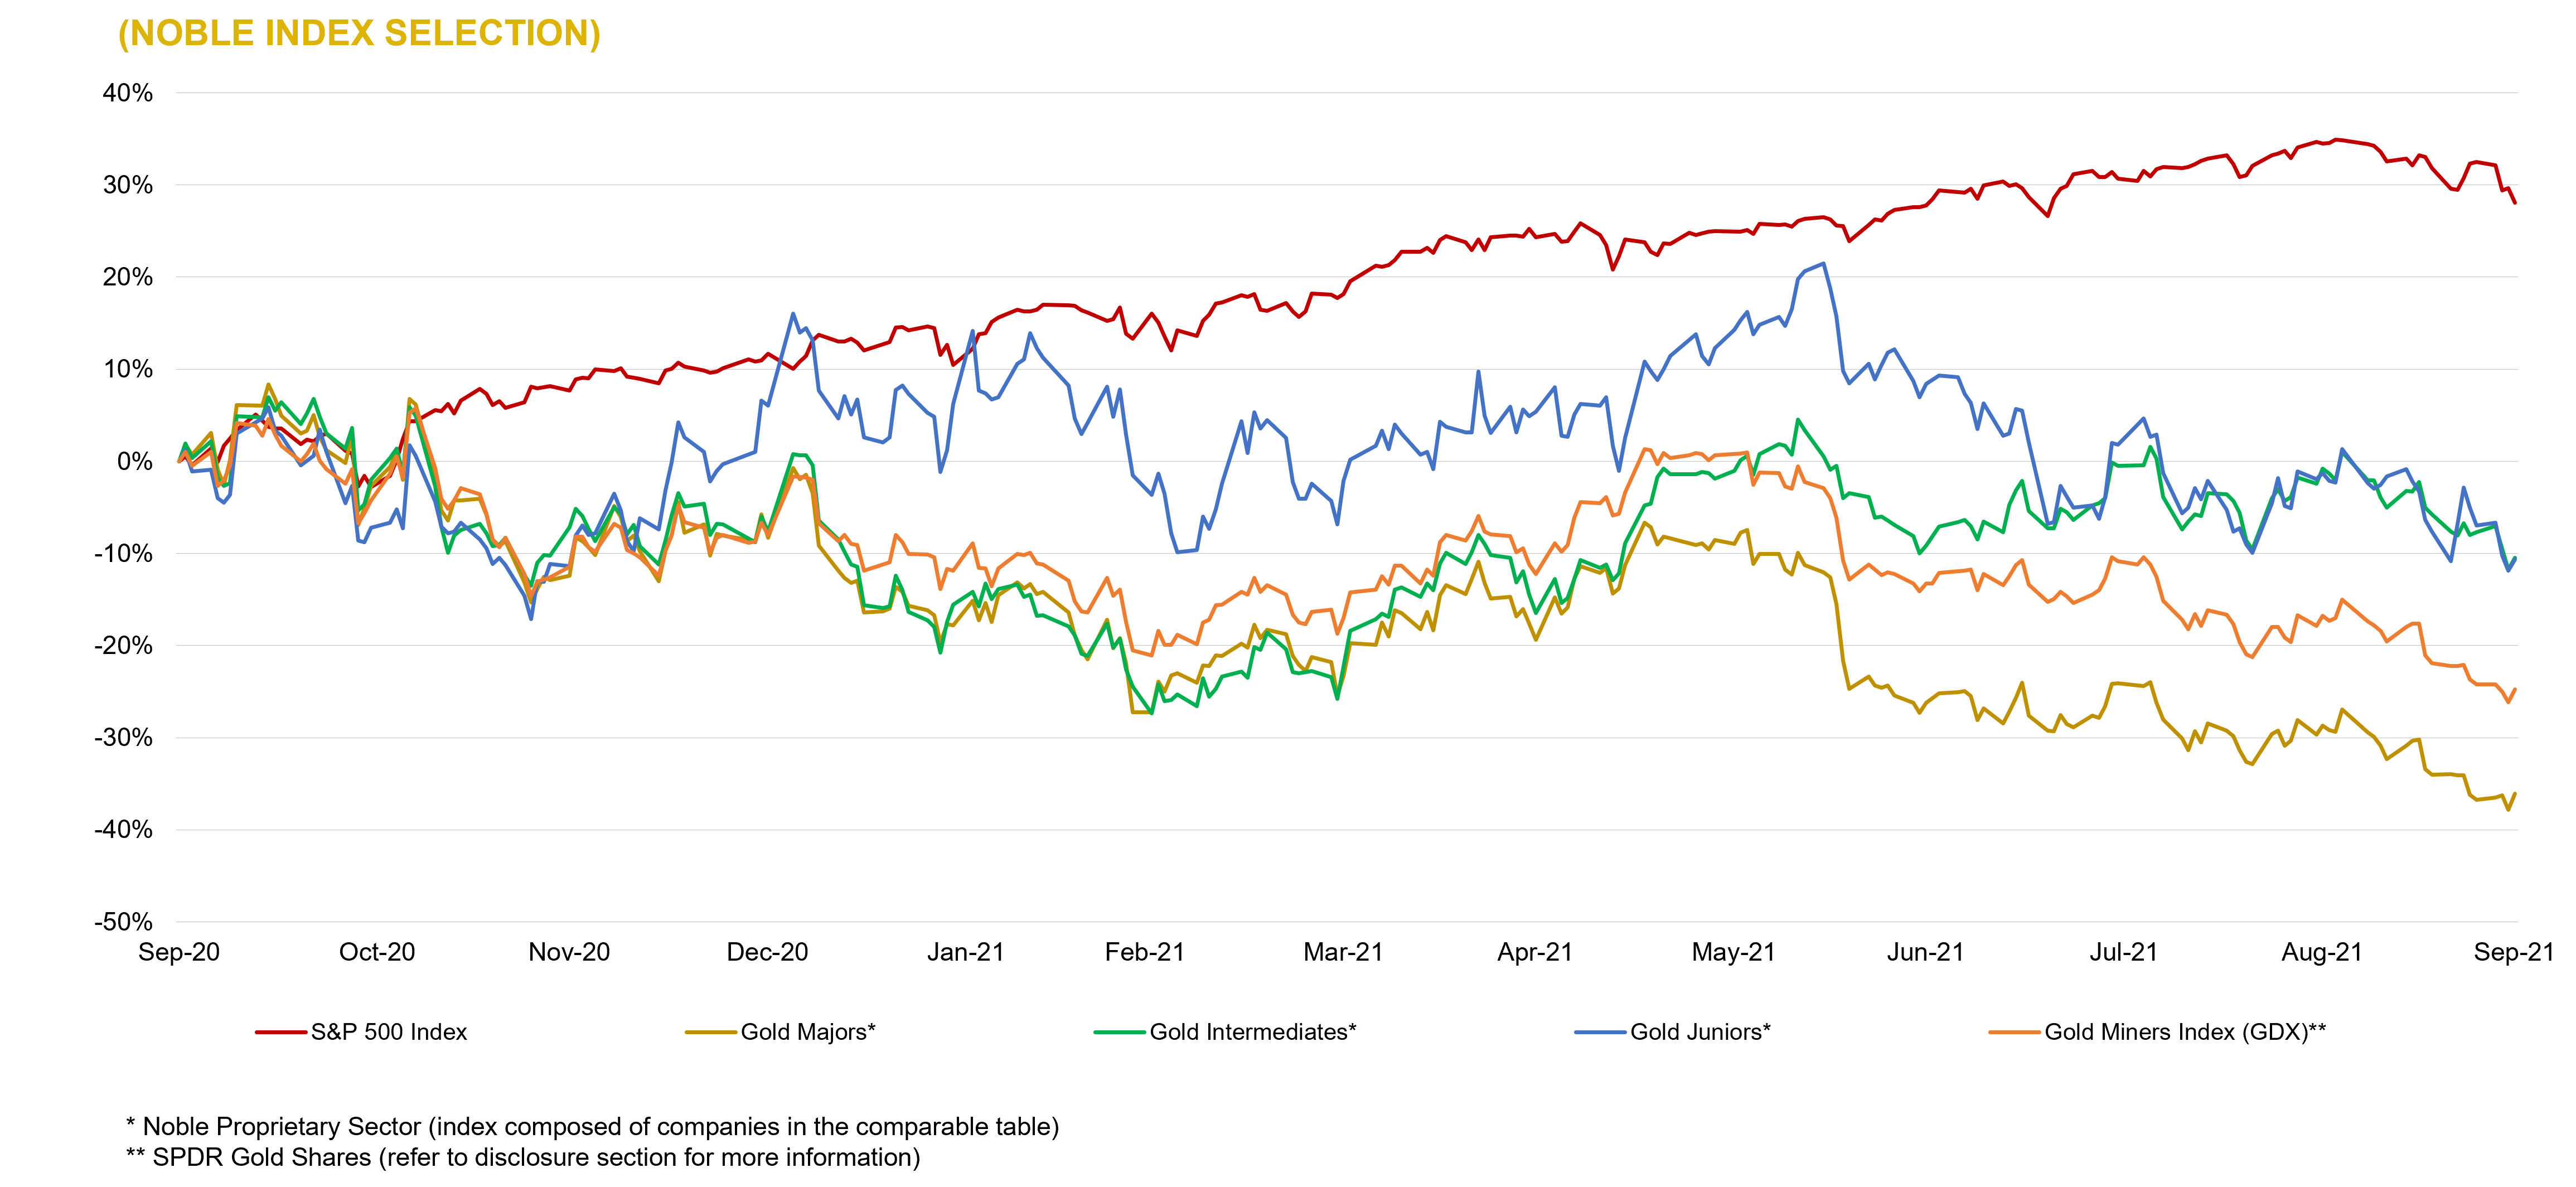
Silver Mining – Comparable Tables
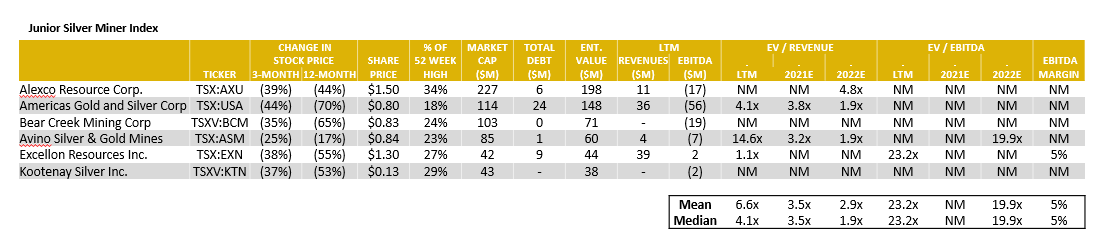
Source: Capital IQ as of 09/30/2021
Silver Mining – LTM Equity Performance
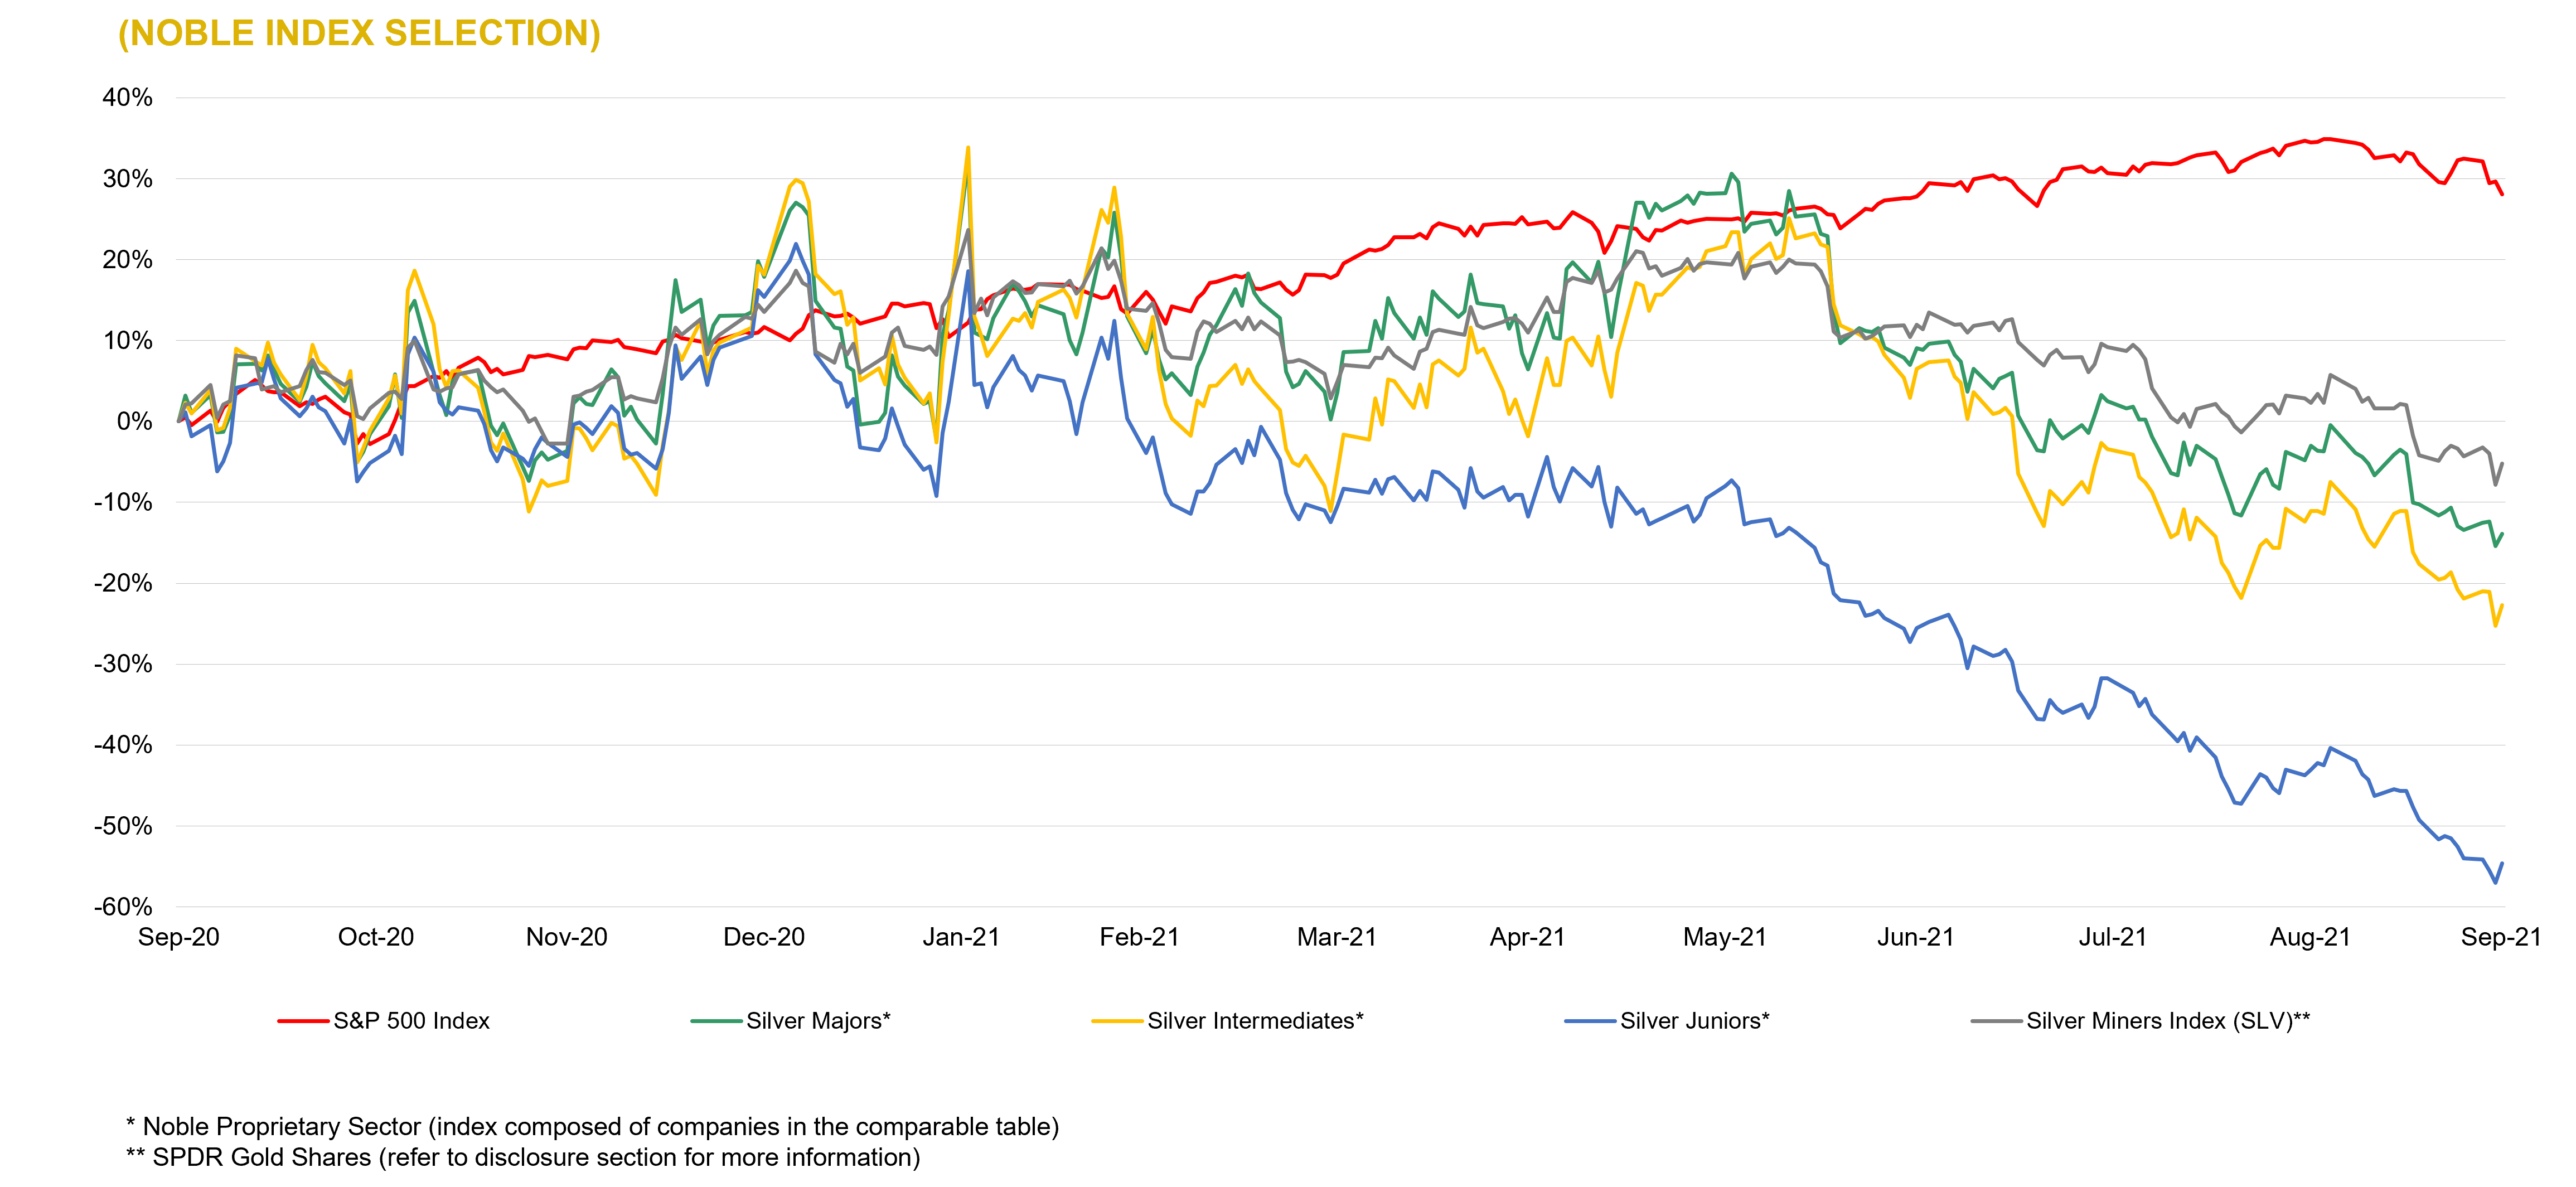
Source: Capital IQ as of 09/30/2021
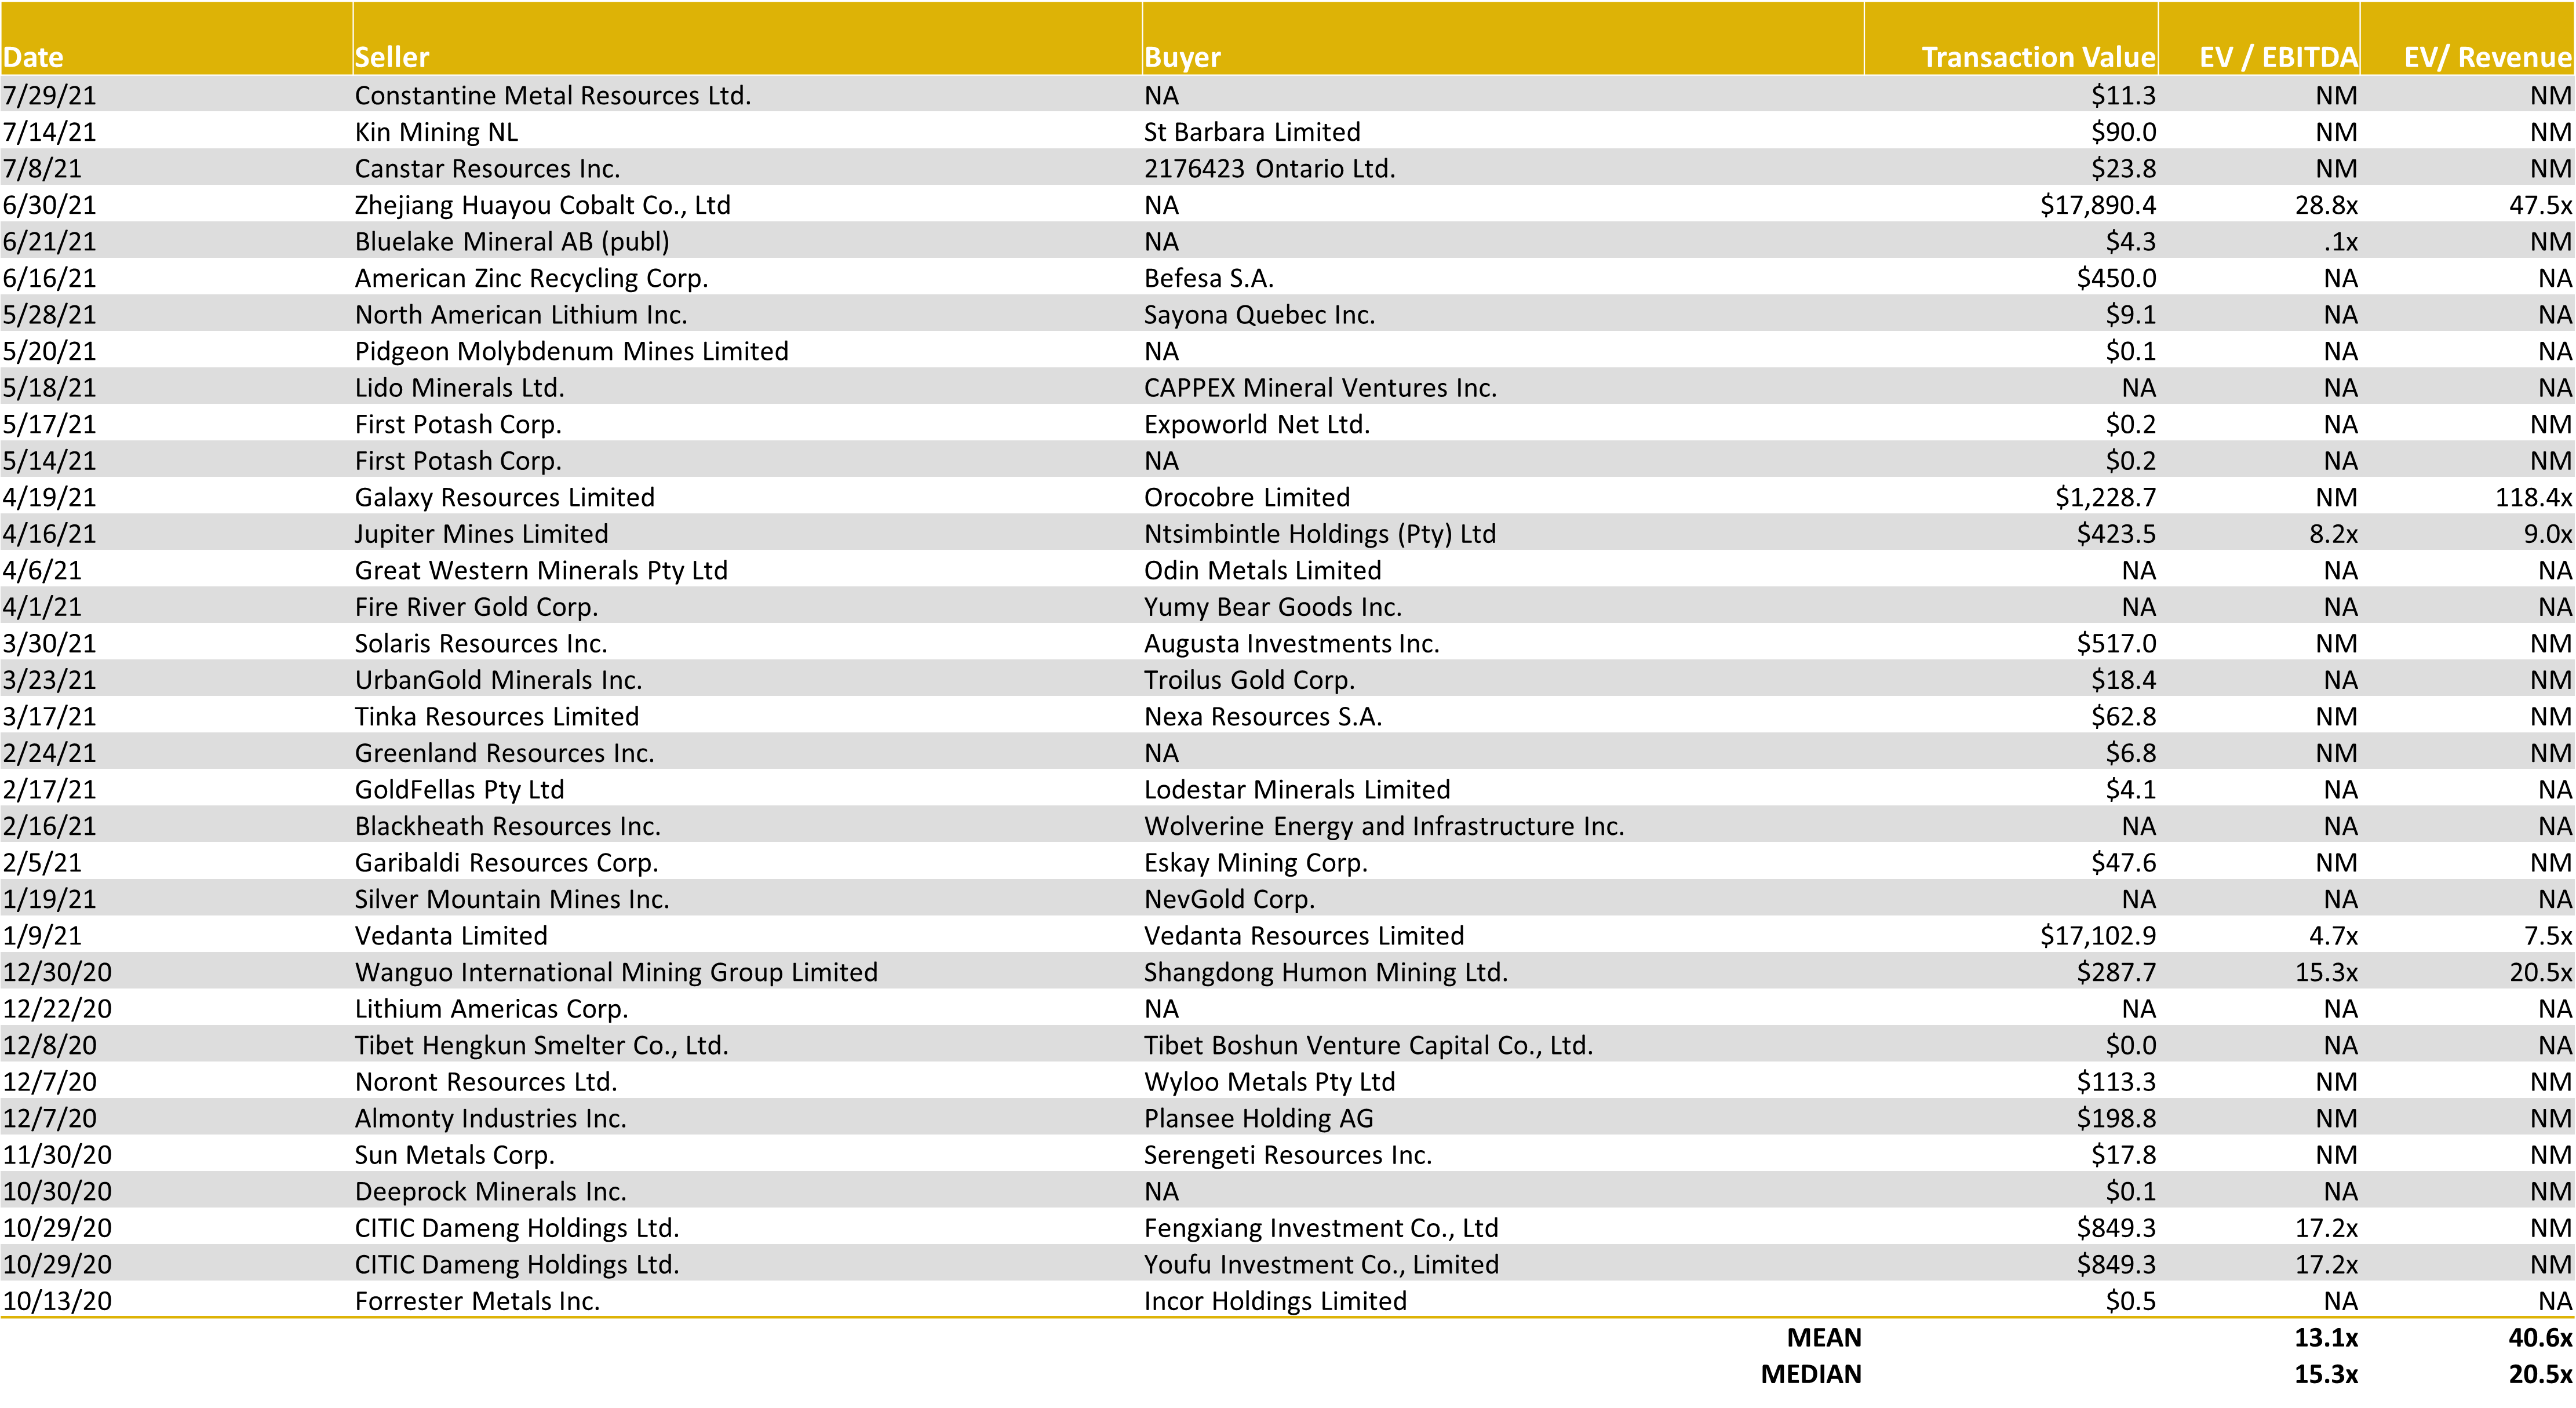
Gold & Silver – LTM Global M&A Activity
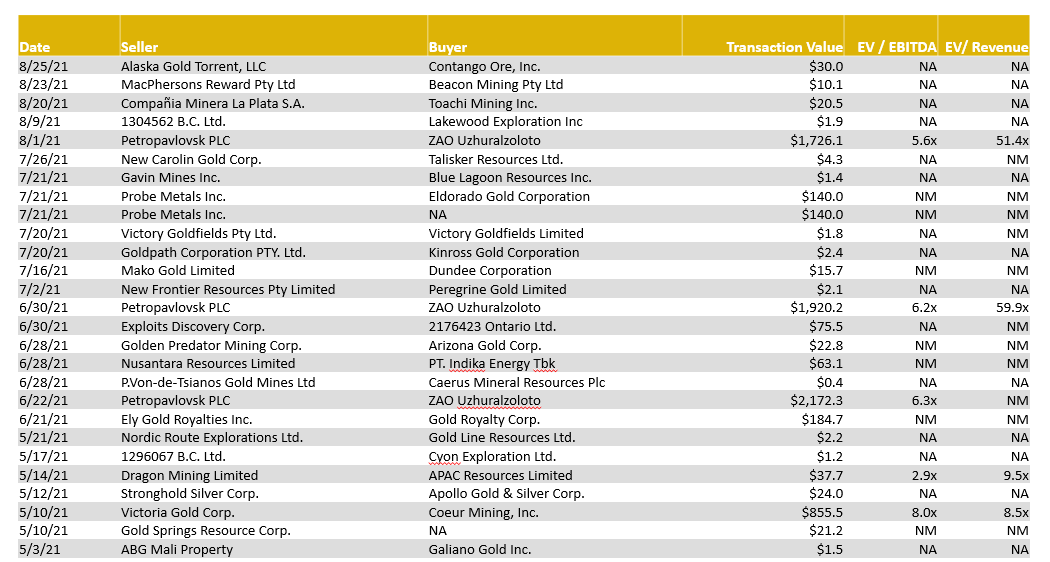
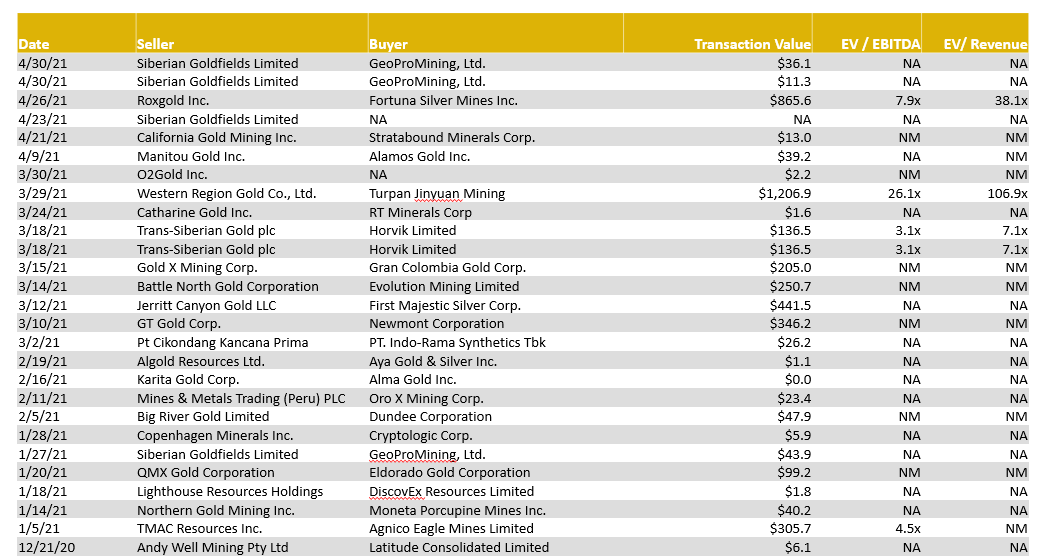
Source: Capital IQ as of 09/30/2021
Diversified Mining – Comparable Tables
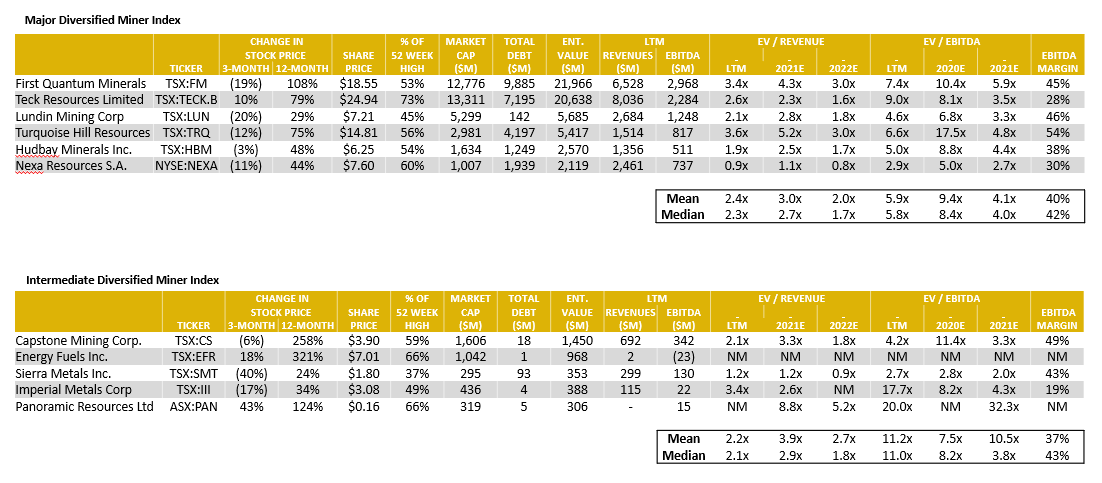
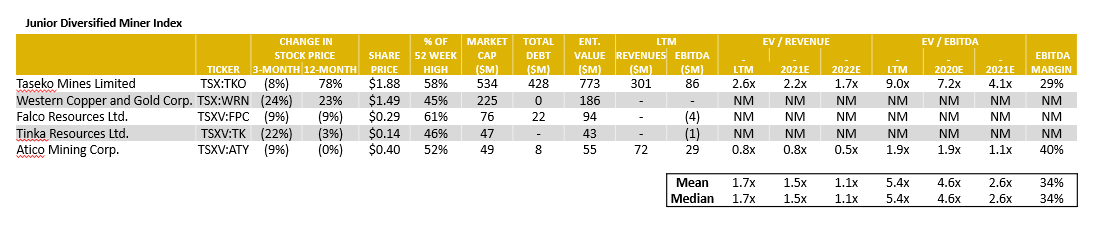
Source: Capital IQ as of 09/30/2021
Diversified Mining – LTM Equity Performance
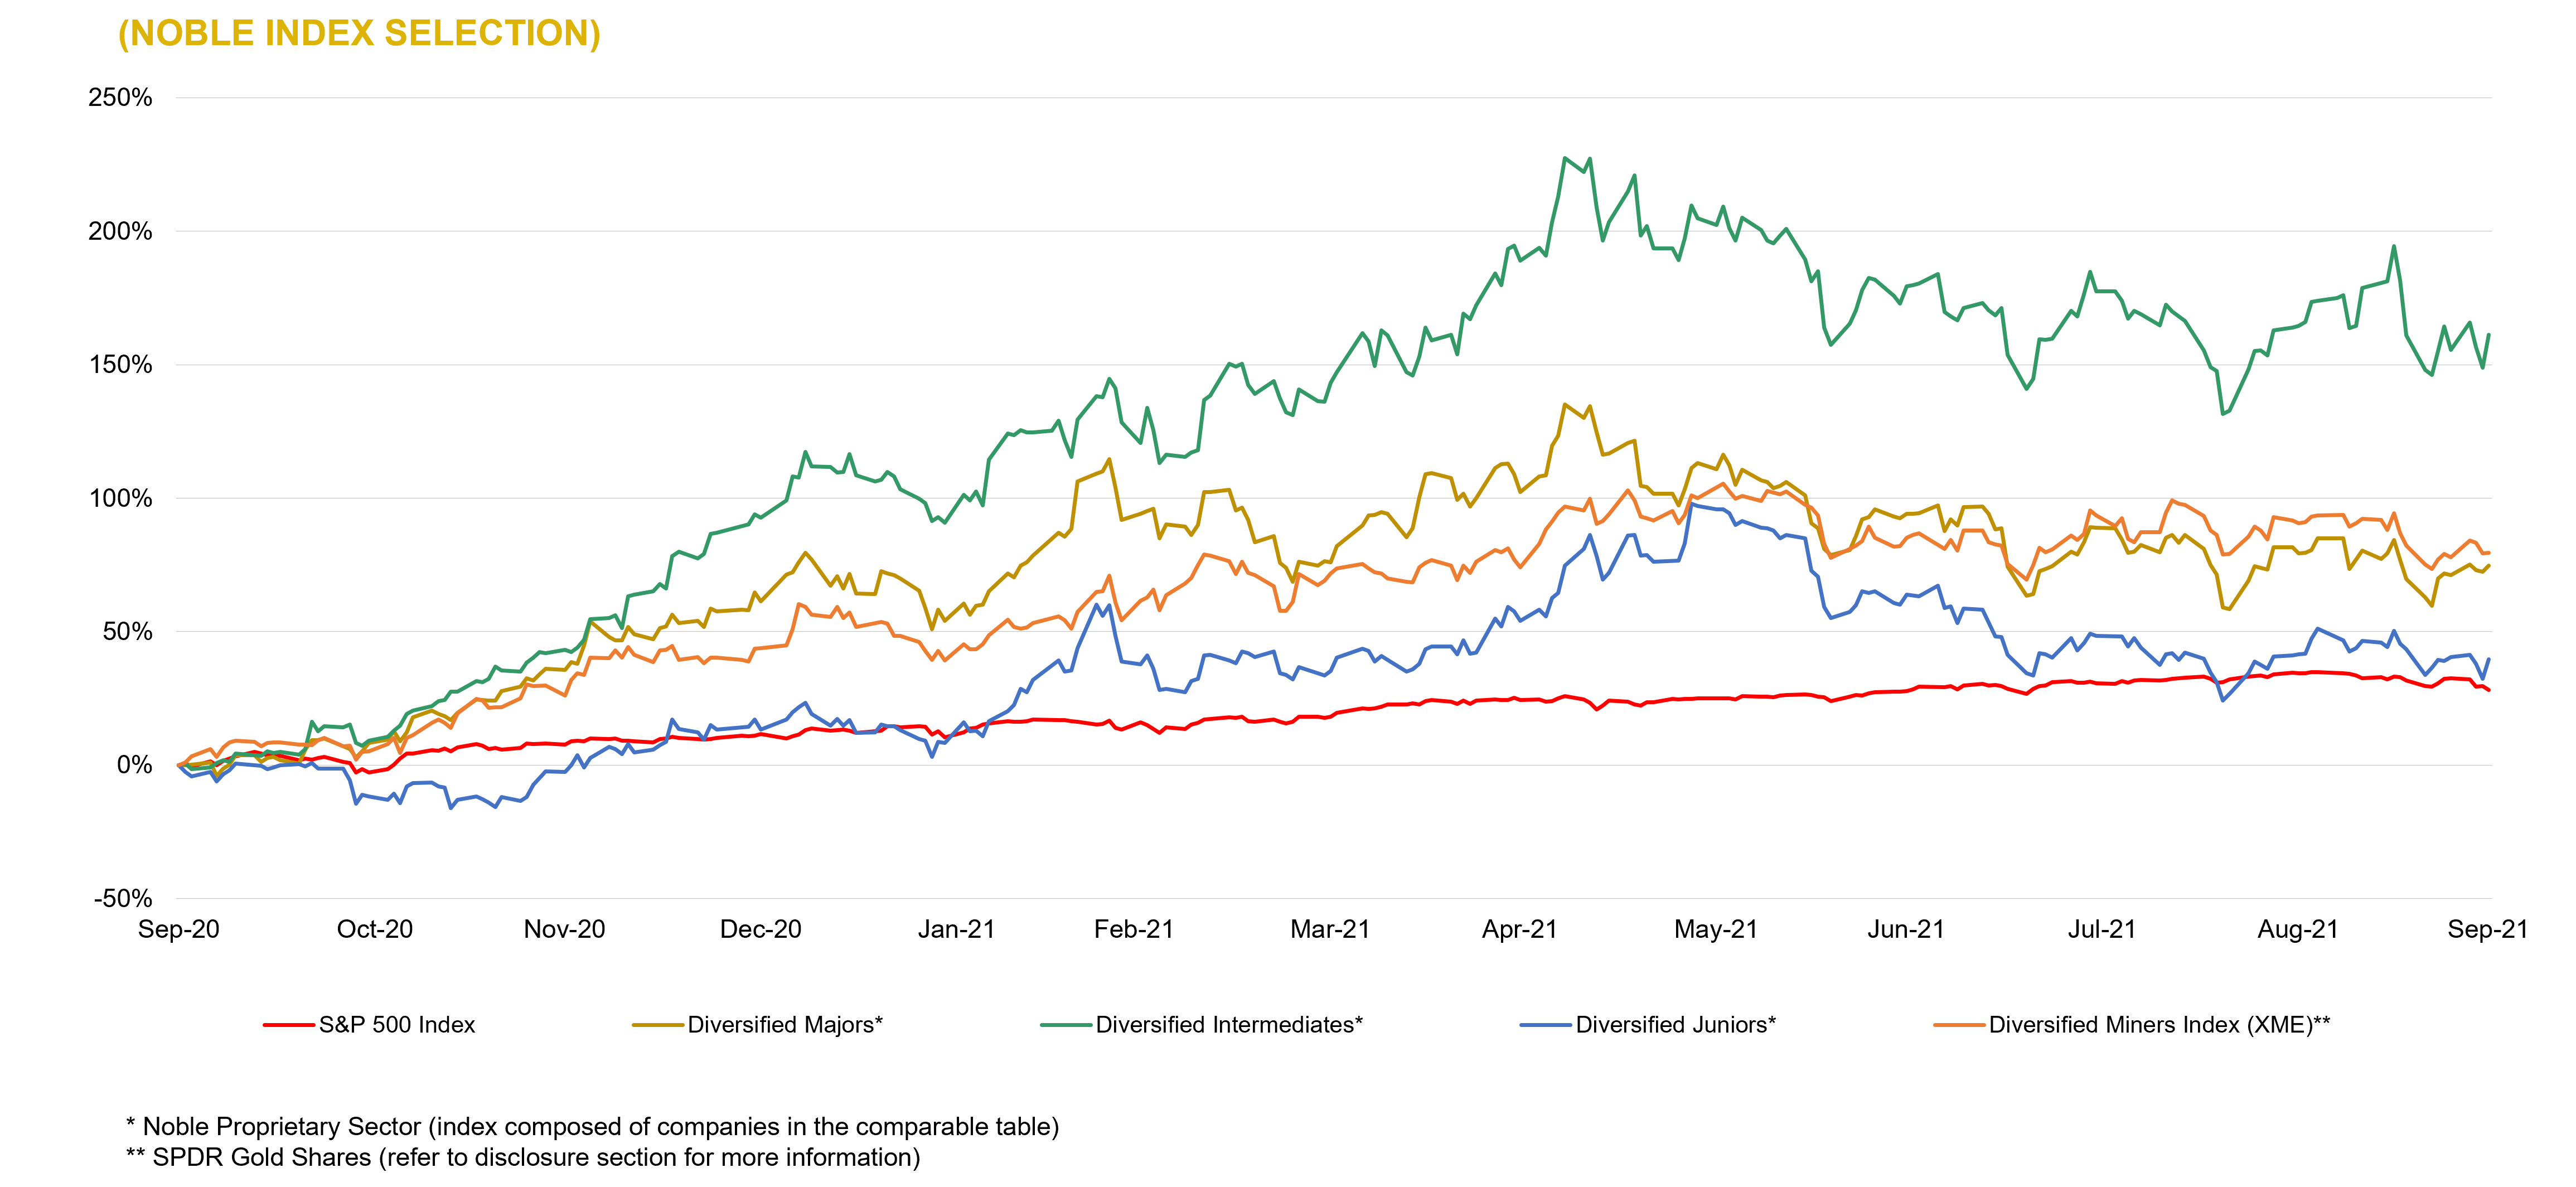
Source: Capital IQ as of 09/30/2021
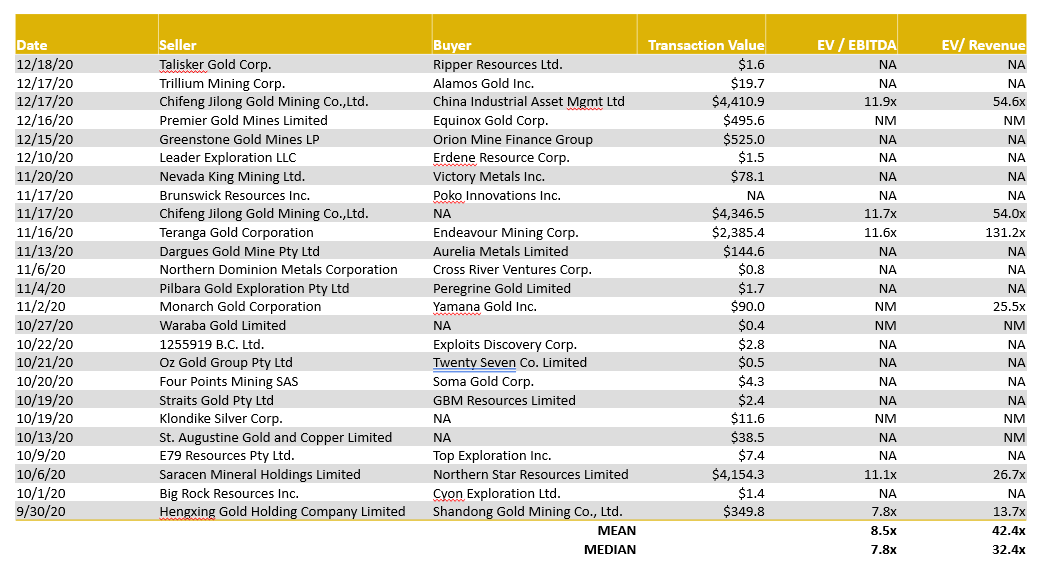
Diversified Mining – LTM Global M&A Activity
Source: Capital IQ as of 09/30/2021
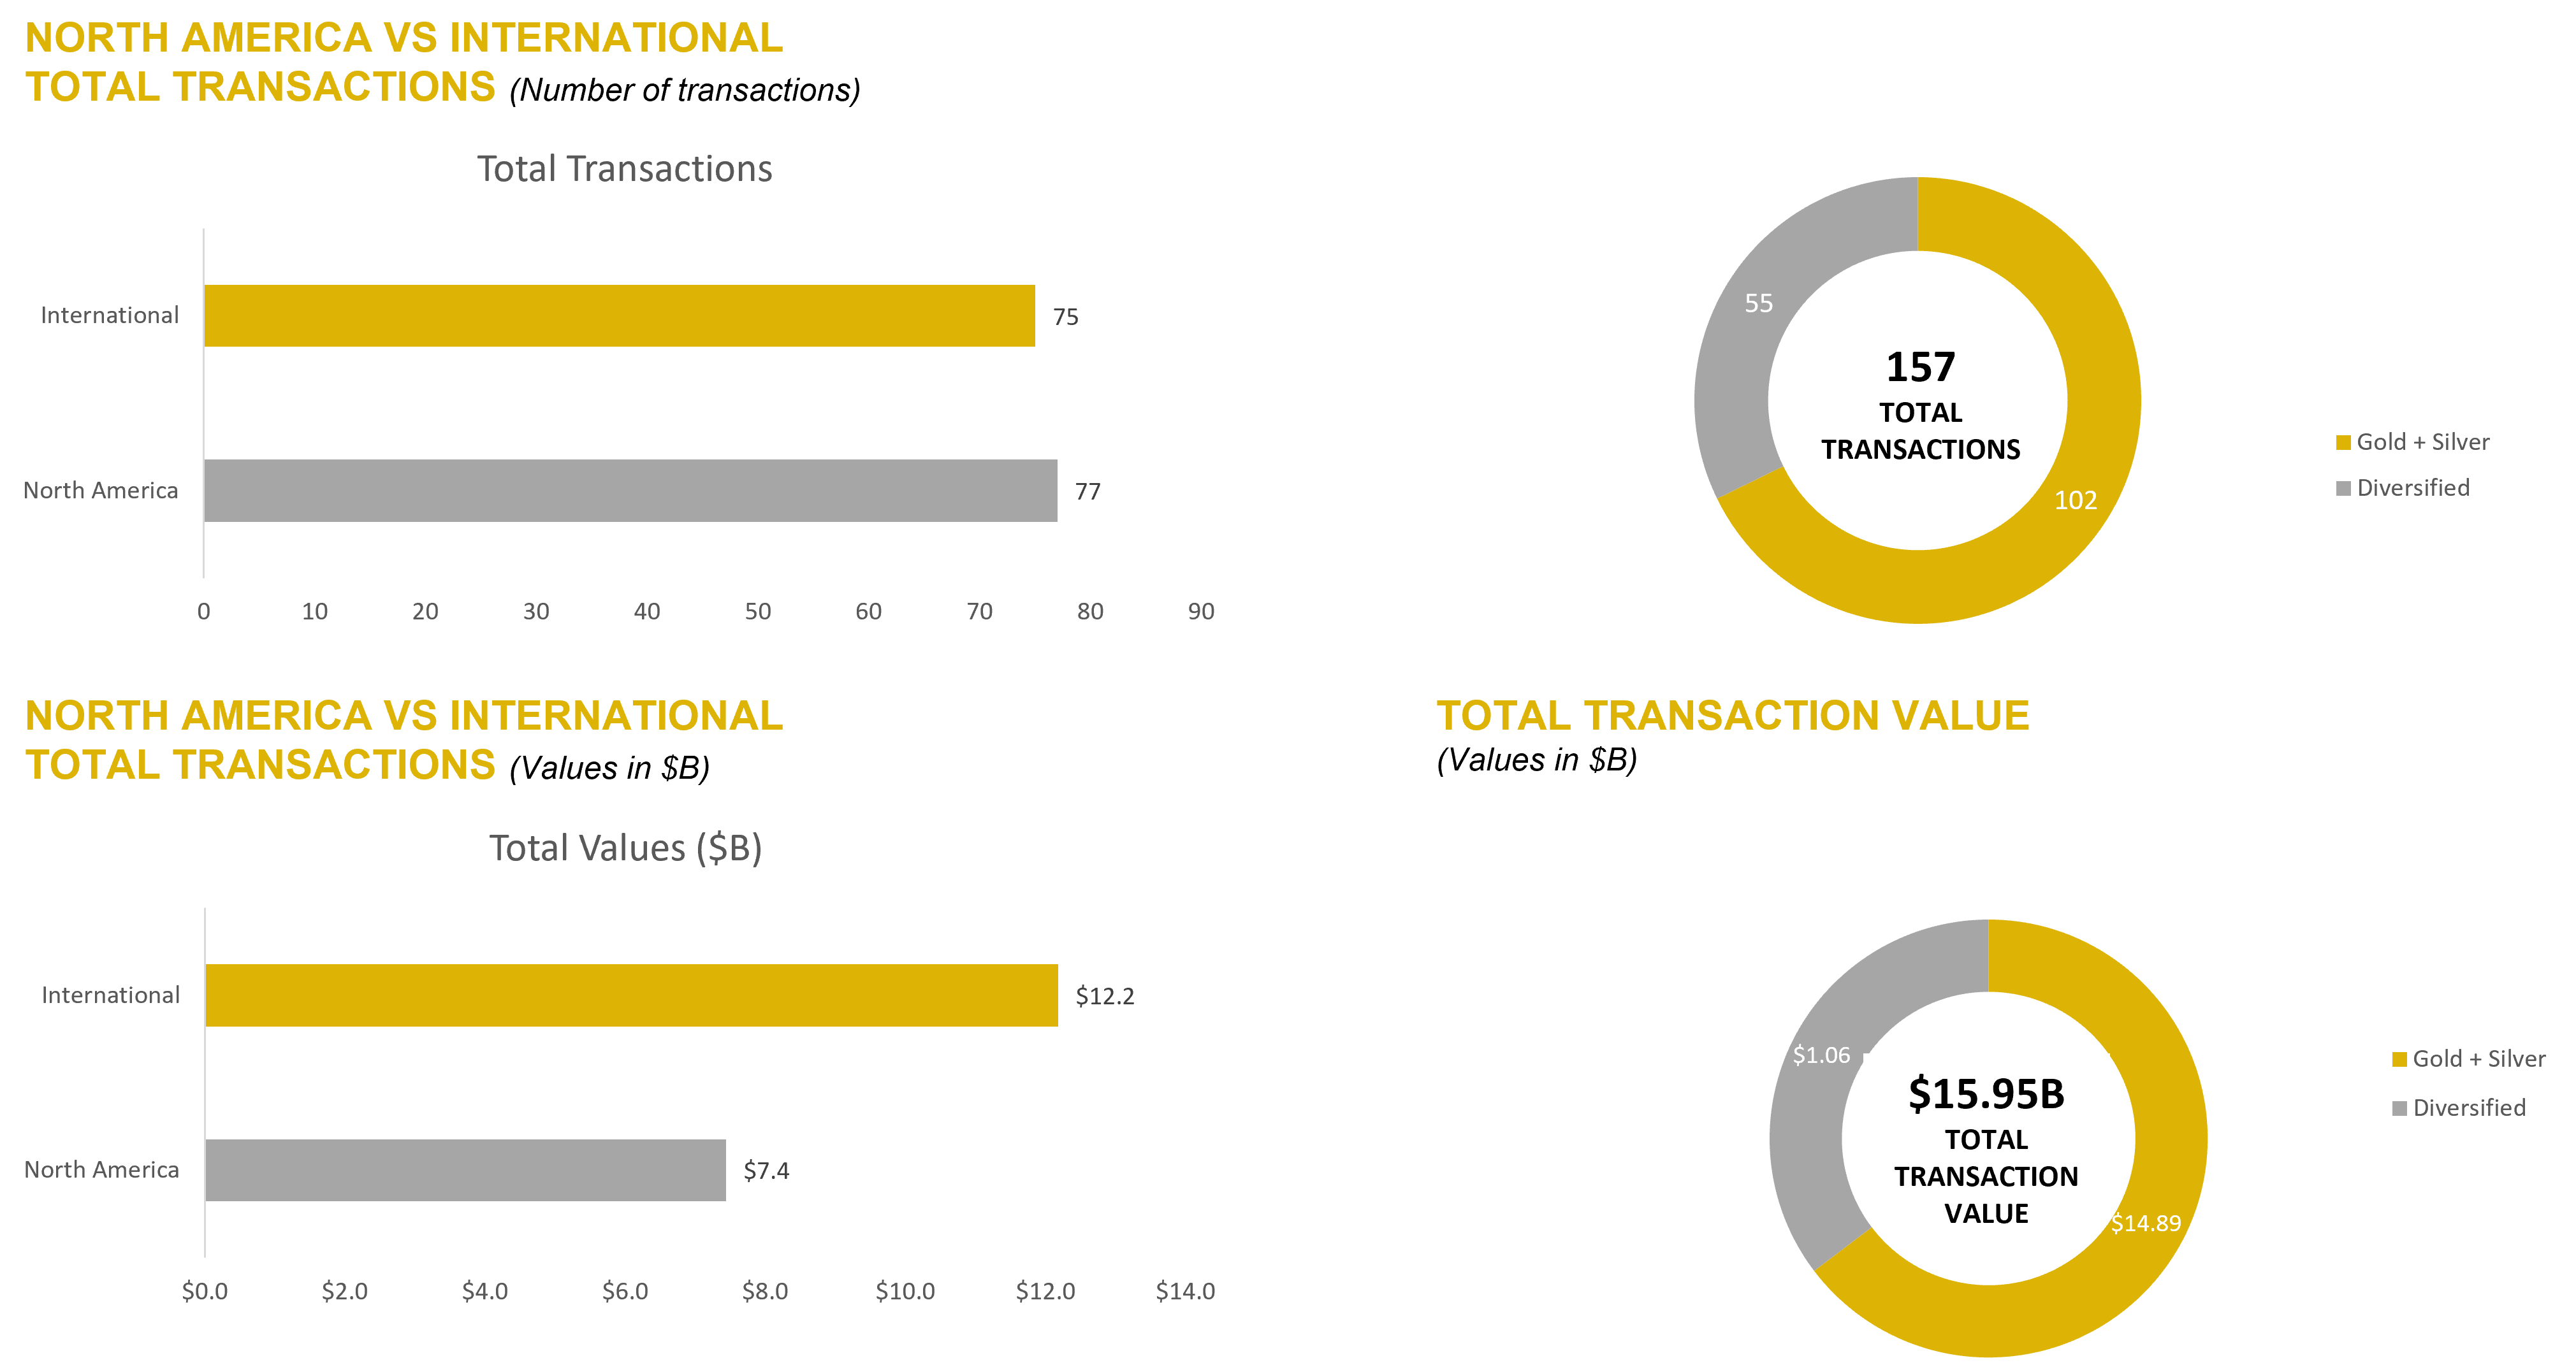
LTM Mining Industry M&A Summary
Source: Capital IQ as of 06/30/2021
NOBLE QUARTERLY HIGHLIGHTS
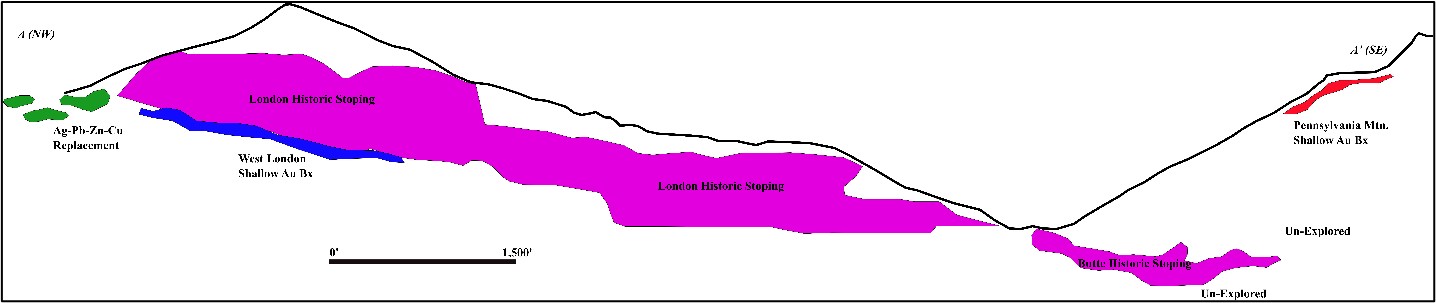
Jaxon Mining Inc. (TSXV:JAX)
Industry: Metals and Mining – Precious metals; Gold & Silver
Jaxon Mining is a Canadian-based exploration and development company pursuing the discoveries of commercial scale and grade Cu, Au, Ag, polymetallic projects. Jaxon focuses on overlooked and underexplored targets with deeper intervals that have not been identified or adequately explored; in areas that often have not been systematically mapped, modeled or drilled. Jaxon is currently focused on the Skeena Arch, an exceptionally orogenic and metallogenic area, in one of the most richly endowed terrains in British Columbia.
3rd Quarter News Highlights:
September 20, 2021: Jaxon announced an update on the Netalzul Mt project at British Columbia. The company completed a DC resistivity/induced polarization (IP) survey and a short interval magnetotelluric (MT) survey utilizing the Volterra Acquisition System, conducted by SJ Geophysics Ltd; and a LiDAR data acquisition conducted by Eagle Mapping Ltd. In addition, as of September 16, eight diamond drilling holes have been completed for a total of 2,258 metres at the Netalzul Mt project.
Bunker Hill Mining Corp. (OTCQB:BHLL)
Industry: Metals and Mining – Precious metals; Silver
Bunker Hill Mining Corp, intends to sustainably restart and develop the Bunker Hill Mine as the first step in consolidating a portfolio of North American precious-metal assets with a focus on silver. The company is dedicated to restart the historical mine as a modern, zero-emission, zero-footprint, long-life, underground operation that provides long-lasting benefits for all stakeholders.
3rd Quarter News Highlights:
September 23, 2021: The company announced the completion of a geophysics survey and entered a $2,500,000 bridge loan financing to support near-term working capital needs. Sam Ash, CEO of Bunker Hill Mining, stated: “Our exploration team was tasked to identify new mineralization near to both the surface and existing infrastructure. The completion of this geophysics survey is an important step in their on-going campaign, and we look forward to reporting its findings and next steps. We are also pleased to have secured bridge financing to support our working capital requirements as we complete our project finance process.”
World Copper Ltd. (OTCQB:WCUFF)
Industry: Metals and Mining – Diversified metals and mining
World Copper Ltd., headquartered in Vancouver, BC, is a Canadian resource company focused on the exploration and development of its two primary copper porphyry projects, Escalones and Cristal, both located in Chile.
3rd Quarter News Highlights:
September 20, 2021: The company signed a definitive agreement for the acquisition of Cardero Resource Corp. The deal is part of a plan to enhance World Copper’s portfolio of mineral projects as it would tap into Cardero’s Zonia copper oxide project in central Arizona. Nolan Peterson, World Copper’s CEO stated, “The signing of the definitive agreement with Cardero is another milestone for World Copper and one that will bring significant value to our shareholders. Our team sees upside potential at Zonia that has, to this point been unrealized, including a low-cost development and permitting path. We will apply the same knowledge and expertise to Zonia, as we have to our Escalones property, and work to advance and de-risk the project going forward.”
Source: Company Press Releases
DOWNLOAD THE FULL REPORT (PDF)
Noble Capital Markets Metals & Mining Newsletter Q3 2021
This newsletter was prepared and provided by Noble Capital Markets, Inc. For any questions and/or requests regarding this newsletter, please contact >Francisco Penafiel
DISCLAIMER
All statements or opinions contained herein that include the words “ we”,“ or “ are solely the responsibility of NOBLE Capital Markets, Inc and do not necessarily reflect statements or opinions expressed by any person or party affiliated with companies mentioned in this report Any opinions expressed herein are subject to change without notice All information provided herein is based on public and non public information believed to be accurate and reliable, but is not necessarily complete and cannot be guaranteed No judgment is hereby expressed or should be implied as to the suitability of any security described herein for any specific investor or any specific investment portfolio The decision to undertake any investment regarding the security mentioned herein should be made by each reader of this publication based on their own appraisal of the implications and risks of such decision This publication is intended for information purposes only and shall not constitute an offer to buy/ sell or the solicitation of an offer to buy/sell any security mentioned in this report, nor shall there be any sale of the security herein in any state or domicile in which said offer, solicitation or sale would be unlawful prior to registration or qualification under the securities laws of any such state or domicile This publication and all information, comments, statements or opinions contained or expressed herein are applicable only as of the date of this publication and subject to change without prior notice Past performance is not indicative of future results.
Please refer to the above PDF for a complete list of disclaimers pertaining to this newsletter