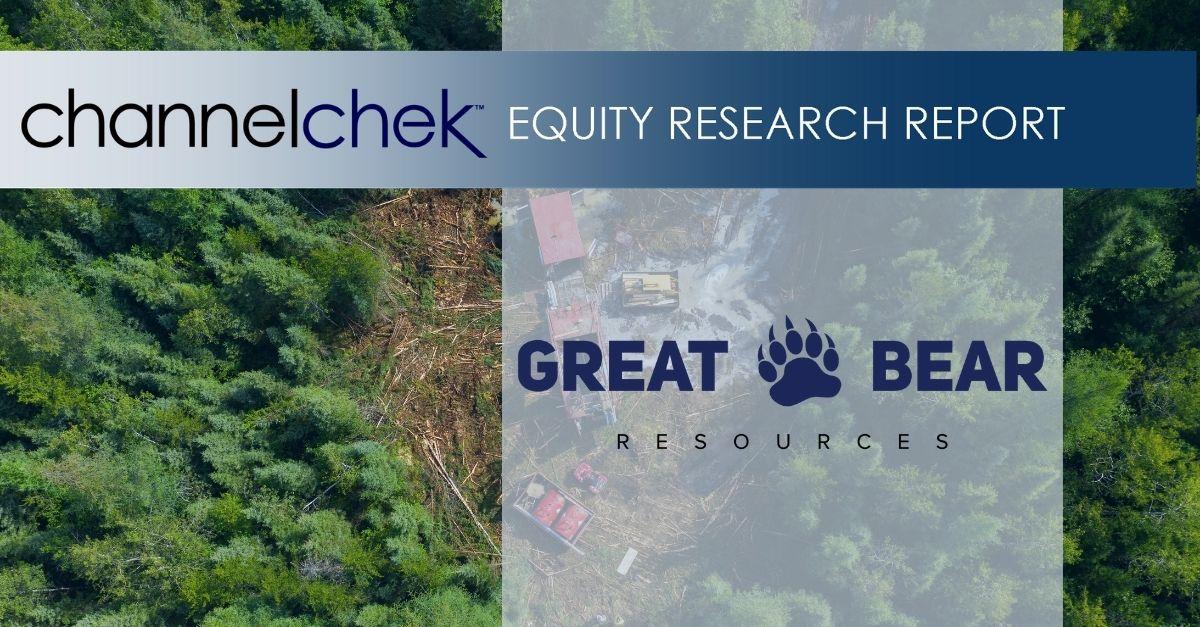
Bunker Hill Announces Updated PEA: 42% Increase in NPV to $143M, 29% Decrease in AISC, 41% Increase in FCF Over Extended 11 Year Mine Life


Bunker Hill Announces Updated PEA: 42% Increase in NPV to $143M, 29% Decrease in AISC, 41% Increase in FCF Over Extended 11 Year Mine Life


HIGHLIGHTS:

  • Materially improved financial returns: 143M NPV (+42% increase), 35% IRR, 2.6 year payback, $25M annual average FCF (+28% increase) at $1.15/lb Zn, $0.90/lb Pb, $20/oz Ag (metal prices unchanged from April 2021 PEA )
  • Increased use of Long-Hole Open Stoping mining drives a 29% reduction in AISC to $0.47 per pound of payable zinc
  • Nearly 1 billion zinc equivalent pounds (including over 8 million ounces of silver) produced over an extended 11 year mine life.  The mine’s significant high-grade silver potential outside the current resource is not included
  • CEO Sam Ash and CFO David Wiens to host live interactive 6ix virtual investor event on Tuesday, September 21st at 11:00AM ET / 8:00AM PT.  Investors are invited to register for this event at: [LINK]

TORONTO, Sept. 20, 2021 (GLOBE NEWSWIRE) — Bunker Hill Mining Corp. (the “Company”) (CSE: BNKR, OTCQB: BHLL) is pleased to announce an updated Preliminary Economic Assessment (the “PEA” or the “updated PEA”) for the Bunker Hill Mine, showing materially improved financial returns, free cash flow, and unit costs.

The updated PEA contemplates a $44 million initial capital cost (including 20% contingency) to rapidly restart the mine over an 18-month period, generating approximately $25 million of annual average free cash flow over an extended 11-year mine life while producing nearly 1 billion zinc equivalent pounds of metal, including over 8 million ounces of silver. Metal price assumptions in the updated PEA remain unchanged from the PEA announced in April 2021 and published in June 2021 (the “June PEA”), thereby not reflecting significant increases in zinc and lead prices since that time.

Sam Ash, CEO of Bunker Hill Mining, stated: “We are very pleased to report the results of this summer’s mine plan optimization work and its significant positive effect on estimated financial returns, free cash flow, and cost position relative to April’s PEA. This is an important development milestone and affirms further the significant value to be realized from the rapid restart of the Bunker Hill Mine for our shareholders as well as our local partners and stakeholders.”

Concurrent with engineering studies designed to further enhance the project’s economics, the Company and its advisors are actively engaged with capital providers that have expressed an interest in financing the rapid restart of the mine.
 

The PEA was prepared in accordance with National Instrument 43-101 – Standards of Disclosure for Mineral Projects (“NI 43-101”). MineTech USA, LLC (“MineTech”) developed the mine infrastructure, capital expenditures and operating expenditures related portions of the updated PEA as well as the mine plan and operating schedules. Certain assumptions developed in coordination with Resource Development Associates Inc. (“RDA”) and Pro Solv Consulting, LLC., including metallurgical assumptions, remain unchanged from the June PEA. The Company plans to file the completed updated PEA technical report on SEDAR within 45 days of this press release and make it available on the Company’s website. All “t” references in this press release are to short tons and “$” references are in U.S. dollars.

Table 1 summarizes the key findings of the updated PEA relative to those in the June PEA.

Table 1: Updated PEA vs. June PEA

  Updated

PEA
  June

PEA
    % increase/

(decrease)
 
         
Metal Prices        
Zinc ($/lb) 1.15   1.15      
Lead ($/lb) 0.90   0.90      
Silver ($/lb) 20.00   20.00      
         
Financial returns        
After-tax NPV (5%) ($000) 143,471   100,737     42 %
After-tax NPV (8%) ($000) 107,790   78,355     38 %
After-tax IRR (%) 35.2 % 46.2 %   -24 %
Payback (years) 2.6   2.5     4 %
         
Total Cash Flow ($’000)        
EBITDA (3) (4) 383,378   298,018     29 %
Pre-tax free cash flow (3) 284,999   190,944     49 %
Free cash flow (3) 233,310   154,144     51 %
         
Average Annual Cash Flow ($’000)        
EBITDA (3) (4) 34,853   29,802     17 %
Pre-tax free cash flow (3) (4) 29,886
 
  23,298     28 %
Free cash flow (3) (4) 25,187
 
  19,618     28 %
         
Mine Plan        
Mine life (years) 11   10     10 %
         
Total mineralized material mined (kt) 6,377   5,460     17 %
Average zinc grade (%) 5.0 % 5.5 %   -9 %
Average lead grade (%) 2.8 % 2.9 %   -5 %
Average silver grade (oz/t) 1.5   1.5     -3 %
Average zinc equivalent grade (%) (1) 8.7 % 9.3 %   -7 %
         
Total Production over LOM (2)        
Zinc produced (klbs) 591,140   555,977     6 %
Lead produced (klbs) 323,116   290,157     11 %
Silver produced (koz) 8,418   7,401     14 %
Zinc equivalent produced (klbs) (1) 990,416   911,773     9 %
         
Average Unit Costs over LOM        
Opex – total ($/t) 62   78     -21 %
Sustaining capex ($/t) 10   14     -26 %
Cash costs ($/lb Zn payable) (3) 0.33   0.49     -33 %
AISC ($/lb Zn payable) (3) 0.47   0.65     -29 %

(1) Zinc equivalency calculated using metal prices utilized in PEA: $1.15/lb Zn, $0.90/lb Pb, $20/oz Ag

(2) Includes zinc produced in zinc concentrate, lead produced in lead concentrate, silver produced in lead concentrate

(3) Cash costs and AISC per payable pound of zinc sold, earnings before interest, taxes, depreciation and amortization(“EBITDA”), pre-tax free cash flow and free cash flow are non-GAAP financial measures. Please see “Cautionary Note Regarding Non-GAAP Measures”

(4) Life of mine (“LOM”) data post initial capital expenditures

The PEA is preliminary in nature and includes Inferred mineral resources that are considered too speculative geologically to have the economic considerations applied to them that would enable them to be categorized as mineral reserves. There is no certainty that the project described in the PEA will be realized. Mineral resources that are not mineral reserves do not have demonstrated economic viability.

Mineral Resource Inventory

As with the June PEA, the updated PEA is based on the Bunker Hill Mineral Resource, which was published on March 22, 2021, following the drilling program conducted in 2020 and early 2021 to validate the historical reserves. The PEA includes a mining inventory of 6.4Mt, which represents a portion of the 4.4Mt Indicated mineral resource and 5.6Mt Inferred mineral resource. Given the 11-year mine life, the mine plan has been based on prioritizing higher grade material. The mine production schedule is based on an $80 per ton NSR cut-off value, representing a more refined optimization approach relative to the June PEA in which a 5.0% zinc operating cut-off grade was utilized.

Initial Capital Costs

The majority of initial capital costs, including the process plant, shaft and tunnel rehabilitation, remain unchanged from the June 2021 PEA. The marginal increase in total initial capital costs from $42 million (June PEA) to $44 million (updated PEA) primarily reflects higher required up-front investment for waste development to enable the use of long-hole open stoping (“LHOS”) as the predominant mining method in the mine plan, as opposed to the cut and fill method in the June PEA. All initial capital expenditures continue to include a 20% contingency.

Further capital cost optimization initiatives are ongoing, including the potential purchase of used process plant equipment. If successful, these have the potential to accelerate ramp up and reduce initial capital costs.

Mine Plan

For the updated PEA, the Newgard/Quill resource was optimized and scheduled utilizing the long-hole open stoping mining method, whereby stopes are accessed via lateral drifts driven off of a decline ramp connecting the levels vertically. The ramp provides ventilation, utilities, and secondary escapeway, as well as connecting the entire mine with rubber tire access. The LHOS areas are accessed through a combination of existing excavations rehabilitated to modern mining standards, and new excavation. Backfill requirements are provided via an underground paste plant and distribution system.   The LHOS mining results in a step change downwards in mine operating costs from $58 to $41 per ton.

Production commences approximately six months following the start of construction, targeting 200 tons/day (“tpd”) ramping up to 1,000 tpd over the following six months. This ramp up allows for infrastructure components to be completed and commissioned to ensure the mine is adequately developed to maintain consistent production while taking advantage of toll milling for pre-production revenue generation. Initially, production will be targeted above the 9-level as the hoists and first 200-foot section of shaft rehabilitation are completed. The mine plan is developed to allow sequential water draw down and shaft rehabilitation between levels as new production horizons are required. This sequencing is continued to the 26-level.

Table 2: Mine Schedule

Year (1) Pre-prod Year 1 Year 2 Year 3 Year 4 Year 5 Year 6 Year 7 Year 8 Year 9 Year 10 Year 11 Year 12 LOM

Total
June

PEA
                               
Mineralized material mined (kt) 135   396   548   548   548   548   548   548   548   548   548   548   372   6,377   5,460  
                               
Zinc grade (%) 6.9 % 6.6 % 5.2 % 6.3 % 5.8 % 5.1 % 4.7 % 5.7 % 4.7 % 5.2 % 3.4 % 2.1 % 5.7 % 5.0 % 5.5 %
Lead grade (%) 2.3 % 2.3 % 2.8 % 2.1 % 1.8 % 2.2 % 1.3 % 2.2 % 2.3 % 1.8 % 4.3 % 6.5 % 4.3 % 2.8 % 2.9 %
Silver grade (oz/t) 0.3   0.7   1.2   1.1   0.5   1.2   1.0   1.4   1.4   1.2   2.7   3.7   2.0   1.5   1.5  
                               
Zinc eq grade (%) (2) 9.0 % 9.1 % 8.6 % 9.0 % 7.7 % 8.1 % 6.8 % 8.9 % 7.8 % 7.8 % 9.5 % 10.9 % 11.0 % 8.7 % 9.3 %

(1) Pre-production represents the first 12 months of the initial capex period; Years 1-11 represent 12-month periods, Year 12 represents 6-month period

(2) Zinc equivalency calculated using metal prices utilized in PEA: $1.15/lb Zn, $0.90/lb Pb, $20/oz Ag

Processing

The processing flowsheet and metallurgical assumptions as envisaged in the June PEA remain unchanged, with a crushing and milling plant to be centrally located on the 9-level, and milled material to be pumped in slurry to the flotation and paste plant on the 5-level. The flotation plant will generate concentrates which will be transported to surface for shipment. The paste plant will generate paste for geotechnical fill and tailings disposal in open drifts and stopes in the mine. This approach optimizes material transport costs while eliminating the need for surface tailings disposal.

Historical metallurgical results have been used for concentrate recoveries and grade. The results were averaged for the last five years of operation. The lead concentrate, assaying an average 67% Pb and 34 oz/t Ag, is estimated to recover 91% Pb and 89% Ag. The zinc concentrate, assaying 58% Zn, is estimated to recover 92% Zn. Metallurgical test work remains ongoing at RDI, with preliminary results received supporting assumptions used in the PEA.

The production schedule is presented in the Table below.

Table 3: Production Schedule

Year (1) Pre-prod Year 1 Year 2 Year 3 Year 4 Year 5 Year 6 Year 7 Year 8 Year 9 Year 10 Year 11 Year 12 LOM

Total
June

PEA
                               
Zn conc. (t) 14,674 41,556 45,549 54,838 50,395 44,634 41,221 49,781 40,461 44,755 29,735 18,366 33,638 509,603 479,290
Pb conc. (t) 4,159 12,314 20,953 15,440 13,052 16,000 9,842 16,183 17,228 13,493 32,319 48,674 21,474 241,131 216,535
                               
Zn prod. (klbs) 17,022 48,204 52,837 63,613 58,459 51,776 47,816 57,745 46,935 51,916 34,492 21,304 39,020 591,140 555,977
Pb prod. (klbs) 5,573 16,500 28,077 20,690 17,489 21,441 13,188 21,686 23,086 18,080 43,308 65,223 28,776 323,116 290,157
Ag prod. (koz) 38 238 575 515 249 603 479 700 668 576 1,320 1,792 663 8,418 7,401
                               
Zn eq. prod. (klbs) 2) 22,052 65,261 84,803 88,755 76,484 79,049 66,470 86,886 76,621 76,089 91,347 103,520 73,079 990,416 911,773

(1) Pre-production represents the first 12 months of the initial capex period; Years 1-11 represent 12-month periods, Year 12 represents 6-month period

(2) Zinc equivalency calculated using metal prices utilized in PEA: $1.15/lb Zn, $0.90/lb Pb, $20/oz Ag

Operating and Sustaining Capital Costs

Cash costs and AISC per payable pound of zinc sold are non-GAAP financial measures. Please see “Cautionary Note Regarding Non-GAAP Measures”.

Mine operating costs are based on experienced local contract labor and equipment for mining operations. A zero-based efficiency and cost estimate was completed based on current underground contractors’ rates and guidance benchmarked against other like operations. Electrical power costs are based on scheduled projected loads applying an estimated power factor correction and applicable Avista Utilities rates for all projected mine, milling and site operations.

Mill operating costs are within guidance resulting from bench marking similar mill operations in north Idaho. Mine site general and administrative (G&A) costs are determined based on anticipated staffing levels and similar compensation compatible with area salaries.

All sustaining capital costs include a 20% contingency.

Annual and LOM cost metrics are presented in the Table below.

Table 4: Operating and Sustaining Capital Costs

Year (1) Year 1 Year 2 Year 3 Year 4 Year 5 Year 6 Year 7 Year 8 Year 9 Year 10 Year 11 Year 12 LOM

Total
June

PEA
                             
Mining ($/t) 65 54 47 40 39 40 39 39 38 38   35   41 41 58
Processing ($/t) 15 15 15 15 15 15 15 15 15 15   15   15 15 15
G&A ($/t) 11 6 6 6 6 6 6 6 6 6   5   4 6 6
Opex – total ($/t) 90
 
74 68 61 60 60 60 60 59 59   54   59 62 78
                             
Sustain capex ($/t) 29 12 13 12 12 9 20 9 8 7   1   0 10 14
                             
Cash costs ($/lb Zn) 0.76 0.54 0.54 0.62 0.45 0.66 0.40 0.42 0.50 (0.40 ) (2.18 ) 0.02 0.33 0.49
AISC ($/lb Zn) 1.04 0.69 0.67 0.76 0.60 0.78 0.63 0.54 0.60 (0.27 ) (2.14 ) 0.02 0.47 0.65

(1) “Year 1” and “Year 12” are expressed on a 6-month basis; all other years on a 12-month basis

Cash Flow & Valuation

EBITDA, pre-tax free cash flow and free cash flow are non-GAAP financial measures. Please see “Cautionary Note Regarding Non-GAAP Measures”.

Post initial capital expenditures, the project is expected to generate pre-tax free cash flow of $329 million (41% increase relative to the June PEA) over its 11-year mine life and after-tax free cash flow of $275 million (41% increase relative to the June PEA). The Company expects to reinvest a portion of its pre-tax cash flows on high-grade silver targets in the existing mine footprint and those delineated by its geophysics program, which may reduce the tax assumptions accounted for in the project economics. Annual free cash flow increases in later years of the mine plan due to higher silver grades at deeper elevations.

The financial summary is presented in the Table below.

Table 5: Cash Flow & Valuation

Year in $’000 (1) Initial

Capex
Year 1 Year 2 Year 3 Year 4 Year 5 Year 6 Year 7 Year 8 Year 9 Year 10 Year 11 Year 12 LOM

Total
June

PEA
                               
Zinc revenue   24,664   51,649   62,181   57,143   50,611   46,740   56,446   45,878   50,748   33,716   20,825   38,143   538,744   521,583  
Lead revenue   7,870   24,005   17,690   14,953   18,332   11,276   18,541   19,738   15,459   37,028   55,766   24,603   265,262   241,311  
Silver revenue   3,110   10,917   9,778   4,740   11,464   9,103   13,295   12,694   10,950   25,085   34,055   12,605   157,797   137,286  
Gross revenue   35,643   86,571   89,649   76,836   80,407   67,120   88,283   78,311   77,157   95,830   110,646   75,351   961,803   900,181  
TC/RC & freight   (7,917 ) (18,615 ) (19,577 ) (17,421 ) (17,074 ) (14,352 ) (18,629 ) (16,352 ) (16,402 ) (18,273 ) (20,146 ) (15,640 ) (200,398 ) (189,419 )
NSR   27,727   67,955   70,072   59,416   63,333   52,767   69,654   61,960   60,754   77,557   90,500   59,711   761,405   710,762  
Mining   (13,873 ) (29,336 ) (25,979 ) (22,103 ) (21,527 ) (21,732 ) (21,576 ) (21,503 ) (20,949 ) (20,949 ) (19,115 ) (15,216 ) (253,858 ) (304,887 )
Processing   (3,136 ) (8,004 ) (8,004 ) (8,004 ) (8,004 ) (8,004 ) (8,004 ) (8,004 ) (8,004 ) (8,004 ) (8,004 ) (5,435 ) (88,616 ) (77,011 )
G&A   (2,255 ) (3,167 ) (3,167 ) (3,167 ) (3,167 ) (3,167 ) (3,167 ) (3,167 ) (3,167 ) (3,167 ) (3,167 ) (1,630 ) (35,553 ) (30,845 )
EBITDA   8,463   27,448   32,922   26,141   30,634   19,864   36,907   29,286   28,634   45,437   60,213   37,429   383,378   298,018  
Sustain capex   (6,190 ) (6,725 ) (6,876 ) (6,832 ) (6,507 ) (4,834 ) (11,215 ) (4,811 ) (4,440 ) (3,931 ) (685 ) (54 ) (63,098 ) (73,503 )
Initial capex (43,743 )                         (43,743 ) (42,034 )
Salvage                                               8,463   8,463   8,463  
Pre-tax FCF (43,743 ) 2,273   20,723   26,046   19,310   24,127   15,030   25,692   24,475   24,195   41,506   59,529   45,838   284,999   190,944  
Taxes (517 ) (268 ) (2,500 ) (4,706 ) (3,003 ) (4,112 ) (1,446 ) (4,964 ) (3,749 ) (3,316 ) (6,999 ) (9,789 ) (6,323 ) (51,690 ) (36,800 )
FCF (44,260 ) 2,006   18,223   21,340   16,307   20,016   13,584   20,728   20,726   20,879   34,507   49,740   39,515   233,310   154,144  
                               
Annual metrics – post initial capex (2)                          
Gross revenue   79,402   88,793   82,917   77,791   73,763   77,701   83,297   77,734   86,493   103,238   130,674     961,803   900,181  
EBITDA   22,252   30,837   29,515   27,687   25,249   28,385   33,096   28,960   37,035   52,825   67,535     383,378   298,018  
Pre-tax FCF   12,882   24,088   21,897   21,548   19,578   20,361   25,083   24,335   32,850   50,517   75,602     328,742   232,978  
FCF   11,365   20,485   18,042   17,991   16,800   17,156   20,727   20,803   27,693   42,124   64,385     277,570   196,498  
                               
NPV (5%) 143,471                              
NPV (8%) 107,790                              
                               
IRR (%) 35.2 %                            
Payback (years) 2.6                              

(1) Initial capex period is expressed on an 18-month basis; “Year 1” and “Year 12” are expressed on a 6-month basis; all other years on a 12-month basis

(2) All metrics expressed on a 12-month basis, beginning after the 18-month initial capex period

Sensitivities

The tables below summarize the after-tax sensitivities of NPV and IRR, with respect to metal prices and costs.

Table 6: Sensitivities

    Metal Prices   Operating & Capital Costs
                                 
NPV (5%)

($M)
 
      Zinc Price ($/lb)       Operating Costs (+/- %)
      0.85   1.00   1.15   1.30   1.45           -20 % -10 % 0 % 10 % 20 %
  Lead

Price

($/lb)
 
0.70 19   66   110   154   198     Total

Capital

Costs

(+/-

%)
 
-20 % 210   185   159   133   107  
  0.80 37   83   127   171   215     -10 % 203   177   151   125   100  
  0.90 55   99   143   187   232     0 % 195   169   143   118   92  
  1.00 72   116   160   204   249     10 % 187   162   136   110   84  
  1.10 89   133   177   221   266     20 % 180   154   128   102   77  
                                 
IRR (%)
 
      Zinc Price ($/lb)       Operating Costs (+/- %)
      0.85   1.00   1.15   1.30   1.45           -20 % -10 % 0 % 10 % 20 %
  Lead

Price

($/lb)
 
0.70 8 % 18 % 28 % 40 % 53 %   Total

Capital

Costs

(+/-

%)
 
-20 % 63 % 53 % 43 % 35 % 28 %
  0.80 11 % 21 % 32 % 44 % 57 %   -10 % 56 % 47 % 39 % 32 % 25 %
  0.90 14 % 24 % 35 % 47 % 61 %   0 % 51 % 43 % 35 % 29 % 23 %
  1.00 18 % 27 % 39 % 51 % 65 %   10 % 46 % 39 % 32 % 26 % 20 %
  1.10 21 % 31 % 42 % 55 % 70 %   20 % 42 % 35 % 29 % 23 % 18 %

QUALIFIED PERSON
 

Mr. Scott E. Wilson, CPG, President of Resource Development Associates Inc. and a consultant to the Company, is an Independent “Qualified Person” as defined by NI 43-101 and is acting at the Qualified Person for the Company. He has reviewed and approved the technical information summarized in this news release.

UPCOMING EVENTS

6ix Investor Event

September 21, 2021 @ 11:00am ET / 8:00am PT

Join Us: [LINK]

StockPulse Silver Symposium

September 27-28, 2021

Join Us: REGISTER NOW

ABOUT BUNKER HILL MINING CORP.

Under new Idaho-based leadership, Bunker Hill Mining Corp. intends to sustainably restart and develop the Bunker Hill Mine as the first step in consolidating a portfolio of North American precious-metal assets with a focus on silver. Information about the Company is available on its website, www.bunkerhillmining.com, or within the SEDAR and EDGAR databases.

For additional information contact: ir@bunkerhillmining.com

CAUTIONARY STATEMENTS

Certain statements in this news release are forward-looking and involve a number of risks and uncertainties. Such forward-looking statements are within the meaning of that term in Section 27A of the Securities Act of 1933, as amended, and Section 21E of the Securities Exchange Act of 1934, as amended, as well as within the meaning of the phrase ‘forward-looking information’ in the Canadian Securities Administrators’ National Instrument 51-102 – Continuous Disclosure Obligations. Forward-looking statements are not comprised of historical facts. Forward-looking statements include estimates and statements that describe the Company’s future plans, objectives or goals, including words to the effect that the Company or management expects a stated condition or result to occur. Forward-looking statements may be identified by terminology such as “may”, “will”, “could”, “should”, “expect”, “plan”, “anticipate”, “believe”, “intend”, “estimate”, “projects”, “predict”, “potential”, “continue” or other similar expressions concerning matters that are not historical facts. Since forward-looking statements are based on assumptions and address future events and conditions, by their very nature they involve inherent risks and uncertainties. Although these statements are based on information currently available to the Company, the Company provides no assurance that actual results will meet management’s expectations. Risks, uncertainties and other factors involved with forward-looking information could cause actual events, results, performance, prospects and opportunities to differ materially from those expressed or implied by such forward-looking information. The key risks and uncertainties include, but are not limited to: local and global political and economic conditions; governmental and regulatory requirements and actions by governmental authorities, including changes in government policy, government ownership requirements, changes in environmental, tax and other laws or regulations and the interpretation thereof; developments with respect to the coronavirus disease 2019 (“COVID-19”) pandemic, including the duration, severity and scope of the pandemic and potential impacts on mining operations; and other risk factors detailed from time to time in the Company’s reports filed on SEDAR and EDGAR. Forward-looking information and statements in this news release include statements concerning, among other things: the potential of the Bunker Hill Mine to be re-started rapidly as a low-cost, long life, sustainable operation based on the results of the PEA; the PEA representing robust financial returns; the potential of the restart plan to create jobs, ensure long-term environmental-management partnerships, and drive the long-term development of the Bunker Hill Mine’s resources; the timing for filing the PEA technical report; the timing, amount and duration of future production; future cash costs and AISC; commodity prices; the estimated capital and operating costs; the Company’s ability to discover new mineralization; the Company’s ability to self-fund high-grade silver exploration efforts to further increase cash flow margins; the timing for the Company’s progression of further technical studies and project finance discussions; potential sustainability impacts based on the results of the PEA, including the Bunker Hill Mine’s development and operations generating new jobs in Shoshone County, with such job creation having the potential to reduce unemployment in the county, procurement by the Bunker Hill Mine injecting additional funds into the local economy annually, and the Bunker Hill Mine achieving carbon neutrality in year one of operations and maintaining a minimal environmental footprint for the LOM; the potential for a reduction in the production of acid rock drainage; the potential for a reduction in the challenge and cost of water management; LOM capital improvements; metal recoveries; the Company’s plans to reinvest a portion of its pre-tax cash flows on its high-grade silver program; the Company’s goal to significantly increase free cash flow in the earlier years of the PEA based on its ongoing high-grade silver exploration program; the estimates of free cash flow, net present value and economic returns from the Bunker Hill Mine based on the results of the PEA; opportunities to increase the economics of the Bunker Hill Mine; our plans and expectations for the Bunker Hill Mine; and the Company’s intentions regarding its objectives, goals or future plans and statements. Factors that could cause actual results to differ materially from such forward-looking information include, but are not limited to: the ability to predict and counteract the effects of COVID-19 on the business of the Company, including but not limited to the effects of COVID19 on the price of commodities, capital market conditions, restriction on labor and international travel and supply chains; failure to identify mineral resources; failure to convert estimated mineral resources to reserves; the inability to complete a feasibility study which recommends a production decision; the preliminary nature of metallurgical test results; delays in obtaining or failures to obtain required governmental, environmental or other project approvals; political risks; changes in equity markets; uncertainties relating to the availability and costs of financing needed in the future; the inability of the Company to budget and manage its liquidity in light of the failure to obtain additional financing, including the ability of the Company to complete the payments pursuant to the terms of the agreement to acquire the Bunker Hill Mine Complex; inflation; changes in exchange rates; fluctuations in commodity prices; delays in the development of projects; capital, operating and reclamation costs varying significantly from estimates and the other risks involved in the mineral exploration and development industry; and those risks set out in the Company’s public documents filed on SEDAR and EDGAR. Although the Company believes that the assumptions and factors used in preparing the forward-looking information in this news release are reasonable, undue reliance should not be placed on such information, which only applies as of the date of this news release, and no assurance can be given that such events will occur in the disclosed time frames or at all. The Company disclaims any intention or obligation to update or revise any forward-looking information, whether as a result of new information, future events or otherwise, other than as required by law. No stock exchange, securities commission or other regulatory authority has approved or disapproved the information contained herein.

Cautionary Note to United States Investors

This press release has been prepared in accordance with the requirements of the securities laws in effect in Canada, which differ from the requirements of U.S. securities laws. Unless otherwise indicated, all resource and reserve estimates included in this press release have been disclosed in accordance with NI 43-101 and the Canadian Institute of Mining, Metallurgy, and Petroleum Definition Standards on Mineral Resources and Mineral Reserves. NI 43-101 is a rule developed by the Canadian Securities Administrators which establishes standards for all public disclosure an issuer makes of scientific and technical information concerning mineral projects. Canadian disclosure standards, including NI 43-101, differ significantly from the requirements of the United States Securities and Exchange Commission (“SEC”), and resource and reserve information contained in this press release may not be comparable to similar information disclosed by U.S. companies. In particular, and without limiting the generality of the foregoing, the term “resource” does not equate to the term “reserves”. Under U.S. standards, mineralization may not be classified as a “reserve” unless the determination has been made that the mineralization could be economically and legally produced or extracted at the time the reserve determination is made. The SEC’s disclosure standards normally do not permit the inclusion of information concerning “measured mineral resources”, “indicated mineral resources” or “inferred mineral resources” or other descriptions of the amount of mineralization in mineral deposits that do not constitute “reserves” by U.S. standards in documents filed with the SEC. Investors are cautioned not to assume that any part or all of mineral deposits in these categories will ever be converted into reserves. U.S. investors should also understand that “inferred mineral resources” have a great amount of uncertainty as to their existence and great uncertainty as to their economic and legal feasibility. It cannot be assumed that all or any part of an “inferred mineral resource” will ever be upgraded to a higher category. Investors are cautioned not to assume that all or any part of an “inferred mineral resource” exists or is economically or legally mineable. Disclosure of “contained ounces” in a resource is permitted disclosure under Canadian regulations; however, the SEC normally only permits issuers to report mineralization that does not constitute “reserves” by SEC standards as in-place tonnage and grade without reference to unit measures. The requirements of NI 43-101 for disclosure of “reserves” are also not the same as those of the SEC, and reserves disclosed by the Company in accordance with NI 43-101 may not qualify as “reserves” under SEC standards. Accordingly, information concerning mineral deposits may not be comparable with information made public by companies that report in accordance with U.S. standards.

Cautionary Note Regarding Non-GAAP Measures

This news release includes certain terms or performance measures commonly used in the mining industry that are not defined under International Financial Reporting Standards (“IFRS”) or U.S. GAAP, including cash costs and AISC per payable pound of zinc sold, EBITDA, pre-tax cash flow and free cash flow. Non-GAAP measures do not have any standardized meaning prescribed under IFRS or U.S. GAAP and, therefore, they may not be comparable to similar measures employed by other companies. The Company believes that, in addition to conventional measures prepared in accordance with IFRS and U.S. GAAP, certain investors use this information to evaluate its performance. The data presented is intended to provide additional information and should not be considered in isolation or as a substitute for measures of performance prepared in accordance with IFRS or U.S. GAAP.

Mining Veteran Tom Obradovich Joins FenixOro Advisory Committee


Mining Veteran Tom Obradovich Joins FenixOro Advisory Committee


TORONTO, Sept. 20, 2021 (GLOBE NEWSWIRE) — FenixOro Gold Corp (CSE:FENX) (OTCQB:FDVXF) (Frankfurt:8FD) is pleased to announce that Tom Obradovich, a notably successful and experienced mining investor and entrepreneur, has joined the Fenix Oro Advisory Committee.

Born and raised into a mining family in Kirkland Lake, OntarioMr. Obradovich is a graduate of the Haileybury School of Mines in Mining Technology and Advanced Field Geophysics. He has a wide range of experience in mining exploration, development and financing. Over a career of thirty-eight years he has enjoyed significant success as a number of projects he has been involved in have gone onto become producing mines acquired by major mining companies.

Tom cofounded Canadian Royalties Inc. which discovered and developed the Raglan South Nickel Belt. He then acquired most of the Matachewan Gold Camp and through a reverse takeover of Young-Davidson Mines, upgraded and doubled the resource. The company was subsequently acquired by Northgate Minerals and the project is currently producing over 200,000 oz of gold per year for Alamos Gold Inc. (TSX:AGI).

He was also one of the founders of Aurelian Resources Inc. which discovered the Fruta Del Norte gold deposit in Ecuador and was subsequently acquired by Kinross Gold (TSX:K) for $1.2 Billion. The project is now producing approximately 400,000 oz of gold per year for Lundin Gold (TSX:LUG).

Mr. Obradovich became President and CEO of Barkerville Gold Mines in January of 2015 and led the management team to turn the company into a debt free mining and exploration vehicle with a market capital in excess of $200 million and $60 million in treasury when he resigned in July 2016. Barkerville was subsequently acquired by Osisko Mining (TSX:OSK). He was also Lead Director of Dalradian Resources, a company that developed a multi-million ounce gold deposit in Northern Ireland and was subsequently sold for $560 million to Orion Mine Finance.

Tom is currently the Chairman of Sable Resources, a pure greenfields exploration company developing the Don Julio Project through a joint venture in San Juan Province, Argentina.

FenixOro CEO John Carlesso commented: “Tom Obradovich is a seasoned and highly respected veteran in the mining industry and we are very fortunate to have his support on the Advisory Committee. As we continue to grow and develop the Abriaqui gold deposit, Tom’s vast knowledge and experience will bring tremendous value to our decision-making process.”

The Company has granted 1,200,000 stock options to advisors and consultants. The options have an exercise price of 32 cents and expire 5 years from the grant date.

About FenixOro Gold Corp.

FenixOro Gold Corp is a Canadian company focused on acquiring and exploring gold projects with world class exploration potential in the most prolific gold producing regions of Colombia. FenixOro’s flagship property, the Abriaqui project, is the closest project to Continental Gold’s Buritica project. It is located 15 km to the west in Antioquia State at the northern end of the Mid-Cauca gold belt, a geological trend which has seen multiple large gold discoveries in the past 10 years including Buritica and Anglo Gold’s Nuevo Chaquiro and La Colosa. As documented in “NI 43-101 Technical Report on the Abriaqui project Antioquia State, Colombia” (December 5, 2019), the geological characteristics of Abriaqui and Buritica are similar. Since the preparation of this report a Phase 1 drilling program has been completed at Abriaqui resulting in a significant discovery of a high grade, “Buritica style” gold deposit. A Phase 2 drilling program has recently commenced.

FenixOro’s VP of Exploration, Stuart Moller, led the discovery team at Buritica for Continental Gold in 2007-2011. At the time of its latest public report, the Buritica Mine contains measured plus indicated resources of 5.32 million ounces of gold (16.02 Mt grading 10.32 g/t) plus a 6.02 million ounce inferred resource (21.87 Mt grading 8.56 g/t) for a total of 11.34 million ounces of gold resources Buritica began formal production in November 2020 and has expected annual average production of 250,000 ounces at an all-in sustaining cost of approximately US$600 per ounce. Resources, cost and production data are taken from Continental Gold’s “NI 43-101 Buritica Mineral Resource 2019-01, Antioquia, Colombia, 18 March, 2019”). Continental Gold was recently the subject of a takeover by Zijin Mining in an all-cash transaction valued at C$1.4 billion.

FenixOro Gold Corp
John Carlesso, CEO
Email: info@FenixOro.com
Website: www.FenixOro.com
Telephone: 1-833-ORO-GOLD

Allegiant Gold (AUXXF)(AUAU:CA) – Getting Ready for the Next Round of Drilling

Wednesday, September 15, 2021

Allegiant Gold (AUXXF)(AUAU:CA)
Getting Ready for the Next Round of Drilling

Allegiant Gold Ltd is a gold exploration company. Its project profile consists of Bolo, Browns Canyon, Clara Moro, Four Metals, Monitor Hills, Red Hills, Silver Dome, West Goldfield, White Horse Flats, Mogollon, Eastside, Dutch Flat, and others.

Mark Reichman, Senior Research Analyst of Natural Resources, Noble Capital Markets, Inc.

Refer to the full report for the price target, fundamental analysis, and rating.

    Drilling program. We think Allegiant could commence drilling in October using both reverse circulation (RC) and diamond core drill rigs. The number of rigs may depend on availability which is tight. The company is in the process of securing drilling contractors. Over the next twelve months, management expects to drill 60 to 70 holes, representing approximately 23,000 meters of drilling at targets located within the existing resource pit shell and at other exploration targets. This includes 10 holes, or 6,000 meters, of diamond core drilling along the western edge of the original pit zone and 50 to 60 holes, or 17,000 meters, of step-out and exploration drilling. The company’s recent financing provides financial flexibility to fund planned activities.

    Permit expected shortly.  Because there are significant opportunities to continue to develop the original pit zone by expanding the permitted area from 601 acres to 3,600 acres, exploration drilling will include areas outside the current permitted area, including the East Pediment Zone. We expect the company to receive the permit within the next several weeks …


This Company Sponsored Research is provided by Noble Capital Markets, Inc., a FINRA and S.E.C. registered broker-dealer (B/D).

*Analyst certification and important disclosures included in the full report. NOTE: investment decisions should not be based upon the content of this research summary.  Proper due diligence is required before making any investment decision. 

Release – Aurania Refines Tatasham Target In Preparation For Drilling


Aurania Refines Tatasham Target In Preparation For Drilling


Toronto, Ontario, September 13, 2021 – Aurania Resources Ltd. (TSXV: ARU) (OTCQB: AUIAF) (Frankfurt: 20Q) (“Aurania” or the “Company”) reports on geophysical modelling that has refined the shape of the Tatasham target, a feature that has characteristics of a porphyry, a deposit type that contains over half of the world’s copper resources.  Tatasham is located near the western margin of the Company’s Lost Cities – Cutucu Project area (“Project”) in southeastern Ecuador.

Aurania’s Chairman & CEO, Dr. Keith Barron commented, “Tatasham is the largest geophysical feature identified in the airborne magnetic survey that we carried out over the whole concession area in 2017.  We subsequently covered the target area in the MobileMT survey completed earlier this year.  We believe that our geophysical inversion contractors have made a breakthrough in the inversion of MobileMT geophysical data acquired in mountainous areas like the Project area.  The 3D inverted MobileMT and magnetic data define a magnetic core that is approximately 3 kilometres in diameter that could be the central part of a porphyry which is partially enclosed by a conductive zone that could be due to the presence of sulphides – which is where most of the mineralization is located in copper porphyries.  Now that the target shape has been refined by remodelling of the geophysical data, we’re doing some final field-checking and are preparing to drill Tatasham this year in Q4.”   

To watch Keith Barron’s presentation from the 2021 Precious Metals Summit Beaver Creek, held September 8-11, 2021, please click here.  Please note that registration is required in order to view the replay of the webcast presentation.

An early description of the Tatasham target can be found in a video (starting at minute mark 1:10) on our website entitled “Metron Probability Update Part III – Making Sense of our Magnetic Data”.

Tatasham Target

The core of the Tatasham target is a magnetic cylinder 3km-4km in diameter that is partially enclosed by a conductive zone derived from a totally different dataset – MobileMT (Figure 1).  This geophysical model is consistent with a magnetic porphyry at the centre with an adjacent sulphide-bearing conductive zone – where mineralization is typically located.

Drilling is planned for Q4, 2021.  Details of the drilling, in terms of metreage and number of planned holes, will be announced in due course.

Details of the Geophysical Modelling

Original processing of magnetic data from the 2017 geophysical survey showed the Tatasham magnetic feature (negative reduction to the pole) having a diameter of over 10km – the largest in the Project area.  Refined processing of the magnetic data by three-dimensional magnetic vector inversion has resulted in a better-defined, smaller magnetic feature that is 3km-4km in diameter.   In addition, three-dimensional inversion of MobileMT data has refined the location of conductive areas that are consistent with geological data.

Modelling of the magnetic and MobileMT data was carried out by Geotexera Inc. of St. John’s, Newfoundland, Canada.

Figure 1.  Images of combined 3D magnetic vector inversion (grey body) with the 3D inversion of MobileMT data.


Qualified Person

The geological information contained in this news release has been verified and approved by Jean-Paul Pallier, MSc.  Mr. Pallier is a designated EurGeol by the European Federation of Geologists and a Qualified Person as defined by National Instrument 43-101, Standards of Disclosure for Mineral Projects of the Canadian Securities Administrators.


About Aurania

Aurania is a mineral exploration company engaged in the identification, evaluation, acquisition and exploration of mineral property interests, with a focus on precious metals and copper in South America.  Its flagship asset, The Lost Cities – Cutucu Project, is located in the Jurassic Metallogenic Belt in the eastern foothills of the Andes mountain range of southeastern Ecuador.

Information on Aurania and technical reports are available at www.aurania.com and www.sedar.com, as well as on Facebook at https://www.facebook.com/auranialtd/, Twitter at  https://twitter.com/auranialtd, and LinkedIn at https://www.linkedin.com/company/aurania-resources-ltd-.

For further information, please contact:

Carolyn Muir

VP Investor Relations

Aurania Resources Ltd.

(416) 367-3200

carolyn.muir@aurania.com

Dr. Richard Spencer

President

Aurania Resources Ltd.

(416) 367-3200

richard.spencer@aurania.com

Neither the TSX Venture Exchange nor its Regulation Services Provider (as that term is defined in the policies of the TSX Venture Exchange) accepts responsibility for the adequacy or accuracy of this release.

Forward-Looking Statements

This news release may contain forward-looking information that involves substantial known and unknown risks and uncertainties, most of which are beyond the control of Aurania. Forward-looking statements include estimates and statements that describe Aurania’s future plans, objectives or goals, including words to the effect that Aurania or its management expects a stated condition or result to occur. Forward-looking statements may be identified by such terms as “believes”, “anticipates”, “expects”, “estimates”, “may”, “could”, “would”, “will”, or “plan”. Since forward-looking statements are based on assumptions and address future events and conditions, by their very nature they involve inherent risks and uncertainties. Although these statements are based on information currently available to Aurania, Aurania provides no assurance that actual results will meet management’s expectations. Risks, uncertainties and other factors involved with forward-looking information could cause actual events, results, performance, prospects and opportunities to differ materially from those expressed or implied by such forward-looking information. Forward looking information in this news release includes, but is not limited to Aurania’s objectives, goals or future plans, statements, exploration results, potential mineralization, the corporation’s portfolio, treasury, management team and enhanced capital markets profile, the estimation of mineral resources, exploration, timing of the commencement of operations and estimates of market conditions. Factors that could cause actual results to differ materially from such forward-looking information include, but are not limited to, failure to identify mineral resources, failure to convert estimated mineral resources to reserves, the inability to complete a feasibility study which recommends a production decision, the preliminary nature of metallurgical test results, delays in obtaining or failures to obtain required governmental, regulatory, environmental or other project approvals, political risks, inability to fulfill the duty to accommodate indigenous peoples, uncertainties relating to the availability and costs of financing needed in the future, changes in equity markets, inflation, changes in exchange rates, fluctuations in commodity prices, delays in the development of projects, capital and operating costs varying significantly from estimates and the other risks involved in the mineral exploration and development industry, the effects of COVID-19 on the business of the Company including but not limited to the effects of COVID-19 on the price of commodities, capital market conditions, restrictions on labour and international travel and supply chains, and those risks set out in Aurania’s public documents filed on SEDAR. Although Aurania believes that the assumptions and factors used in preparing the forward-looking information in this news release are reasonable, undue reliance should not be placed on such information, which only applies as of the date of this news release, and no assurance can be given that such events will occur in the disclosed time frames or at all. Aurania disclaims any intention or obligation to update or revise any forward-looking information, whether as a result of new information, future events or otherwise, other than as required by law.

Aurania Refines Tatasham Target In Preparation For Drilling


Aurania Refines Tatasham Target In Preparation For Drilling


Toronto, Ontario, September 13, 2021 – Aurania Resources Ltd. (TSXV: ARU) (OTCQB: AUIAF) (Frankfurt: 20Q) (“Aurania” or the “Company”) reports on geophysical modelling that has refined the shape of the Tatasham target, a feature that has characteristics of a porphyry, a deposit type that contains over half of the world’s copper resources.  Tatasham is located near the western margin of the Company’s Lost Cities – Cutucu Project area (“Project”) in southeastern Ecuador.

Aurania’s Chairman & CEO, Dr. Keith Barron commented, “Tatasham is the largest geophysical feature identified in the airborne magnetic survey that we carried out over the whole concession area in 2017.  We subsequently covered the target area in the MobileMT survey completed earlier this year.  We believe that our geophysical inversion contractors have made a breakthrough in the inversion of MobileMT geophysical data acquired in mountainous areas like the Project area.  The 3D inverted MobileMT and magnetic data define a magnetic core that is approximately 3 kilometres in diameter that could be the central part of a porphyry which is partially enclosed by a conductive zone that could be due to the presence of sulphides – which is where most of the mineralization is located in copper porphyries.  Now that the target shape has been refined by remodelling of the geophysical data, we’re doing some final field-checking and are preparing to drill Tatasham this year in Q4.”   

To watch Keith Barron’s presentation from the 2021 Precious Metals Summit Beaver Creek, held September 8-11, 2021, please click here.  Please note that registration is required in order to view the replay of the webcast presentation.

An early description of the Tatasham target can be found in a video (starting at minute mark 1:10) on our website entitled “Metron Probability Update Part III – Making Sense of our Magnetic Data”.

Tatasham Target

The core of the Tatasham target is a magnetic cylinder 3km-4km in diameter that is partially enclosed by a conductive zone derived from a totally different dataset – MobileMT (Figure 1).  This geophysical model is consistent with a magnetic porphyry at the centre with an adjacent sulphide-bearing conductive zone – where mineralization is typically located.

Drilling is planned for Q4, 2021.  Details of the drilling, in terms of metreage and number of planned holes, will be announced in due course.

Details of the Geophysical Modelling

Original processing of magnetic data from the 2017 geophysical survey showed the Tatasham magnetic feature (negative reduction to the pole) having a diameter of over 10km – the largest in the Project area.  Refined processing of the magnetic data by three-dimensional magnetic vector inversion has resulted in a better-defined, smaller magnetic feature that is 3km-4km in diameter.   In addition, three-dimensional inversion of MobileMT data has refined the location of conductive areas that are consistent with geological data.

Modelling of the magnetic and MobileMT data was carried out by Geotexera Inc. of St. John’s, Newfoundland, Canada.

Figure 1.  Images of combined 3D magnetic vector inversion (grey body) with the 3D inversion of MobileMT data.


Qualified Person

The geological information contained in this news release has been verified and approved by Jean-Paul Pallier, MSc.  Mr. Pallier is a designated EurGeol by the European Federation of Geologists and a Qualified Person as defined by National Instrument 43-101, Standards of Disclosure for Mineral Projects of the Canadian Securities Administrators.


About Aurania

Aurania is a mineral exploration company engaged in the identification, evaluation, acquisition and exploration of mineral property interests, with a focus on precious metals and copper in South America.  Its flagship asset, The Lost Cities – Cutucu Project, is located in the Jurassic Metallogenic Belt in the eastern foothills of the Andes mountain range of southeastern Ecuador.

Information on Aurania and technical reports are available at www.aurania.com and www.sedar.com, as well as on Facebook at https://www.facebook.com/auranialtd/, Twitter at  https://twitter.com/auranialtd, and LinkedIn at https://www.linkedin.com/company/aurania-resources-ltd-.

For further information, please contact:

Carolyn Muir

VP Investor Relations

Aurania Resources Ltd.

(416) 367-3200

carolyn.muir@aurania.com

Dr. Richard Spencer

President

Aurania Resources Ltd.

(416) 367-3200

richard.spencer@aurania.com

Neither the TSX Venture Exchange nor its Regulation Services Provider (as that term is defined in the policies of the TSX Venture Exchange) accepts responsibility for the adequacy or accuracy of this release.

Forward-Looking Statements

This news release may contain forward-looking information that involves substantial known and unknown risks and uncertainties, most of which are beyond the control of Aurania. Forward-looking statements include estimates and statements that describe Aurania’s future plans, objectives or goals, including words to the effect that Aurania or its management expects a stated condition or result to occur. Forward-looking statements may be identified by such terms as “believes”, “anticipates”, “expects”, “estimates”, “may”, “could”, “would”, “will”, or “plan”. Since forward-looking statements are based on assumptions and address future events and conditions, by their very nature they involve inherent risks and uncertainties. Although these statements are based on information currently available to Aurania, Aurania provides no assurance that actual results will meet management’s expectations. Risks, uncertainties and other factors involved with forward-looking information could cause actual events, results, performance, prospects and opportunities to differ materially from those expressed or implied by such forward-looking information. Forward looking information in this news release includes, but is not limited to Aurania’s objectives, goals or future plans, statements, exploration results, potential mineralization, the corporation’s portfolio, treasury, management team and enhanced capital markets profile, the estimation of mineral resources, exploration, timing of the commencement of operations and estimates of market conditions. Factors that could cause actual results to differ materially from such forward-looking information include, but are not limited to, failure to identify mineral resources, failure to convert estimated mineral resources to reserves, the inability to complete a feasibility study which recommends a production decision, the preliminary nature of metallurgical test results, delays in obtaining or failures to obtain required governmental, regulatory, environmental or other project approvals, political risks, inability to fulfill the duty to accommodate indigenous peoples, uncertainties relating to the availability and costs of financing needed in the future, changes in equity markets, inflation, changes in exchange rates, fluctuations in commodity prices, delays in the development of projects, capital and operating costs varying significantly from estimates and the other risks involved in the mineral exploration and development industry, the effects of COVID-19 on the business of the Company including but not limited to the effects of COVID-19 on the price of commodities, capital market conditions, restrictions on labour and international travel and supply chains, and those risks set out in Aurania’s public documents filed on SEDAR. Although Aurania believes that the assumptions and factors used in preparing the forward-looking information in this news release are reasonable, undue reliance should not be placed on such information, which only applies as of the date of this news release, and no assurance can be given that such events will occur in the disclosed time frames or at all. Aurania disclaims any intention or obligation to update or revise any forward-looking information, whether as a result of new information, future events or otherwise, other than as required by law.

FenixOro Gold Corp. (FDVXF) – A Gold Discovery in One of Colombias Richest Mineral Belts

Friday, September 10, 2021

FenixOro Gold Corp. (FDVXF)
A Gold Discovery in One of Colombia’s Richest Mineral Belts

FenixOro Gold Corp is a Toronto based company acquiring and exploring high grade gold projects in Colombia. The company’s flagship Abriaqui Project is the nearest exploration project to Continental Gold’s Buritica Mine.

Mark Reichman, Senior Research Analyst of Natural Resources, Noble Capital Markets, Inc.

Refer to the full report for the price target, fundamental analysis, and rating.

    Initiating coverage. We are initiating coverage of FenixOro Gold Corp. FenixOro is advancing the Abriaqui gold project in Colombia. Currently, there are two concession areas, a northern group of three contiguous concessions, and a non-contiguous concession in the southern portion of the project area comprising 547 hectares of land. The company is in the process of acquiring the mineral rights for an adjacent property encompassing 848 hectares from Polo Resources.

    Colombia compares favorably to mining jurisdictions in Latin America.  Abriaqui is in Colombia, which ranked 28th among 77 mining jurisdictions for investment attractiveness in the 2020 Fraser Institute Annual Survey of Mining Companies. Colombia ranked first among countries in Latin America and the Caribbean Basin, including Brazil (38th), Chile (30th), Ecuador (58th), Mexico (42nd), and Peru …


This research is provided by Noble Capital Markets, Inc., a FINRA and S.E.C. registered broker-dealer (B/D).

*Analyst certification and important disclosures included in the full report. NOTE: investment decisions should not be based upon the content of this research summary.  Proper due diligence is required before making any investment decision. 

Comstock Mining (LODE) – Investing in a Low Carbon Future

Friday, September 10, 2021

Comstock Mining (LODE)
Investing in a Low Carbon Future

Comstock Mining Inc. is an emerging innovator and leader in the sustainable extraction, valorization, and production of scarce natural resources, with a focus on high value strategic materials that are essential to meeting the rapidly increasing global demand for clean energy, carbon-neutrality, and natural products.

Mark Reichman, Senior Research Analyst of Natural Resources, Noble Capital Markets, Inc.

Refer to the full report for the price target, fundamental analysis, and rating.

    Acquisition of Plain Sight Innovations. Comstock acquired Plain Sight Innovations Corporation in exchange for 8.5 million restricted Comstock shares, along with the intellectual property assets of PSI’s affiliate, FLUX Photon Corporation, in exchange for a performance-based cash payment equivalent to 20% of the company’s future consolidated net cash flow from operations up to $18 million.

    Investing in low carbon fuels.  PSI operates a commercial pilot cellulosic fuel facility in Wisconsin and owns patented, patent-pending, and proprietary process technologies to convert woody biomass into cellulosic ethanol, along with co-product precursors for renewable diesel, bio-mass derived crystalline graphite, bioplastics, and carbon neutral alternatives to fossil fuels. The company’s …


This Company Sponsored Research is provided by Noble Capital Markets, Inc., a FINRA and S.E.C. registered broker-dealer (B/D).

*Analyst certification and important disclosures included in the full report. NOTE: investment decisions should not be based upon the content of this research summary.  Proper due diligence is required before making any investment decision. 

FenixOro Gold Corp. (FDVXF) – A Gold Discovery in One of Colombia’s Richest Mineral Belts

Friday, September 10, 2021

FenixOro Gold Corp. (FDVXF)
A Gold Discovery in One of Colombia’s Richest Mineral Belts

FenixOro Gold Corp is a Toronto based company acquiring and exploring high grade gold projects in Colombia. The company’s flagship Abriaqui Project is the nearest exploration project to Continental Gold’s Buritica Mine.

Mark Reichman, Senior Research Analyst of Natural Resources, Noble Capital Markets, Inc.

Refer to the full report for the price target, fundamental analysis, and rating.

    Initiating coverage. We are initiating coverage of FenixOro Gold Corp. FenixOro is advancing the Abriaqui gold project in Colombia. Currently, there are two concession areas, a northern group of three contiguous concessions, and a non-contiguous concession in the southern portion of the project area comprising 547 hectares of land. The company is in the process of acquiring the mineral rights for an adjacent property encompassing 848 hectares from Polo Resources.

    Colombia compares favorably to mining jurisdictions in Latin America.  Abriaqui is in Colombia, which ranked 28th among 77 mining jurisdictions for investment attractiveness in the 2020 Fraser Institute Annual Survey of Mining Companies. Colombia ranked first among countries in Latin America and the Caribbean Basin, including Brazil (38th), Chile (30th), Ecuador (58th), Mexico (42nd), and Peru …


This research is provided by Noble Capital Markets, Inc., a FINRA and S.E.C. registered broker-dealer (B/D).

*Analyst certification and important disclosures included in the full report. NOTE: investment decisions should not be based upon the content of this research summary.  Proper due diligence is required before making any investment decision. 

Release – Comstock Acquires Plain Sight Innovations Corporation


Comstock Acquires Plain Sight Innovations Corporation


Extensive Portfolio of Pioneering Clean Technologies; Cellulosic Biofuels

VIRGINIA CITY, Nev., Sept. 09, 2021 (GLOBE NEWSWIRE) — Comstock Mining Inc. (NYSE: LODE) (“Comstock” and the “Company”) today announced its acquisition of 100% of the issued and outstanding equity of Plain Sight Innovations Corporation (“PSI”) in exchange for 8,500,000 restricted shares of its common stock, and all of the intellectual property assets of PSI’s affiliate, FLUX Photon Corporation (“FPC”), in exchange for a performance-based cash payment equal to 20% of the Company’s future consolidated net cash flow from operations up to $18,000,000.

PSI’s management team has deep experience in a diverse array of industries, including renewable fuels, hazardous waste, agriproducts, and other commodities with almost thirty years of clean technology research, development, and commercialization expertise, with an emphasis on the extraction and valorization of natural resources.

PSI owns an array of patented, patent-pending and proprietary process technologies that were designed to convert low cost, ubiquitous woody biomass feedstocks into cellulosic ethanol, while producing a portfolio of co-products, including renewable diesel and an extraordinary new form of biomass-derived crystalline graphite, or biographite, with compelling applications in the production of carbon neutral batteries and other electrification components. PSI also operates a commercial pilot cellulosic fuel facility based on its technologies in Wisconsin, where it has already proven the ability to efficiently convert various forms of woody biomass into cellulosic ethanol and co-product precursors for renewable diesel, biographite, bioplastics, and a portfolio of carbon neutral alternatives to fossil fuels.

The Path to Decarbonization is in Plain Sight

The transportation sector is expected to dramatically increase the production of electric vehicles to more than 30% of all auto sales by 2030. However, more than two thirds of the energy required to power those electric vehicles is expected to come from burning fossil fuels, and the direct combustion of liquid fuels will most certainly continue to be the dominant source of power for transportation for decades. Burning less, burning smarter, and reusing emissions are therefore critical objectives as the world moves to clean energy and decarbonization.

“Renewable fuels provide a critical pathway for decarbonization, however, most current forms of renewable fuel draw from the same pool of conventional feedstocks, including corn and various vegetable oils in the U.S., and the entire universe of those feedstocks only represents a tiny fraction of the domestic burn,” said David Winsness, PSI’s founder and Chief Executive Officer. “Unfortunately, the lifecycle carbon benefits of growing, harvesting, and using conventional feedstocks are extremely limited. Our technologies were designed to address that dilemma by converting abundantly available forestry wastes, short rotation energy crops, and other low-cost sources of woody biomass into natural liquid fuels with vastly superior benefits for a fraction of the refining costs of conventional renewable fuels.”

The U.S. Department of Energy has estimated that more than one billion tons of forestry wastes and other forms of biomass will be produced annually by 2027 with continued growth thereafter. That’s enough new feedstock to produce as much as 70 billion gallons per year of advanced carbon neutral fuels with PSI’s proven technologies, or more than one third of the U.S. transportation demand on an energy equivalent basis.

Cellulosic Fuels

“That’s enough feedstock to rapidly neutralize motor fuel emissions in conjunction with America’s transition to electrification and renewable energy,” added Winsness. “PSI’s cellulosic fuels facilities will be the first of their kind, with an expected financial, natural, and social impact far in excess of any other platform, renewable or otherwise.”

PSI’s first facility is expected to scale up to an initial capacity exceeding 330,000 tons per year of forestry wastes over its first three years of operations, as it extracts, converts, and refines biomass into ethanol, renewable diesel fuel, and biographite to generate annualized revenues exceeding $86,000,000, $173,000,000, and $346,000,000 per year during the facility’s first three full years of operations, respectively, as shown in the following summary projections:

      2023     2024     2025     2026
Throughput (tons per year)     33,000     85,500     165,000     330,000
Revenue ($000s per year)   $ 34,626   $ 86,565   $ 173,131   $ 346,262

Comstock’s Executive Chairman and Chief Executive Officer, Corrado De Gasperis, commented, “Cellulosic fuel production, like lithium-ion battery recycling and industrial hemp production, is poised for, and we are planning for, exponential growth. Our guidance for these three businesses represents just one facility each and we are planning for over one hundred cellulosic fuel facilities in the U.S. alone. That level of production barely dents the transportation fuels market, yet it represents a meaningful impact on shifting consumption and the resulting decarbonization.”

Ecosystem of Strategic Feedstocks, Processes, and Products

PSI’s technologies are especially important to the Company’s plans to build a synergistic ecosystem of strategic lines of business and production facilities with complimentary feedstocks and products, supported by world class technological and engineering talent. The Company’s ability to systemically discover, develop, engineer, manufacture and commission its own solutions, represents a remarkable competitive advantage that enables speed.

Benchmark Mineral Intelligence estimates that the major automakers have committed over $300 billion to developing electric vehicles (“EVs”) and that over 2,000 GWh of lithium-ion battery (“LIB”) production capacity is in the pipeline. That amount of production in turn equates to 1.4 million tons of new annual graphite demand by 2028. Conventional graphite comes from natural deposits or the carbonization of petroleum products, with market values ranging from about $10,000 per ton for natural graphite to $20,000 per ton for synthetic graphite.

De Gasperis continued, “Most of my relevant experience comes from managing the global manufacturing of carbon-based, material-science products, particularly synthetic graphite. I was literally stunned by PSI’s discovery of a natural source of carbon neutral biographite. When we consider that every cathode in every lithium-ion battery needs an anode, and most anodes are made from synthetic graphite which is substantially all produced with carbon intensive fossil fuel derivatives, then we understand that that industry is not climate smart or clean. We can fundamentally change the game by introducing the world’s first scalable carbon neutral alternative to fossil fuel derived graphite.”

PSI’s intellectual property portfolio also includes remarkably advanced new approaches to carbon capture and utilization, atmospheric water harvesting, waste heat and energy recovery, and industrial photosynthesis for terascale decarbonization and the sustainable production of very large agricultural outputs for fractional inputs.

About Comstock Mining Inc.
Comstock Mining Inc. (NYSE: LODE) (the “Company”) is an emerging innovator and leader in the sustainable extraction, valorization, and production of scarce natural resources, with a focus on high value strategic materials that are essential to meeting the rapidly increasing global demand for clean energy, carbon-neutrality, and natural products. To learn more, please visit www.comstockmining.com.

Forward-Looking Statements
This press release and any related calls or discussions may include forward-looking statements within the meaning of Section 27A of the Securities Act of 1933, as amended, and Section 21E of the Securities Exchange Act of 1934, as amended. All statements, other than statements of historical facts, are forward-looking statements. The words “believe,” “expect,” “anticipate,” “estimate,” “project,” “plan,” “should,” “intend,” “may,” “will,” “would,” “potential” and similar expressions identify forward-looking statements, but are not the exclusive means of doing so.

Forward-looking statements include statements about matters such as: future industry market conditions; future explorations or acquisitions; future changes in our exploration activities; future prices and sales of, and demand for, our products; land entitlements and uses; permits; production capacity and operations; operating and overhead costs; future capital expenditures and their impact on us; operational and management changes (including changes in the Board of Directors); changes in business strategies, planning and tactics; future employment and contributions of personnel, including consultants; future land sales; investments, acquisitions, joint ventures, strategic alliances, business combinations, operational, tax, financial and restructuring initiatives, including the nature, timing and accounting for restructuring charges, derivative assets and liabilities and the impact thereof; contingencies; litigation, administrative or arbitration proceedings; environmental compliance and changes in the regulatory environment; offerings, limitations on sales or offering of equity or debt securities, including asset sales and associated costs; and future working capital, costs, revenues, business opportunities, debt levels, cash flows, margins, taxes, earnings and growth. These statements are based on assumptions and assessments made by our management in light of their experience and their perception of historical and current trends, current conditions, possible future developments and other factors they believe to be appropriate. Forward-looking statements are not guarantees, representations or warranties and are subject to risks and uncertainties, many of which are unforeseeable and beyond our control and could cause actual results, developments and business decisions to differ materially from those contemplated by such forward-looking statements. Some of those risks and uncertainties include the risk factors set forth in our filings with the SEC and the following: adverse effects of climate changes or natural disasters; adverse effects of global or regional pandemic disease spread or other crises; global economic and capital market uncertainties; the speculative nature of gold or mineral exploration, mercury remediation and lithium, nickel and cobalt recycling, including risks of diminishing quantities or grades of qualified resources; operational or technical difficulties in connection with exploration or mercury remediation, metal recycling, processing or mining activities; costs, hazards and uncertainties associated with precious metal based activities, including environmentally friendly and economically enhancing clean mining and processing technologies, precious metal exploration, resource development, economic feasibility assessment and cash generating mineral production; costs, hazards and uncertainties associated with mercury remediation, metal recycling, processing or mining activities; contests over our title to properties; potential dilution to our stockholders from our stock issuances, recapitalization and balance sheet restructuring activities; potential inability to comply with applicable government regulations or law; adoption of or changes in legislation or regulations adversely affecting our businesses; permitting constraints or delays; ability to achieve the benefits of business opportunities that may be presented to, or pursued by, us, including those involving battery technology, mercury remediation technology and efficacy, quantum computing and advanced materials development, and development of cellulosic technology in bio-fuels and related carbon-based material production; ability to successfully identify, finance, complete and integrate acquisitions, joint ventures, strategic alliances, business combinations, asset sales, and investments that we may be party to in the future; changes in the United States or other monetary or fiscal policies or regulations; interruptions in our production capabilities due to capital constraints; equipment failures; fluctuation of prices for gold or certain other commodities (such as silver, zinc, lithium, nickel, cobalt, cyanide, water, diesel, gasoline and alternative fuels and electricity); changes in generally accepted accounting principles; adverse effects of war, mass shooting, terrorism and geopolitical events; potential inability to implement our business strategies; potential inability to grow revenues; potential inability to attract and retain key personnel; interruptions in delivery of critical supplies, equipment and raw materials due to credit or other limitations imposed by vendors; assertion of claims, lawsuits and proceedings against us; potential inability to satisfy debt and lease obligations; potential inability to maintain an effective system of internal controls over financial reporting; potential inability or failure to timely file periodic reports with the Securities and Exchange Commission; potential inability to list our securities on any securities exchange or market or maintain the listing of our securities; and work stoppages or other labor difficulties. Occurrence of such events or circumstances could have a material adverse effect on our business, financial condition, results of operations or cash flows, or the market price of our securities. All subsequent written and oral forward-looking statements by or attributable to us or persons acting on our behalf are expressly qualified in their entirety by these factors. Except as may be required by securities or other law, we undertake no obligation to publicly update or revise any forward-looking statements, whether as a result of new information, future events, or otherwise.

Neither this press release nor any related calls or discussions constitutes an offer to sell, the solicitation of an offer to buy or a recommendation with respect to any securities of the Company, the fund or any other issuer.

Contact Information    
Comstock Mining Inc.
P.O. Box 1118
Virginia City, NV 89440
www.comstockmining.com
Corrado De Gasperis
Executive Chairman & CEO
Tel (775) 847-4755
degasperis@comstockmining.com
Zach Spencer
Director of External Relations
Tel (775) 847-5272 Ext.151
questions@comstockmining.com

Release – Coeur Provides Exploration Update


Coeur Provides Exploration Update


CHICAGO–(BUSINESS WIRE)–Coeur Mining, Inc. (“Coeur” or the “Company”) (NYSE: CDE) today reported an update on its 2021 exploration programs at its Palmarejo and Kensington operations, following its update on February 17, 2021. The Company also highlighted new drilling results at its Silvertip and Wharf mines. Coeur drilled approximately 698,100 feet (212,775 meters) from 27 active rigs at six different locations through the first seven months of 2021, reflecting a year-over-year increase of roughly 58%. The Company plans to invest approximately $75 million1 in exploration this year, nearly 50% higher than last year’s record exploration investment, representing one of the sector’s largest exploration programs.


Key Highlights2,3

  • Ongoing drilling success at Palmarejo leading to new high-grade growth – Coeur has been successfully generating results from its infill and expansion drilling campaign within the Independencia and Guadalupe deposits. Specifically, assays across multiple target areas, including the Hidalgo zone located at the northwest end of Independencia near existing infrastructure, have returned high-grade intercepts that demonstrate significant near-mine growth potential. Key highlights include:

Hidalgo zone (Independencia deposit) – Infill

  • Hole HGDH_050 returned 142.7 feet (43.5 meters) of 0.11 ounces per ton (“oz/t”) (3.8 grams per tonne (“g/t”)) gold and 7.9 oz/t (270.9 g/t) silver
  • Hole HGDH_069 returned 55.1 feet (16.8 meters) of 0.14 oz/t (4.8 g/t) gold and 15.5 oz/t (531.4 g/t) silver
  • Hole HGDH_072 returned 12.8 feet (3.9 meters) of 0.69 oz/t (23.7 g/t) gold and 23.9 oz/t (819.4 g/t) silver

North Independencia (Independencia deposit) – Infill

  • Hole VIDH_161 returned 11.2 feet (3.4 meters) of 0.27 oz/t (9.3 g/t) gold and 15.7 oz/t (538.3 g/t) silver

Hidalgo zone (Independencia deposit) – Expansion

  • Hole HGDH_062 returned 1.3 feet (0.4 meters) of 4.03 oz/t (138.2 g/t) gold and 18.2 oz/t (624.0 g/t) silver

La Patria zone (Guadalupe deposit) – Infill

  • Hole LPDH_254 returned 42.7 feet (13.0 meters) of 0.18 oz/t (6.2 g/t) gold and 3.8 oz/t (130.3 g/t) silver
  • Drilling at Kensington identifying additional high-grade growth opportunities – Building on late last year’s infill program, Coeur began 2021 by drilling on the Elmira vein located approximately 2,700 feet (825 meters) east of the Kensington Main deposit while also testing expansion targets beyond Elmira, including the Johnson vein. Coeur’s elevated level of exploration investment at Kensington the past two years is intended to extend mine life and generate future potential growth opportunities beyond its existing reserves and resources. Notable assay results include:

Elmira – Infill & Expansion

  • Hole EL21-0850-192-X30 returned 14.6 feet (4.5 meters) of 1.06 oz/t (36.3 g/t) gold
  • Hole EL21-0850-192-X23 returned 19.7 feet (6.0 meters) of 0.48 oz/t (16.5 g/t) gold
  • Hole EL21-0850-156-X11 returned 10.4 feet (3.2 meters) of 0.81 oz/t (27.8 g/t) gold, 0.8 feet (0.2 meters) of 6.43 oz/t (220.4 g/t) gold and 1.4 feet (0.4 meters) of 1.54 oz/t (53.7 g/t) gold

Johnson – Expansion

  • Hole JN21-0900-181-X02 returned 1.2 feet (0.4 meters) of 1.31 oz/t (45.7 g/t) gold
  • Hole JN21-0900-181-X04 returned 4.3 feet (1.3 meters) of 0.34 oz/t (11.7 g/t) gold
  • Hole JN21-0900-181-X05 returned 3.6 feet (1.1 meters) of 0.72 oz/t (24.7 g/t) gold
  • New Southern Silver zone at Silvertip continues to demonstrate growth potential – New surface and underground drilling has discovered a flat-lying “manto” portion of the Southern Silver zone. As highlighted below, the manto appears to be thicker in places than the previously drilled vertical breccia zones interpreted as mineralized feeder structures. After further analysis, the Company believes several other manto-feeder relationships may be present at the Discovery, Camp Creek and Central zones, and that underground drilling is the best approach to test these types of structures. Notable expansion drilling assay results from the Southern Silver zone manto mineralization include:
  • Hole 65Z21-485-007-005 returned 65.6 feet (20.0 meters) of 2.7 oz/t (92.5 g/t) silver, 16.9% zinc and 0.5% lead
  • Hole 65Z21-485-DDS1-015 returned 35.4 feet (10.8 meters) of 13.0 oz/t (445.7 g/t) silver, 19.4% zinc and 7.5% lead and 17.1 feet (5.2 meters) of 18.0 oz/t (617.1 g/t) silver, 7.7% zinc and 12.0% lead
  • Positive results from largest drilling campaign at Wharf since acquisition – New significant oxide-gold assays were recently returned from the Portland Ridge – Boston claim group and Flossie area. Key highlights from the 2021 infill drilling campaign include:
  • Hole W21R-4781 returned 120 feet (36.6 meters) of 0.22 oz/t (7.5 g/t) gold
  • Hole W21R-4826 returned 200 feet (61.0 meters) of 0.12 oz/t (4.1 g/t) gold
  • Hole W21R-4812 returned 40 feet (12.2 meters) of 0.31 oz/t (10.6 g/t) gold
  • Hole W21R-4827 returned 70 feet (21.3 meters) of 0.14 oz/t (4.8 g/t) gold

“Our 2021 exploration program accelerated during the summer months with 27 rigs active across six sites,” said Hans J. Rasmussen, Coeur’s Senior Vice President of Exploration. “We remain on-track to deliver the largest exploration campaign in Company history and are regularly setting new monthly drilling records. We expect to complete roughly 1.2 million feet (365,750 meters) of drilling by the end of the year, with the primary objective of further extending mine lives across our portfolio. These goals, along with our track record of consistently growing our reserve and resource base through the drill bit, are true differentiators for Coeur. Assays from both Palmarejo and Silvertip continue to demonstrate significant growth potential, further validating our commitment to a higher-level of exploration investment at each site. The Hidalgo zone at Palmarejo represents the most significant near-mine opportunity since our focused exploration program began in 2012.”

Mr. Rasmussen continued, “Assay and drill thicknesses from the southern portion of Silvertip continue to exceed our expectations, specifically from the Southern Silver and Camp Creek zones. Additionally, airborne geophysical models suggest that these zones may continue another mile and a quarter (two kilometers) from our current drilling positions. Positive results like these, along with continued exploration success at Kensington and Wharf, give us confidence that we are making progress toward achieving our 2021 exploration objectives.”

For a complete table of all drill results, please refer to the following link: https://www.coeur.com/_resources/news/2021-09-09-Exploration-Update.pdf. Please see the “Cautionary Statements” section for additional information regarding drill results.

Palmarejo2,3

Coeur has drilled a total of approximately 149,200 feet (45,475 meters) from up to eight diamond core rigs across six different zones (three infill targets and three expansion targets) through the first seven months of 2021, compared to roughly 118,600 feet (36,150 meters) during the same period in 2020.

Key highlights from the 2021 exploration program include:

Hidalgo zone (Independencia deposit)

  • Up to four active rigs (two infill and two expansion)
  • As previously discussed in Coeur’s February 17, 2021 news release, mineralization typically consists of several vein intercepts creating wide, high-grade “clavos” where mine planning could incorporate larger transverse stopes that support higher production rates
  • Strategically located near existing mine infrastructure which has the potential to facilitate shorter development time to commence production
  • Drill assay intervals have continued to produce the best grade-thickness at Palmarejo since drilling at the historic Clavo 76 prior to 2013

La Patria zone (Guadalupe deposit)

  • Infill drilling with one drill rig has continued the exploration program that began in 2020, focusing on areas of historic drilling
  • A second rig is currently being mobilized to test expansion targets to the southeast of the current resource area

North Independencia zone (Independencia deposit)

  • Once the infill program is completed (currently estimated around mid-2022), Coeur plans to begin expansion drilling further northwest of the current resource limits

Guazapares district (greenfields exploration)

  • Field reconnaissance has identified areas of surface alteration and quartz veining east of Palmarejo in the Guazapares district, which was acquired in 2015 as part of the acquisition of Paramount Gold and Silver Corp., sits outside the gold stream area of interest and totals nearly 15,000 hectares. Drill permitting at an initial target area (Carmela) is currently underway with the objective of commencing drilling at this new target by the end of the year

Coeur plans to transition its focus on various resource expansion targets in the remainder of 2021, while also continuing the infill program at the Independencia North, Hidalgo and La Patria zones. The Company’s priority targets for expansion drilling during the remainder of the year include (i) expanding the Hidalgo zone northwest towards the haul road, (ii) extending the North Independencia zone, (iii) drilling the southeast extension of the La Patria zone, (iv) scout drilling of the El Ojito zone, located in the northeastern portion of the Independencia deposit and subparallel to the Hidalgo zone, and (v) testing the new Carmela target located to the east within the Guazapares district.

Palmarejo 2021 Production & Exploration Guidance and Year-End 2020 Reserves and Resources:

  • 2021E Production4: 100,000 – 110,000 ounces of gold and 6.5 – 7.8 million ounces of silver
  • 2021E Exploration Investment1: Approximately $14 million ($9 million expensed and $5 million capitalized)
  • 2020 Proven and Probable Reserves: 849,000 ounces of gold at an average grade of 0.06 oz/t (1.9 g/t) and 59.4 million ounces of silver at an average grade of 3.9 oz/t (132.8 g/t)
  • 2020 Measured and Indicated Resources: 613,000 ounces of gold at an average grade of 0.05 oz/t (1.6 g/t) and 51.1 million ounces of silver at an average grade of 3.8 oz/t (130.6 g/t)
  • 2020 Inferred Resources: 280,000 ounces of gold at an average grade of 0.06 oz/t (2.2 g/t) and 14.5 million ounces of silver at an average grade of 3.3 oz/t (114.6 g/t)


Kensington2,3

The 2021 Kensington exploration program started with two underground core rigs focused on infill drilling along the Elmira and Jualin vein structures. A limited number of expansion holes were also drilled into Johnson, located about 500 feet (150 meters) east of Elmira. Early in the third quarter, the Company ramped up to five core rigs, including three underground and two surface core rigs. Through the first seven months of 2021, Coeur drilled approximately 86,600 feet (26,395 meters) at Kensington compared to roughly 88,900 feet (27,100 meters) during the same period in 2020.

Elmira and the development drift established in late 2020 represent potential areas of future mining at Kensington. The Company plans to continue drilling these areas while focusing on refining the vein shapes through 2022. Coeur expects to declare a maiden reserve for Elmira at the end of the year with the goal of mining the deposit beginning in early 2023.

Additionally, Coeur has drilled the Johnson vein structure from the same platforms it used to test Elmira. The Company has completed approximately 23 holes into Johnson since the beginning of the year. Resource shapes for the new intercepts are still in the earliest phase of interpretation. Johnson also outcrops on surface where it has returned strong gold assays, representing about 1,000 feet (300 meters) of vertical dip length.

For the remainder of 2021, Coeur plans to (i) prioritize infill drilling at upper Kensington Zone 30, (ii) continue infill and expansion drilling around the edges of Elmira, (iii) conduct surface expansion drilling at upper Raven and Johnson, and (iv) execute helicopter-supported step-out drilling at the Comet, Big Lake and Gold King targets.

Kensington 2021 Production & Exploration Guidance and Year-End 2020 Reserves and Resources:

  • 2021E Production4: 115,000 – 130,000 ounces of gold
  • 2021E Exploration Investment1: Approximately $13 million ($9 million expensed and $4 million capitalized)
  • 2020 Proven and Probable Reserves: 331,000 ounces of gold at an average grade of 0.20 oz/t (6.8 g/t)
  • 2020 Measured and Indicated Resources: 830,000 ounces of gold at an average grade of 0.23 oz/t (7.9 g/t)
  • 2020 Inferred Resources: 394,000 ounces of gold at an average grade of 0.25 oz/t (8.5 g/t)

Silvertip2,3

Coeur began the year drilling Silvertip with five surface rigs and one underground core rig focused on resource expansion, while also conducting infill drilling on select areas of the deposit to convert existing resources to reserves. Through first seven months of 2021, Coeur drilled approximately 199,900 feet (60,950 meters) at Silvertip compared to roughly 88,300 feet (26,925 meters) during the same period in 2020.

The Company’s news release on June 15, 2021 highlighted the discovery of the new Southern Silver zone, located adjacent to and enveloping the historic 65 zone manto mineralization. At that time, the new zone was interpreted to be primarily a series of vertically oriented breccia material with encouraging thicknesses and grades. Based on the positive results, the Company continued to advance underground development to support additional drilling in the area, which is now underway.

Recent drilling has encountered flat-lying, manto-style mineralization with meaningful thicknesses, highlighting the potential to grow resource tonnage with additional drilling. These results suggest that the ore body in the zone consists of both vertical- and flat-lying manto-style mineralization. Notably, this new interpretation may apply to other zones at Silvertip that have not yet had the benefit of underground drilling to test for both vertical- and flat-lying mineralization which could lead to higher angle structures that support additional resource tonnage.

Furthermore, the latest drill core is beginning to demonstrate that the mineralization within the Southern Silver zone continues to the southwest, south and southeast, connecting with the Camp Creek, Tour Ridge and Discovery zones, respectively.

Silvertip 2021 Exploration Guidance and Year-End 2020 Reserves and Resources:

  • 2021E Exploration Investment1: Approximately $18 million ($15 million expensed and $3 million capitalized)
  • 2020 Proven and Probable Reserves: 14.6 million ounces of silver at an average grade of 8.1 oz/t (278.2 g/t), 296.1 million pounds of zinc at an average grade of 8.2% and 193.2 million pounds of lead at an average grade of 5.4%
  • 2020 Measured and Indicated Resources: 17.4 million ounces of silver at an average grade of 7.4 oz/t (255.0 g/t), 442.1 million pounds of zinc at an average grade of 9.4% and 216.5 million pounds of lead at an average grade of 4.6%
  • 2020 Inferred Resources: 12.0 million ounces of silver at an average grade of 8.3 oz/t (283.3 g/t), 308.7 million pounds of zinc at an average grade of 10.6% and 143.9 million pounds of lead at an average grade of 5.0%


Wharf2,3

In early 2021, Coeur initiated the largest drilling campaign at Wharf since it acquired the operation in 2015. The Company plans to invest approximately $5 million1 on exploration at Wharf this year – roughly the same amount spent cumulatively since acquisition5. Through the first seven months of 2021, Coeur drilled approximately 85,800 feet (26,175 meters) at Wharf compared to roughly 10,600 feet (3,225 meters) during the same period in 2020.

The Company has essentially achieved its target drill footage for the year, efficiently reaching its goal approximately 30% under budget. Building on this momentum, Coeur plans to keep one active rig turning at Wharf for the rest of the year.

Coeur is targeting oxide-gold hosted in the Deadwood Formation. The team has received about half the outstanding drill assays with roughly 40% of the holes returning results above resource grade thickness cutoff. Based on information received thus far, the Company expects to incorporate these results into its year-end 2021 resource model.

Wharf 2021 Production & Exploration Guidance and Year-End 2020 Reserves and Resources:

  • 2021E Production4: 85,000 – 95,000 ounces of gold
  • 2021E Exploration Investment1: Approximately $5 million (substantially all capitalized)
  • 2020 Proven and Probable Reserves: 720,000 ounces of gold at an average grade of 0.03 oz/t (0.9 g/t)
  • 2020 Measured and Indicated Resources: 605,000 ounces of gold at an average grade of 0.02 oz/t (0.8 g/t)
  • 2020 Inferred Resources: 67,000 ounces of gold at an average grade of 0.02 oz/t (0.7 g/t)


About Coeur

Coeur Mining, Inc. is a U.S.-based, well-diversified, growing precious metals producer with five wholly-owned operations: the Palmarejo gold-silver complex in Mexico, the Rochester silver-gold mine in Nevada, the Kensington gold mine in Alaska, the Wharf gold mine in South Dakota, and the Silvertip silver-zinc-lead mine in British Columbia. In addition, the Company has interests in several precious metals exploration projects throughout North America.

Cautionary Statements

This news release contains forward-looking statements within the meaning of securities legislation in the United States and Canada, including statements regarding exploration efforts and plans, exploration expenditures, drill results, growth, extended mine lives, grade, thickness, investments, mine expansion and development plans, resource delineation, expansion, upgrade or conversion. Such forward-looking statements involve known and unknown risks, uncertainties and other factors which may cause Coeur’s actual results, performance or achievements to be materially different from any future results, performance or achievements expressed or implied by the forward-looking statements. Such factors include, among others, the risk that anticipated additions or upgrades to reserves and resources are not attained, the risk that planned drilling programs may be curtailed or canceled due to budget constraints or other reasons, the risks and hazards inherent in the mining business (including risks inherent in developing large-scale mining projects, environmental hazards, industrial accidents, weather or geologically related conditions), changes in the market prices of gold, silver, zinc and lead and a sustained lower price environment, the uncertainties inherent in Coeur’s production, exploratory and developmental activities, including risks relating to permitting and regulatory delays (including the impact of government shutdowns), ground conditions, grade variability, any future labor disputes or work stoppages, the uncertainties inherent in the estimation of mineral reserves, the potential effects of the COVID-19 pandemic, including impacts to the availability of our workforce, continued access to financing sources, government orders that may require temporary suspension of operations at one or more of our sites and effects on our suppliers or the refiners and smelters to whom the Company markets its production, changes that could result from Coeur’s future acquisition of new mining properties or businesses, the loss of any third-party smelter to which Coeur markets its production, the effects of environmental and other governmental regulations, the risks inherent in the ownership or operation of or investment in mining properties or businesses in foreign countries, Coeur’s ability to raise additional financing necessary to conduct its business, make payments or refinance its debt, as well as other uncertainties and risk factors set out in filings made from time to time with the United States Securities and Exchange Commission, and the Canadian securities regulators, including, without limitation, Coeur’s most recent reports on Form 10-K and Form 10-Q. Actual results, developments and timetables could vary significantly from the estimates presented. Readers are cautioned not to put undue reliance on forward-looking statements. Coeur disclaims any intent or obligation to update publicly such forward-looking statements, whether as a result of new information, future events or otherwise. Additionally, Coeur undertakes no obligation to comment on analyses, expectations or statements made by third parties in respect of Coeur, its financial or operating results or its securities.

Christopher Pascoe, Coeur’s Director, Technical Services and a qualified person under Canadian National Instrument 43-101, approved the scientific and technical information concerning Coeur’s mineral projects in this news release. For a description of the key assumptions, parameters and methods used to estimate mineral reserves and resources, as well as data verification procedures and a general discussion of the extent to which the estimates may be affected by any known environmental, permitting, legal, title, taxation, socio-political, marketing or other relevant factors, Canadian investors should refer to the Technical Reports for each of Coeur’s properties as filed on SEDAR at www.sedar.com.

Notes

The potential quantity and grade for the deposits described herein are conceptual in nature. There is insufficient exploratory work to define a mineral resource and it is uncertain if further exploration will result in the applicable target being delineated as a mineral resource.

  1. Reflects midpoint of guidance as published by Coeur on July 28, 2021.
  2. For a complete table of all drill results included in this release, please refer to the following link: https://www.coeur.com/_resources/news/2021-09-09-Exploration-Update.pdf.
  3. Rounding of grades, to significant figures, may result in apparent differences.
  4. Guidance as published by Coeur on July 28, 2021.
  5. Reflects cumulative investment in exploration at Wharf between 2015 and 2020.

2020 Year-End Proven and Probable Reserves

Grade Contained
Gold Silver Zinc Lead Gold Silver Zinc Lead
Short tons (oz/t) (oz/t) (%) (%) (oz) (oz) (lbs) (lbs)
PROVEN RESERVES
Palmarejo

4,040,000

0.067

4.29

270,000

17,344,000

Rochester

396,867,000

0.003

0.41

1,047,000

162,645,000

Kensington

814,000

0.195

159,000

Wharf

19,181,000

0.024

462,000

Silvertip

186,000

12.01

10.14%

8.53%

2,233,000

37,647,000

31,656,000

Total

421,088,000

0.005

0.43

1,938,000

182,222,000

37,647,000

31,656,000

PROBABLE RESERVES
Palmarejo

11,297,000

0.051

3.72

579,000

42,057,000

Rochester

62,554,000

0.003

0.37

172,000

22,863,000

Kensington

862,000

0.200

172,000

Wharf

9,186,000

0.028

258,000

Silvertip

1,618,000

7.67

7.98%

4.99%

12,403,000

258,418,000

161,569,000

Total

85,518,000

0.014

0.90

1,181,000

77,323,000

258,418,000

161,569,000

PROVEN AND PROBABLE RESERVES
Palmarejo

15,337,000

0.055

3.87

849,000

59,400,000

Rochester

459,421,000

0.003

0.40

1,219,000

185,508,000

Kensington

1,676,000

0.197

331,000

Wharf

28,367,000

0.025

720,000

Silvertip

1,804,000

8.11

8.21%

5.36%

14,636,000

296,065,000

193,225,000

Total

506,606,000

0.006

0.51

3,119,000

259,545,000

296,065,000

193,225,000

2020 Year-End Measured and Indicated Resources

Grade Contained
Gold Silver Zinc Lead Gold Silver Zinc Lead
Short tons (oz/t) (oz/t) (%) (%) (oz) (oz) (lbs) (lbs)
MEASURED RESOURCES
Palmarejo

1,840,000

0.052

3.67

95,000

6,746,000

Rochester

240,568,000

0.002

0.24

388,000

57,160,000

Kensington

2,390,000

0.233

556,000

Wharf

12,992,000

0.019

245,000

Silvertip

138,000

11.17

9.83%

7.88%

1,541,000

27,050,000

21,670,000

Lincoln Hill

4,642,000

0.012

0.34

58,000

1,592,000

La Preciosa

9,536,000

0.005

3.04

45,000

29,001,000

Total

272,106,000

0.005

0.35

1,387,000

96,040,000

27,050,000

21,670,000

INDICATED RESOURCES
Palmarejo

11,591,000

0.045

3.83

518,000

44,398,000

Rochester

57,452,000

0.002

0.25

102,000

14,207,000

Kensington

1,204,000

0.228

274,000

Wharf

12,717,000

0.028

360,000

Silvertip

2,206,000

7.20

9.41%

4.41%

15,892,000

415,000,000

194,780,000

Lincoln Hill

27,668,000

0.011

0.31

306,000

8,655,000

La Preciosa

19,141,000

0.006

3.98

118,000

76,185,000

Total

131,979,000

0.013

1.21

1,678,000

159,337,000

415,000,000

194,780,000

MEASURED AND INDICATED RESOURCES
Palmarejo

13,431,000

0.046

3.81

613,000

51,144,000

Rochester

298,020,000

0.002

0.24

489,000

71,368,000

Kensington

3,594,000

0.231

830,000

Wharf

25,710,000

0.024

605,000

Silvertip

2,344,000

7.44

9.43%

4.62%

17,433,000

442,050,000

216,450,000

Lincoln Hill

32,310,000

0.011

0.32

364,000

10,247,000

La Preciosa

28,677,000

0.006

3.67

163,000

105,186,000

Total

404,086,000

0.008

0.63

3,064,000

255,377,000

442,050,000

216,450,000

2020 Year-End Inferred Resources

Grade Contained
Gold Silver Zinc Lead Gold Silver Zinc Lead
Short tons (oz/t) (oz/t) (%) (%) (oz) (oz) (lbs) (lbs)
INFERRED RESOURCES
Palmarejo

4,345,000

0.064

3.34

280,000

14,525,000

Rochester

226,049,000

0.002

0.27

409,000

61,671,000

Kensington

1,597,000

0.247

394,000

Wharf

3,389,000

0.020

67,000

Silvertip

1,452,000

8.26

10.63%

4.95%

11,998,000

308,700,000

143,880,000

Lincoln Hill

22,952,000

0.011

0.36

255,000

8,163,000

Sterling

31,903,000

0.028

903,000

Wilco

25,736,000

0.021

0.13

531,000

3,346,000

La Preciosa

1,761,000

0.003

3.31

6,000

5,835,000

Total

319,186,000

0.009

0.33

2,845,000

105,538,000

308,700,000

143,880,000

Notes to above Mineral Reserves and Resources:

  1. The qualified person for Mineral Reserve and Mineral Resources estimates is Christopher Pascoe, Coeur’s Director, Technical Services.
  2. Mineral Reserve and Mineral Resource estimates are effective December 31, 2020.
  3. Assumed metal prices for estimated Mineral Reserves were $1,400 per ounce of gold, $17.00 per ounce of silver, $1.15 per pound of zinc, $0.95 per pound of lead.
  4. Assumed metal prices for estimated Mineral Resources were $1,600 per ounce of gold, $20.00 per ounce of silver, $1.30 per pound of zinc, $1.00 per pound of lead, except Lincoln Hill and Wilco at $1,350 per ounce of gold and $22.00 per ounce of silver, and La Preciosa at $1,500 per ounce of gold and $20.00 per ounce of silver.
  5. Mineral Resources are in addition to Mineral Reserves and do not have demonstrated economic viability. Inferred Mineral Resources are considered too speculative geologically to have the economic considerations applied to them that would enable them to be considered for estimation of Mineral Reserves, and there is no certainty that the Inferred Mineral Resources will be realized.
  6. Rounding of tons and ounces, as required by reporting guidelines, may result in apparent differences between tons, grade, and contained metal content.
  7. Excludes the impact of the gold stream agreement at Palmarejo.
  8. For details on the estimation of mineral resources and reserves, including the key assumptions, parameters and methods used to estimate the Mineral Resources and Mineral Reserves, Canadian investors should refer to the NI 43-101 Technical Reports for Coeur’s properties on file at www.sedar.com.

Conversion Table

1 short ton

=

0.907185 metric tons

1 troy ounce

=

31.10348 grams

Coeur Provides Exploration Update


Coeur Provides Exploration Update


CHICAGO–(BUSINESS WIRE)–Coeur Mining, Inc. (“Coeur” or the “Company”) (NYSE: CDE) today reported an update on its 2021 exploration programs at its Palmarejo and Kensington operations, following its update on February 17, 2021. The Company also highlighted new drilling results at its Silvertip and Wharf mines. Coeur drilled approximately 698,100 feet (212,775 meters) from 27 active rigs at six different locations through the first seven months of 2021, reflecting a year-over-year increase of roughly 58%. The Company plans to invest approximately $75 million1 in exploration this year, nearly 50% higher than last year’s record exploration investment, representing one of the sector’s largest exploration programs.


Key Highlights2,3

  • Ongoing drilling success at Palmarejo leading to new high-grade growth – Coeur has been successfully generating results from its infill and expansion drilling campaign within the Independencia and Guadalupe deposits. Specifically, assays across multiple target areas, including the Hidalgo zone located at the northwest end of Independencia near existing infrastructure, have returned high-grade intercepts that demonstrate significant near-mine growth potential. Key highlights include:

Hidalgo zone (Independencia deposit) – Infill

  • Hole HGDH_050 returned 142.7 feet (43.5 meters) of 0.11 ounces per ton (“oz/t”) (3.8 grams per tonne (“g/t”)) gold and 7.9 oz/t (270.9 g/t) silver
  • Hole HGDH_069 returned 55.1 feet (16.8 meters) of 0.14 oz/t (4.8 g/t) gold and 15.5 oz/t (531.4 g/t) silver
  • Hole HGDH_072 returned 12.8 feet (3.9 meters) of 0.69 oz/t (23.7 g/t) gold and 23.9 oz/t (819.4 g/t) silver

North Independencia (Independencia deposit) – Infill

  • Hole VIDH_161 returned 11.2 feet (3.4 meters) of 0.27 oz/t (9.3 g/t) gold and 15.7 oz/t (538.3 g/t) silver

Hidalgo zone (Independencia deposit) – Expansion

  • Hole HGDH_062 returned 1.3 feet (0.4 meters) of 4.03 oz/t (138.2 g/t) gold and 18.2 oz/t (624.0 g/t) silver

La Patria zone (Guadalupe deposit) – Infill

  • Hole LPDH_254 returned 42.7 feet (13.0 meters) of 0.18 oz/t (6.2 g/t) gold and 3.8 oz/t (130.3 g/t) silver
  • Drilling at Kensington identifying additional high-grade growth opportunities – Building on late last year’s infill program, Coeur began 2021 by drilling on the Elmira vein located approximately 2,700 feet (825 meters) east of the Kensington Main deposit while also testing expansion targets beyond Elmira, including the Johnson vein. Coeur’s elevated level of exploration investment at Kensington the past two years is intended to extend mine life and generate future potential growth opportunities beyond its existing reserves and resources. Notable assay results include:

Elmira – Infill & Expansion

  • Hole EL21-0850-192-X30 returned 14.6 feet (4.5 meters) of 1.06 oz/t (36.3 g/t) gold
  • Hole EL21-0850-192-X23 returned 19.7 feet (6.0 meters) of 0.48 oz/t (16.5 g/t) gold
  • Hole EL21-0850-156-X11 returned 10.4 feet (3.2 meters) of 0.81 oz/t (27.8 g/t) gold, 0.8 feet (0.2 meters) of 6.43 oz/t (220.4 g/t) gold and 1.4 feet (0.4 meters) of 1.54 oz/t (53.7 g/t) gold

Johnson – Expansion

  • Hole JN21-0900-181-X02 returned 1.2 feet (0.4 meters) of 1.31 oz/t (45.7 g/t) gold
  • Hole JN21-0900-181-X04 returned 4.3 feet (1.3 meters) of 0.34 oz/t (11.7 g/t) gold
  • Hole JN21-0900-181-X05 returned 3.6 feet (1.1 meters) of 0.72 oz/t (24.7 g/t) gold
  • New Southern Silver zone at Silvertip continues to demonstrate growth potential – New surface and underground drilling has discovered a flat-lying “manto” portion of the Southern Silver zone. As highlighted below, the manto appears to be thicker in places than the previously drilled vertical breccia zones interpreted as mineralized feeder structures. After further analysis, the Company believes several other manto-feeder relationships may be present at the Discovery, Camp Creek and Central zones, and that underground drilling is the best approach to test these types of structures. Notable expansion drilling assay results from the Southern Silver zone manto mineralization include:
  • Hole 65Z21-485-007-005 returned 65.6 feet (20.0 meters) of 2.7 oz/t (92.5 g/t) silver, 16.9% zinc and 0.5% lead
  • Hole 65Z21-485-DDS1-015 returned 35.4 feet (10.8 meters) of 13.0 oz/t (445.7 g/t) silver, 19.4% zinc and 7.5% lead and 17.1 feet (5.2 meters) of 18.0 oz/t (617.1 g/t) silver, 7.7% zinc and 12.0% lead
  • Positive results from largest drilling campaign at Wharf since acquisition – New significant oxide-gold assays were recently returned from the Portland Ridge – Boston claim group and Flossie area. Key highlights from the 2021 infill drilling campaign include:
  • Hole W21R-4781 returned 120 feet (36.6 meters) of 0.22 oz/t (7.5 g/t) gold
  • Hole W21R-4826 returned 200 feet (61.0 meters) of 0.12 oz/t (4.1 g/t) gold
  • Hole W21R-4812 returned 40 feet (12.2 meters) of 0.31 oz/t (10.6 g/t) gold
  • Hole W21R-4827 returned 70 feet (21.3 meters) of 0.14 oz/t (4.8 g/t) gold

“Our 2021 exploration program accelerated during the summer months with 27 rigs active across six sites,” said Hans J. Rasmussen, Coeur’s Senior Vice President of Exploration. “We remain on-track to deliver the largest exploration campaign in Company history and are regularly setting new monthly drilling records. We expect to complete roughly 1.2 million feet (365,750 meters) of drilling by the end of the year, with the primary objective of further extending mine lives across our portfolio. These goals, along with our track record of consistently growing our reserve and resource base through the drill bit, are true differentiators for Coeur. Assays from both Palmarejo and Silvertip continue to demonstrate significant growth potential, further validating our commitment to a higher-level of exploration investment at each site. The Hidalgo zone at Palmarejo represents the most significant near-mine opportunity since our focused exploration program began in 2012.”

Mr. Rasmussen continued, “Assay and drill thicknesses from the southern portion of Silvertip continue to exceed our expectations, specifically from the Southern Silver and Camp Creek zones. Additionally, airborne geophysical models suggest that these zones may continue another mile and a quarter (two kilometers) from our current drilling positions. Positive results like these, along with continued exploration success at Kensington and Wharf, give us confidence that we are making progress toward achieving our 2021 exploration objectives.”

For a complete table of all drill results, please refer to the following link: https://www.coeur.com/_resources/news/2021-09-09-Exploration-Update.pdf. Please see the “Cautionary Statements” section for additional information regarding drill results.

Palmarejo2,3

Coeur has drilled a total of approximately 149,200 feet (45,475 meters) from up to eight diamond core rigs across six different zones (three infill targets and three expansion targets) through the first seven months of 2021, compared to roughly 118,600 feet (36,150 meters) during the same period in 2020.

Key highlights from the 2021 exploration program include:

Hidalgo zone (Independencia deposit)

  • Up to four active rigs (two infill and two expansion)
  • As previously discussed in Coeur’s February 17, 2021 news release, mineralization typically consists of several vein intercepts creating wide, high-grade “clavos” where mine planning could incorporate larger transverse stopes that support higher production rates
  • Strategically located near existing mine infrastructure which has the potential to facilitate shorter development time to commence production
  • Drill assay intervals have continued to produce the best grade-thickness at Palmarejo since drilling at the historic Clavo 76 prior to 2013

La Patria zone (Guadalupe deposit)

  • Infill drilling with one drill rig has continued the exploration program that began in 2020, focusing on areas of historic drilling
  • A second rig is currently being mobilized to test expansion targets to the southeast of the current resource area

North Independencia zone (Independencia deposit)

  • Once the infill program is completed (currently estimated around mid-2022), Coeur plans to begin expansion drilling further northwest of the current resource limits

Guazapares district (greenfields exploration)

  • Field reconnaissance has identified areas of surface alteration and quartz veining east of Palmarejo in the Guazapares district, which was acquired in 2015 as part of the acquisition of Paramount Gold and Silver Corp., sits outside the gold stream area of interest and totals nearly 15,000 hectares. Drill permitting at an initial target area (Carmela) is currently underway with the objective of commencing drilling at this new target by the end of the year

Coeur plans to transition its focus on various resource expansion targets in the remainder of 2021, while also continuing the infill program at the Independencia North, Hidalgo and La Patria zones. The Company’s priority targets for expansion drilling during the remainder of the year include (i) expanding the Hidalgo zone northwest towards the haul road, (ii) extending the North Independencia zone, (iii) drilling the southeast extension of the La Patria zone, (iv) scout drilling of the El Ojito zone, located in the northeastern portion of the Independencia deposit and subparallel to the Hidalgo zone, and (v) testing the new Carmela target located to the east within the Guazapares district.

Palmarejo 2021 Production & Exploration Guidance and Year-End 2020 Reserves and Resources:

  • 2021E Production4: 100,000 – 110,000 ounces of gold and 6.5 – 7.8 million ounces of silver
  • 2021E Exploration Investment1: Approximately $14 million ($9 million expensed and $5 million capitalized)
  • 2020 Proven and Probable Reserves: 849,000 ounces of gold at an average grade of 0.06 oz/t (1.9 g/t) and 59.4 million ounces of silver at an average grade of 3.9 oz/t (132.8 g/t)
  • 2020 Measured and Indicated Resources: 613,000 ounces of gold at an average grade of 0.05 oz/t (1.6 g/t) and 51.1 million ounces of silver at an average grade of 3.8 oz/t (130.6 g/t)
  • 2020 Inferred Resources: 280,000 ounces of gold at an average grade of 0.06 oz/t (2.2 g/t) and 14.5 million ounces of silver at an average grade of 3.3 oz/t (114.6 g/t)


Kensington2,3

The 2021 Kensington exploration program started with two underground core rigs focused on infill drilling along the Elmira and Jualin vein structures. A limited number of expansion holes were also drilled into Johnson, located about 500 feet (150 meters) east of Elmira. Early in the third quarter, the Company ramped up to five core rigs, including three underground and two surface core rigs. Through the first seven months of 2021, Coeur drilled approximately 86,600 feet (26,395 meters) at Kensington compared to roughly 88,900 feet (27,100 meters) during the same period in 2020.

Elmira and the development drift established in late 2020 represent potential areas of future mining at Kensington. The Company plans to continue drilling these areas while focusing on refining the vein shapes through 2022. Coeur expects to declare a maiden reserve for Elmira at the end of the year with the goal of mining the deposit beginning in early 2023.

Additionally, Coeur has drilled the Johnson vein structure from the same platforms it used to test Elmira. The Company has completed approximately 23 holes into Johnson since the beginning of the year. Resource shapes for the new intercepts are still in the earliest phase of interpretation. Johnson also outcrops on surface where it has returned strong gold assays, representing about 1,000 feet (300 meters) of vertical dip length.

For the remainder of 2021, Coeur plans to (i) prioritize infill drilling at upper Kensington Zone 30, (ii) continue infill and expansion drilling around the edges of Elmira, (iii) conduct surface expansion drilling at upper Raven and Johnson, and (iv) execute helicopter-supported step-out drilling at the Comet, Big Lake and Gold King targets.

Kensington 2021 Production & Exploration Guidance and Year-End 2020 Reserves and Resources:

  • 2021E Production4: 115,000 – 130,000 ounces of gold
  • 2021E Exploration Investment1: Approximately $13 million ($9 million expensed and $4 million capitalized)
  • 2020 Proven and Probable Reserves: 331,000 ounces of gold at an average grade of 0.20 oz/t (6.8 g/t)
  • 2020 Measured and Indicated Resources: 830,000 ounces of gold at an average grade of 0.23 oz/t (7.9 g/t)
  • 2020 Inferred Resources: 394,000 ounces of gold at an average grade of 0.25 oz/t (8.5 g/t)

Silvertip2,3

Coeur began the year drilling Silvertip with five surface rigs and one underground core rig focused on resource expansion, while also conducting infill drilling on select areas of the deposit to convert existing resources to reserves. Through first seven months of 2021, Coeur drilled approximately 199,900 feet (60,950 meters) at Silvertip compared to roughly 88,300 feet (26,925 meters) during the same period in 2020.

The Company’s news release on June 15, 2021 highlighted the discovery of the new Southern Silver zone, located adjacent to and enveloping the historic 65 zone manto mineralization. At that time, the new zone was interpreted to be primarily a series of vertically oriented breccia material with encouraging thicknesses and grades. Based on the positive results, the Company continued to advance underground development to support additional drilling in the area, which is now underway.

Recent drilling has encountered flat-lying, manto-style mineralization with meaningful thicknesses, highlighting the potential to grow resource tonnage with additional drilling. These results suggest that the ore body in the zone consists of both vertical- and flat-lying manto-style mineralization. Notably, this new interpretation may apply to other zones at Silvertip that have not yet had the benefit of underground drilling to test for both vertical- and flat-lying mineralization which could lead to higher angle structures that support additional resource tonnage.

Furthermore, the latest drill core is beginning to demonstrate that the mineralization within the Southern Silver zone continues to the southwest, south and southeast, connecting with the Camp Creek, Tour Ridge and Discovery zones, respectively.

Silvertip 2021 Exploration Guidance and Year-End 2020 Reserves and Resources:

  • 2021E Exploration Investment1: Approximately $18 million ($15 million expensed and $3 million capitalized)
  • 2020 Proven and Probable Reserves: 14.6 million ounces of silver at an average grade of 8.1 oz/t (278.2 g/t), 296.1 million pounds of zinc at an average grade of 8.2% and 193.2 million pounds of lead at an average grade of 5.4%
  • 2020 Measured and Indicated Resources: 17.4 million ounces of silver at an average grade of 7.4 oz/t (255.0 g/t), 442.1 million pounds of zinc at an average grade of 9.4% and 216.5 million pounds of lead at an average grade of 4.6%
  • 2020 Inferred Resources: 12.0 million ounces of silver at an average grade of 8.3 oz/t (283.3 g/t), 308.7 million pounds of zinc at an average grade of 10.6% and 143.9 million pounds of lead at an average grade of 5.0%


Wharf2,3

In early 2021, Coeur initiated the largest drilling campaign at Wharf since it acquired the operation in 2015. The Company plans to invest approximately $5 million1 on exploration at Wharf this year – roughly the same amount spent cumulatively since acquisition5. Through the first seven months of 2021, Coeur drilled approximately 85,800 feet (26,175 meters) at Wharf compared to roughly 10,600 feet (3,225 meters) during the same period in 2020.

The Company has essentially achieved its target drill footage for the year, efficiently reaching its goal approximately 30% under budget. Building on this momentum, Coeur plans to keep one active rig turning at Wharf for the rest of the year.

Coeur is targeting oxide-gold hosted in the Deadwood Formation. The team has received about half the outstanding drill assays with roughly 40% of the holes returning results above resource grade thickness cutoff. Based on information received thus far, the Company expects to incorporate these results into its year-end 2021 resource model.

Wharf 2021 Production & Exploration Guidance and Year-End 2020 Reserves and Resources:

  • 2021E Production4: 85,000 – 95,000 ounces of gold
  • 2021E Exploration Investment1: Approximately $5 million (substantially all capitalized)
  • 2020 Proven and Probable Reserves: 720,000 ounces of gold at an average grade of 0.03 oz/t (0.9 g/t)
  • 2020 Measured and Indicated Resources: 605,000 ounces of gold at an average grade of 0.02 oz/t (0.8 g/t)
  • 2020 Inferred Resources: 67,000 ounces of gold at an average grade of 0.02 oz/t (0.7 g/t)


About Coeur

Coeur Mining, Inc. is a U.S.-based, well-diversified, growing precious metals producer with five wholly-owned operations: the Palmarejo gold-silver complex in Mexico, the Rochester silver-gold mine in Nevada, the Kensington gold mine in Alaska, the Wharf gold mine in South Dakota, and the Silvertip silver-zinc-lead mine in British Columbia. In addition, the Company has interests in several precious metals exploration projects throughout North America.

Cautionary Statements

This news release contains forward-looking statements within the meaning of securities legislation in the United States and Canada, including statements regarding exploration efforts and plans, exploration expenditures, drill results, growth, extended mine lives, grade, thickness, investments, mine expansion and development plans, resource delineation, expansion, upgrade or conversion. Such forward-looking statements involve known and unknown risks, uncertainties and other factors which may cause Coeur’s actual results, performance or achievements to be materially different from any future results, performance or achievements expressed or implied by the forward-looking statements. Such factors include, among others, the risk that anticipated additions or upgrades to reserves and resources are not attained, the risk that planned drilling programs may be curtailed or canceled due to budget constraints or other reasons, the risks and hazards inherent in the mining business (including risks inherent in developing large-scale mining projects, environmental hazards, industrial accidents, weather or geologically related conditions), changes in the market prices of gold, silver, zinc and lead and a sustained lower price environment, the uncertainties inherent in Coeur’s production, exploratory and developmental activities, including risks relating to permitting and regulatory delays (including the impact of government shutdowns), ground conditions, grade variability, any future labor disputes or work stoppages, the uncertainties inherent in the estimation of mineral reserves, the potential effects of the COVID-19 pandemic, including impacts to the availability of our workforce, continued access to financing sources, government orders that may require temporary suspension of operations at one or more of our sites and effects on our suppliers or the refiners and smelters to whom the Company markets its production, changes that could result from Coeur’s future acquisition of new mining properties or businesses, the loss of any third-party smelter to which Coeur markets its production, the effects of environmental and other governmental regulations, the risks inherent in the ownership or operation of or investment in mining properties or businesses in foreign countries, Coeur’s ability to raise additional financing necessary to conduct its business, make payments or refinance its debt, as well as other uncertainties and risk factors set out in filings made from time to time with the United States Securities and Exchange Commission, and the Canadian securities regulators, including, without limitation, Coeur’s most recent reports on Form 10-K and Form 10-Q. Actual results, developments and timetables could vary significantly from the estimates presented. Readers are cautioned not to put undue reliance on forward-looking statements. Coeur disclaims any intent or obligation to update publicly such forward-looking statements, whether as a result of new information, future events or otherwise. Additionally, Coeur undertakes no obligation to comment on analyses, expectations or statements made by third parties in respect of Coeur, its financial or operating results or its securities.

Christopher Pascoe, Coeur’s Director, Technical Services and a qualified person under Canadian National Instrument 43-101, approved the scientific and technical information concerning Coeur’s mineral projects in this news release. For a description of the key assumptions, parameters and methods used to estimate mineral reserves and resources, as well as data verification procedures and a general discussion of the extent to which the estimates may be affected by any known environmental, permitting, legal, title, taxation, socio-political, marketing or other relevant factors, Canadian investors should refer to the Technical Reports for each of Coeur’s properties as filed on SEDAR at www.sedar.com.

Notes

The potential quantity and grade for the deposits described herein are conceptual in nature. There is insufficient exploratory work to define a mineral resource and it is uncertain if further exploration will result in the applicable target being delineated as a mineral resource.

  1. Reflects midpoint of guidance as published by Coeur on July 28, 2021.
  2. For a complete table of all drill results included in this release, please refer to the following link: https://www.coeur.com/_resources/news/2021-09-09-Exploration-Update.pdf.
  3. Rounding of grades, to significant figures, may result in apparent differences.
  4. Guidance as published by Coeur on July 28, 2021.
  5. Reflects cumulative investment in exploration at Wharf between 2015 and 2020.

2020 Year-End Proven and Probable Reserves

Grade Contained
Gold Silver Zinc Lead Gold Silver Zinc Lead
Short tons (oz/t) (oz/t) (%) (%) (oz) (oz) (lbs) (lbs)
PROVEN RESERVES
Palmarejo

4,040,000

0.067

4.29

270,000

17,344,000

Rochester

396,867,000

0.003

0.41

1,047,000

162,645,000

Kensington

814,000

0.195

159,000

Wharf

19,181,000

0.024

462,000

Silvertip

186,000

12.01

10.14%

8.53%

2,233,000

37,647,000

31,656,000

Total

421,088,000

0.005

0.43

1,938,000

182,222,000

37,647,000

31,656,000

PROBABLE RESERVES
Palmarejo

11,297,000

0.051

3.72

579,000

42,057,000

Rochester

62,554,000

0.003

0.37

172,000

22,863,000

Kensington

862,000

0.200

172,000

Wharf

9,186,000

0.028

258,000

Silvertip

1,618,000

7.67

7.98%

4.99%

12,403,000

258,418,000

161,569,000

Total

85,518,000

0.014

0.90

1,181,000

77,323,000

258,418,000

161,569,000

PROVEN AND PROBABLE RESERVES
Palmarejo

15,337,000

0.055

3.87

849,000

59,400,000

Rochester

459,421,000

0.003

0.40

1,219,000

185,508,000

Kensington

1,676,000

0.197

331,000

Wharf

28,367,000

0.025

720,000

Silvertip

1,804,000

8.11

8.21%

5.36%

14,636,000

296,065,000

193,225,000

Total

506,606,000

0.006

0.51

3,119,000

259,545,000

296,065,000

193,225,000

2020 Year-End Measured and Indicated Resources

Grade Contained
Gold Silver Zinc Lead Gold Silver Zinc Lead
Short tons (oz/t) (oz/t) (%) (%) (oz) (oz) (lbs) (lbs)
MEASURED RESOURCES
Palmarejo

1,840,000

0.052

3.67

95,000

6,746,000

Rochester

240,568,000

0.002

0.24

388,000

57,160,000

Kensington

2,390,000

0.233

556,000

Wharf

12,992,000

0.019

245,000

Silvertip

138,000

11.17

9.83%

7.88%

1,541,000

27,050,000

21,670,000

Lincoln Hill

4,642,000

0.012

0.34

58,000

1,592,000

La Preciosa

9,536,000

0.005

3.04

45,000

29,001,000

Total

272,106,000

0.005

0.35

1,387,000

96,040,000

27,050,000

21,670,000

INDICATED RESOURCES
Palmarejo

11,591,000

0.045

3.83

518,000

44,398,000

Rochester

57,452,000

0.002

0.25

102,000

14,207,000

Kensington

1,204,000

0.228

274,000

Wharf

12,717,000

0.028

360,000

Silvertip

2,206,000

7.20

9.41%

4.41%

15,892,000

415,000,000

194,780,000

Lincoln Hill

27,668,000

0.011

0.31

306,000

8,655,000

La Preciosa

19,141,000

0.006

3.98

118,000

76,185,000

Total

131,979,000

0.013

1.21

1,678,000

159,337,000

415,000,000

194,780,000

MEASURED AND INDICATED RESOURCES
Palmarejo

13,431,000

0.046

3.81

613,000

51,144,000

Rochester

298,020,000

0.002

0.24

489,000

71,368,000

Kensington

3,594,000

0.231

830,000

Wharf

25,710,000

0.024

605,000

Silvertip

2,344,000

7.44

9.43%

4.62%

17,433,000

442,050,000

216,450,000

Lincoln Hill

32,310,000

0.011

0.32

364,000

10,247,000

La Preciosa

28,677,000

0.006

3.67

163,000

105,186,000

Total

404,086,000

0.008

0.63

3,064,000

255,377,000

442,050,000

216,450,000

2020 Year-End Inferred Resources

Grade Contained
Gold Silver Zinc Lead Gold Silver Zinc Lead
Short tons (oz/t) (oz/t) (%) (%) (oz) (oz) (lbs) (lbs)
INFERRED RESOURCES
Palmarejo

4,345,000

0.064

3.34

280,000

14,525,000

Rochester

226,049,000

0.002

0.27

409,000

61,671,000

Kensington

1,597,000

0.247

394,000

Wharf

3,389,000

0.020

67,000

Silvertip

1,452,000

8.26

10.63%

4.95%

11,998,000

308,700,000

143,880,000

Lincoln Hill

22,952,000

0.011

0.36

255,000

8,163,000

Sterling

31,903,000

0.028

903,000

Wilco

25,736,000

0.021

0.13

531,000

3,346,000

La Preciosa

1,761,000

0.003

3.31

6,000

5,835,000

Total

319,186,000

0.009

0.33

2,845,000

105,538,000

308,700,000

143,880,000

Notes to above Mineral Reserves and Resources:

  1. The qualified person for Mineral Reserve and Mineral Resources estimates is Christopher Pascoe, Coeur’s Director, Technical Services.
  2. Mineral Reserve and Mineral Resource estimates are effective December 31, 2020.
  3. Assumed metal prices for estimated Mineral Reserves were $1,400 per ounce of gold, $17.00 per ounce of silver, $1.15 per pound of zinc, $0.95 per pound of lead.
  4. Assumed metal prices for estimated Mineral Resources were $1,600 per ounce of gold, $20.00 per ounce of silver, $1.30 per pound of zinc, $1.00 per pound of lead, except Lincoln Hill and Wilco at $1,350 per ounce of gold and $22.00 per ounce of silver, and La Preciosa at $1,500 per ounce of gold and $20.00 per ounce of silver.
  5. Mineral Resources are in addition to Mineral Reserves and do not have demonstrated economic viability. Inferred Mineral Resources are considered too speculative geologically to have the economic considerations applied to them that would enable them to be considered for estimation of Mineral Reserves, and there is no certainty that the Inferred Mineral Resources will be realized.
  6. Rounding of tons and ounces, as required by reporting guidelines, may result in apparent differences between tons, grade, and contained metal content.
  7. Excludes the impact of the gold stream agreement at Palmarejo.
  8. For details on the estimation of mineral resources and reserves, including the key assumptions, parameters and methods used to estimate the Mineral Resources and Mineral Reserves, Canadian investors should refer to the NI 43-101 Technical Reports for Coeur’s properties on file at www.sedar.com.

Conversion Table

1 short ton

=

0.907185 metric tons

1 troy ounce

=

31.10348 grams

Comstock Acquires Plain Sight Innovations Corporation


Comstock Acquires Plain Sight Innovations Corporation


Extensive Portfolio of Pioneering Clean Technologies; Cellulosic Biofuels

VIRGINIA CITY, Nev., Sept. 09, 2021 (GLOBE NEWSWIRE) — Comstock Mining Inc. (NYSE: LODE) (“Comstock” and the “Company”) today announced its acquisition of 100% of the issued and outstanding equity of Plain Sight Innovations Corporation (“PSI”) in exchange for 8,500,000 restricted shares of its common stock, and all of the intellectual property assets of PSI’s affiliate, FLUX Photon Corporation (“FPC”), in exchange for a performance-based cash payment equal to 20% of the Company’s future consolidated net cash flow from operations up to $18,000,000.

PSI’s management team has deep experience in a diverse array of industries, including renewable fuels, hazardous waste, agriproducts, and other commodities with almost thirty years of clean technology research, development, and commercialization expertise, with an emphasis on the extraction and valorization of natural resources.

PSI owns an array of patented, patent-pending and proprietary process technologies that were designed to convert low cost, ubiquitous woody biomass feedstocks into cellulosic ethanol, while producing a portfolio of co-products, including renewable diesel and an extraordinary new form of biomass-derived crystalline graphite, or biographite, with compelling applications in the production of carbon neutral batteries and other electrification components. PSI also operates a commercial pilot cellulosic fuel facility based on its technologies in Wisconsin, where it has already proven the ability to efficiently convert various forms of woody biomass into cellulosic ethanol and co-product precursors for renewable diesel, biographite, bioplastics, and a portfolio of carbon neutral alternatives to fossil fuels.

The Path to Decarbonization is in Plain Sight

The transportation sector is expected to dramatically increase the production of electric vehicles to more than 30% of all auto sales by 2030. However, more than two thirds of the energy required to power those electric vehicles is expected to come from burning fossil fuels, and the direct combustion of liquid fuels will most certainly continue to be the dominant source of power for transportation for decades. Burning less, burning smarter, and reusing emissions are therefore critical objectives as the world moves to clean energy and decarbonization.

“Renewable fuels provide a critical pathway for decarbonization, however, most current forms of renewable fuel draw from the same pool of conventional feedstocks, including corn and various vegetable oils in the U.S., and the entire universe of those feedstocks only represents a tiny fraction of the domestic burn,” said David Winsness, PSI’s founder and Chief Executive Officer. “Unfortunately, the lifecycle carbon benefits of growing, harvesting, and using conventional feedstocks are extremely limited. Our technologies were designed to address that dilemma by converting abundantly available forestry wastes, short rotation energy crops, and other low-cost sources of woody biomass into natural liquid fuels with vastly superior benefits for a fraction of the refining costs of conventional renewable fuels.”

The U.S. Department of Energy has estimated that more than one billion tons of forestry wastes and other forms of biomass will be produced annually by 2027 with continued growth thereafter. That’s enough new feedstock to produce as much as 70 billion gallons per year of advanced carbon neutral fuels with PSI’s proven technologies, or more than one third of the U.S. transportation demand on an energy equivalent basis.

Cellulosic Fuels

“That’s enough feedstock to rapidly neutralize motor fuel emissions in conjunction with America’s transition to electrification and renewable energy,” added Winsness. “PSI’s cellulosic fuels facilities will be the first of their kind, with an expected financial, natural, and social impact far in excess of any other platform, renewable or otherwise.”

PSI’s first facility is expected to scale up to an initial capacity exceeding 330,000 tons per year of forestry wastes over its first three years of operations, as it extracts, converts, and refines biomass into ethanol, renewable diesel fuel, and biographite to generate annualized revenues exceeding $86,000,000, $173,000,000, and $346,000,000 per year during the facility’s first three full years of operations, respectively, as shown in the following summary projections:

      2023     2024     2025     2026
Throughput (tons per year)     33,000     85,500     165,000     330,000
Revenue ($000s per year)   $ 34,626   $ 86,565   $ 173,131   $ 346,262

Comstock’s Executive Chairman and Chief Executive Officer, Corrado De Gasperis, commented, “Cellulosic fuel production, like lithium-ion battery recycling and industrial hemp production, is poised for, and we are planning for, exponential growth. Our guidance for these three businesses represents just one facility each and we are planning for over one hundred cellulosic fuel facilities in the U.S. alone. That level of production barely dents the transportation fuels market, yet it represents a meaningful impact on shifting consumption and the resulting decarbonization.”

Ecosystem of Strategic Feedstocks, Processes, and Products

PSI’s technologies are especially important to the Company’s plans to build a synergistic ecosystem of strategic lines of business and production facilities with complimentary feedstocks and products, supported by world class technological and engineering talent. The Company’s ability to systemically discover, develop, engineer, manufacture and commission its own solutions, represents a remarkable competitive advantage that enables speed.

Benchmark Mineral Intelligence estimates that the major automakers have committed over $300 billion to developing electric vehicles (“EVs”) and that over 2,000 GWh of lithium-ion battery (“LIB”) production capacity is in the pipeline. That amount of production in turn equates to 1.4 million tons of new annual graphite demand by 2028. Conventional graphite comes from natural deposits or the carbonization of petroleum products, with market values ranging from about $10,000 per ton for natural graphite to $20,000 per ton for synthetic graphite.

De Gasperis continued, “Most of my relevant experience comes from managing the global manufacturing of carbon-based, material-science products, particularly synthetic graphite. I was literally stunned by PSI’s discovery of a natural source of carbon neutral biographite. When we consider that every cathode in every lithium-ion battery needs an anode, and most anodes are made from synthetic graphite which is substantially all produced with carbon intensive fossil fuel derivatives, then we understand that that industry is not climate smart or clean. We can fundamentally change the game by introducing the world’s first scalable carbon neutral alternative to fossil fuel derived graphite.”

PSI’s intellectual property portfolio also includes remarkably advanced new approaches to carbon capture and utilization, atmospheric water harvesting, waste heat and energy recovery, and industrial photosynthesis for terascale decarbonization and the sustainable production of very large agricultural outputs for fractional inputs.

About Comstock Mining Inc.
Comstock Mining Inc. (NYSE: LODE) (the “Company”) is an emerging innovator and leader in the sustainable extraction, valorization, and production of scarce natural resources, with a focus on high value strategic materials that are essential to meeting the rapidly increasing global demand for clean energy, carbon-neutrality, and natural products. To learn more, please visit www.comstockmining.com.

Forward-Looking Statements
This press release and any related calls or discussions may include forward-looking statements within the meaning of Section 27A of the Securities Act of 1933, as amended, and Section 21E of the Securities Exchange Act of 1934, as amended. All statements, other than statements of historical facts, are forward-looking statements. The words “believe,” “expect,” “anticipate,” “estimate,” “project,” “plan,” “should,” “intend,” “may,” “will,” “would,” “potential” and similar expressions identify forward-looking statements, but are not the exclusive means of doing so.

Forward-looking statements include statements about matters such as: future industry market conditions; future explorations or acquisitions; future changes in our exploration activities; future prices and sales of, and demand for, our products; land entitlements and uses; permits; production capacity and operations; operating and overhead costs; future capital expenditures and their impact on us; operational and management changes (including changes in the Board of Directors); changes in business strategies, planning and tactics; future employment and contributions of personnel, including consultants; future land sales; investments, acquisitions, joint ventures, strategic alliances, business combinations, operational, tax, financial and restructuring initiatives, including the nature, timing and accounting for restructuring charges, derivative assets and liabilities and the impact thereof; contingencies; litigation, administrative or arbitration proceedings; environmental compliance and changes in the regulatory environment; offerings, limitations on sales or offering of equity or debt securities, including asset sales and associated costs; and future working capital, costs, revenues, business opportunities, debt levels, cash flows, margins, taxes, earnings and growth. These statements are based on assumptions and assessments made by our management in light of their experience and their perception of historical and current trends, current conditions, possible future developments and other factors they believe to be appropriate. Forward-looking statements are not guarantees, representations or warranties and are subject to risks and uncertainties, many of which are unforeseeable and beyond our control and could cause actual results, developments and business decisions to differ materially from those contemplated by such forward-looking statements. Some of those risks and uncertainties include the risk factors set forth in our filings with the SEC and the following: adverse effects of climate changes or natural disasters; adverse effects of global or regional pandemic disease spread or other crises; global economic and capital market uncertainties; the speculative nature of gold or mineral exploration, mercury remediation and lithium, nickel and cobalt recycling, including risks of diminishing quantities or grades of qualified resources; operational or technical difficulties in connection with exploration or mercury remediation, metal recycling, processing or mining activities; costs, hazards and uncertainties associated with precious metal based activities, including environmentally friendly and economically enhancing clean mining and processing technologies, precious metal exploration, resource development, economic feasibility assessment and cash generating mineral production; costs, hazards and uncertainties associated with mercury remediation, metal recycling, processing or mining activities; contests over our title to properties; potential dilution to our stockholders from our stock issuances, recapitalization and balance sheet restructuring activities; potential inability to comply with applicable government regulations or law; adoption of or changes in legislation or regulations adversely affecting our businesses; permitting constraints or delays; ability to achieve the benefits of business opportunities that may be presented to, or pursued by, us, including those involving battery technology, mercury remediation technology and efficacy, quantum computing and advanced materials development, and development of cellulosic technology in bio-fuels and related carbon-based material production; ability to successfully identify, finance, complete and integrate acquisitions, joint ventures, strategic alliances, business combinations, asset sales, and investments that we may be party to in the future; changes in the United States or other monetary or fiscal policies or regulations; interruptions in our production capabilities due to capital constraints; equipment failures; fluctuation of prices for gold or certain other commodities (such as silver, zinc, lithium, nickel, cobalt, cyanide, water, diesel, gasoline and alternative fuels and electricity); changes in generally accepted accounting principles; adverse effects of war, mass shooting, terrorism and geopolitical events; potential inability to implement our business strategies; potential inability to grow revenues; potential inability to attract and retain key personnel; interruptions in delivery of critical supplies, equipment and raw materials due to credit or other limitations imposed by vendors; assertion of claims, lawsuits and proceedings against us; potential inability to satisfy debt and lease obligations; potential inability to maintain an effective system of internal controls over financial reporting; potential inability or failure to timely file periodic reports with the Securities and Exchange Commission; potential inability to list our securities on any securities exchange or market or maintain the listing of our securities; and work stoppages or other labor difficulties. Occurrence of such events or circumstances could have a material adverse effect on our business, financial condition, results of operations or cash flows, or the market price of our securities. All subsequent written and oral forward-looking statements by or attributable to us or persons acting on our behalf are expressly qualified in their entirety by these factors. Except as may be required by securities or other law, we undertake no obligation to publicly update or revise any forward-looking statements, whether as a result of new information, future events, or otherwise.

Neither this press release nor any related calls or discussions constitutes an offer to sell, the solicitation of an offer to buy or a recommendation with respect to any securities of the Company, the fund or any other issuer.

Contact Information    
Comstock Mining Inc.
P.O. Box 1118
Virginia City, NV 89440
www.comstockmining.com
Corrado De Gasperis
Executive Chairman & CEO
Tel (775) 847-4755
degasperis@comstockmining.com
Zach Spencer
Director of External Relations
Tel (775) 847-5272 Ext.151
questions@comstockmining.com

Chakana Copper Corp (CHKKF)(PERU:CA) – The Initial Resource Estimate Is Not Expected to Be an End Point

Wednesday, September 08, 2021

Chakana Copper Corp (CHKKF)(PERU:CA)
The Initial Resource Estimate Is Not Expected to Be an End Point

Noble Capital Markets research on Chakana Copper Corp is published under ticker symbols CHKKF and PERU:CA. The price target is in USD and based on ticker symbol CHKKF. Chakana Copper Corp is a Canadian-based minerals exploration company that is currently advancing the high-grade gold-copper-silver Soledad Project located in the Ancash region of Peru, a highly favorable mining jurisdiction with supportive communities. The Soledad Project consists of high-grade gold-copper-silver mineralization hosted in tourmaline breccia pipes. A total of 33,353 metres of drilling has been completed to-date, testing nine (9) of twenty-three (23) confirmed breccia pipes with more than 92 total targets. Chakana’s investors are uniquely positioned as the Soledad Project provides exposure to several metals including copper, gold, and silver.

Mark Reichman, Senior Research Analyst of Natural Resources, Noble Capital Markets, Inc.

Refer to the full report for the price target, fundamental analysis, and rating.

    Latest drill results. Resource definition drilling at Breccia Bx 1 has entailed 62 drill holes, representing 17,936 meters of drilling. Chakana released drill results from the final 7 resource definition holes from Bx 1 that provided strong readings that were consistent with previous drill results. Additional resource definition drill results for Bx 5 and Huancarama are pending.

    Initial resource estimate expected in Q4′ 2021.  The company expects to release an initial resource estimate in the fourth quarter of 2021 which will include Bx 1, Bx 5, Bx 6, Paloma East, Paloma West, and Huancarama down to a depth of 300 meters. While Chakana’s near-term focus is the completion of the initial resource estimate, the company still has ground to cover in terms of defining Soledad’s …


This Company Sponsored Research is provided by Noble Capital Markets, Inc., a FINRA and S.E.C. registered broker-dealer (B/D).

*Analyst certification and important disclosures included in the full report. NOTE: investment decisions should not be based upon the content of this research summary.  Proper due diligence is required before making any investment decision.