For decades, the playbook has been simple: when war breaks out, buy gold. But the ongoing U.S.-Israeli conflict with Iran is rewriting that script in real time, and investors are scrambling to make sense of a metal that is behaving more like a speculative trade than the world’s oldest store of value.
Gold has dropped nearly 10% this week, putting it on track for its worst weekly performance in 43 years, with the metal’s total decline since the war began now sitting at approximately 13%. On Friday, gold was trading around $4,570 per troy ounce — erasing two months of gains in a matter of days.
The Rate Problem Nobody Saw Coming
The paradox at the heart of gold’s collapse is this: the same war that should theoretically be sending investors rushing into safe-haven assets is also the reason central banks are slamming the door on interest rate cuts.
The Federal Reserve held rates steady and cited uncertain impacts from the conflict, while the Bank of Japan kept rates unchanged, noting that inflation risks are now tilted to the upside. Central banks across Europe — including the U.K. and the eurozone — followed suit. Market expectations for Fed rate cuts have shifted dramatically, with traders now pricing in no cuts until as late as June 2027 — a full twelve months later than pre-war projections. That matters enormously for gold, which pays no yield. When bonds and other interest-bearing assets become more attractive, gold loses its competitive edge almost immediately.
The Dollar Is Doing Gold No Favors Either
The U.S. dollar has rebounded approximately 2.2% since the Iran war began, halting a months-long slide. Because gold is priced in dollars, a stronger greenback makes the metal relatively more expensive for international buyers, dampening global demand.
Oil prices have remained above $100 per barrel following attacks on major energy infrastructure, including one of the world’s largest natural gas fields shared by Iran and Qatar, with the conflict showing no signs of resolution. Energy-driven inflation is now feeding directly into the rate calculus that is punishing gold.
From Safe Haven to Meme Trade — and Back?
Part of what’s happening is a hangover from an extraordinary run. Gold surged 66% in 2025, its best annual performance since 1979, before hitting $5,000 per troy ounce for the first time in January 2026. Retail investors piled in chasing momentum, and when that momentum began to reverse, the selling accelerated. Some analysts have raised the possibility that central banks, which were previously aggressive buyers, may now be turning into net sellers — an additional headwind few had anticipated.
The longer-term bull case hasn’t disappeared. J.P. Morgan maintains a 2026 year-end target of $6,300 per ounce, while Deutsche Bank holds firm at $6,000 — though both forecasts were set before the Iran escalation.
For long-term holders, the fundamental case remains intact. Real interest rates, global monetary policy, and persistent geopolitical uncertainty have historically been the primary drivers of sustained gold bull markets, and none of those underlying forces have been resolved.
The question isn’t whether gold’s story is over. The question is whether the market has finally priced in a world where geopolitical chaos and monetary tightening can coexist — and where gold, at least temporarily, is caught in the crossfire.
VANCOUVER, BC, March 19, 2026 – Nicola Mining Inc. (the “Company” or “Nicola”) (TSX: NIM) (OTCQB: HUSIF) (FSE: HLIA) is pleased to announce that Warren Wagner has completed his Master of Science (M.Sc.) thesis, at the university of British Columba’s (UBC) Mineral Deposit Research Unit (MRDU), on the New Craigmont copper project[1]. His thesis is titled The Skarn to Porphyry Transition: Establishing Links Between Skarn and Porphyry-Type Mineralization at New Craigmont British Columbia. The full publication and supplementary data tables are available for download on the UBC website: https://open.library.ubc.ca/soa/cIRcle/collections/ubctheses/24/items/1.0451531
The purpose of the thesis was to examine the potential connection between the historically mined Craigmont skarn and undiscovered porphyry systems in the surrounding area. Using field observations, petrography, whole-rock and mineral chemistry, and integrated geochronology, Warren’s thesis has redefined Craigmont as a porphyry-linked skarn system genetically tied to multi-pulsed Late Triassic magmatism within the Guichon Creek batholith’s Border Phase.
Mineral ages determined through geochronology lab work defined two discrete hydrothermal stages: massive calcsilicate skarn alteration at ~215 Ma related to the earliest Border Phase intrusions and overprinting, vein-hosted porphyry-type mineralization at ~209 Ma associated with later, oxidized intrusions.
Potassic, phyllic, calc-potassic, and propylitic alteration styles indicate the presence of a larger porphyry system proximal to the skarn deposit. Epidote mineral chemistry from propylitic assemblages further supports this. New Craigmont epidote contains elevated porphyry indicator trace elements consistent with other porphyry deposits in British Columbia and worldwide. Finally, epidote mineral chemistry systematics within the Guichon Creek batholith reveal that New Craigmont contains a separate, porphyry centre, unrelated to those of the Highland Valley district. The study also highlights the importance of structural permeability and reactive Nicola Group host rocks in focusing hydrothermal fluids and controlling the distribution of skarn and porphyry-style mineralization.
Conclusions of the study have positive implications for ongoing exploration at New Craigmont. The study confirms Nicola’s ongoing hypothesis that the historical skarn is driven by a nearby porphyry system. Detailed geochemistry work has helped narrow exploration to broadly two regions within the property: West Craigmont (where the Draken target is located), and east of the historical mine (where the Jotun target is located). Nicola is integrating MRDU data into ongoing vectoring work and target generation.
Peter Espig, CEO of Nicola, stated, “We applaud Warren and MRDU on two years of fruitful work at our New Craigmont Copper Project. The thesis’ conclusion aligns with our growing confidence in our three years of geological work, mapping and 2025 porphyry vectoring. Given the size of our land package and location, which includes sharing Guichon Batholith with Highland Valley Copper, the prospect of having one or more porphyries at New Craigmont is increasingly compelling, as highlighted in the thesis. We are very encouraged to commence our 2026 Exploration Program.”
Qualified Person
The scientific and technical disclosures included in this news release have been reviewed and approved by Will Whitty, P.Geo., who is the Qualified Person as defined by NI 43-101. Mr. Whitty is Vice President, Exploration for the Company.
About Nicola Mining
Nicola Mining Inc. is a junior mining company listed on the TSX-V Exchange and Frankfurt Exchange that maintains a 100% owned mill and tailings facility, located near Merritt, British Columbia. It has signed Mining and Milling Profit Share Agreements with high-grade BC-based gold projects. Nicola’s fully permitted mill can process both gold and silver mill feed via gravity and flotation processes.
The Company owns 100% of the New Craigmont Project, a property that hosts historical high-grade copper mineralization and covers an area of over 10,800 hectares along the southern end of the Guichon Batholith and is adjacent to Highland Valley Copper, Canada’s largest copper mine. The Company also owns 100% of the Treasure Mountain Property, which includes 30 mineral claims and a mineral lease, spanning an area exceeding 2,200 hectares.
Neither the TSX Venture Exchange nor its Regulation Services Provider (as that term is defined in the policies of the TSX Venture Exchange) accepts responsibility for the adequacy or accuracy of this release.
Mark Reichman, Managing Director, Equity Research Analyst, Natural Resources, Noble Capital Markets, Inc.
Hans Baldau, Associate Analyst, Noble Capital Markets, Inc.
Refer to the full report for the price target, fundamental analysis, and rating.
Kuya Silver is significantly scaling its exploration efforts at Bethania. The company has expanded its fully funded 2026 drill program to approximately 20,000 meters, making it the largest drilling campaign in the project’s history. By combining 10,000 meters of surface and 10,000 meters of underground drilling, Kuya seeks to extend known mineralization near existing operations and test new district scale targets, positioning the project for meaningful resource growth.
High-grade regional targets highlight strong expansion potential. Exploration has identified multiple vein systems beyond the current mine area, with high priority prospects such as Millococha, Tito PH, and Carmelitas demonstrating encouraging grades and geological continuity. These areas, supported by historic artisanal mining and recent sampling, suggest the presence of a broader mineralized system that could materially increase the overall resource base.
Equity Research is available at no cost to Registered users of Channelchek. Not a Member? Click ‘Join’ to join the Channelchek Community. There is no cost to register, and we never collect credit card information.
This Company Sponsored Research is provided by Noble Capital Markets, Inc., a FINRA and S.E.C. registered broker-dealer (B/D).
*Analyst certification and important disclosures included in the full report. NOTE: investment decisions should not be based upon the content of this research summary. Proper due diligence is required before making any investment decision.
President Trump issued a 60-day waiver of the Jones Act on Wednesday in a bid to cool surging domestic energy prices as the Iran conflict continues to hammer global oil markets. The move, confirmed by White House press secretary Karoline Leavitt, opens U.S. ports to foreign-flagged vessels for the next two months — covering crude oil, refined products like gasoline and diesel, natural gas, coal, fertilizer, and other energy-derived commodities.
The decision comes as Brent crude crossed $109 per barrel Wednesday morning — up more than 7% on the day — while WTI traded above $97. Gas prices at the pump have climbed to a national average of $3.84 per gallon, up sharply from $2.92 just one month ago, according to AAA data. Diesel has already crossed $5 per gallon nationally. The administration is clearly feeling political pressure to act ahead of the midterm cycle, and the Jones Act waiver is the most tangible move it has made so far.
What the Jones Act Actually Does
The Jones Act — formally the Merchant Marine Act of 1920 — requires that any cargo transported between U.S. ports be carried by vessels that are U.S.-built, U.S.-owned, U.S.-flagged, and U.S.-crewed. The law was designed to protect the domestic shipping industry after World War I, but has long been criticized by economists as an inflationary form of protectionism that raises the cost of moving goods within the country. With fewer than 100 Jones Act-compliant vessels in existence, the waiver immediately opens the door to a much larger pool of international tankers to move fuel between domestic ports.
The Practical Impact — And Its Limits
In theory, the waiver should have its biggest effect on refined product shipments from Gulf Coast refinery complexes to the more isolated East Coast — a corridor that has historically been a bottleneck during supply disruptions. Cheaper, more accessible shipping capacity means fuel can theoretically move faster and at lower cost to the regions that need it most.
But experts are already tempering expectations. The core problem isn’t moving fuel — it’s refining it. Most U.S. refineries are configured to process heavier Middle Eastern crude grades, while domestic shale production yields lighter oil. That structural mismatch means the U.S. still cannot fully self-supply even with more flexible shipping rules. The waiver makes domestic logistics more efficient, but it does not solve the underlying supply equation.
The Broader Policy Picture
The Jones Act move is reportedly just one item on a broader White House menu of potential energy interventions being considered, including possible Treasury-led action in energy futures markets and export bans on crude and refined products. Any of those measures — if enacted — would carry significant market implications across the energy sector.
For small and microcap investors, the read-through is layered. Domestic shippers and Jones Act operators could see near-term pricing pressure as foreign competition enters the market. Refiners with Gulf Coast exposure and East Coast distribution capability may benefit from improved logistics economics. And any company with meaningful fuel cost exposure — from regional truckers to agricultural operators to industrial manufacturers — should be watching this space closely as the administration continues to improvise policy responses to a crisis with no clear end date.
Toronto, Ontario–(Newsfile Corp. – March 17, 2026) – Kuya Silver Corporation (CSE: KUYA) (OTCQB: KUYAF) (FSE: 6MR1) (the “Company” or “KuyaSilver“) is pleased to announce an expansion of its fully-funded 2026 drill program at the Bethania Silver Project in central Peru designed to unlock value by focusing on delineating mineralized silver vein systems which have been historically underexplored. The program, expected to total approximately 20,000 metres combined underground and surface diamond drilling, would represent the largest drill program ever at the Bethania project.
The surface drill program is planned for approximately 10,000 metres and will focus on priority targets associated with historical artisanal mining areas identified during the Company’s recent regional exploration work, located outside the immediate Bethania mine area (Figure 1 below). These targets represent potential additions to the district-scale mineralized system and may also have potential for future production. Over the coming months Kuya Silver plans to conduct additional work to prioritize targets for the 2026 drill program which may include any of the six previously identified regional silver vein systems (e.g. Carmelitas, Tito PH, Millococha)
The Company also plans to expand on its previously announced underground drilling program to approximately 10,000 metres in 2026 (from 5,000 metres announced previously). Drilling will be conducted from established mine levels and is designed to test extensions of known mineralized structures that remain open along strike and at depth. This approach allows the Company to expand resources adjacent to current mine infrastructure while testing high-priority targets at relatively low cost and improving the geological continuity of the known vein system.
The combined surface and underground programs are expected to improve the geological understanding of the mineralized systems and support the Company’s ongoing efforts to grow resources within the broader Bethania district. Initial results from the underground drilling campaign are expected in Q2 2026 and additional drill results from underground and initial surface drilling results are expected over the second half of 2026.
“Following encouraging surface exploration results across the Bethania property, we are excited to begin the next phase of drilling,” stated Osbaldo Zamora, VP Exploration of Kuya Silver. “By combining surface drilling with underground drilling from existing workings, we are able to efficiently test both district-scale targets and near-mine extensions that could meaningfully expand the project’s resource base.”
David Stein, Kuya Silver’s President and CEO also remarked, “The Company is excited to embark on a much larger drill campaign covering multiple targets across the Bethania district. Given our significant cash position in excess of USD $25 million and expected cash flow from the Bethania mine, this more aggressive exploration strategy should be fully funded from internal sources and can be maintained and expanded over the coming years as we grow our silver mining operations.”
Figure 1: Bethania historical surface exploration results up to February 2026 showing all sample locations.
Surface drilling is expected to commence in the coming months following final permitting and logistical preparations. Over the past five plus years, Kuya Silver has consolidated in excess of 4,500 ha surrounding the Bethania mine. Various surface prospecting campaigns over the past several years has identified six different silver vein systems characterized by historical evidence of artisanal mining and outcropping veins with silver-polymetallic mineralization which have been mapped and sampled by Kuya Silver’s geologists. These additional vein systems can be subdivided into three areas located south (Tito PH), west (Carmelitas) and southwest (Millococha) of the Bethania silver mine.
Tito PH
Tito PH is a priority exploration target consisting of one main vein and at least seven additional subparallel veins (Figure 2 below). The main vein has been mapped over approximately 600 metresof strike and may extend up to 1,500 metres, although a 700 metres gap in surface exposure remains to be tested by drilling.
Minor artisanal workings, including two shallow adits and an open stope, occur along the vein cluster. A total of 55grab samples collected by Kuya Silver geologists returned an arithmetic average grade of 285.7 g/t AgEq* and a maximum value of 2,114.7 g/t AgEq*. The interpreted strike length and high-grade surface samples suggest the system could be comparable in scale to the veins currently mined at Bethania.
Figure 2. Detailed map showing interpreted veins, grab sample locations, and assays at the Tito PH prospect.
Millococha Oeste is one of the most prospective targets identified within the Bethania land package due to the presence of more than 10 mapped veins with consistently high grades. A total of 40 grab samples collected by Kuya Silver geologists returned an arithmetic average grade of 690.4 g/t AgEq* and a maximum value of 2,652.7 g/t AgEq* (Figure 3 below).
Artisanal workings on Kuya Silver’s claims represent the most significant historic activity outside the Santa Elena concession, but remain relatively shallow and poorly explored, highlighting the potential for additional mineralization at depth.
Figure 3. Detailed map showing interpreted veins, grab sample locations, and assays at the Millococha prospect.
The Carmelitas prospect includes three vein clusters within an area of approximately 800 metres, comprising the main Carmelitas artisanal mine as well as the Carmelitas Norte and Carmelitas Este showings (Figure 4 below). A total of 125 grab samples collected by Kuya Silver returned grades up to 1,771.5 g/t Ag and an arithmetic average of 145.2g/t AgEq*.
Although vein density is lower than at other targets, the prospect remains attractive due to the presence of high-grade mineralization and potential structural connections between the three vein clusters.
*Silver Equivalency (AgEq) was calculated using silver ($85.74 USD/troy oz), gold ($5,177.70 USD/troy oz), copper ($12,815.48 USD/tonne), lead ($1,892.0 USD/tonne) and zinc ($3,286.76 USD/tonne) values, obtained on March 3, 2026 from Kitco, and do not consider metal recovery.
Figure 4. Detailed map showing interpreted veins, grab sample locations, and assays at the Carmelitas prospect.
A total of 940 grab samples (plus QA/QC) were collected in different exploration campaigns from 2021 to 2026. Only 192 samples collected from 2024 to 2026 count with proper QA/QC assessment. The coordinates of the locations of each sample were measured by handheld GPS and the samples dispatched to the ALS Peru S.A. laboratory in Lima for geochemical analysis. The analyses were carried out using the following methods:
ME-OG61a – Multi-acid digestion with ICP-AES detection for 33 elements
Au-AA23 – Fire assay for gold
Ag-OG62 – Four-acid digestion with ICP-AES detection for overlimit silver
All QA/QC standards were acceptable and within two standard deviations of certified values.
As these samples include a mix of early-stage grab, chip, and channel samples and do not include details on vein width, they are not fully representative of total vein mineralization.
National Instrument 43-101 Disclosure
The technical content of this news release has been reviewed and approved by Osbaldo Zamora, PhD., P.Geo., Vice President Exploration with Kuya Silver Corp. and a Qualified Person as defined by National Instrument 43-101.
About Kuya Silver Corporation
Kuya Silver is a Canadian‐based, growth-oriented mining company with a focus on silver. Kuya Silver operates the Bethania silver mine in Peru, while developing district-scale silver projects in mining-friendly jurisdictions including Peru and Canada.
This news release contains statements that constitute “forward-looking information,” including statements regarding the plans, intentions, beliefs, and current expectations of the Company, its directors, or its officers with respect to the future business activities of the Company. The words “may,” “would,” “could,” “will,” “intend,” “plan,” “anticipate,” “believe,” “estimate,” “expect,” “must,” “next,” “propose,” “new,” “potential,” “prospective,” “target,” “future,” “verge,” “favorable,” “implications,” and “ongoing,” and similar expressions, as they relate to the Company or its management, are intended to identify such forward-looking information. Investors are cautioned that statements including forward-looking information are not guarantees of future business activities and involve risks and uncertainties, and that the Company’s future business activities may differ materially from those described in the forward-looking information as a result of various factors, including but not limited to fluctuations in market prices, successes of the operations of the Company, continued availability of capital and financing, and general economic, market, and business conditions. There can be no assurances that such forward-looking information will prove accurate, and therefore, readers are advised to rely on their own evaluation of the risks and uncertainties. The Company does not assume any obligation to update any forward-looking information except as required under the applicable securities laws.
Neither the Canadian Securities Exchange nor the Investment Industry Regulatory Organization of Canada accepts responsibility for the adequacy or accuracy of this release.
HOUSTON, March 16, 2026 /PRNewswire/ — Summit Midstream Corporation (NYSE: SMC) (“Summit”, “SMC” or the “Company”) announced today its financial and operating results for fourth quarter and full-year 2025, Permian and Rockies segment growth update, and provided full-year 2026 financial guidance.
Highlights
Fourth quarter net loss of $7.3 million, Adjusted EBITDA of $58.5 million, cash flow available for distributions (“Distributable Cash Flow” or “DCF”) of $33.7 million and free cash flow (“FCF”) of $17.0 million
Recently signed three 10+-year firm take-or-pay contracts on Double E that are expected to drive Permian Segment Adjusted EBITDA from $34 million in 2025 to approximately $60 million in 2029
Launched a binding open season on Double E to secure market commitments to support a mainline compression project to increase firm capacity by up to 50% from 1.6 Bcf/d to approximately 2.4 Bcf/d
Refinanced Double E capital structure1 with a new term loan that will fund Double E capital projects (including the mainline compression project) and provide an $85 million one-time distribution to Summit to pay down debt and repay $45 million of arrears on its corporate Series A Preferred Stock
Executed a new 10-year crude oil gathering agreement covering more than 200,000 acres in the Williston
Active customer base with seven rigs running, approximately 90 DUCs and 116 to 126 wells expected in 2026
Provided 2026 full-year financial guidance range of $225 million to $265 million in Adjusted EBITDA and total capital expenditures of $85 million to $105 million, including $35 million attributable to Double E
Management Commentary
Heath Deneke, President, Chief Executive Officer and Chairman, commented, “We are pleased with the commercial and financial progress achieved over the past two quarters, which underscore the strategic value of our infrastructure, embedded growth opportunities, and our continued focus on execution with financial discipline. With the signing of major long-term agreements on the Double E Pipeline and in the Williston Basin, we are building on strong commercial momentum in our Permian and Rockies segments, while maintaining steady operational performance, strengthening our balance sheet and allocating capital prudently. We’re also further advancing Double E’s growth with a new open season to support a mainline compression project that could expand pipeline capacity by 50% by the end of 2028. Additionally, the Double E refinancing underscores Summit’s financial flexibility and ability to execute on important growth initiatives while continuing to maintain focus on reaching long-term corporate leverage targets. The planned repayment of the arrears on the Series A Preferred Stock further simplifies Summit’s balance sheet and is also an important step towards enabling a sustainable return of capital program for our shareholders in the future.
Operationally, despite the earlier oil price headwinds, we maintained an active customer base with seven rigs currently running behind our systems, approximately 90 DUCs and between 116 to 126 wells expected to be turned in line in 2026. Our 2026 outlook reflects sustained activity across our systems and incremental investment in high-return growth projects, which we expect will drive EBITDA growth in 2027 and beyond. Furthermore, given the mid-$60 oil price assumption embedded in our 2026 guidance, we are optimistic that customer activity levels could further increase in the second half of the year if the recent spike in oil prices continues to lift the backend of the forward price curve.”
Double E Commercial Update
Producers Midstream II reached a final investment decision on Train II of its Dude processing plant in Lea County, New Mexico, which was a condition precedent to the commencement of the previously announced 10-year, 100 MMcf/d firm transportation agreement. The new contract is expected to commence service in the fourth quarter of 2026.
Double E Pipeline entered into a new 11-year take-or-pay natural gas firm transportation agreement with a large, investment-grade shipper for 210 MMcf/d of capacity, including 80 MMcf/d expected to commence in the fourth quarter of 2026 and an additional 130 MMcf/d expected to commence in the second half of 2028. These commitments also expand Double E’s downstream connectivity with new delivery points into the Transwestern Central Pool, the Hugh Brinson Pipeline and a planned future connection with the Desert Southwest Pipeline. The new delivery points will significantly broaden Double E Shipper’s access to diverse and growing end use markets in addition to the multiple interconnects with downstream egress pipelines connecting the Waha Hub to Gulf Coast markets.
Double E Pipeline also entered into a new 11+ year natural gas transportation agreement with an undisclosed shipper for 230 MMcf/d of firm capacity, with 100 MMcf/d expected to start in the fourth quarter of 2027, 80 MMcf/d in the fourth quarter of 2028, and an additional 50 MMcfd in the second quarter of 2029. The agreement is contingent upon satisfaction of certain customary conditions precedent and is subject to shipper providing notice of its final investment decision to construct an expansion of its processing facility prior to October 1, 2026.
With the additional contracts, Summit expects its 70% interest in Double E to generate approximately $60 million of Segment Adjusted EBITDA in 2029, representing an approximate 76% increase to the $34 million of Segment Adjusted EBITDA generated in 2025. These projects are expected to cost approximately $50 million, net to Summit’s 70% interest, with approximately $35 million expected in 2026 and the remainder in 2027. These capital requirements are expected to be fully funded with the new term loan at Summit Permian Transmission which is non-recourse to Summit. Further, Double E has launched a binding open season to secure market commitments to support a mainline compression project to expand the pipeline’s capacity from approximately 1.6 Bcf/d to over 2.4 Bcf/d by the end of 2028. The compression expansion remains subject to additional commercial support via incremental long-term take-or-pay agreements and FERC and other regulatory approvals.
Double E Refinancing Transaction
Subsequent to quarter-end, Summit refinanced the Summit Permian Transmission, LLC and Summit Permian Transmission Holdco, LLC capital structure with a new $440 million term loan facility, including a $340 million borrowing at closing, $50 million committed delayed draw facility used to fund the Producers Midstream and other expansion projects, as well as a $50 million uncommitted accordion to fund the expected mainline compression expansion project. Proceeds from the new facility were used to refinance the $112.7 million Summit Permian Transmission term loan, $141.9 million Summit Permian Transmission Holdco’s preferred units2, an $85 million one-time distribution to Summit, and pay other fees and expenses. Summit intends to use the $85 million one-time distribution to pay down approximately $45 million of accrued and unpaid dividends on its Series A Preferred Stock and approximately $40 million of ABL borrowings. Repayment of the accrued and unpaid dividends represents a critical step of Summit’s objective to resume dividend payments on its common stock once Summit achieves its long-term leverage target of 3.5x. In addition, the $40 million ABL repayment reduces Summit’s leverage by approximately 0.2x, aligning with its continued focus on corporate de-levering.
Pro Forma Capitalization
Williston Commercial Update
During the fourth quarter, Summit executed a new 10-year crude gathering agreement with a Bakken producer, anchored by a large Area of Dedication covering more than 200,000 acres across its existing footprint in Divide County, North Dakota. The first new pad — consisting of four 3-mile laterals — is expected to be turned in line in the first quarter of 2026. This agreement meaningfully expands Summit’s dedicated acreage and long-term economic inventory supporting its infrastructure, while positioning the Company to pursue additional development opportunities across northern Williams and southern Divide Counties. With the efficiency gains associated with 3-mile laterals, these areas have become economically attractive in the current oil price environment. As Bakken producers continue expanding activity in the northern and western portions of the basin, Summit expects increasing commercial momentum and growth around its Polar and Divide systems.
Fourth Quarter 2025 Business Highlights
SMC’s average daily natural gas throughput on its wholly owned operated systems decreased 3.4% to 894 MMcf/d, while liquids volumes decreased 8.3% to 66 Mbbl/d, relative to the third quarter of 2025. Double E pipeline transported an average of 861 MMcf/d and contributed $8.7 million in Adjusted EBITDA, net to SMC, for the fourth quarter of 2025.
Natural gas price-driven segments:
Natural gas price-driven segments generated $31.5 million in combined Segment Adjusted EBITDA, a $4.6 million decrease relative to the third quarter and combined capital expenditures of $9.2 million.
Mid-Con Segment Adjusted EBITDA totaled $21.5 million, a decrease of $2.1 million relative to the third quarter of 2025, primarily due to a decrease in volume throughput on the system. Volume throughput on the system decreased by 3.7% primarily due to natural production declines partially offset by six new well connections in the Arkoma. Subsequent to quarter end, six new wells were connected in the Arkoma. There is currently one rig running in the Arkoma, with 21 DUCs behind the system, including 17 DUCs in the Barnett, which are all expected to come online in 2026.
Piceance Segment Adjusted EBITDA totaled $10.0 million, a decrease of $2.5 million relative to the third quarter of 2025, primarily due to realization of previously deferred revenue in the third quarter and a 5.4% decrease in volume throughput. There were no new wells connected to the system during the fourth quarter.
Oil price-driven segments:
Oil price-driven segments generated $36.6 million of combined Segment Adjusted EBITDA, representing a $1.1 million decrease relative to the third quarter of 2025, and had combined capital expenditures of $9.0 million.
Rockies Segment Adjusted EBITDA totaled $27.8 million, a decrease of $1.2 million relative to the third quarter of 2025, primarily driven by a 8.3% decrease in liquids volume throughput, partially offset by a 1.3% increase in natural gas volume throughput, relative to the third quarter of 2025. The decrease in liquids volumes was primarily driven by natural production declines and no new well connections in the Williston Basin during the quarter. Natural gas volume growth was supported by 33 new well connections in the DJ Basin, which are expected to reach peak production in the second quarter of 2026. There are currently six rigs running and approximately 65 DUCs behind the system.
Permian Segment Adjusted EBITDA totaled $8.8 million, an increase of $0.1 million relative to the third quarter of 2025, primarily due to a 20.9% increase in volumes shipped on the Double E Pipeline leading to an increase in proportionate Adjusted EBITDA from our Double E joint venture.
The following table presents average daily throughput by reportable segment for the periods indicated:
The following table presents Adjusted EBITDA by reportable segment for the periods indicated:
Capital Expenditures
Capital expenditures totaled $19.1 million in the fourth quarter of 2025, inclusive of maintenance capital expenditures of $4.0 million. Capital expenditures in the fourth quarter of 2025 were primarily related to pad connections in the Rockies and Mid-Con segments.
2026 Guidance
SMC is releasing guidance for 2026, which is summarized in the table below. These projections are subject to risks and uncertainties as described in the “Forward-Looking Statements” section at the end of this release.
SMC’s guidance range is anchored by recent drilling and completion schedules provided by its customers and is reflective of the current commodity price environment. The Company’s approach to its 2026 guidance is consistent with the framework used for its 2025 guidance range. If SMC’s producer customers hit their production targets and timing of planned well connects, the Company would expect to be near the high end of the 2026 guidance range. The midpoint of the guidance range reflects a conservative, yet appropriate, level of risking to the most recent drill schedules and volume forecasts provided by its customers. The low end of the guidance range reflects additional delays to customer drilling and completion schedules and planned well connects.
SMC expects approximately 116 to 126 well connections in 2026. Of the expected well connections in 2026, approximately 20% are natural gas-oriented wells and approximately 80% are crude oil-oriented wells. Customers are currently running seven rigs behind SMC systems, with approximately 90 DUCs, providing line of sight to the 2026 estimated well connections and associated volume growth.
SMC expects its natural gas gathering system throughput to range from 875 MMcf/d to 920 MMcf/d. Double E existing take-or-pay contracts of 1,115 MMcf/d is expected to increase to 1,285 MMcf/d when the Producers Midstream II and other projects are placed into service, as early as the fourth quarter of 2026. Liquids volumes are expected to range from 65 Mbbl/d to 90 Mbbl/d.
The guidance outlook also reflects a reduction in MVC shortfall payments in the Piceance from $16.9 million in 2025 to approximately $13.0 million in 2026, and excludes approximately $2 million of deferred revenue that benefited 2025 results.
The midpoint of the guidance range assumes strip commodity prices as of February 19, 2026, implying an average 2026 Henry Hub price of approximately $3.40 per MMBtu and WTI of approximately $64 per barrel.
Adjusted EBITDA is expected to range from $225 million to $265 million. SMC’s 2026 capital expenditure guidance of $50 million to $70 million, excluding Double E, includes capital reimbursements related to specific development projects with certain customers. The Company’s full year 2026 growth capex guidance range is primarily related to new pad connections in the Rockies and Mid-Con segments. Included in this range is approximately $15 million to $20 million of maintenance capex. Double E capital expenditures for 2026 are expected to be approximately $35 million, net to SMC, primarily related to a new plant connection and downstream connections associated with the recently announced shipper contracts.
Capital & Liquidity
As of December 31, 2025, SMC had $9.3 million in unrestricted cash on hand and $113 million drawn under its $500 million ABL Revolver with $386 million of borrowing availability, after accounting for $0.8 million of issued, but undrawn letters of credit. As of December 31, 2025, SMC’s gross availability based on the borrowing base calculation in the credit agreement was $810 million, which is $310 million greater than the $500 million of lender commitments to the ABL Revolver. As of December 31, 2025, SMC was in compliance with all financial covenants, including interest coverage of 2.7x relative to a minimum interest coverage covenant of 2.0x and first lien leverage ratio of 0.5x relative to a maximum first lien leverage ratio of 2.5x. As of December 31, 2025, SMC reported a total leverage ratio of approximately 4.1x, excluding the potential earnout liability in connection with the Tall Oak Acquisition.
As of January 2, 2026, the Permian Transmission Credit Facility balance was $112.7 million a reduction of $4.3 million relative to the September 30, 2025 balance of $117.0 million due to scheduled mandatory amortization. Summit Midstream Permian has $3.8 million of cash-on-hand as of January 2, 2026.
Subsequent to quarter-end, Summit Permian Transmission, LLC entered into a new $440 million senior secured term facility, which includes a $50 million committed accordion feature and a $50 million uncommitted accordion feature (the “Term Facility”) maturing in March 2031. Proceeds from the Term Facility were used to refinance Summit Permian Transmission’s existing credit facility, Summit Permian Transmission Holdco’s preferred units, fund an $85 million restricted payment to SMC, provide liquidity to fund SMC’s share of capital expenditures including those associated with the recently announced expansion projects, and pay other fees and expenses.
MVC Shortfall Payments
SMC billed its customers $4.3 million in the fourth quarter of 2025 related to MVC shortfalls. For those customers that do not have MVC shortfall credit banking mechanisms in their gathering agreements, the MVC shortfall payments are accounted for as gathering revenue in the period in which they are earned. In the fourth quarter of 2025, SMC recognized $4.3 million of gathering revenue associated with MVC shortfall payments. SMC had no adjustments to MVC shortfall payments in the fourth quarter of 2025. SMC’s MVC shortfall payment mechanisms contributed $4.3 million of total Adjusted EBITDA in the fourth quarter of 2025.
Quarterly Dividend
The Board of Directors of Summit Midstream Corporation continued to suspend cash dividends payable on the common stock for the period ended December 31, 2025. The quarterly cash dividend on the Series A Preferred Stock, for the period ended March 14, 2026, will be paid to preferred shareholders of record as of the close of business on March 2, 2026.
The Board of Directors approved the full repayment of all previously deferred Series A Preferred Stock dividends, payable on March 27, 2026 to holders of record as of the close of business on March 17, 2026.
Fourth Quarter 2025 Earnings Call Information
SMC will host a conference call at 10:00 a.m. Eastern on March 17, 2026, to discuss its quarterly operating and financial results. The call can be accessed via teleconference at the following link: Q4 2025 Summit Midstream Corporation Earnings Conference Call (https://register-conf.media-server.com/register/BI12ac80a058874aaa998fdc335346beed). Once registration is completed, participants will receive a dial-in number along with a personalized PIN to access the call. While not required, it is recommended that participants join 10 minutes prior to the event start. The conference call, live webcast and archive of the call can be accessed through the Investors section of SMC’s website at www.summitmidstream.com.
Use of Non-GAAP Financial Measures
We report financial results in accordance with U.S. generally accepted accounting principles (“GAAP”). We also present Adjusted EBITDA, Segment Adjusted EBITDA, Distributable Cash Flow, and Free Cash Flow, non-GAAP financial measures.
Adjusted EBITDA
We define Adjusted EBITDA as net income or loss, plus interest expense, income tax expense, depreciation and amortization, our Proportional Adjusted EBITDA for equity method investees, adjustments related to MVC shortfall payments, adjustments related to capital reimbursement activity, unit-based and noncash compensation, impairments, items of income or loss that we characterize as unrepresentative of our ongoing operations and other noncash expenses or losses, income tax benefit, income (loss) from equity method investees and other noncash income or gains. Because Adjusted EBITDA may be defined differently by other entities in our industry, our definition of this non-GAAP financial measure may not be comparable to similarly titled measures of other entities, thereby diminishing its utility.
Management uses Adjusted EBITDA in making financial, operating and planning decisions and in evaluating our financial performance. Furthermore, management believes that Adjusted EBITDA may provide external users of our financial statements, such as investors, commercial banks, research analysts and others, with additional meaningful comparisons between current results and results of prior periods as they are expected to be reflective of our core ongoing business.
Adjusted EBITDA is used as a supplemental financial measure to assess:
the ability of our assets to generate cash sufficient to make future potential cash dividends and support our indebtedness;
the financial performance of our assets without regard to financing methods, capital structure or historical cost basis;
our operating performance and return on capital as compared to those of other entities in the midstream energy sector, without regard to financing or capital structure;
the attractiveness of capital projects and acquisitions and the overall rates of return on alternative investment opportunities; and
the financial performance of our assets without regard to (i) income or loss from equity method investees, (ii) the impact of the timing of MVC shortfall payments under our gathering agreements or (iii) the timing of impairments or other income or expense items that we characterize as unrepresentative of our ongoing operations.
Adjusted EBITDA has limitations as an analytical tool and investors should not consider it in isolation or as a substitute for analysis of our results as reported under GAAP. For example:
certain items excluded from Adjusted EBITDA are significant components in understanding and assessing an entity’s financial performance, such as an entity’s cost of capital and tax structure;
Adjusted EBITDA does not reflect our cash expenditures or future requirements for capital expenditures or contractual commitments;
Adjusted EBITDA does not reflect changes in, or cash requirements for, our working capital needs; and
although depreciation and amortization are noncash charges, the assets being depreciated and amortized will often have to be replaced in the future, and Adjusted EBITDA does not reflect any cash requirements for such replacements.
We compensate for the limitations of Adjusted EBITDA as an analytical tool by reviewing the comparable GAAP financial measures, understanding the differences between the financial measures and incorporating these data points into our decision-making process.
We define Segment Adjusted EBITDA as total revenues less total costs and expenses; plus (i) other income excluding interest income, (ii) our proportional adjusted EBITDA for equity method investees, (iii) depreciation and amortization, (iv) adjustments related to MVC shortfall payments, (v) adjustments related to capital reimbursement activity, (vi) stock-based and noncash compensation, (vii) impairments and (viii) other noncash expenses or losses, less other noncash income or gains. We define Proportional Adjusted EBITDA for our equity method investees as the product of (i) total revenues less total expenses, excluding impairments and other noncash income or expense items and (ii) amortization for deferred contract costs; multiplied by our ownership interest during the respective period.
Distributable Cash Flow
We define Distributable Cash Flow as Adjusted EBITDA, as defined above, less cash interest paid, cash paid for taxes, net interest expense accrued and paid on the senior notes, and maintenance capital expenditures.
Free Cash Flow
We define free cash flow as distributable cash flow attributable to common and preferred shareholders less growth capital expenditures, less investments in equity method investees, less dividends to common and preferred shareholders. Free cash flow excludes proceeds from asset sales and cash consideration paid for acquisitions.
We do not provide the GAAP financial measures of net income or loss or net cash provided by operating activities on a forward-looking basis because we are unable to predict, without unreasonable effort, certain components thereof including, but not limited to, (i) income or loss from equity method investees and (ii) asset impairments. These items are inherently uncertain and depend on various factors, many of which are beyond our control. As such, any associated estimate and its impact on our GAAP performance and cash flow measures could vary materially based on a variety of acceptable management assumptions.
About Summit Midstream Corporation
SMC is a value-driven corporation focused on developing, owning and operating midstream energy infrastructure assets that are strategically located in the core producing areas of unconventional resource basins, primarily shale formations, in the continental United States. SMC provides natural gas, crude oil and produced water gathering, processing and transportation services pursuant to primarily long-term, fee-based agreements with customers and counterparties in five unconventional resource basins: (i) the Williston Basin, which includes the Bakken and Three Forks shale formations in North Dakota; (ii) the Denver-Julesburg Basin, which includes the Niobrara and Codell shale formations in Colorado and Wyoming; (iii) the Fort Worth Basin, which includes the Barnett Shale formation in Texas; (iv) the Arkoma Basin, which includes the Woodford and Caney shale formations in Oklahoma; and (v) the Piceance Basin, which includes the Mesaverde formation as well as the Mancos and Niobrara shale formations in Colorado. SMC has an equity method investment in Double E Pipeline, LLC, which provides interstate natural gas transportation service from multiple receipt points in the Delaware Basin to various delivery points in and around the Waha Hub in Texas. SMC is headquartered in Houston, Texas.
Forward-Looking Statements
This press release includes certain statements concerning expectations for the future that are forward-looking within the meaning of the federal securities laws. Forward-looking statements include, without limitation, any statement that may project, indicate or imply future results, events, performance or achievements and may contain the words “expect,” “intend,” “plan,” “anticipate,” “estimate,” “believe,” “will be,” “will continue,” “will likely result,” and similar expressions, or future conditional verbs such as “may,” “will,” “should,” “would” and “could.” In addition, any statement concerning future financial performance (including future revenues, earnings or growth rates), payment of dividends on any series of stock, ongoing business strategies and possible actions taken by SMC or its subsidiaries are also forward-looking statements. Forward-looking statements also contain known and unknown risks and uncertainties (many of which are difficult to predict and beyond management’s control) that may cause SMC’s actual results in future periods to differ materially from anticipated or projected results. An extensive list of specific material risks and uncertainties affecting SMC is contained in its 2025 Annual Report on Form 10-K filed with the Securities and Exchange Commission (the “SEC”) on March 16, 2026, as amended and updated from time to time. Any forward-looking statements in this press release are made as of the date of this press release and SMC undertakes no obligation to update or revise any forward-looking statements to reflect new information or events.
Saguenay, Québec–(Newsfile Corp. – March 16, 2026) – First Phosphate Corp. (CSE: PHOS) (OTCQX: FRSPF) (OTCQX ADR: FPHOY) (FSE: KD0) (“First Phosphate” or the “Company“) is pleased to announce that it has finalized an agreement, on March 4, 2026, for a $16.7 million non-repayable contribution from the Government of Canada through Natural Resources Canada (“NRCan”) Global Partnerships Initiative (“GPI”).
This contribution funding will accelerate the development of the phosphate project in Bégin-Lamarche by developing the technical and engineering parameters – including processing circuits and equipment – needed to validate the ability to produce a phosphate concentrate that meets the quality requirements of the lithium iron phosphate (“LFP”) battery market. The work will be conducted based on the parameters established under the contract between First Phosphate and its definitive offtaker.
“Canada and our partners are putting real capital behind the secure and resilient critical mineral supply chains that our economies and defence industries rely on,” said The Honourable Tim Hodgson, Minister of Energy and Natural Resources. “By supporting companies like First Phosphate, we are helping deliver the minerals the world needs and the prosperity and security Canadians deserve.”
“We welcome this investment from the Government of Canada which supports the continued progress of our project and its strategic role in the LFP battery supply chain,” said John Passalacqua, CEO of First Phosphate. “Together, we are taking another step toward establishing an integrated phosphate-based LFP battery supply chain in Canada.”
The Bégin-Lamarche demonstration and feasibility project will help strengthen Canada’s strategic positioning within the LFP battery value chain through the development of domestic capacity to process apatite (phosphate concentrate) into high-purity phosphoric acid (“PPA”) for battery applications.
The project will develop a scalable Canadian process for the production of battery-grade phosphate concentrate, reducing dependence on foreign supply chains.
The project will generate significant economic benefits, including the creation of approximately 277 skilled jobs and the potential establishment of a Canadian phosphoric acid facility supported by local commercial production of phosphate concentrate.
The financial contribution is granted for the completion of a feasibility study of the Company’s integrated Bégin-Lamarche phosphate mine and processing project in Saguenay-Lac-Saint-Jean and covers eligible activities planned through 2028, in accordance with the terms of the agreement.
The scientific and technical disclosure for First Phosphate included in this news release has been reviewed and approved by Gilles Laverdière, P.Geo. Mr. Laverdière is Chief Geologist of First Phosphate and a Qualified Person under National Instrument 43-101 – Standards of Disclosure of Mineral Projects (“NI 43-101”).
About Natural Resources Canada
Natural Resources Canada (“NRCan”) is the federal department responsible for developing policies and programs to ensure the sustainable and responsible development of Canada’s natural resources. Through its initiatives and funding programs, including the Global Partnerships Initiative, NRCan supports projects that contribute to strengthening supply chains, industrial innovation, and Canada’s competitiveness in the critical and strategic minerals sectors.
About First Phosphate Corp
First Phosphate (CSE: PHOS) (OTCQX: FRSPF) (OTCQX ADR: FPHOY) (FSE: KD0) is a mineral exploration and development and clean technology company dedicated to building and reshoring a vertically integrated mine-to-market supply chain for the production of LFP batteries in North America. Target markets include energy storage, data centers, robotics, mobility, and national security.
First Phosphate’s flagship Bégin-Lamarche property, located in Saguenay-Lac-Saint-Jean, Québec, Canada, represents a rare North American igneous phosphate resource producing high-purity phosphate characterized by very low levels of impurities.
Forward-Looking Information and Cautionary Statements
This release includes certain statements that may be deemed “forward-looking information”. Any statement that discusses predictions, expectations, beliefs, plans, projections, objectives, assumptions, future events or performance (often but not always using phrases such as “expects”, or “does not expect”, “is expected”, “anticipates” or “does not anticipate”, “plans”, “budget”, “scheduled”, “forecasts”, “estimates”, “believes” or “intends” or variations of such words and phrases or stating that certain actions, events or results “may” or “could”, “would”, “might” or “will” be taken to occur or be achieved) are not statements of historical fact and may be forward-looking information. In particular, this press release contains forward-looking information relating to, among other things: the Company’s compliance with the terms of the definitive agreement; the funding amount, anticipated benefits, timing, and potential outcomes of the GPI funding award under the contribution agreement with NRCan and the project funded thereby including, but not limited to, the strengthening of Canada’s strategic positioning within the LFP battery value chain, the development of domestic capacity to process apatite into high-purity PPA for battery applications, the development of a scalable Canadian process for the production of battery-grade phosphate concentrate, the reduction of dependence on foreign supply chains, and the contribution to significant economic benefits, including the creation of skilled jobs and the potential establishment of a Canadian phosphoric acid facility; and the Company’s plans for building and onshoring a vertically integrated mine-to-market LFP battery supply chain for North America. Although the Company believes the expectations expressed in such forward-looking statements are based on reasonable assumptions, such statements are not guarantees of future performance and actual results or developments may differ materially from those forward-looking statements. Factors that could cause actual results to differ materially from those in forward-looking statements include development and exploration successes, continued availability of capital and financing, and general economic, market or business conditions. These statements are based on a number of assumptions including, among other things, assumptions regarding general business and economic conditions; there being no significant disruptions affecting the activities of the Company or inability to access required project inputs; permitting and development of the projects being consistent with the Company’s expectations; the accuracy of the current mineral resource estimates for the Company and results of metallurgical testing; certain price assumptions for P2O5 and Fe2O3; inflation and prices for Company project inputs being approximately consistent with anticipated levels; the Company’s relationship with First Nations and other Indigenous parties remaining consistent with the Company’s expectations; the Company’s relationship with other third party partners and suppliers remaining consistent with the Company’s expectations; and government relations and actions being consistent with Company expectations. Investors are cautioned that any such statements are not guarantees of future performance and actual results or developments may differ materially from those projected in the forward-looking statements. Accordingly, readers should not place undue reliance on the forward-looking information contained in this press release. The Company does not assume any obligation to update or revise its forward-looking statements, whether because of new information, future events or otherwise, except as required by applicable law. All forward-looking information contained in this release is qualified by these cautionary statements.
Gold is heading into the weekend with back-to-back weekly losses — a signal that something unusual is happening in commodity markets. The metal that investors typically rush to during geopolitical crises is being undercut by the very crisis driving its usual tailwinds.
Spot gold is trading around $5,084 per ounce on Friday, down nearly 1% from Thursday’s close and on pace for a 2.4% weekly decline. That would mark the first consecutive weekly drop since November, pulling gold further from its all-time high of $5,595 set on January 29. Despite the retreat, the metal remains roughly 17% higher year-to-date — a figure that should not be lost on investors trying to contextualize the current pullback.
The Oil-Inflation Paradox
The culprit is crude. Oil prices near $100 a barrel — sustained by the ongoing US-Israeli military campaign against Iran — are creating an inflation feedback loop that is actually working against gold in the near term. Here’s the mechanism: rising oil strengthens the U.S. dollar, since the U.S. is a net energy exporter. A stronger dollar makes dollar-denominated gold more expensive for global buyers, compressing demand. At the same time, oil-driven inflation is forcing markets to price out Federal Reserve rate cuts, and gold doesn’t pay interest — so higher-for-longer rates make yield-bearing assets comparatively more attractive.
The U.S. Dollar Index has gained about 1% over the past five trading sessions and is up 3.3% over the past month. That’s a meaningful headwind for bullion.
Fed Watch Dominates
Markets now assign just a 4.4% probability to a rate cut at next week’s Fed meeting, with 95.6% of participants expecting rates to hold at 3.50%–3.75%. Earlier this year, the consensus expectation was two cuts in 2026. That view has collapsed as energy prices reignite inflationary pressure — and fresh consumer spending data released Friday showed spending barely moved in January, adding to concerns that a stagflationary dynamic could be forming ahead of the conflict’s economic ripple effects.
U.S. consumer sentiment has also declined to a three-month low as gasoline prices climb. This matters for the Fed: a consumer-led slowdown paired with sticky inflation removes the policy flexibility that gold bulls were counting on.
Where Does Gold Go From Here?
The longer-term picture remains constructive. Wall Street’s major banks haven’t flinched — J.P. Morgan holds a $6,300 price target for gold in 2026, and Deutsche Bank is at $6,000. Central bank buying, persistent inflation above the Fed’s 2% target, and geopolitical uncertainty all underpin a structurally bullish case. The current weakness appears to be a recalibration, not a reversal.
For small and microcap investors, the gold pullback carries downstream implications worth watching. Junior miners and gold royalty companies — many of which trade well below the $2 billion market cap threshold — tend to amplify gold’s moves in both directions. A sustained drop from current levels would compress margins and valuations across that segment. Conversely, if conflict escalation or a dollar reversal sends gold back toward $5,500, smaller producers could see outsized recoveries.
The market is being asked a simple question right now: is $100 oil a headwind or a catalyst for gold? The answer, at least this week, is headwind.
For years, the market’s story was simple — go big or go home. Mega-cap tech dominated headlines, attracted institutional capital, and left small and microcap stocks largely in the dust. That story has been changing fast in 2026. The question now is whether a war in the Middle East derails it before it fully plays out— and for investors focused on small cap investing in 2026, the answer may be more encouraging than the headlines suggest..
As of this week, the Russell 2000 is up nearly 9% year-to-date, outpacing both the S&P 500 and Nasdaq 100, which have delivered near-flat performance over the same period. The drivers behind that move are real and structural. But so is the new risk sitting squarely on top of them.
Why the Russell 2000 Is Outperforming in 2026
Small and microcap companies carry a disproportionately high share of floating-rate debt — roughly 40% of Russell 2000 company debt is floating-rate, compared to under 10% for S&P 500 constituents. When the Federal Reserve delivered three rate cuts in late 2025, bringing the target rate to 3.50%–3.75%, the impact on smaller companies was immediate. Borrowing costs dropped, profit margins expanded, and balance sheets that had been under pressure for two years began to breathe again.
Layered on top of that was the One Big Beautiful Bill Act, which brought its most consequential provisions — 100% bonus depreciation and immediate domestic R&D expensing — online on January 1, 2026. These provisions disproportionately benefit the capital-intensive businesses that populate the small and microcap universe. Add a valuation gap that had stretched to near-historic levels, with the Russell 2000 trading below 19 times forward earnings against the S&P 500’s 24 times, and institutional money had every reason to rotate into small caps in 2026.
How Oil Prices Are Affecting Small Cap Stocks Right Now
The U.S.-Israeli strikes on Iran that began February 28 changed the calculus. Oil prices have surged past $100 per barrel for the first time since 2022, with Brent crude briefly trading near $120 before pulling back. Shipping through the Strait of Hormuz dropped 95% in the first week of March, effectively cutting off roughly one-fifth of global oil supply. U.S. gasoline prices have risen more than 17% since the strikes began, and stagflation fears — an economy slowing while prices rise — are back in the conversation.
For small cap investing in 2026, this is not a peripheral concern. The rotation thesis rests on the Fed continuing to ease. If an energy-driven inflation spike freezes the Fed in its tracks, the highly leveraged firms within the Russell 2000 face a double hit of higher borrowing costs and slowing consumer demand. That dynamic already showed up on March 5, when the Russell 2000 dropped 1.9% in a single session — its sharpest single-day decline of the year — as the conflict escalated.
Why the Small Cap Rotation Thesis in 2026 Still Has Legs
There is a meaningful counterargument, and it lives inside the small-cap universe itself. Domestic energy producers, onshoring plays, and infrastructure-adjacent companies are direct beneficiaries of elevated oil prices and supply chain disruption. The small cap industrials and energy names that helped fuel the early-year rotation are not going away — they may actually accelerate as capital seeks shelter in domestic, tangible-earnings businesses over global tech exposure.
The U.S. is a net exporter of energy, which positions it to weather the supply disruption better than Europe and Asia — a dynamic that benefits domestically focused small-cap energy producers more than it hurts them.
What This Means for Small Cap Investing in 2026
The structural case for small cap stocks in 2026 has not fundamentally changed. Lower rates, favorable tax treatment, and compressed valuations relative to large caps all remain intact. What has changed is the risk profile of getting there. A prolonged conflict, sustained triple-digit oil prices, and a Fed forced to pause its easing cycle could extend the timeline — but not reverse the direction.
The companies best positioned in this environment are those with domestic revenue exposure, manageable fixed-rate debt, and real earnings — not the leveraged, speculative names that hitched a ride on the rotation. In microcap investing, that distinction between quality and speculation has rarely mattered more than it does right now.
The great rotation into small cap stocks is still in play. Investors who understand what is driving it — and what the real risks are — are the ones best positioned to capitalize on it in 2026.
Power Metallic is a Canadian exploration company focused on advancing the Nisk Project Area (Nisk–Lion–Tiger)—a high–grade Copper–PGE, Nickel, gold and silver system—toward Canada’s next polymetallic mine. On 1 February 2021, Power Metallic (then Chilean Metals) secured an option to earn up to 80% of the Nisk project from Critical Elements Lithium Corp. (TSX–V: CRE). Following the June 2025 purchase of 313 adjoining claims (~167 km²) from Li–FT Power, the Company now controls ~212.86 km² and roughly 50 km of prospective basin margins. Power Metallic is expanding mineralization at the Nisk and Lion discovery zones, evaluating the Tiger target, and exploring the enlarged land package through successive drill programs. Beyond the Nisk Project Area, Power Metallic indirectly has an interest in significant land packages in British Columbia and Chile, by its 50% share ownership position in Chilean Metals Inc., which were spun out from Power Metallic via a plan of arrangement on February 3, 2025. It also owns 100% of Power Metallic Arabia which owns 100% interest in the Jabul Baudan exploration license in The Kingdon of Saudi Arabia’s JabalSaid Belt. The property encompasses over 200 square kilometres in an area recognized for its high prospectivity for copper gold and zinc mineralization. The region is known for its massive volcanic sulfide (VMS) deposits, including the world-class Jabal Sayid mine and the promising Umm and Damad deposit.
Mark Reichman, Managing Director, Equity Research Analyst, Natural Resources, Noble Capital Markets, Inc.
Hans Baldau, Associate Analyst, Noble Capital Markets, Inc.
Refer to the full report for the price target, fundamental analysis, and rating.
Best copper intercept to date. Power Metallic reported results from the first hole of the 2026 winter drill campaign. Hole PML-26-049 intersected 16.55 meters grading 10.08% copper (15.11% CuEq) within massive to brecciated copper sulphides, representing the strongest copper intersection reported at the Lion Zone to date. The hole was drilled to support interpretation of near-surface mineralization and to expand the deposit’s footprint in an area that management believes may be amenable to open-pit extraction.
Infill drilling is supportive. Results from holes PML-26-049 and PML-25-047 confirm strong grade continuity within the modeled Lion Zone geometry, improving confidence that portions of the deposit may ultimately support Indicated Resource classification. Deeper drilling has also expanded high-grade lenses within the system, including 7.60 meters grading 7.30% CuEq within an 18.0-meter interval grading 3.18% CuEq, further extending mineralization within the Lion zone.
Equity Research is available at no cost to Registered users of Channelchek. Not a Member? Click ‘Join’ to join the Channelchek Community. There is no cost to register, and we never collect credit card information.
This Research is provided by Noble Capital Markets, Inc., a FINRA and S.E.C. registered broker-dealer (B/D).
*Analyst certification and important disclosures included in the full report. NOTE: investment decisions should not be based upon the content of this research summary. Proper due diligence is required before making any investment decision.
TORONTO, March 10, 2026 /CNW/ – Power Metallic Mines Inc. (the “Company” or “Power Metallic”) (TSXV: PNPN) (OTCBB: PNPNF) (Frankfurt: IVV1) is pleased to provide a release of assays from its fall 2025 drill program and the first hole of the Winter 2026 campaign.
Lion MRE In-fill program
Figure 1 – Lion Drill holes reported in this news release (CNW Group/Power Metallic Mines Inc.)
Drilling continued to define the high-grade Lion Zone in preparation for a 2026 Mineral Resource Estimate (MRE). The infill drilling on the Lion zone has shown that the interpreted zone geometry has high repeatability raising the confidence level for future mineral resource estimates to an Indicated Resource classification. Internally the Lion Zone drilling continues to surprise with very high-grade holes (Table 1). Hole PML-26-049, the first hole of the 2026 winter drill campaign, was drilled to support the modelled interpretation of the Lion zone near surface. It resulted in the best copper intersection to date on the Lion Zone, intersecting massive to brecciated Cu sulphides over 16.55m @ 10.08% Cu (15.11% CuEqRec1). This hole greatly expands the zone near surface that may be amenable to early open pit extraction in a possible future mining operation.
“Another very impressive set of results from the Lion Zone. The market certainly has not fully appreciated just how productive this discovery has become. Despite current analyst estimates, the very high metallurgical recoveries, and the ongoing high-grade assays at Lion, Power Metallic is still heavily discounted vis-a-vis our peers. To change this we will continue to deliver excellent results leading to a near term PEA, and keep communicating our positive message about the value and potential of our high-grade copper and precious metals discovery,” commented Power Metallic CEO Terry Lynch
Coupled with PML-26-049, hole PML-25-047 also intersected the Lion Zone 100m west of PML-26-049 and confirmed the high-grade copper zone with 4.16m @ 4,15% Cu (6.80% CuEqRec1), adding further support to the near surface potential mineralization.
Deeper in the deposit hole PML-26-043 added 7.60m @ 7.30%CuEqRec1 within 18.00m of 3.18%CuEqRec1, expanding the deeper high-grade lode on the west side of the Lion deposit.
Work continues to define and expand the strike and dip extents of the Lion Zone. The last hole of 2025 (PML-25-048) was designed to test the eastern side of the Lion Zone where previous drilling had indicated a narrowing of the zone. In contrast PML-25-048 returned a wide intersection of lower grade polymetallic mineralization (15.5m @ 0.89% CuEqRec1), including 4.50m of 1.44% CuEqRec1. This hole supports the recent interpretation of shallow easterly plunging trends within the Lion zone (see news release March 3, 2026) that will require further follow-up drilling.
Exploratory Drilling – Lion West and Lion East
Work continued exploring for additional zones of mineralization outside of the Lion Zone. Two holes were drilled 500m west of Lion (PML-25-037 and 044) targeting an airborne EM anomaly. Both holes intersected the target horizon, including thick ultramafic rocks with hints of Lion style mineralization structurally above it (see Table 1). Both holes returned narrow and modest grade that wouldn’t have been sufficient material to generate the original airborne EM anomaly. BHEM was conducted on both holes to direct further exploratory drilling. The presence of the mineralizing horizon, with the occurrence of Lion style mineralization continues to support the potential of another Lion style deposit in this area.
Holes PML-25-035 and 038 were exploration holes drilled 700m and 250m east of Lion respectively. As with the Lion West exploration drilling, these holes went through the Lion horizon into ultramafic rocks. Hole PML-25-035 had narrow zones of anomalous palladium, and hole PML-25-038 had one narrow zone of Lion style mineralization (see Table 1). BHEM will help direct further drilling in this promising area, which has indications of not only Lion style mineralization, but hints of a larger Ni-Cu deposit type deeper in this area.
Table 1 – Lion Zone Intersections reported in this News Release
CuEqRec represents CuEq calculated based on the following metal prices (USD) : 2,360.15 $/oz Au, 27.98 $/oz Ag, 1,215.00 $/oz Pd, 1000.00 $/oz Pt, 4.00 $/lb Cu, 10.00 $/lb Ni and 22.50 $/lb Co., and recovered grades based on recent locked-cycle metallurgical recoveries by SGS Canada Inc (see press release Jan 21, 2006).
Podcast Join Power Metallic CEO Terry Lynch, VP Exploration Joseph Campbell and Board Member Doctor Steve Beresford on Thursday March 12 at10:00 am EST as they discuss recent results and the ongoing exploration program.
Joseph Campbell, P.Geo, VP Exploration at Power Metallic, is the qualified person who has reviewed and approved the technical disclosure contained in this news release.
About Power Metallic Mines Inc.
Power Metallic is a Canadian exploration company focused on advancing the Nisk Project Area (Nisk–Lion–Tiger)–a high–grade Copper–PGE, Nickel, gold and silver system–toward Canada’s next polymetallic mine.
On 1 February 2021, Power Metallic (then Chilean Metals) secured an option to earn up to 80% of the Nisk project from Critical Elements Lithium Corp. (TSX–V: CRE). Following the June 2025 purchase of 313 adjoining claims (~167 km²) from Li–FT Power, the Company now controls ~330 km² and roughly 50 km of prospective basin margins.
Power Metallic is expanding mineralization at the Nisk and Lion discovery zones, evaluating the Tiger target, and exploring the enlarged land package through successive drill programs.
Beyond the Nisk Project Area, Power Metallic indirectly has an interest in significant land packages in British Columbia and Chile, by its 50% share ownership position in Chilean Metals Inc., which were spun out from Power Metallic via a plan of arrangement on February 3, 2025.
It also owns 100% of Power Metallic Arabia which owns 100% interest in the JabulBaudan exploration license in The Kingdon of Saudi Arabia’s JabalSaid Belt. The property encompasses over 200 square kilometres in an area recognized for its high prospectivity for copper gold and zinc mineralization. The region is known for its massive volcanic sulfide (VMS) deposits, including the world-class Jabal Sayid mine and the promising Umm and Damad deposit.
For further information, readers are encouraged to contact: Power Metallic Mines Inc. The Canadian Venture Building 82 Richmond St East, Suite 202 Toronto, ON
Neither the TSX Venture Exchange nor its Regulation Services Provider accepts responsibility for the adequacy or accuracy of this release.
QAQC and Sampling
GeoVector Management Inc (“GeoVector”) is the Consulting company retained to perform the actual drilling program, which includes core logging and sampling of the drill core.
All core in this news release is NQ sized core. Drill core is re-fitted and measured. Geotech on core includes photographs (wet & dry), rock quality index, magnetic susceptibility, conductivity, and recovery estimates. Core is logged for lithology, mineralogy, and structural features, and sample intervals are delineated and tagged.
Sampled core is mechanically sawn, and half-core is retained for future reference. GeoVector’s QAQC program includes regular insertion of CRM standards, duplicates, and blanks into the sample stream with a stringent review of all results. QAQC and data validation was performed, and no material errors were observed.
All samples were submitted to and analyzed at Activation Laboratories Ltd (“Actlabs”), a commercial laboratory independent of Power Metallic with no interest in the Project. Actlabs is an ISO 9001 and 17025 certified and accredited laboratories. Samples submitted through Actlabs are run through standard preparation methods and analysed using RX-1 (Dry, crush (< 7 kg) up to 80% passing 2 mm, riffle split (250 g) and pulverize (mild steel) to 95% passing 105 μm) preparation methods, and using 1F2 (ICP-OES) and 1C-OES – 4-Acid near total digestion + Gold-Platinum-Palladium analysis and 8-Peroxide ICP-OES, for regular and over detection limit analysis. Pegmatite samples are analyzed using UT7 – Li up to 5%, Rb up to 2% method. Actlabs also undertake their own internal coarse and pulp duplicate analysis to ensure proper sample preparation and equipment calibration.
This message contains certain statements that may be deemed “forward-looking statements” concerning the Company within the meaning of applicable securities laws. Forward-looking statements are statements that are not historical facts and are generally, but not always, identified by the words “expects,” “plans,” “anticipates,” “believes,” “intends,” “estimates,” “projects,” “potential,” “indicates,” “opportunity,” “possible” and similar expressions, or that events or conditions “will,” “would,” “may,” “could” or “should” occur. Although the Company believes the expectations expressed in such forward-looking statements are based on reasonable assumptions, such statements are not guarantees of future performance, are subject to risks and uncertainties, and actual results or realities may differ materially from those in the forward-looking statements. Such material risks and uncertainties include, but are not limited to, among others; the timing for various drilling plans; the ability to raise sufficient capital to fund its obligations under its property agreements going forward and conduct drilling and exploration; to maintain its mineral tenures and concessions in good standing; to explore and develop its projects; changes in economic conditions or financial markets; the inherent hazards associates with mineral exploration and mining operations; future prices of nickel and other metals; changes in general economic conditions; accuracy of mineral resource and reserve estimates; the potential for new discoveries; the ability of the Company to obtain the necessary permits and consents required to explore, drill and develop the projects and if accepted, to obtain such licenses and approvals in a timely fashion relative to the Company’s plans and business objectives for the applicable project; the general ability of the Company to monetize its mineral resources; and changes in environmental and other laws or regulations that could have an impact on the Company’s operations, compliance with environmental laws and regulations, dependence on key management personnel and general competition in the mining industry.
SOURCE Power Metallic Mines Inc.
For further information on Power Metallic Mines Inc., please contact: Duncan Roy, VP Investor Relations, 416-580-3862, duncan@powermetallic.com
Global oil markets have entered a new period of volatility as geopolitical tensions in the Middle East push crude prices sharply higher. Brent crude surged past $100 per barrel on Monday, briefly nearing $120 before easing, as disruptions to tanker traffic through the Strait of Hormuz threaten one of the world’s most critical energy supply routes.
The price spike follows escalating military conflict involving Iran, the United States, and Israel. The Strait of Hormuz — a narrow maritime corridor that typically carries about one-fifth of global oil shipments — has effectively halted most tanker traffic amid security threats and heightened military activity. With oil unable to move freely from the region, supply constraints are rapidly tightening global markets.
Producers across the Middle East are already responding to the bottleneck. Saudi Arabia has begun cutting production as storage facilities fill up due to limited export capacity. Neighboring producers including the United Arab Emirates, Kuwait, and Iraq have taken similar steps, reducing output as crude inventories accumulate while export routes remain restricted.
Analysts warn the supply impact could intensify if the disruption continues. JPMorgan estimates Middle Eastern production shut-ins could exceed four million barrels per day within weeks if the closure persists. The region accounts for roughly one-third of global oil output, making any sustained disruption highly significant for energy markets.
While producers attempt to redirect shipments through alternative routes, options remain limited. Saudi Arabia has increased shipments through pipelines to its Red Sea port of Yanbu, but the infrastructure cannot fully replace volumes normally transported through Hormuz.
The resulting supply uncertainty has sent shockwaves across energy markets. Diesel prices have surged alongside crude, with European gasoil futures climbing above $170 per barrel. Several governments are already weighing intervention measures. China has reportedly instructed major refiners to suspend gasoline and diesel exports, while South Korea is reviewing whether to implement an oil price cap for the first time in three decades.
Consumers are beginning to feel the impact. In the United States, gasoline prices have climbed nearly $0.50 per gallon in just one week, reaching a national average of roughly $3.47 per gallon, according to AAA. Analysts estimate prices could approach $4 per gallon within the next month if crude oil remains elevated.
The relationship between crude and retail fuel costs is direct. Industry estimates suggest every $10 increase in oil prices typically adds about $0.25 per gallon at the pump. With crude rising more than $20 in recent days, the upward pressure on gasoline prices is already visible.
Diesel costs are climbing even faster, with national averages approaching $4.66 per gallon. Because diesel powers the majority of freight transportation in the U.S., higher fuel prices could ripple through the broader economy by increasing the cost of moving goods. That dynamic often translates into higher prices for groceries, clothing, and construction materials.
Economists are also warning that the surge in energy prices could complicate the broader economic outlook. Rising fuel costs combined with slowing growth indicators have revived concerns about stagflation — a scenario where inflation accelerates even as economic activity weakens.
For now, markets remain focused on the duration of the Strait of Hormuz disruption. The longer shipping remains constrained, the more global inventories may tighten, potentially forcing prices higher until demand adjusts or supply routes reopen.
VANCOUVER, B.C., March 9, 2026, – Nicola Mining Inc. (the “Company” or “Nicola”) (TSX.V: NIM) (OTCQB: HUSIF) (FSE: HLIA) is pleased to provide an update on its proposed NASDAQ listing, which it originally disclosed in its news release of October 27, 2025. There are approximately 220 Canadian companies trading via cross listing in the United States[1]; however, Nicola hopes to be one of the first Canadian companies to list via American Depositary Receipts(“ADRs”)[2].The rational of pioneering the structure is explained below.
Listing ADRs on NASDAQ offers foreign companies a strategic pathway to U.S. capital markets while preserving their existing capital structure on their home exchange, such as the Toronto Stock Exchange or the TSX Venture Exchange. Unlike a reverse share consolidation undertaken solely to meet minimum price thresholds, an ADR program allows a foreign company to establish an ADR-to-ordinary-share ratio that achieves the required trading price without altering the underlying share count. This structure avoids the negative market optics frequently associated with rollbacks and preserves the integrity of a foreign company’s capital structure.
Key advantages include:
No need for a reverse split: ADR ratios can be structured (e.g., 1 ADR representing multiple common shares) to achieve NASDAQ price requirements.
Preservation of capital structure: Existing shares, warrants, options and convertible instruments remain unchanged.
Improved market perception: Avoiding a rollback reduces the stigma often associated with distressed or low-priced issuers.
ADRs also provide operational and market-structure advantages by enabling dual-market liquidity and facilitating access to U.S. investors while maintaining a foreign company’s primary listing. Because ADRs are issued through a depositary bank that holds the underlying shares, a foreign company can expand its investor base without restructuring its domestic listing. This dual-trading framework allows Canadian and international investors to continue trading the ordinary common shares while U.S. investors transact in ADRs denominated in U.S. dollars. Important benefits include:
Broader investor access: U.S. institutional investors can purchase ADRs through familiar U.S. market infrastructure.
Maintenance of home-market liquidity: Trading continues on the Canadian exchange alongside the NASDAQ ADR listing.
Administrative simplicity: The ADR program is administered by a depositary bank (commonly institutions such as BNY Mellon, JPMorgan Chase, or Citibank), reducing the need for structural changes to a foreign company’s share capital.
Nicola is currently subject to review by NASDAQ under Rule IM-5101-3, a new interpretive rule adopted by NASDAQ in December 2025 that significantly expands NASDAQ’s discretionary authority to deny a company’s initial listing even if it meets all quantitative listing requirements.
Previously, companies that satisfied the formal listing requirements—such as minimum share price, market capitalization, shareholder count, and corporate governance standards— expected to receive approval to list on NASDAQ. The adoption of Rule IM-5101-3 changes this framework by allowing NASDAQ to conduct a qualitative risk assessment and reject a listing if it believes the security could be susceptible to manipulation or other market integrity risks.
Peter Espig, CEO of Nicola, stated, “Nicola, its legal team, and NASDAQ continue to work sedulously towards assuring a sound structure as we move forward with this strategic structure. We remain committed to prudently move forward in a structure beneficial to the US markets while striving for stability to our Canadian shareholders.”
About Nicola Mining
Nicola Mining Inc. is a junior mining company listed on the TSX Venture Exchange and Frankfurt Exchange that maintains a 100% owned mill and tailings facility, located near Merritt, British Columbia It has signed Mining and Milling Profit Share Agreements with high grade gold projects. Nicola’s fully permitted mill can process both gold and silver mill feed via gravity and flotation processes.
The Company owns 100% of the New Craigmont Project, a high-grade copper property, which covers an area of over 10,800 hectares along the southern end of the Guichon Batholith and is adjacent to Highland Valley Copper, Canada’s largest copper mine. The Company also owns 100% of the Treasure Mountain Property, which is a fully-permitted high grade silver mine and includes 30 mineral claims and a mineral lease, spanning an area exceeding 2,200 hectares.
Cautionary Note Regarding Forward-Looking Information
This news release contains “forward-looking statements” within the meaning of applicable securities laws. All statements, other than statements of present or historical facts, are forward-looking statements. Forward-looking statements involve known and unknown risks, uncertainties, and assumptions and accordingly, actual results could differ materially from those expressed or implied in such statements. Investors are cautioned not to place undue reliance on forward-looking statements. Forward-looking statements in this news release include, but are not limited to, statements concerning the proposed listing of ADRs on Nasdaq and the benefits from the listing of ADRs on Nasdaq.
Forward-looking statements are based upon certain assumptions and other key factors that, if untrue, could cause actual results to be materially different from future results expressed or implied by such statements. Key assumptions upon which the Company’s forward-looking information is based include, without limitation, the ability to obtain required regulatory approvals for the proposed listing of ADRs on Nasdaq. Forward-looking statements are also subject to risks and uncertainties facing the Company’s business, including, without limitation, the risk that the Company may not receive the required regulatory approvals for the proposed listing of ADRs on Nasdaq.
There can be no assurance that forward-looking statements will prove to be accurate, and even if events or results described in the forward-looking statements are realized or substantially realized, there can be no assurance that they will have the expected consequences to, or effects on, Nicola. Investors are cautioned against attributing undue certainty to forward-looking statements.
THE FORWARD-LOOKING INFORMATION CONTAINED IN THIS PRESS RELEASE REPRESENTS THE EXPECTATIONS OF NICOLA AS OF THE DATE OF THIS PRESS RELEASE AND, ACCORDINGLY, IS SUBJECT TO CHANGE AFTER SUCH DATE. READERS SHOULD NOT PLACE UNDUE IMPORTANCE ON FORWARD- LOOKING INFORMATION AND SHOULD NOT RELY UPON THIS INFORMATION AS OF ANY OTHER DATE. WHILE NICOLA MAY ELECT TO, IT DOES NOT UNDERTAKE TO UPDATE THIS INFORMATION AT ANY PARTICULAR TIME, WHETHER AS A RESULT OF NEW INFORMATION, FUTURE EVENTS OR OTHERWISE, EXCEPT AS REQUIRED IN ACCORDANCE WITH APPLICABLE LAWS.
Neither the TSX Venture Exchange nor its Regulation Services Provider (as that term is defined in the policies of the TSX Venture Exchange) accepts responsibility for the adequacy or accuracy of this release.
[1] Source: Mandarin Capital Link and Investopedia Link


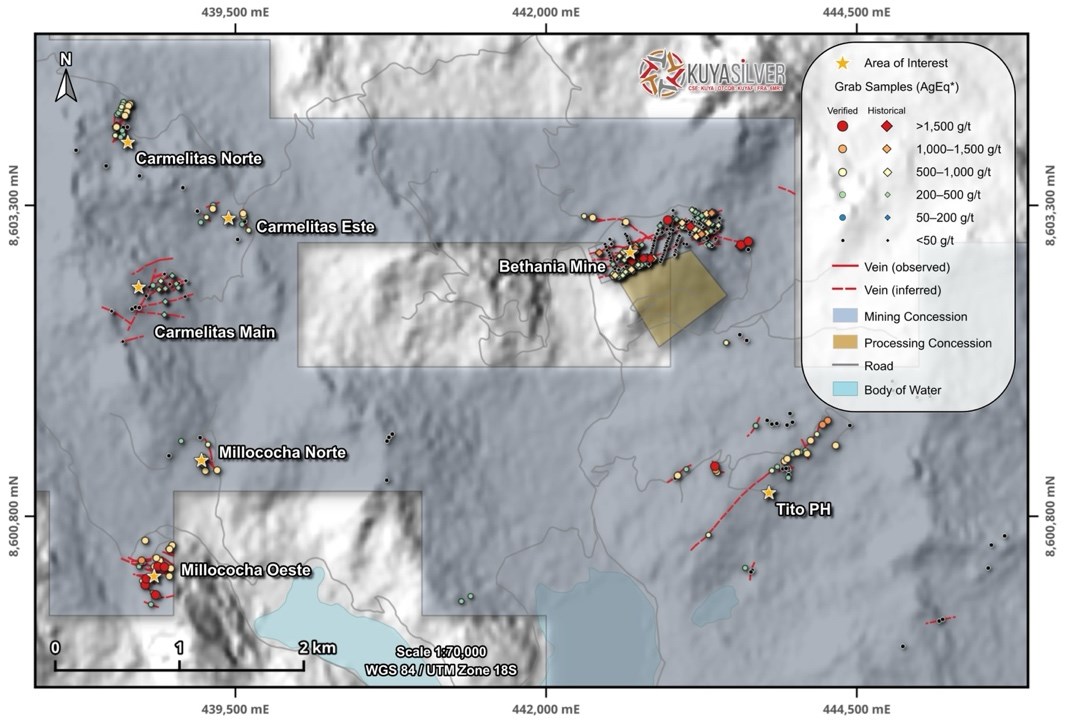
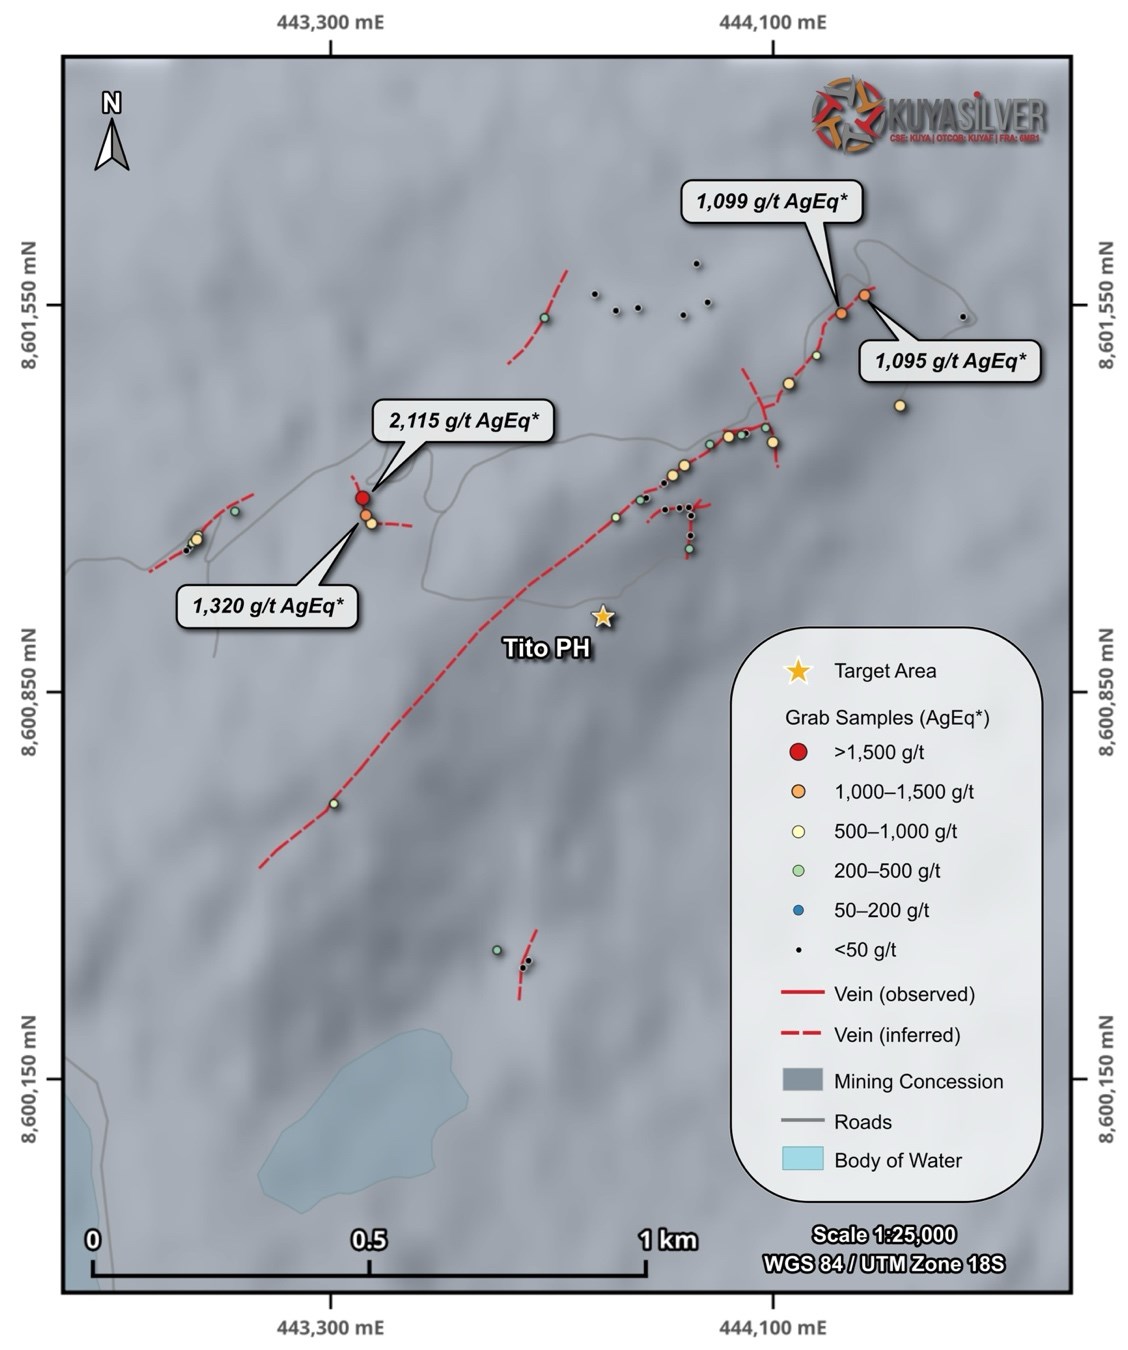
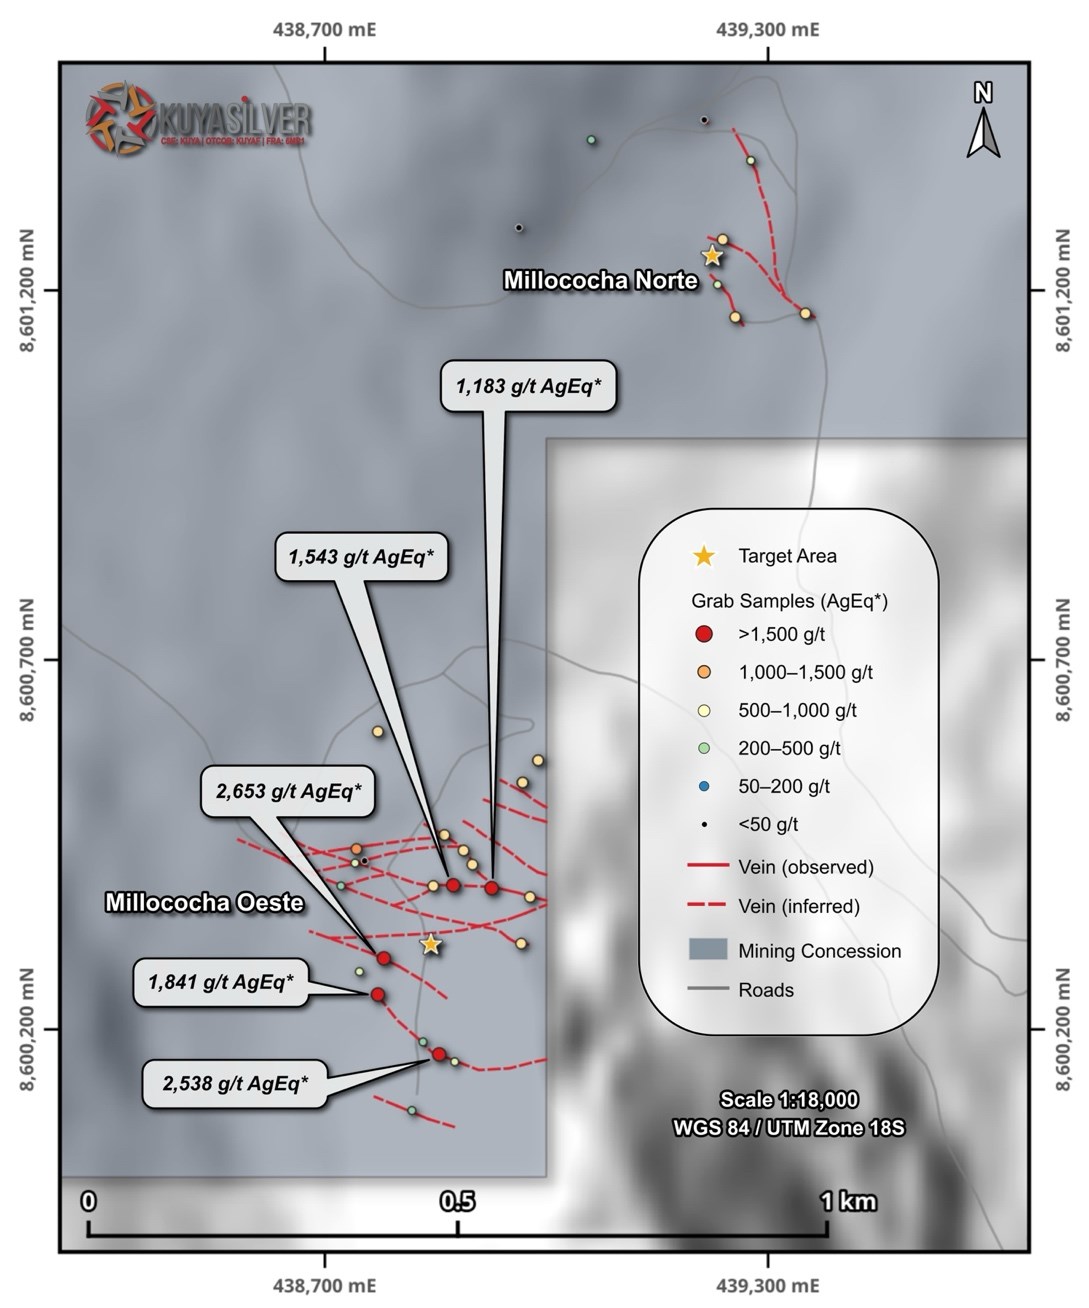
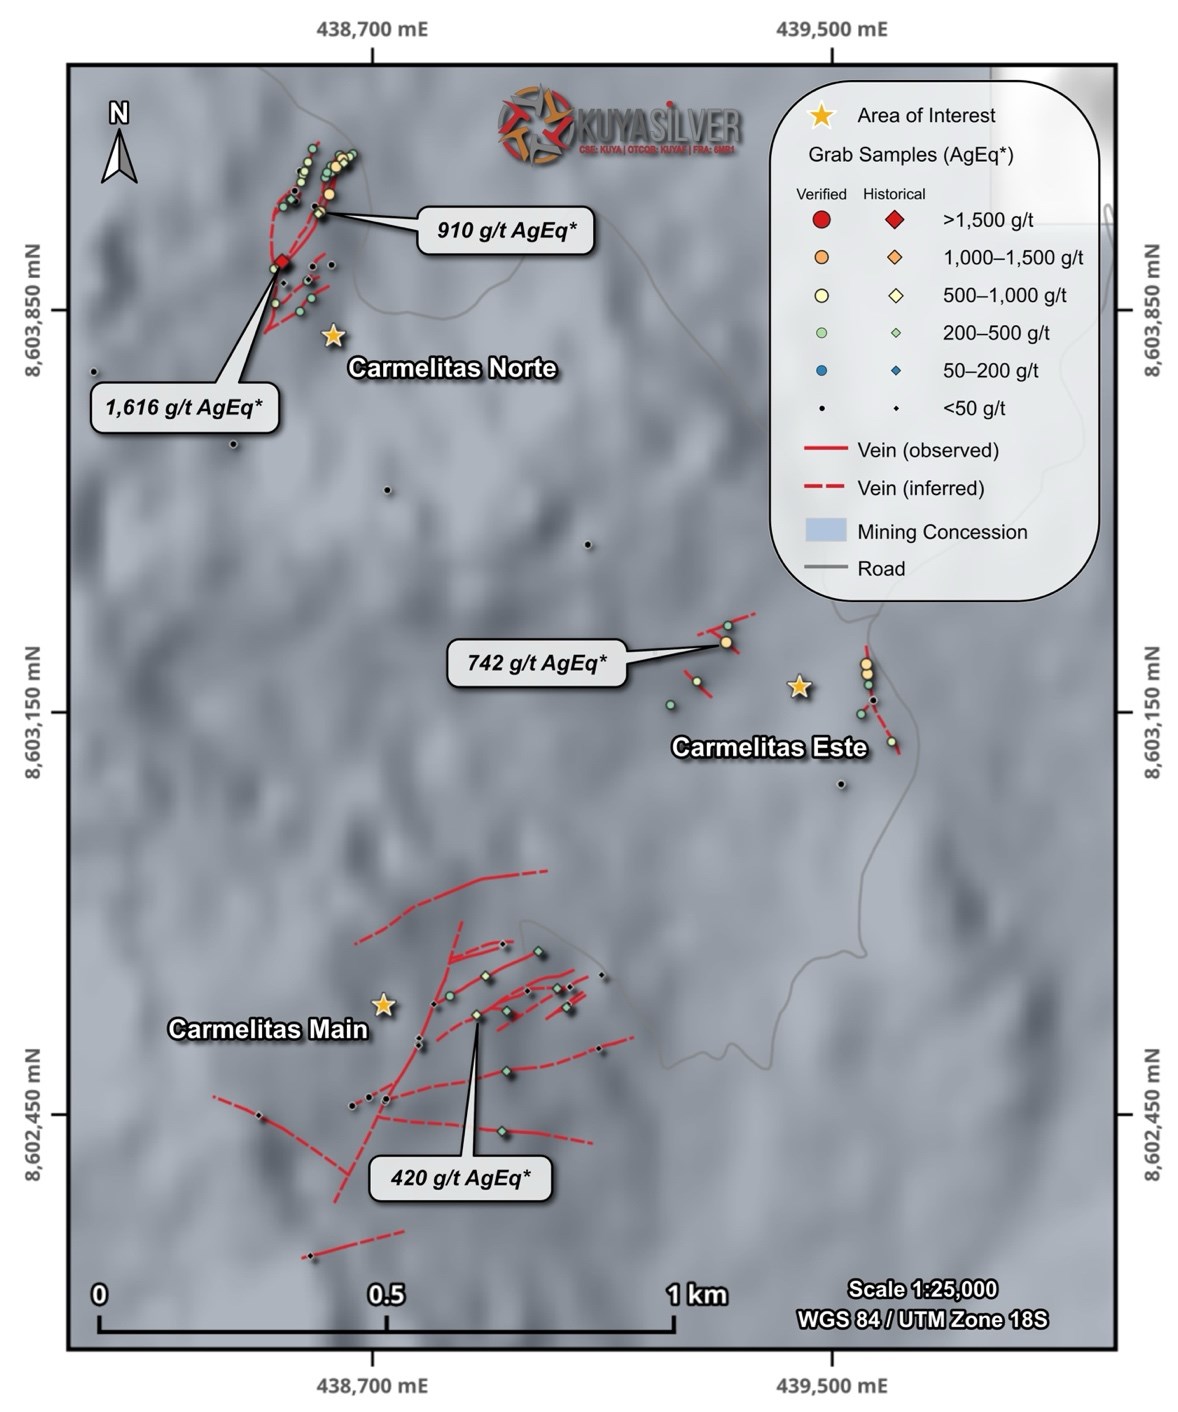

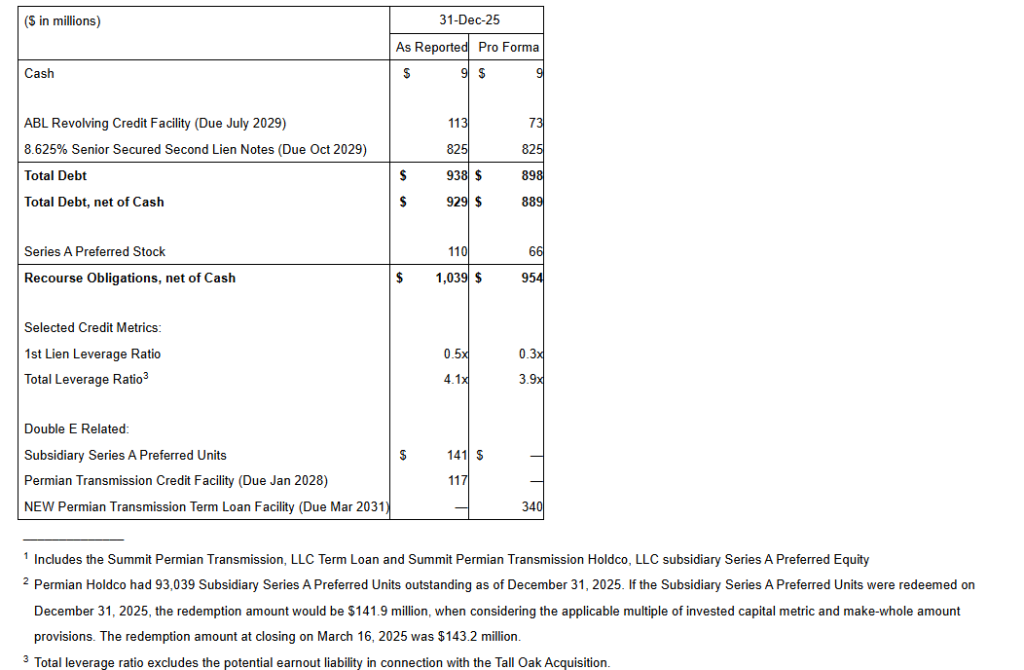
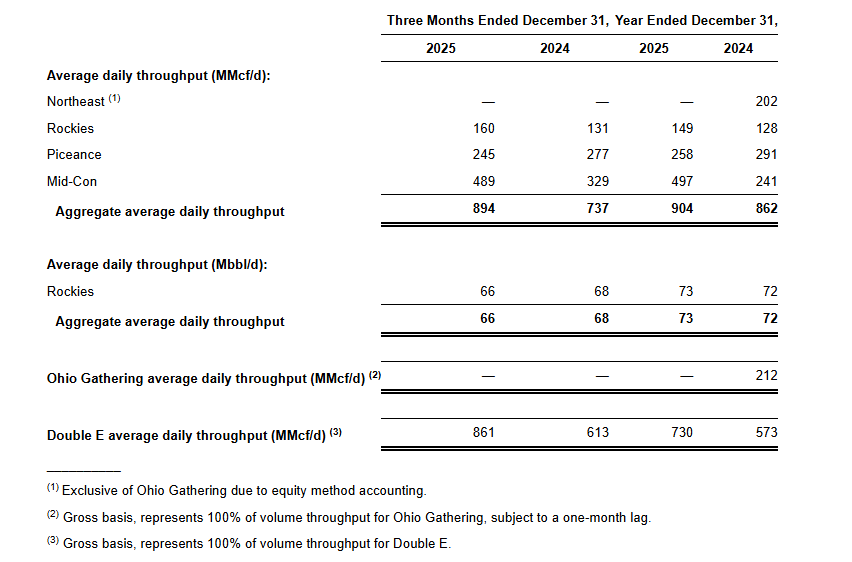
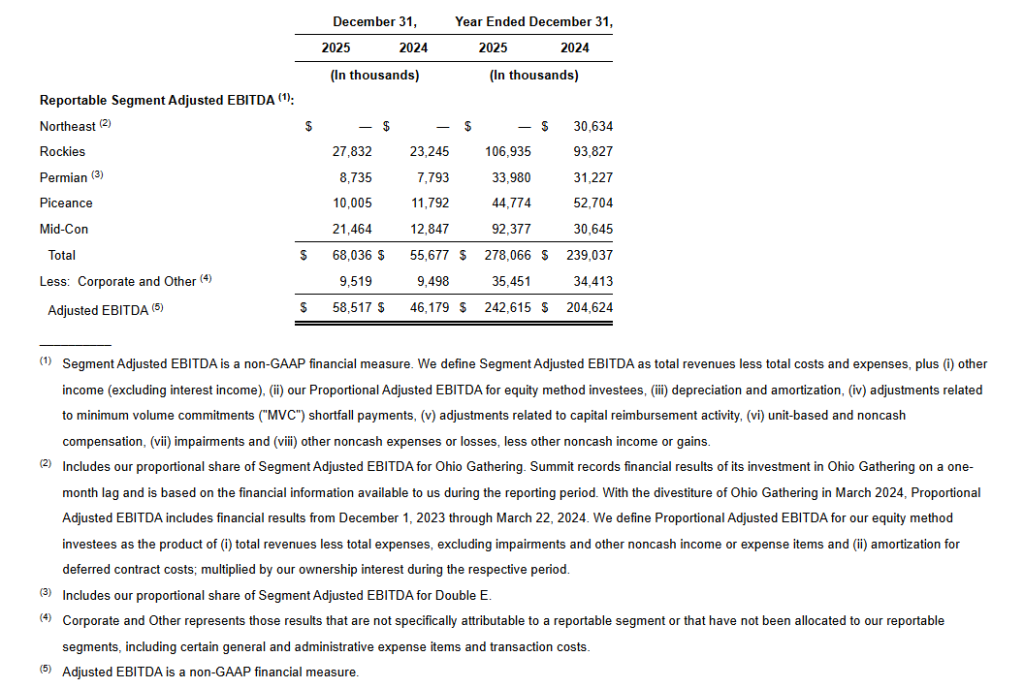
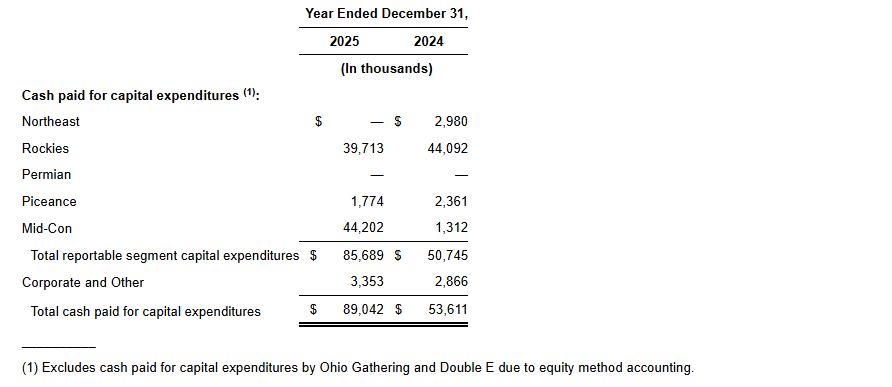
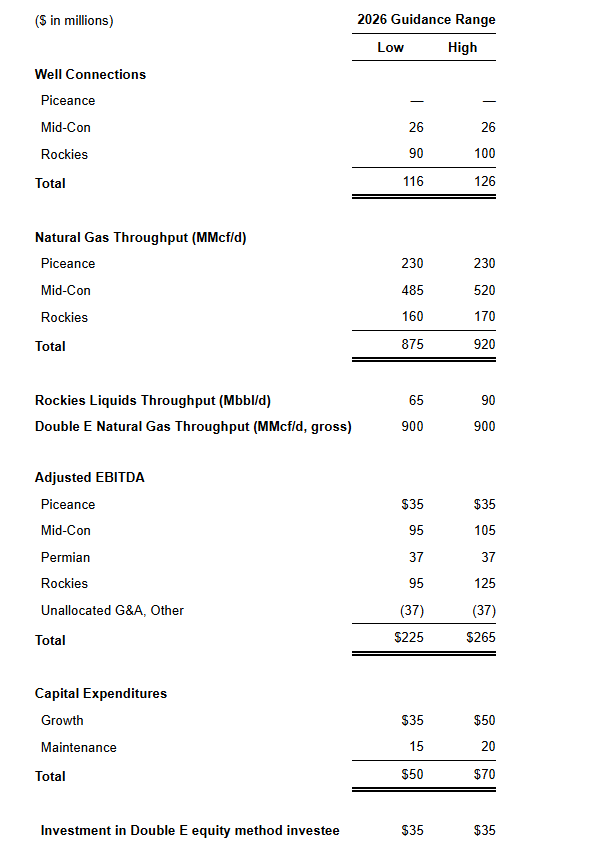
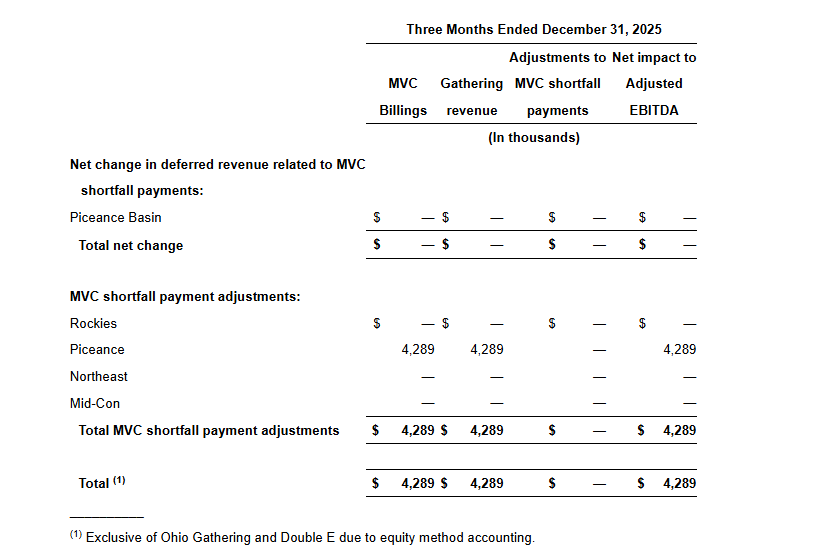
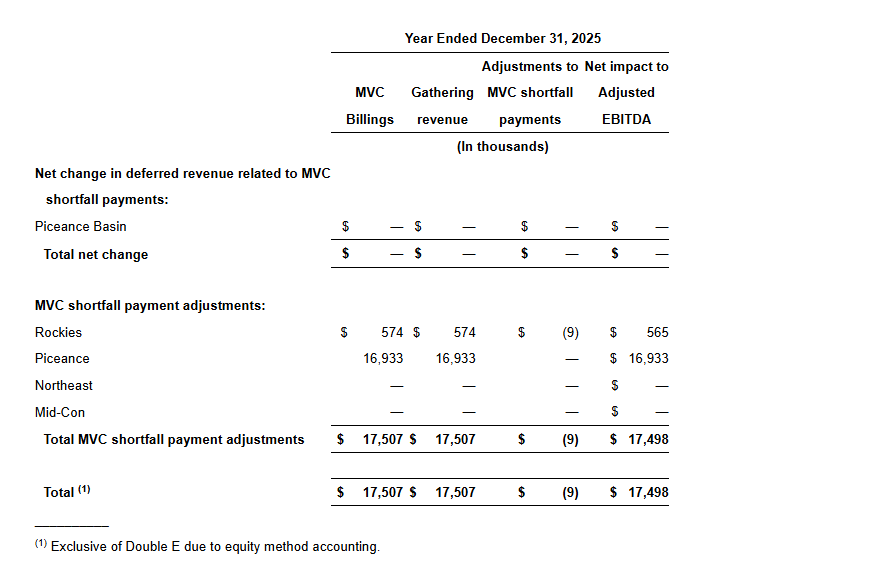


")
")
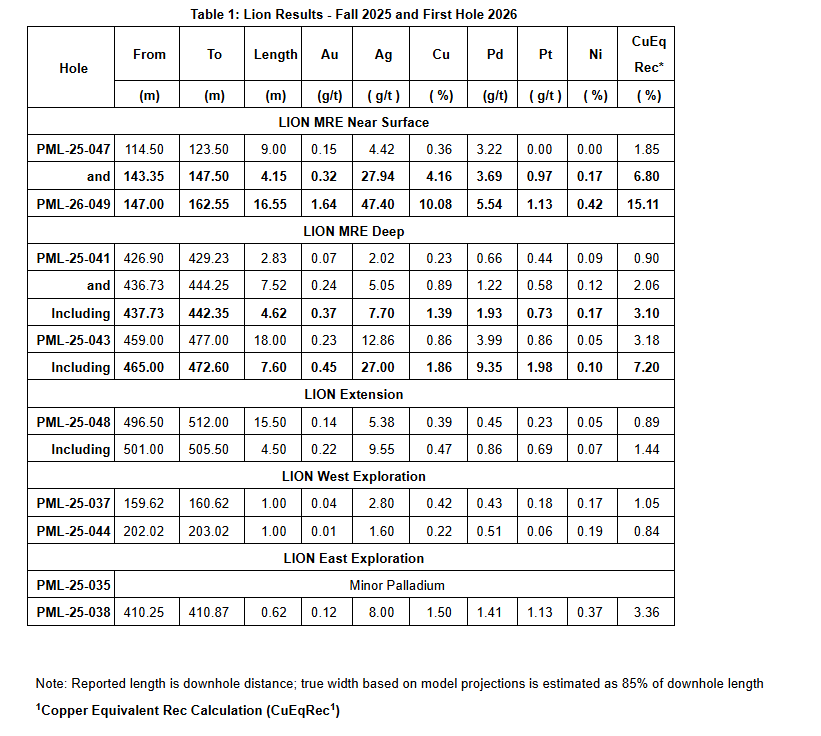

