Cumulus Media (NASDAQ: CMLS) is an audio-first media company delivering premium content to over a quarter billion people every month — wherever and whenever they want it. Cumulus Media engages listeners with high-quality local programming through 406 owned-and-operated radio stations across 86 markets; delivers nationally-syndicated sports, news, talk, and entertainment programming from iconic brands including the NFL, the NCAA, the Masters, CNN, the AP, the Academy of Country Music Awards, and many other world-class partners across more than 9,500 affiliated stations through Westwood One, the largest audio network in America; and inspires listeners through the Cumulus Podcast Network, its rapidly growing network of original podcasts that are smart, entertaining and thought-provoking. Cumulus Media provides advertisers with personal connections, local impact and national reach through broadcast and on-demand digital, mobile, social, and voice-activated platforms, as well as integrated digital marketing services, powerful influencers, full-service audio solutions, industry-leading research and insights, and live event experiences. Cumulus Media is the only audio media company to provide marketers with local and national advertising performance guarantees. For more information visit www.cumulusmedia.com.
Michael Kupinski, Director of Research, Equity Research Analyst, Digital, Media & Technology , Noble Capital Markets, Inc.
Jacob Mutchler, Research Associate, Noble Capital Markets, Inc.
Refer to the full report for the price target, fundamental analysis, and rating.
Mixed Q2 results. The company reported revenue of $204.8 million, slightly lighter than our expectations of $206.2M. Due to cost cuts, adj. EBITDA was $25.2 million, finishing ahead of our estimates by $2.1M. Digital revenues advanced 5%, but was slower than the 7% in the first quarter.
Lackluster pacing outlook. Management indicated that third quarter revenue pacing is disappointingly down low single digits, in spite of the anticipated influx of Political advertising. We believe that spot advertising is down mid single digits, with Network likely to be down double digits, similar to the second quarter.
Equity Research is available at no cost to Registered users of Channelchek. Not a Member? Click ‘Join’ to join the Channelchek Community. There is no cost to register, and we never collect credit card information.
This Research is provided by Noble Capital Markets, Inc., a FINRA and S.E.C. registered broker-dealer (B/D).
*Analyst certification and important disclosures included in the full report. NOTE: investment decisions should not be based upon the content of this research summary. Proper due diligence is required before making any investment decision.
Codere Online refers, collectively, to Codere Online Luxembourg, S.A. and its subsidiaries. Codere Online launched in 2014 as part of the renowned casino operator Codere Group. Codere Online offers online sports betting and online casino through its state-of-the art website and mobile application. Codere currently operates in its core markets of Spain, Italy, Mexico, Colombia, Panama and the City of Buenos Aires (Argentina). Codere Online’s online business is complemented by Codere Group’s physical presence throughout Latin America, forming the foundation of the leading omnichannel gaming and casino presence in the region.
Michael Kupinski, Director of Research, Equity Research Analyst, Digital, Media & Technology , Noble Capital Markets, Inc.
Patrick McCann, CFA, Research Analyst, Noble Capital Markets, Inc.
Refer to the full report for the price target, fundamental analysis, and rating.
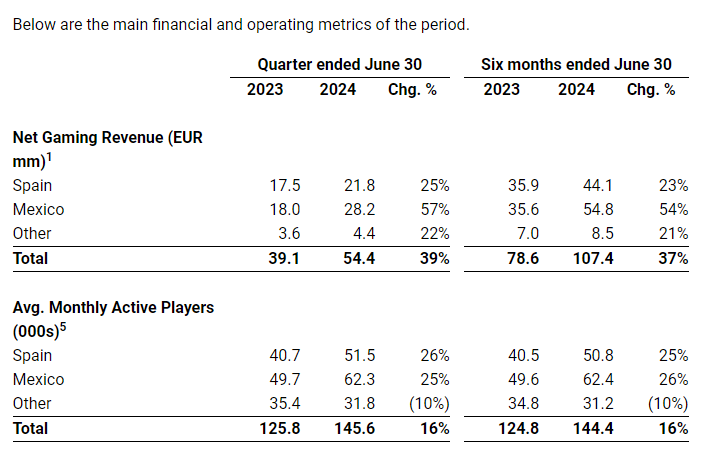
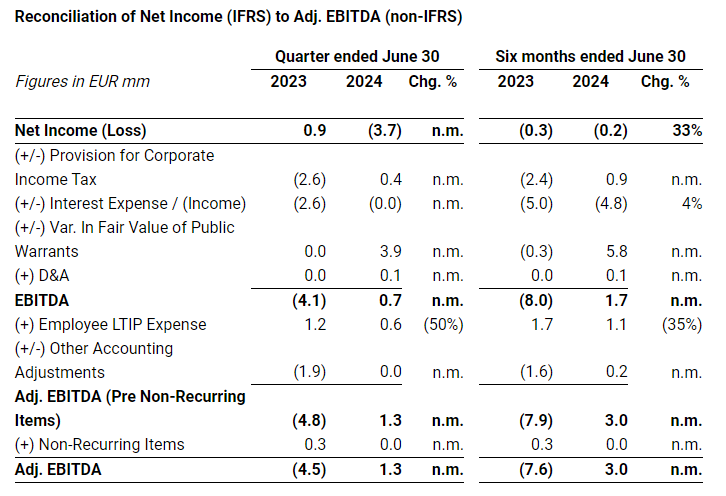
Adj. EBITDA positive. Q2 overachieved expectations with revenue growth a strong 39% to €54.4 million (vs our €47.6 million estimate) and with positive adj. EBITDA of €1.3 million (vs. our flat estimate). The results benefited from a favorable sports calendar, as well as strong customer growth for its casino games. Casino revenue accounted for 59% of total company revenue, up from 56% in Q1.
Spain and Mexico deliver strong revenue performance. The company exhibited favorable operating momentum in its latest Q2 quarter. Net gaming revenue increased a solid 39% to €54.4 million, nicely above our estimate of €47.6 million. The quarterly revenue represented a sequential quarterly revenue improvement from the first quarter at €53.0 million and an acceleration in revenue growth from 34% in Q1.
Equity Research is available at no cost to Registered users of Channelchek. Not a Member? Click ‘Join’ to join the Channelchek Community. There is no cost to register, and we never collect credit card information.
This Company Sponsored Research is provided by Noble Capital Markets, Inc., a FINRA and S.E.C. registered broker-dealer (B/D).
*Analyst certification and important disclosures included in the full report. NOTE: investment decisions should not be based upon the content of this research summary. Proper due diligence is required before making any investment decision.
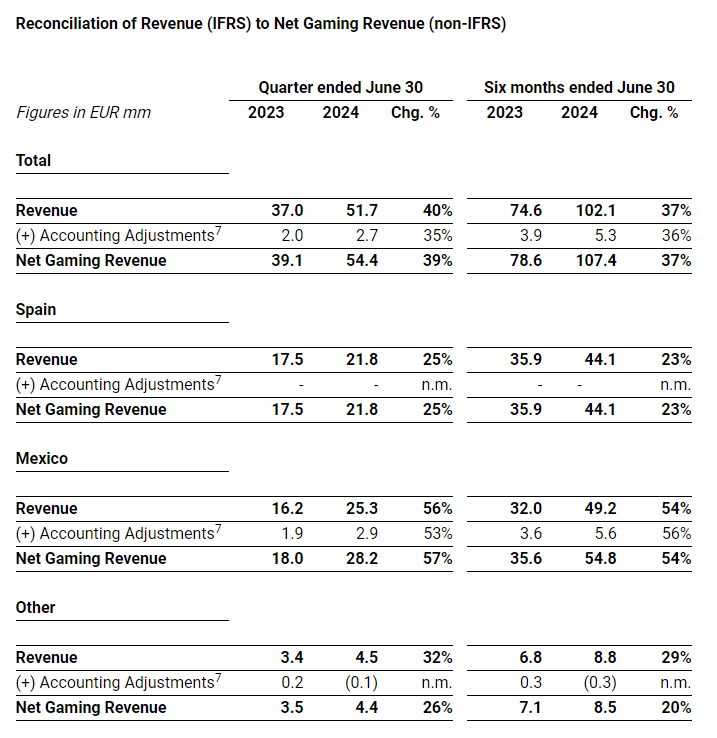
Total revenue was €51.7 mm in Q2 2024, while net gaming revenue1 was €54.4 mm in the period, 39% above Q1 2023.
Mexico revenue was €25.3 mm in Q2 2024, while net gaming revenue was €28.2 mm in the period, 57% above Q2 2023.
Spain revenue (and net gaming revenue) reached €21.8 mm in Q2 2024, 25% above Q2 2023.
Net income excluding the non-cash variation in fair value of public warrants2 was €5.5 mm in H1 2024 versus a net loss of €0.7 mm in H1 2023.
Total cash position of €40.5 mm as of June 30, 2024.
Increasing full year 2024 net gaming revenue outlook to €205 – 215 mm and Adj. EBITDA3 outlook to positive €2.5 – 7.5 mm.
Madrid, Spain and Tel Aviv, Israel, July 31, 2024 – (GLOBE NEWSWIRE) Codere Online (Nasdaq: CDRO / CDROW, the “Company”), a leading online gaming operator in Spain and Latin America, has released its preliminary unaudited4 financial results for the quarter ended June 30, 2024.
Aviv Sher, CEO of Codere Online, commented on the results, “We are very pleased with our performance in the second quarter of 2024, with net gaming revenue of €54.4 million, a 39% increase over the prior year period. In the quarter we saw improved customer engagement and customer acquisitions in part due to targeted additional marketing investments made around certain major sports betting events (i.e. Eurocup and Copa America). As a result, performance in our core Mexican and Spanish businesses was strong (notwithstanding all the Spanish victories in the Eurocup), with net gaming revenue growing by 57% in the second quarter in Mexico to over €28 million and 25% in Spain to nearly €22 million.”
Oscar Iglesias, CFO of Codere Online, stated, “We are pleased to have delivered positive Adjusted EBITDA for the second consecutive quarter despite the increased marketing spend around the Eurocup and Copa America. The €1.3 million in Adjusted EBITDA in the second quarter is nearly €6 million better than the prior year period and for the year-to-date period we have generated €3.0 million.”
Mr. Iglesias further added, “Thanks to this solid performance in the first half of the year, we are well on track to meet the profitability and cash generation expectations we set out to achieve in the beginning of the year, while still delivering significant top line growth. As such, we are raising our outlook for the full year 2024 and now expect to generate between €205 – 215 million of net gaming revenue, which represents a growth of 22% year-on-year at the midpoint, and between €2.5 – 7.5 million of positive Adjusted EBITDA.”
Recent Events
Board Changes
In the AGM held on June 24, 2024, Mr. Gabriel Saenz de Buruaga, Mr. Taavi Davies and Mr. Claude Noesen were appointed as directors, succeeding Mr. Patrick Ramsey, Ms. Michal Elimelech, and Mr. Laurent Teitgen.
Mr. Gonzaga Higuero, CEO of Codere Group, was re-appointed as director and named Chairman of the Board.
Research Coverage
On July 11, 2024, Craig-Hallum Capital Group initiated coverage of Codere Online6.
For more information about research firms currently covering Codere Online please access the Analyst Coverage section of our website.
Conference Call Information
Codere Online’s management will host a conference call to discuss the results and provide a business update at 8:30 am US Eastern Time today, July 31, 2024. Dial-in details as well as the audio webcast and presentation will be accessible on Codere Online’s website at www.codereonline.com. A recording of the webcast will also be available following the conference call.
About Codere Online Codere Online refers, collectively, to Codere Online Luxembourg, S.A. and its subsidiaries. Codere Online launched in 2014 as part of the renowned casino operator Codere Group. Codere Online offers online sports betting and online casino through its state-of-the art website and mobile applications. Codere currently operates in its core markets of Spain, Mexico, Colombia, Panama and Argentina. Codere Online’s online business is complemented by Codere Group’s physical presence in Spain and throughout Latin America, forming the foundation of the leading omnichannel gaming and casino presence.
About Codere Group Codere Group is a multinational group devoted to entertainment and leisure. It is a leading player in the private gaming industry, with four decades of experience and with presence in seven countries in Europe (Spain and Italy) and Latin America (Argentina, Colombia, Mexico, Panama, and Uruguay).
Note on Rounding. Due to decimal rounding, numbers presented throughout this report may not add up precisely to the totals and subtotals provided, and percentages may not precisely reflect the absolute figures.
Forward-Looking Statements Certain statements in this document may constitute “forward-looking statements” within the meaning of the “safe harbor” provisions of the United States Private Securities Litigation Reform Act of 1995. Forward-looking statements include, but are not limited to, statements regarding Codere Online Luxembourg, S.A. and its subsidiaries (collectively, “Codere Online”) or Codere Online’s or its management team’s expectations, hopes, beliefs, intentions or strategies regarding the future. In addition, any statements that refer to projections, forecasts or other characterizations of future events or circumstances, including any underlying assumptions, are forward-looking statements. The words “anticipate,” “believe,” “continue,” “could,” “estimate,” “expect,” “intends,” “may,” “might,” “plan,” “possible,” “potential,” “predict,” “project,” “should,” “would” and similar expressions may identify forward-looking statements, but the absence of these words does not mean that a statement is not forward-looking. Forward-looking statements in this document may include, for example, statements about Codere Online’s financial performance and, in particular, the potential evolution and distribution of its net gaming revenue; any prospective and illustrative financial information; and changes in Codere Online’s strategy, future operations and target addressable market, financial position, estimated revenues and losses, projected costs, prospects and plans.
These forward-looking statements are based on information available as of the date of this document and current expectations, forecasts and assumptions, and involve a number of judgments, risks and uncertainties. Accordingly, forward-looking statements should not be relied upon as representing Codere Online’s or its management team’s views as of any subsequent date, and Codere Online does not undertake any obligation to update forward-looking statements to reflect events or circumstances after the date they were made, whether as a result of new information, future events or otherwise, except as may be required under applicable securities laws.
As a result of a number of known and unknown risks and uncertainties, Codere Online’s actual results or performance may be materially different from those expressed or implied by these forward-looking statements. There may be additional risks that Codere Online does not presently know or that Codere Online currently believes are immaterial that could also cause actual results to differ from those contained in the forward-looking statements. Some factors that could cause actual results to differ include (i) changes in applicable laws or regulations, including online gaming, privacy, data use and data protection rules and regulations as well as consumers’ heightened expectations regarding proper safeguarding of their personal information, (ii) the impacts and ongoing uncertainties created by regulatory restrictions, changes in perceptions of the gaming industry, changes in policies and increased competition, and geopolitical events such as war, (iii) the ability to implement business plans, forecasts, and other expectations and identify and realize additional opportunities, (iv) the risk of downturns and the possibility of rapid change in the highly competitive industry in which Codere Online operates, (v) the risk that Codere Online and its current and future collaborators are unable to successfully develop and commercialize Codere Online’s services, or experience significant delays in doing so, (vi) the risk that Codere Online may never achieve or sustain profitability, (vii) the risk that Codere Online will need to raise additional capital to execute its business plan, which may not be available on acceptable terms or at all, (viii) the risk that Codere Online experiences difficulties in managing its growth and expanding operations, (ix) the risk that third-party providers, including the Codere Group, are not able to fully and timely meet their obligations, (x) the risk that the online gaming operations will not provide the expected benefits due to, among other things, the inability to obtain or maintain online gaming licenses in the anticipated time frame or at all, (xi) the risk that Codere Online is unable to secure or protect its intellectual property, and (xii) the possibility that Codere Online may be adversely affected by other political, economic, business, and/or competitive factors. Additional information concerning certain of these and other risk factors is contained in Codere Online’s filings with the U.S. Securities and Exchange Commission (the “SEC”). All subsequent written and oral forward-looking statements concerning Codere Online or other matters and attributable to Codere Online or any person acting on their behalf are expressly qualified in their entirety by the cautionary statements above.
Financial Information and Non-GAAP Financial Measures Codere Online’s financial statements are prepared in accordance with International Financial Reporting Standards as issued by the International Accounting Standards Board (“IFRS”), which can differ in certain significant respects from generally accepted accounting principles in the United States of America (“U.S. GAAP”).
This document includes certain financial measures not presented in accordance with U.S. GAAP or IFRS (“non-GAAP”), such as, without limitation, net gaming revenue and Adjusted EBITDA. These non-GAAP financial measures are not measures of financial performance in accordance with U.S. GAAP or IFRS and may exclude items that are significant in understanding and assessing Codere Online’s financial results. Therefore, these measures should not be considered in isolation or as an alternative to revenue, net income, cash flows from operations or other measures of profitability, liquidity or performance under U.S. GAAP or IFRS. You should be aware that Codere Online’s presentation of these measures may not be comparable to similarly-titled measures used by other companies. In addition, the audit of Codere Online’s financial statements in accordance with PCAOB standards, may impact how Codere Online currently calculates its non-GAAP financial measures, and we cannot assure you that there would not be differences, and such differences could be material.
Codere Online believes that the use of these non-GAAP financial measures provides an additional tool for investors to use in evaluating ongoing operating results and trends in comparing Codere Online’s financial measures with other similar companies, many of which present similar non-GAAP financial measures to investors. These non-GAAP financial measures are subject to inherent limitations as they reflect the exercise of judgments by management about which expense and income are excluded or included in determining these non-GAAP financial measures. Reconciliations of non-GAAP financial measures to their most directly comparable measure under IFRS are included herein.
This document may include certain projections of non-GAAP financial measures. Codere Online is unable to quantify certain amounts that would be required to be included in the most directly comparable U.S. GAAP or IFRS financial measures without unreasonable effort, due to the inherent difficulty and variability of accurately forecasting the occurrence and financial impact of the various adjusting items necessary for such comparable measures or such reconciliation that have not yet occurred, are out of our control, or cannot be reasonably predicted, ascertained or assessed, which could have a material impact on its future IFRS financial results. Consequently, no disclosure of estimated comparable U.S. GAAP or IFRS measures is included and no reconciliation of the forward-looking non-GAAP financial measures is included.
Use of Projections This document contains financial forecasts with respect to Codere Online’s business and projected financial results, including net gaming revenue and adjusted EBITDA. Codere Online’s independent auditors have not audited, reviewed, compiled or performed any procedures with respect to the projections for the purpose of their inclusion in this document, and accordingly, they did not express an opinion or provide any other form of assurance with respect thereto for the purpose of this document. These projections should not be relied upon as being necessarily indicative of future results. The assumptions and estimates underlying the prospective financial information are inherently uncertain and are subject to a wide variety of significant business, economic and competitive risks and uncertainties that could cause actual results to differ materially from those contained in the prospective financial information. See “Forward-Looking Statements” above. Accordingly, there can be no assurance that the prospective results are indicative of the future performance of Codere Online or that actual results will not differ materially from those presented in the prospective financial information. Inclusion of the prospective financial information in this document should not be regarded as a representation by any person that the results contained in the prospective financial information will be achieved.
For further information on the limitations and assumptions underlying these projections, please refer to Codere Online’s filings with the SEC.
Preliminary Information This document contains figures, financial metrics, statistics and other information that is preliminary and subject to change (the “Preliminary Information”). The Preliminary Information has not been audited, reviewed, or compiled by any independent registered public accounting firm. This Preliminary Information is subject to ongoing review including, where applicable, by Codere Online’s independent auditors. Accordingly, no independent registered public accounting firm has expressed an opinion or any other form of assurance with respect to the Preliminary Information. During the course of finalizing such Preliminary Information, adjustments to such Preliminary Information presented herein may be identified, which may be material. Codere Online undertakes no obligation to update or revise the Preliminary Information set forth in this document as a result of new information, future events or otherwise, except as otherwise required by law. The Preliminary Information may differ from actual results. Therefore, you should not place undue reliance upon this Preliminary Information. The Preliminary Information is not a comprehensive statement of financial results, and should not be viewed as a substitute for full financial statements prepared in accordance with IFRS. In addition, the Preliminary Information is not necessarily indicative of the results to be achieved in any future period.
No Offer or Solicitation This document does not constitute an offer to sell or the solicitation of an offer to buy any securities, nor will there be any sale of securities in any states or jurisdictions in which such offer, solicitation or sale would be unlawful prior to registration or qualification under the securities laws of any such jurisdiction. No offering of securities will be made except by means of a prospectus meeting the requirements of section 10 of the Securities Act of 1933, as amended, or an exemption therefrom.
Industry and Market Data In this document, Codere Online relies on and refers to certain information and statistics obtained from publicly available information and third-party sources, which it believes to be reliable. Codere Online has not independently verified the accuracy or completeness of any such publicly-available and third-party information, does not make any representation as to the accuracy or completeness of such data and does not undertake any obligation to update such data after the date of this document. You are cautioned not to give undue weight to such industry and market data.
Contacts:
Investors and Media Guillermo Lancha Director, Investor Relations and Communications Guillermo.Lancha@codere.com (+34) 628 928 152
1 Net Gaming Revenue is a non-IFRS measure. Please see reconciliation of Net Gaming Revenue to Revenue at the end of the report. 2 Net income excluding the non-cash variation in fair value of public warrants is a non-IFRS measure. Reconciliation: H1 2024 figure reflects a net loss of €0.2 mm (€0.3 mm in H1 2023) excluding a €5.8 mm loss (€0.3 gain in H1 2023) from the variation in fair value of public warrants. Figures presented for illustrative purposes and do not include any potential impacts on the provision for corporate income taxes. 3 Adjusted EBITDA outlook is a forward-looking non-IFRS measure. Please see important disclaimers at the end of the report. 4 See “Preliminary Information” below. 5 Average Monthly Active Players include real money (i.e. exclude free bets) sports betting and casino actives. 6 Codere Online does not endorse, recommend, or have any affiliation with Craig-Hallum Capital Group LLC or their research. The views, opinions, and recommendations expressed by Craig-Hallum Capital Group LLC are their own and do not reflect the views or opinions of Codere Online. Investors should conduct their own independent research and consult with a financial advisor before making any investment decisions. Codere Online is not responsible for any losses or damages arising from the use of this information. 7 Figures primarily reflect differences in recognition of revenue related to certain partner and affiliate agreements in place in Colombia, VAT impact from entry fees in Mexico and the impact from the application of inflation accounting (IAS 29) in Argentina.
Travelzoo® provides its 30 million members with exclusive offers and one-of-a-kind experiences personally reviewed by our deal experts around the globe. We have our finger on the pulse of outstanding travel, entertainment, and lifestyle experiences. We work in partnership with more than 5,000 top travel suppliers—our long-standing relationships give Travelzoo members access to irresistible deals.
Michael Kupinski, Director of Research, Equity Research Analyst, Digital, Media & Technology , Noble Capital Markets, Inc.
Joshua Zoepfel, Research Associate, Noble Capital Markets, Inc.
Refer to the full report for the price target, fundamental analysis, and rating.
In line quarter. Second quarter results were largely in line with our estimates. Q2 revenue of $21.1 million was a touch below our estimate of $22.4 million, and roughly flat with the prior year period. Adj. EBITDA in the quarter was $4.9 million, above our estimate of $4.4 million by roughly 11.0%, as a result of lower marketing expenses and higher gross margin. Gross margins were 88.1%, better than our 86.2% estimate.
A focus on subscribers. The Company introduced an annual $40 paid subscription for its travel deals at the beginning of the calendar year. All of its 30 million legacy members will be introduced to the paid model beginning in 2025. Management plans to add new benefits for the paid membership, although it did not yet identify what those benefits might be.
Equity Research is available at no cost to Registered users of Channelchek. Not a Member? Click ‘Join’ to join the Channelchek Community. There is no cost to register, and we never collect credit card information.
This Company Sponsored Research is provided by Noble Capital Markets, Inc., a FINRA and S.E.C. registered broker-dealer (B/D).
*Analyst certification and important disclosures included in the full report. NOTE: investment decisions should not be based upon the content of this research summary. Proper due diligence is required before making any investment decision.
All company presentation replays will be posted here 24-48 hours following the event. Access to the presentation / Q&A is available exclusively to Channelchek members. Channelchek is a free investor community. All it takes is a name and verified e-mail address. Click the button below to register:
Emerging Growth Public TMT/Consumer Company Executive Presentations
Q&A Sessions Moderated by Noble’s Analysts
Scheduled 1×1 Meetings with Qualified Investors
Noble Capital Markets, a full-service SEC / FINRA registered broker-dealer, dedicated exclusively to serving emerging growth companies, is pleased to present the Consumer, Communications, Media, and Technology Emerging Growth Virtual Equity Conference, taking place June 26th and 27th, 2024. This virtual gathering is set to be an immersive experience, bringing together a unique blend of investors, industry leaders, and experts in the consumer, communications, media, and technology sectors..
Part of Noble’s Robust 2024 Events Calendar
The Consumer, Communications, Media, and Technology Emerging Growth Virtual Equity Conference is part of Noble’s 2024 event programming, featuring a range of c-suite interviews, in-person non-deal roadshows throughout the United States, two other sector-specific virtual equity conferences, and culminating in Noble’s preeminent in-person investor conference, NobleCon20, to be held at Florida Atlantic University in Boca Raton, Florida December 3-4. Keep an eye out for the official press release on NobleCon20 coming soon.
The Consumer, Communications, Media, and Technology Emerging Growth Virtual Equity Conference will feature 2 days of corporate presentations from up to 50 innovative public consumer, communications, media, and technology companies, showcasing their latest advancements and investment opportunities. Each presentation will be followed by a fireside-style Q&A session proctored by one of Noble’s analysts or bankers, with questions taken from the audience during the presentation. Panel presentations are planned, featuring key opinion leaders in these sectors, providing valuable insights on emerging trends. Scheduled one-on-one meetings with public company executives, coordinated by Noble’s dedicated Investor Outreach team, are also available to qualified investors.
Why Your Company Should Present
Looking to increase awareness in your company and increase liquidity? Paid participation in Noble’s investor conferences, both virtual and in-person, provides that opportunity, with a tailored experience aimed at delivering substantial value. After 40 years of serving emerging growth companies, and the investors who follow them, Noble has built an investor base eager to discover where the next success story lies.
Noble’s investor base is relevant and, in many cases, new to your company. Noble’s dedicated Investor Outreach team provides unmatched exposure to investors that can invest in your company, including small money managers, family offices, RIAs, wealth managers, self-directed investors, and institutions. Most of Noble’s investors specifically seek undervalued, overlooked, emerging investment opportunities.
The cost to present includes your corporate presentation with a Q&A session proctored by one of Noble’s analysts or bankers, a webcast recording, scheduled 1×1 meetings with qualified investors, and marketing on Channelchek.
Benefits for Investors
Hear directly from the c-suite of the next innovators in consumer, communications, media, and technology and learn about new investment opportunities. The Q&A portion of each presentation gives you the opportunity to have your questions answered during or after the proctored session. The planned panel presentations are sure to provide expert insight on growing trends in the healthcare space. And, for qualified investors, one-on-one meetings are available with company executives; scheduled by Noble’s dedicated Investor Outreach team. All from the comfort of your own desk, and at no cost.
How to Register
If you have any questions about presenting, please contact events@noblecapitalmarkets.com
NEW YORK, July 25, 2024 /PRNewswire/ — Travelzoo® (NASDAQ: TZOO):
Revenue of $21.1 million, consistent year-over-year
Consolidated operating profit of $4.0 million
Non-GAAP consolidated operating profit of $4.8 million
Cash flow from operations of $3.1 million
Earnings per share (EPS) of $0.23
Travelzoo, the club for travel enthusiasts, today announced financial results for the second quarter ended June 30, 2024. Consolidated revenue was $21.1 million, consistent year-over-year. In constant currencies, revenue was $21.2 million, up from $21.1 million year-over-year. Travelzoo’s reported revenue consists of advertising revenues and commissions, derived from and generated in connection with purchases made by Travelzoo members, and membership fees.
Net income attributable to Travelzoo was $2.9 million for Q2 2024, or $0.23 per share, compared with $0.17 in the prior-year period. Net income attributable to Travelzoo from continuing operations was $2.9 million for Q2 2024, or $0.23 per share, compared with $0.17 in the prior-year period.
Non-GAAP operating profit was $4.8 million. Non-GAAP operating profit excludes amortization of intangibles ($88,000), stock option expenses ($0.7 million) and severance-related expenses ($30,000). Please refer to “Non-GAAP Financial Measures” and the tabular reconciliation below.
“We will continue to leverage Travelzoo’s global reach, trusted brand, and strong relationships with top travel suppliers to negotiate more exclusive offers for members,” said Holger Bartel, Travelzoo’s Global CEO. “With more than 30 million members, 8 million mobile app users, and 4 million social media followers, Travelzoo is loved by travel enthusiasts who are affluent, active, and open to new experiences.”
Cash Position As of June 30, 2024, consolidated cash, cash equivalents and restricted cash were $13.2 million. Net cash provided by operations was $3.1 million.
Travelzoo North America North America business segment revenue remained consistent year-over-year at $14.1 million. Operating profit for Q2 2024 was $3.7 million, or 26% of revenue, compared to operating profit of $3.8 million in the prior-year period.
Travelzoo Europe Europe business segment revenue increased 1% year-over-year to $6.0 million. In constant currencies, Europe business segment revenue increased 1% year-over-year. Operating profit for Q2 2024 was $512,000, or 9% of revenue, compared to operating loss of $239,000 in the prior-year period.
Jack’s Flight Club Jack’s Flight Club is a membership subscription service in which Travelzoo has a 60% ownership interest. Revenue from unaffiliated customers increased 9% year-over-year to $1.1 million. The number of premium subscribers increased 19% year-over-year. Jack’s Flight Club’s revenue from subscriptions is recognized ratably over the subscription period (quarterly, semi-annually, annually). Non-GAAP operating profit for Q2 2024 was $25,000. Non-GAAP operating profit excludes amortization of intangibles ($59,000) related to the acquisition of Travelzoo’s ownership interest in Jack’s Flight Club in 2020.
New Initiatives New Initiatives business segment revenue, which includes Licensing and Travelzoo META, was $23,000. Operating loss for Q2 2024 was $184,000.
In June 2020, Travelzoo entered into a royalty-bearing licensing agreement with a local licensee in Japan for the exclusive use of Travelzoo’s brand, business model, and members in Japan. In August of 2020, Travelzoo entered into a royalty-bearing licensing agreement with a local licensee in Australia for the exclusive use of Travelzoo’s brand, business models, and members in Australia, New Zealand, and Singapore. Under these arrangements, Travelzoo’s existing members in Australia, Japan, New Zealand, and Singapore will continue to be owned by Travelzoo as the licensor. Travelzoo recorded $7,000 in licensing revenue from the licensee in Japan in Q2 2024. Travelzoo recorded $11,000 in licensing revenue from the licensee in Australia, New Zealand, and Singapore in Q2 2024. Licensing revenue is expected to increase going forward.
Members and Subscribers As of June 30, 2024, we had 30.8 million members worldwide, consistent with June 30, 2023. In North America, Travelzoo had 16.1 million unduplicated members as of June 30, 2024, down from 16.2 million as of June 30, 2023. In Europe, Travelzoo had 9.2 million unduplicated members as of June 30, 2024, consistent with June 30, 2023. Jack’s Flight Club had 2.2 million subscribers, including premium subscribers, as of June 30, 2024, consistent with June 30, 2023.
Discontinued Operations In March 2020, Travelzoo decided to exit its Asia Pacific business and operate it as a licensing business going forward. Consequently, the Asia Pacific business has been classified as discontinued operations.
Income Taxes A provision of $1.3 million for income taxes was recorded for Q2 2024, compared to an income tax expense of $1.1 million in the prior-year period. Travelzoo intends to utilize available net operating losses (NOLs) to largely offset its actual tax liability for Q2 2024.
Share Repurchase Program During Q2 2024, the Company repurchased 800,000 of its outstanding common stock.
Looking Ahead For Q3 2024, we expect growth in revenue year-over-year, albeit at a smaller pace than in 2023. However, there could be unexpected fluctuations. We also expect for Q3 2024 higher profitability year-over-year. For 2025, we expect substantial growth in revenue as a result of additional revenue from membership fees.
In December 2023, we announced the introduction of a membership fee for Travelzoo beginning January 1, 2024. We recognize membership fee revenue ratably over the subscription period. Legacy Travelzoo members as of December 31, 2023, which represent more than 95% of members, are exempt from the fee during 2024. Therefore, we do not anticipate membership fee revenue from these members before 2025.
Non-GAAP Financial Measures Management calculates non-GAAP operating income when evaluating the financial performance of the business. Travelzoo’s calculation of non-GAAP operating income, also called “non-GAAP operating profit” in this press release and today’s earnings conference call, excludes the following items: amortization of intangibles, stock option expenses and severance-related expenses. This press release includes a table which reconciles GAAP operating income to the calculation of non-GAAP operating income. Non-GAAP operating income is not required by, or presented in accordance with, generally accepted accounting principles in the United States of America (“GAAP”). This information should be considered as supplemental in nature and should not be considered in isolation or as a substitute for the financial information prepared in accordance with GAAP. In addition, these non-GAAP financial measures may not be the same as similarly titled measures reported by other companies.
Conference Call Travelzoo will host a conference call to discuss second quarter 2024 results today at 11:00 a.m. ET. Please visit http://ir.travelzoo.com/events-presentations to
download the management presentation (PDF format) to be discussed in the conference call
access the webcast
About Travelzoo We, Travelzoo®, are the club for travel enthusiasts. Our 30 million members receive exclusive offers and one-of-a-kind experiences personally reviewed by our deal experts around the globe. We have our finger on the pulse of outstanding travel, entertainment, and lifestyle experiences. We work in partnership with more than 5,000 top travel suppliers—our long-standing relationships give Travelzoo members access to irresistible deals.
Certain statements contained in this press release that are not historical facts may be forward-looking statements within the meaning of Section 27A of the Securities Act of 1933 and Section 21E of the Securities and Exchange Act of 1934. These forward-looking statements may include, but are not limited to, statements about our plans, objectives, expectations, prospects and intentions, markets in which we participate and other statements contained in this press release that are not historical facts. When used in this press release, the words “expect”, “predict”, “project”, “anticipate”, “believe”, “estimate”, “intend”, “plan”, “seek” and similar expressions are generally intended to identify forward-looking statements. Because these forward-looking statements involve risks and uncertainties, there are important factors that could cause actual results to differ materially from those expressed or implied by these forward-looking statements, including changes in our plans, objectives, expectations, prospects and intentions and other factors discussed in our filings with the SEC. We cannot guarantee any future levels of activity, performance or achievements. Travelzoo undertakes no obligation to update forward-looking statements to reflect events or circumstances occurring after the date of this press release.
NEW YORK, July 18, 2024 /PRNewswire/ — Travelzoo® (NASDAQ: TZOO):
WHAT:
Travelzoo, the club for travel enthusiasts, will host a conference call to discuss the Company’s financial results for the second quarter ended June 30, 2024. Travelzoo will issue a press release reporting its results before the market opens on July 25, 2024.
WHEN:
July 25, 2024 at 11:00 AM ET
HOW:
A live webcast of Travelzoo’s Q2 2024 earnings conference call can be accessed athttp://ir.travelzoo.com/events-presentations. The webcast will be archived within 2 hours of the end of the call and will be available through the same link.
CONTACT:
Travelzoo Investor Relations
ir@travelzoo.com
About Travelzoo We, Travelzoo®, are the club for travel enthusiasts. Our 30 million members receive exclusive offers and one-of-a-kind experiences personally reviewed by our deal experts around the globe. We have our finger on the pulse of outstanding travel, entertainment, and lifestyle experiences. We work in partnership with more than 5,000 top travel suppliers—our long-standing relationships give us access to irresistible deals.
Madrid, Spain and Tel Aviv, Israel, July 16, 2024 (GLOBE NEWSWIRE) – Codere Online Luxembourg, S.A. (Nasdaq: CDRO / CDROW) (the “Company” or “Codere Online”) a leading online gaming operator in Spain and Latin America, today announced that it will release its second quarter 2024 results prior to 8:30AM US Eastern Time on July 31, 2024.
At 8:30AM US Eastern Time on the same day, Codere Online’s management will host a conference call to discuss the results and provide a business update.
The Company’s earnings press release and related materials will be available on Codere Online’s website at www.codereonline.com. Dial-in details for the conference call as well as the audio webcast registration link are accessible on the Events & Presentations section of the same website. A recording of the webcast will be available following the conference call.
About Codere Online
Codere Online refers, collectively, to Codere Online Luxembourg, S.A. and its subsidiaries. Codere Online launched in 2014 as part of the renowned casino operator Codere Group. Codere Online offers online sports betting and online casino through its state-of-the art website and mobile applications. Codere currently operates in its core markets of Spain, Mexico, Colombia, Panama and Argentina. Codere Online’s online business is complemented by Codere Group’s physical presence throughout Latin America, forming the foundation of the leading omnichannel gaming and casino presence.
About Codere Group Codere Group is a multinational group devoted to entertainment and leisure. It is a leading player in the private gaming industry, with four decades of experience and with presence in seven countries in Europe (Spain and Italy) and Latin America (Argentina, Colombia, Mexico, Panama, and Uruguay).
Contacts:
Investors and Media Guillermo Lancha Director, Investor Relations and Communications Guillermo.Lancha@codere.com (+34)-628-928-152
GROSSE POINTE FARMS, Mich., July 15, 2024 (GLOBE NEWSWIRE) — Saga Communications, Inc. (Nasdaq: SGA) announced today that it will release its 2nd Quarter 2024 results at 9:00 a.m. EDT on Thursday, August 8, 2024. The company will be holding a conference call on the same date at 11:00 a.m. EDT. The dial-in numbers are as follows:
Domestic and International Dial-in Number: (973) 528-0008 Conference Entry Code: 379213
The Company requests that all parties that have a question that they would like to submit to the Company to please email the inquiry by 10:00 a.m. EDT on August 8, 2024, to SagaIR@sagacom.com. The Company will discuss, during the limited period of the conference call, those inquiries it deems of general relevance and interest. Only inquiries made in compliance with the foregoing will be discussed during the call.
Saga’s earnings release will contain certain non-GAAP financial measures including station operating income, trailing 12-month consolidated EBITDA, and same station financial information. A reconciliation of all non-GAAP financial measures to the most directly comparable GAAP measures will be provided in the earnings release.
Saga is a media company whose business is devoted to acquiring, developing, and operating broadcast properties with a growing focus on opportunities complimentary to our core radio business including digital, e-commerce and non-traditional revenue initiatives. Saga owns or operates broadcast properties in 28 markets, including 82 FM and 32 AM radio stations and 79 metro signals. For additional information, contact us at (313) 886-7070 or visit our website at www.sagacom.com.
Townsquare is a community-focused digital media and digital marketing solutions company with market leading local radio stations, principally focused outside the top 50 markets in the U.S. Our assets include a subscription digital marketing services business, Townsquare Interactive, providing website design, creation and hosting, search engine optimization, social media and online reputation management as well as other digital monthly services for approximately 26,800 SMBs; a robust digital advertising division, Townsquare IGNITE, a powerful combination of a) an owned and operated portfolio of more than 330 local news and entertainment websites and mobile apps along with a network of leading national music and entertainment brands, collecting valuable first party data, and b) a proprietary digital programmatic advertising technology stack with an in-house demand and data management platform; and a portfolio of 321 local terrestrial radio stations in 67 U.S. markets strategically situated outside the Top 50 markets in the United States. Our portfolio includes local media brands such as WYRK.com, WJON.com, and NJ101.5.com and premier national music brands such as XXLmag.com, TasteofCountry.com, UltimateClassicRock.com and Loudwire.com.
Michael Kupinski, Director of Research, Equity Research Analyst, Digital, Media & Technology , Noble Capital Markets, Inc.
Jacob Mutchler, Research Associate, Noble Capital Markets, Inc.
Refer to the full report for the price target, fundamental analysis, and rating.
Virtual conference highlights. On June 26, the company’s CEO Bill Wilson and CFO Stuart Rosenstein presented at Noble’s Virtual Consumer/TMT conference. Mr. Wilson highlighted the company’s transformation to a digital first business, unique value proposition, favorable growth outlook and sizeable return of capital to shareholders. A replay of the company’s presentation can be viewed here.
Favorable outlook. With Q2 nearly finished, Mr. Wilson highlighted the company is on track to hit Q2 guidance, experience sequential revenue growth over Q1, and expectation to hit full year revenue and adj. EBITDA guidance. Notably, we anticipate the company will gain positive momentum and experience sequential growth in the back half of the year, as high margin political revenue kicks in.
Equity Research is available at no cost to Registered users of Channelchek. Not a Member? Click ‘Join’ to join the Channelchek Community. There is no cost to register, and we never collect credit card information.
This Company Sponsored Research is provided by Noble Capital Markets, Inc., a FINRA and S.E.C. registered broker-dealer (B/D).
*Analyst certification and important disclosures included in the full report. NOTE: investment decisions should not be based upon the content of this research summary. Proper due diligence is required before making any investment decision.
Luxembourg, Grand Duchy of Luxembourg, June 25, 2024 – (GLOBE NEWSWIRE) Codere Online (Nasdaq: CDRO / CDROW, the “Company”), a leading online gaming operator in Spain and Latin America, today announced the favorable resolution of all 21 agenda items at the Annual General Meeting (AGM) held yesterday at the registered office of the Company, including the appointment of three new members to its Board of Directors.
Mr. Gabriel Saenz de Buruaga, Mr. Taavi Davies and Mr. Claude Noesen have been appointed as directors for an initial term of one year, replacing Mr. Patrick Ramsey, Ms. Michal Elimelech, and Mr. Laurent Teitgen.
Mr. Gonzaga Higuero, CEO of Codere Group, was re-appointed as director and will also serve as Chairman of the Board going forward. In regards to these changes, Mr. Higuero stated “we welcome these new additions to the Board and look forward to working with them to build upon the significant progress achieved by the Company in recent years.”
Mr. Higuero further added “I would also like to extend my sincere appreciation to Pat for his valuable contribution and dedication as Chairman since Codere Online went public in 2021, and I am excited that he will be joining me in the Board of our parent company, Codere New Topco, following its recently announced recapitalization and as it looks ahead to a promising future.”
For detailed biographies of the members of our Board of Directors please visit our website.
Changes to Board Committees
In the Board of Directors meeting held last week ahead of the AGM, the following changes to the Company’s Committees were approved:
Audit Committee – Appointment of Mr. Claude Noesen as member. Mr. Borja Fernández and Mr. Daniel Valdez will continue to serve as Chairman and member, respectively.
Compliance Committee – Appointment of Mr. Mark Dunn as Chairman and Mr. Taavi Davies as member. Mr. Rafael Catalá and Ms. Yaiza Rodríguez will continue to serve as members.
About Codere Online Codere Online refers, collectively, to Codere Online Luxembourg, S.A. and its subsidiaries. Codere Online launched in 2014 as part of the renowned casino operator Codere Group. Codere Online offers online sports betting and online casino through its state-of-the art website and mobile applications. Codere currently operates in its core markets of Spain, Mexico, Colombia, Panama and Argentina. Codere Online’s online business is complemented by Codere Group’s physical presence in Spain and throughout Latin America, forming the foundation of the leading omnichannel gaming and casino presence.
About Codere Group Codere Group is a multinational group devoted to entertainment and leisure. It is a leading player in the private gaming industry, with four decades of experience and with presence in seven countries in Europe (Spain and Italy) and Latin America (Argentina, Colombia, Mexico, Panama, and Uruguay).
Forward-Looking Statements Certain statements in this document may constitute “forward-looking statements” within the meaning of the “safe harbor” provisions of the United States Private Securities Litigation Reform Act of 1995. Forward-looking statements include, but are not limited to, statements regarding Codere Online Luxembourg, S.A. and its subsidiaries (collectively, “Codere Online”) or Codere Online’s or its management team’s expectations, hopes, beliefs, intentions or strategies regarding the future. In addition, any statements that refer to projections, forecasts or other characterizations of future events or circumstances, including any underlying assumptions, are forward-looking statements. The words “anticipate,” “believe,” “continue,” “could,” “estimate,” “expect,” “intends,” “may,” “might,” “plan,” “possible,” “potential,” “predict,” “project,” “should,” “would” and similar expressions may identify forward-looking statements, but the absence of these words does not mean that a statement is not forward-looking. Forward-looking statements in this document may include, for example, statements about Codere Online’s financial performance and, in particular, the potential evolution and distribution of its net gaming revenue; any prospective and illustrative financial information; and changes in Codere Online’s strategy, future operations and target addressable market, financial position, estimated revenues and losses, projected costs, prospects and plans.
These forward-looking statements are based on information available as of the date of this document and current expectations, forecasts and assumptions, and involve a number of judgments, risks and uncertainties. Accordingly, forward-looking statements should not be relied upon as representing Codere Online’s or its management team’s views as of any subsequent date, and Codere Online does not undertake any obligation to update forward-looking statements to reflect events or circumstances after the date they were made, whether as a result of new information, future events or otherwise, except as may be required under applicable securities laws.
As a result of a number of known and unknown risks and uncertainties, Codere Online’s actual results or performance may be materially different from those expressed or implied by these forward-looking statements. There may be additional risks that Codere Online does not presently know or that Codere Online currently believes are immaterial that could also cause actual results to differ from those contained in the forward-looking statements. Some factors that could cause actual results to differ include (i) changes in applicable laws or regulations, including online gaming, privacy, data use and data protection rules and regulations as well as consumers’ heightened expectations regarding proper safeguarding of their personal information, (ii) the impacts and ongoing uncertainties created by regulatory restrictions, changes in perceptions of the gaming industry, changes in policies and increased competition, and geopolitical events such as war, (iii) the ability to implement business plans, forecasts, and other expectations and identify and realize additional opportunities, (iv) the risk of downturns and the possibility of rapid change in the highly competitive industry in which Codere Online operates, (v) the risk that Codere Online and its current and future collaborators are unable to successfully develop and commercialize Codere Online’s services, or experience significant delays in doing so, (vi) the risk that Codere Online may never achieve or sustain profitability, (vii) the risk that Codere Online will need to raise additional capital to execute its business plan, which may not be available on acceptable terms or at all, (viii) the risk that Codere Online experiences difficulties in managing its growth and expanding operations, (ix) the risk that third-party providers, including the Codere Group, are not able to fully and timely meet their obligations, (x) the risk that the online gaming operations will not provide the expected benefits due to, among other things, the inability to obtain or maintain online gaming licenses in the anticipated time frame or at all, (xi) the risk that Codere Online is unable to secure or protect its intellectual property, and (xii) the possibility that Codere Online may be adversely affected by other political, economic, business, and/or competitive factors. Additional information concerning certain of these and other risk factors is contained in Codere Online’s filings with the U.S. Securities and Exchange Commission (the “SEC”). All subsequent written and oral forward-looking statements concerning Codere Online or other matters and attributable to Codere Online or any person acting on their behalf are expressly qualified in their entirety by the cautionary statements above.
RICHMOND, Va.–(BUSINESS WIRE)– Bowlero Corp. (NYSE: BOWL) (“Bowlero” or the “Company”), one of the World’s premier operators of location-based entertainment announced today that its Summer Season Pass exceeded $6 million in sales to date, marking an all-time high in pass sales for the company with over two months worth of sales opportunity remaining. This achievement highlights the growing popularity of the Summer Season Pass and Bowlero’s commitment to delivering value and entertainment to its guests.
“Our Summer Season Pass was specifically designed to enhance the bowling experience for our guests,” said Lev Ekster, President of Bowlero Corp. “This year’s sales reflect our commitment to innovation and guest satisfaction and we are pleased to see such a positive response from the consumer this early in the season. It remains our mission to create memorable experiences for our guests, and the Summer Season Pass is a key part of that customer journey.”
The Summer Season Pass allows guests to enjoy two games of bowling every day throughout the summer, with the option to upgrade to a Premium Pass for additional perks such as 15% off food and non-alcoholic beverages, a $5 arcade card reload each visit, and use at all participating locations nationwide. With extended hours at locations over the summer months, Bowlero is guaranteeing guests have more opportunities to bowl, meeting the needs of avid bowlers and attracting new customers looking for summer activities.
This initiative offers additional benefits to the company by encouraging guests to visit Bowlero locations more frequently over the summer months, creating a consistent flow of traffic. The Summer Season Pass not only introduces a new revenue stream for the company but also expands Bowlero’s reach to a broader audience. By offering an affordable and attractive entertainment option, Bowlero can appeal to new guests, foster long-term customer relationships, and improve brand loyalty carrying that positive consumer sentiment into the fall and winter seasons.
“Our team has gone above and beyond to create an unforgettable environment for guests this summer,” said Jeff Gliner, Chief Operating Officer of Bowlero Corp. “The increased traffic from the summer pass holders will drive uptake in our updated menu offerings rolling out this summer.”
The Summer Season Pass is on sale now at www.SummerSeasonPass.com and can be redeemed through September 2, 2024.
About Bowlero Corp.
Bowlero Corporation is one of the World’s premier operators of location-based entertainment. With approximately 350 locations across North America, the Company serves more than 40 million guest visits annually through a family of brands that include Lucky Strike, Bowlero and AMF. In 2019, Bowlero acquired the Professional Bowlers Association, the major league of bowling and a growing media property that boasts millions of fans around the globe. For more information on Bowlero, please visit BowleroCorp.com.
Forward Looking Statements
Some of the statements contained in this press release are forward-looking statements within the meaning of Section 27A of the Securities Act of 1933, as amended, and Section 21E of the Securities Exchange Act of 1934, as amended, that involve risk, assumptions and uncertainties, such as statements of our plans, objectives, expectations, intentions and forecasts. These forward-looking statements are generally identified by the use of forward-looking terminology, including the terms “anticipate,” “believe,” “confident,” “continue,” “could,” “estimate,” “expect,” “intend,” “likely,” “may,” “plan,” “possible,” “potential,” “predict,” “project,” “should,” “target,” “will,” “would” and, in each case, their negative or other various or comparable terminology. These forward-looking statements reflect our views with respect to future events as of the date of this release and are based on our management’s current expectations, estimates, forecasts, projections, assumptions, beliefs and information. Although management believes that the expectations reflected in these forward-looking statements are reasonable, it can give no assurance that these expectations will prove to have been correct. All such forward-looking statements are subject to risks and uncertainties, many of which are outside of our control, and could cause future events or results to be materially different from those stated or implied in this document. It is not possible to predict or identify all such risks. These risks include, but are not limited to: our ability to design and execute our business strategy; changes in consumer preferences and buying patterns; our ability to compete in our markets; the occurrence of unfavorable publicity; risks associated with long-term non-cancellable leases for our centers; our ability to retain key managers; risks associated with our substantial indebtedness and limitations on future sources of liquidity; our ability to carry out our expansion plans; our ability to successfully defend litigation brought against us; our ability to adequately obtain, maintain, protect and enforce our intellectual property and proprietary rights and claims of intellectual property and proprietary right infringement, misappropriation or other violation by competitors and third parties; failure to hire and retain qualified employees and personnel; the cost and availability of commodities and other products we need to operate our business; cybersecurity breaches, cyber-attacks and other interruptions to our and our third-party service providers’ technological and physical infrastructures; catastrophic events, including war, terrorism and other conflicts; public health emergencies and pandemics, such as the COVID-19 pandemic, or natural catastrophes and accidents; changes in the regulatory atmosphere and related private sector initiatives; fluctuations in our operating results; economic conditions, including the impact of increasing interest rates, inflation and recession; and other factors described under the section titled “Risk Factors” in the Company’s Annual Report on Form 10-K filed with the U.S. Securities and Exchange Commission (the “SEC”) by the Company on September 11, 2023, as well as other filings that the Company will make, or has made, with the SEC, such as Quarterly Reports on Form 10-Q and Current Reports on Form 8-K. These factors should not be construed as exhaustive and should be read in conjunction with the other cautionary statements that are included in this press release and in other filings. We expressly disclaim any obligation to publicly update or review any forward-looking statements, whether as a result of new information, future developments or otherwise, except as required by applicable law.
Atlanta, Georgia – June 20, 2024… Gray Television, Inc. (“Gray”) (NYSE: GTN) today announced that it will promote three individuals to new leadership positions effective July 1, 2024, to facilitate the Company’s expanding opportunities with new digital technologies including NextGenTV and Generative Artificial Intelligence.
Mike Braun, our Chief Digital Officer, will be promoted from Senior Vice President to Senior Managing Vice President. Over the past few years, Mike has led the tremendous expansion of Gray Digital Media to encompass the local media operations acquired from Raycom Media, Quincy Media, Meredith Local Media, among others, as well as the rapid deployment of Gray local news, sports, and weather content and related sales products across hundreds of owned and non-owned streaming and ConnectedTV (CTV) platforms. In addition to leading the Company’s digital initiatives, Mike has served as the senior executive overseeing Rockford and Peoria markets and as a member of the boards of directors of Syncbak and Optic Gaming.
Claire Magee Ferguson will become Vice President, Assistant General Counsel and Senior Technology Counsel. Throughout her career, Claire has provided critical legal counsel to the managers of television stations owned by Allbritton Communications, Raycom Media, and, for the past five years, Gray. More recently, Claire has taken the lead on the Company’s privacy initiatives and its AI Policy Committee. Her leadership positioned Gray to be the first broadcaster to publish Guidelines for Use of Generative AI, which ensure that Gray-originated news content is created by our journalists rather than AI. In her new role, Claire will oversee legal and policy matters related to various technology initiatives across the Company, primarily associated with Generative AI and NextGenTV.
Lee Zurik will become Senior Vice President, News Strategy and Innovation. For the past several years, Lee has become one of the nation’s most well-known and awarded investigative journalists through his roles as the Company’s Vice President of Investigations and as the co-host of Gray’s weekday magazine program InvestigateTV+. In this newly created role, Lee will report to Chief Operating Officer Sandy Breland and lead the development and implementation of strategies to expand and leverage Gray-produced content across all linear, digital, CTV, and NextGenTV platforms and manage the responsible use of Generative AI in Gray-produced content. Along with these expanded duties, Lee will continue to oversee Gray’s National Investigative Unit and serve as an anchor and Chief Investigative Reporter at WVUE in New Orleans.
About Gray: Gray Television, Inc. is a multimedia company headquartered in Atlanta, Georgia. Gray is the nation’s largest owner of top-rated local television stations and digital assets. Its television stations serve 114 television markets that collectively reach approximately 36 percent of US television households. This portfolio includes 79 markets with the top-rated television station and 102 markets with the first and/or second highest rated television station. Gray also owns video program companies Raycom Sports, Tupelo Media Group, and PowerNation Studios, as well as the studio production facilities Assembly Atlanta and Third Rail Studios. Gray owns a majority interest in Swirl Films. For more information, please visit www.gray.tv.
Gray Television Contacts: Kevin Latek, Executive Vice President, Chief Legal and Development Officer, 404-266-8333 Sandy Breland, Chief Operating Officer, 404-266-8333