MIAMI, Nov. 09, 2022 (GLOBE NEWSWIRE) — Motorsport Games Inc. (NASDAQ: MSGM) (“Motorsport Games”), a leading racing game developer, publisher and esports ecosystem provider of official motorsport racing series throughout the world, today announced that it is postponing its earnings release and conference call for the third quarter ended September 30, 2022, previously scheduled for November 10, 2022. The Company will issue a press release announcing the new date and time for the postponed earnings call.
About Motorsport Games: Motorsport Games, a Motorsport Network company, is a leading racing game developer, publisher and esports ecosystem provider of official motorsport racing series throughout the world. Combining innovative and engaging video games with exciting esports competitions and content for racing fans and gamers, Motorsport Games strives to make the joy of racing accessible to everyone. The Company is the officially licensed video game developer and publisher for iconic motorsport racing series across PC, PlayStation, Xbox, Nintendo Switch and mobile, including NASCAR, INDYCAR, 24 Hours of Le Mans and the British Touring Car Championship (“BTCC”), as well as the industry leading rFactor 2 and KartKraft simulations. rFactor 2 also serves as the official sim racing platform of Formula E, while also powering F1 Arcade through a partnership with Kindred Concepts. Motorsport Games is an award-winning esports partner of choice for 24 Hours of Le Mans, Formula E, BTCC, the FIA World Rallycross Championship and the eNASCAR Heat Pro League, among others. Motorsport Games is building a virtual racing ecosystem where each product drives excitement, every esports event is an adventure and every story inspires.
Revenue Increased 36% to $43.2 Million Compared to $31.8 Million in Q3 2021 Nine Month Revenue Increased 46% to $119.2 Million Compared to $81.9 Million
Adjusted EBITDA of $15.9 Million, 36.7% of Revenue Nine Month Adjusted EBITDA of $38.7 Million, 32.5% of Revenue
DENVER, Nov. 9, 2022 /CNW/ – Medicine Man Technologies Inc. operating as Schwazze, (OTCQX: SHWZ) (NEO: SHWZ) (“Schwazze” or the “Company”), today announced financial results for the third quarter ended September 30, 2022 (“Q3 2022”).
Q3 2022 Financial Summary:
Revenues of $43.2 million increased 36% compared to $31.8 million in quarter ended September 30, 2021 (“Q3 2021”)
Retail sales were $39.8 million up 92% to $20.7 million when compared to Q3 2021
Gross Margin of $26.0 million, 60.1% of revenue, compared to $15.1 million and 47.3% of revenue in Q3 2021
Net Income was $1.8 million compared to a Net Income of $1.0 million for the same period last year
Adjusted EBITDA of $15.9 million was 36.7% of revenue, compared to $8.8 million for the same period last year
Colorado two year stacked IDs for Q3 2022 compared to Q3 2022 and Q3 2020 for same store sales(1) were (9.7%) and one year IDs(1) were (10.6%) comparing Q3 2022 to Q3 2021
Average basket size (1) for Q3 2022 was $60.96 up slightly by 0.1% compared to Q3 2021
Recorded customer visits (1) for Q3 2022 totaled 452,220 down 10.7%, compared to Q3 2021
New Mexico two year stacked IDs for Q3 2022 compared to Q3 2021 and Q3 2020 for same store sales(1) were 52.9% and one year IDs(1) were 48.4% comparing Q3 2022 to Q3 2021
Average basket size (1) for Q3 2022 was $52.67 down 12.2% compared to Q3 2021
Recorded customer visits (1) for Q3 2022 totaled 231,137 up 69.0%, compared to Q3 2021
Corporate Update: Since December 2021, Schwazze has closed acquisitions adding 15 cannabis dispensaries, 10 in New Mexico and five in Colorado as well as four cultivation facilities in New Mexico and one in Colorado and one manufacturing asset in New Mexico. This year Schwazze has opened two new dispensaries in New Mexico. This brings our total dispensary count to 35 between Colorado and New Mexico.
Justin Dye, Chairman and CEO of Schwazze stated, “I am proud of the entire Schwazze team, and I would like to thank them for their hard work this past quarter and year. Despite a challenging economic backdrop, we outperformed our markets in Colorado by 12%. We’ve worked hard to continue to grow our market share, increase our profitability rate and generate free cash flow from operations, after paying taxes and CAPEX, placing us in an exclusive club within the cannabis sector. This is a proof point that we are well on our way to building Schwazze into a unique regional powerhouse. I believe our distinctive operating capabilities, applied to attractive growth opportunities within our sector, will reward our shareholders with attractive risk adjusted returns. The potential of favorable regulatory reform in the near-term would obviously accelerate and amplify those returns.”
Q3 2022 Revenue Revenues for the three months ended September 30, 2022 totaled $43,190,986, including (i) retail sales of $39,759,734 (ii) wholesale sales of $3,335,252 and (iii) other operating revenues of $96,000, compared to revenues of $31,835,305, including (i) retail sales of $20,741,864, (ii) wholesale sales of $11,022,519, and (iii) other operating revenues of $70,922 during the three months ended September 30, 2021, representing an increase of $11,355,681 or 36%. The most influential factor driving revenue increases in the third quarter of 2022 as compared to the same period in 2021 is acquisition activity. Revenue for the quarter ended September 30, 2022 included revenue from four consummated acquisitions in Colorado and revenue from the Company’s initial entrance into the New Mexico market with the acquisition of R. Greenleaf, which were not in revenue for the same period in 2021. Revenue from wholesale sales decreased, due in large part to continued pricing pressure in the Colorado wholesale market as a result of supply saturation in flower and bulk distillate products.
Cost of goods and services for the three months ended September 30, 2022, totaled $17,226,451 compared to cost of goods and services of $16,779,313 during the three months ended September 30, 2021, representing an increase of $447,138 or 3%. Overall cost of goods and services increased due to the same acquisition activities that generated substantial increases in revenue, but the rate at which cost of goods and services increases from acquisition activity occurs at a lower rate than increases in revenue from acquisition activity due to lower wholesale flower pricing in Colorado and substantial vertical integration in New Mexico and increased retail revenue, which has better gross margin, as a percentage of the total revenue.
Gross profit was $25,964,535 million dollars for the quarter compared to $15,055,992 during the same period in 2021. Gross profit margin increased as a percentage of revenue from 47.3% to 60.1%. This positive result reflects a higher percentage of retail sales, our consolidated purchasing approach, the implementation of our retail playbook, and vertical product sales in New Mexico.
Operating expenses for the quarter, totaled $14,849,677, compared to operating expenses of $11,218,992 during the same quarter 2021, representing an increase of $3,630,685 or 32%. This increase is due to increased selling, general and administrative expenses, professional service fees, salaries, benefits and related employment costs driven by growth from acquisitions offset by stock-based compensation.
Other expense, net for the three months ended September 30, 2022 totaled $3,712,108 compared to $1,555,427 during the three months ended September 30, 2021, representing an increase in other expense of $2,156,681 or 139%. The increase in other expenses is due to higher interest payments due on the Company’s debt obligations as a result of compounding interest with the passage of time and higher debt balances, which was partially offset this quarter by the revaluation of the derivative liability related to the Investor Notes issued in December 2021 that was recognized as income in the three months ended September 30, 2022.
Adjusted EBITDA for Q3 2022 was $15,860,466 representing 36.7% of revenue, compared to $8,797,641 and 27.6% of revenue for the same period last year. This is derived from Operating Income and adjusting one-time expenses, merger and acquisition and capital raising costs, non-cash related compensation costs, and depreciation and amortization. See the financial table for Adjusted EBITDA below adjustment for details.
For nine months ending September 30, 2022, the Company used cash for operations of $3,957,263 compared to generating cash of $4,814,104 for the same period in 2021. The Company has cash and cash equivalents of $38.7 million at the end of Q3 2022.
Nancy Huber, CFO for Schwazze commented, “During the third quarter we continued our focus on reducing operating and SG&A expenses. Our third quarter gross margin and operating expenses improved over the second quarter in both dollars and percent of revenue. Our balance sheet remains strong, with ample liquidity. We continue to be committed to delivering positive cash flow before acquisition costs for the year while driving organic growth with the opening of two stores in New Mexico in the third quarter.”
2022 Guidance The Company is providing guidance for the fiscal year. FY 2022 revenue is projected to be $155 million to $165 million, and the FY 2022 adjusted EBITDA is projected to be from $51 million to $56 million. We are on target to deliver the lower end of the range for adjusted EBITDA which was a fourth quarter annualized run-rate of $60-72 million dollars. We expect to be slightly below the projected revenues which was a fourth quarter annualized run-rate of $175 million to $200 million. This lower-than-expected revenue in Q4 is due to lower than expected wholesale sales, and construction delays in new store openings in New Mexico.
The company generated $4 million in cash from operations in the third quarter and expects to generate positive cash flow before acquisitions for the year.
NOTES:
(1)
Schwazze did not own all the assets and entities in part of 2021, 2020 and 2019 and is using unaudited numbers for this comparison.
Adjusted EBITDA represents income (loss) from operations, as reported, before tax, adjusted to exclude non-recurring items, other non-cash items, including stock-based compensation expense, depreciation, and amortization, and further adjusted to remove acquisition and capital raise related costs, and other one-time expenses, such as severance, retention, and employee relocation. The Company uses adjusted EBITDA as it believes it better explains the results of its core business. The Company has not reconciled guidance for adjusted EBITDA to the corresponding GAAP financial measure because it cannot provide guidance for the various reconciling items. The Company is unable to provide guidance for these reconciling items because it cannot determine their probable significance, as certain items are outside of its control and cannot be reasonably predicted. Accordingly, a reconciliation to the corresponding GAAP financial measure is not available without unreasonable effort.
Webcast – November 9, 2022 – 5:00 PM EDT Investors and stakeholders may participate in the conference call by dialing 416-764-8650 or by dialing North American toll free 1-888-664-6383 or listen to the webcast from the Company’s website at https://ir.schwazze.com The webcast will be available on the Company’s website and on replay until November 16, 2022, and may be accessed by dialing 1-888-390-0541 / 997573 #.
Following their prepared remarks, Chief Executive Officer, Justin Dye; President, Nirup Krishnamurthy; and Chief Financial Officer, Nancy Huber will answer investor questions. Investors may submit questions in advance or during the conference call itself through the weblink: https://app.webinar.net/x0q6rpnP84n. This weblink has been posted to the Company’s website and will be archived on the website. All Company SEC filings can also be accessed on the Company website at https://ir.schwazze.com/sec-filings
About Schwazze Schwazze (OTCQX: SHWZ, NEO: SHWZ) is building a premier vertically integrated regional cannabis company with assets in Colorado and New Mexico and will continue to take its operating system to other states where it can develop a differentiated regional leadership position. Schwazze is the parent company of a portfolio of leading cannabis businesses and brands spanning seed to sale. The Company is committed to unlocking the full potential of the cannabis plant to improve the human condition. Schwazze is anchored by a high-performance culture that combines customer-centric thinking and data science to test, measure, and drive decisions and outcomes. The Company’s leadership team has deep expertise in retailing, wholesaling, and building consumer brands at Fortune 500 companies as well as in the cannabis sector. Schwazze is passionate about making a difference in our communities, promoting diversity and inclusion, and doing our part to incorporate climate-conscious practices. Medicine Man Technologies, Inc. was Schwazze’s former operating trade name. The corporate entity continues to be named Medicine Man Technologies, Inc. Schwazze derives its name from the pruning technique of a cannabis plant to enhance plant structure and promote healthy growth.
Forward-Looking Statements Such forward-looking statements may be preceded by the words “plan,” “will,” “may,” “continue,” “anticipate,” “become,” “build,” “develop,” “expect,” “believe,” “poised,” “project,” “approximate,” “could,” “potential,” or similar expressions as they relate to Schwazze. Forward-looking statements include the guidance provided regarding the Company’s Q4 2022 performance and annual capital spending. Forward-looking statements are not guarantees of future events or performance, are based on certain assumptions, and are subject to various known and unknown risks and uncertainties, many of which are beyond the Company’s control and cannot be predicted or quantified. Consequently, actual events and results may differ materially from those expressed or implied by such forward-looking statements. Such risks and uncertainties include, without limitation, risks and uncertainties associated with (i) our inability to manufacture our products and product candidates on a commercial scale on our own or in collaboration with third parties; (ii) difficulties in obtaining financing on commercially reasonable terms; (iii) changes in the size and nature of our competition; (iv) loss of one or more key executives or scientists; (v) difficulties in securing regulatory approval to market our products and product candidates; (vi) our ability to successfully execute our growth strategy in Colorado and New Mexico and outside the states, (vii) our ability to identify and consummate future acquisitions that meet our criteria, (viii) our ability to successfully integrate acquired businesses and realize synergies therefrom, (ix) the ongoing COVID-19 pandemic, * the timing and extent of governmental stimulus programs, (xi) the uncertainty in the application of federal, state and local laws to our business, and any changes in such laws, and (xii) our ability to achieve the target metrics, including our annualized revenue and EBIDTA run rates set out in our Q4 2022 guidance. More detailed information about the Company and the risk factors that may affect the realization of forward-looking statements is set forth in the Company’s filings with the Securities and Exchange Commission (SEC), including the Company’s Annual Report on Form 10-K and its Quarterly Reports on Form 10-Q. Investors and security holders are urged to read these documents free of charge on the SEC’s website at http://www.sec.gov. The Company assumes no obligation to publicly update or revise its forward-looking statements as a result of new information, future events or otherwise except as required by law.
MIAMI, Nov. 09, 2022 (GLOBE NEWSWIRE) — Motorsport Games Inc. (NASDAQ: MSGM) (“Motorsport Games” or the “Company”) announced today that the 1-for-10 reverse stock split of the Company’s Class A and Class B common stock will become effective as of 12:01 a.m. EST on November 10, 2022 (the “Effective Time”).
Motorsport Games is effecting the reverse stock split by filing a charter amendment with the Delaware Secretary of State. The reverse stock split was previously approved by the Company’s Board of Directors and stockholders pursuant to Sections 228 and 242 of the Delaware General Corporation Law.
The Company’s Class A common stock will begin trading on the NASDAQ on a split-adjusted basis when the market opens tomorrow, November 10, 2022, under a new CUSIP number, 62011B 201.
As a result of the reverse stock split, each 10 shares of the Company’s Class A and Class B common stock issued and outstanding immediately prior to the Effective Time will be automatically combined into 1 share of Class A common stock and Class B common stock, respectively, subject to the elimination of fractional shares, as described below.
The same 1-for-10 reverse stock split ratio is being used to effect the reverse stock split of both Motorsport Games Class A and Class B common stock, and accordingly, all stockholders will be affected proportionately. The reverse stock split will reduce the Company’s issued and outstanding shares of common stock from approximately 11,673,587 shares of Class A common stock and 7,000,000 shares of Class B common stock to approximately 1,167,358 and 700,000 shares, respectively.
The number of shares of Class A common stock subject to the Company’s outstanding employee and director stock options, as well as the relevant exercise price per share, will be proportionately adjusted to reflect the reverse stock split. Accordingly, the approximately 821,962 outstanding stock options will be reduced to approximately 82,196 outstanding stock options. The number of shares authorized for issuance under the Company’s stock plan also will be reduced from 1,000,000 shares of Class A common stock to 100,000 shares of Class A common stock using the same 1-for-10 split ratio.
Motorsport Games has retained its transfer agent, Worldwide Stock Transfer, LLC (“WST”), to act as exchange agent for the reverse stock split. WST will manage the exchange of old, pre-reverse stock split shares for new post-split shares. Stockholders who hold their shares in “street name” will be contacted by their banks or brokers with any instructions. For further information, stockholders and securities brokers should contact WST at (201) 820-2008.
Motorsport Games will not issue any fractional shares of its Class A or Class B common stock as a result of the reverse stock split. Instead, as soon as practicable after the Effective Time, WST will distribute payments to the record holders’ respective accounts pro rata in lieu of fractional shares based on the applicable NASDAQ closing trading price. Stockholders will not be entitled to receive interest for the period of time between the Effective Time and the date the stockholder receives their cash payment, if any, in lieu of fractional shares.
Upon the Effective Time, each certificate, if any representing shares of Motorsport Games common stock immediately prior to the reverse stock split will be deemed to represent the number of full shares of common stock resulting from the reverse stock split. Stockholders holding their shares in book entry form are not required to take any action, as their shares will be adjusted directly by WST.
FORWARD-LOOKING STATEMENTS
Certain statements in this press release which are not historical facts are forward-looking statements within the meaning of Section 27A of the Securities Act of 1933, as amended, and Section 21E of the Securities Exchange Act of 1934, as amended, and are provided pursuant to the safe harbor provisions of the Private Securities Litigation Reform Act of 1995. Any statements in this press release that are not statements of historical fact may be deemed forward-looking statements. Words such as “continue,” “will,” “may,” “could,” “should,” “expect,” “expected,” “plans,” “intend,” “anticipate,” “believe,” “estimate,” “predict,” “potential,” and similar expressions are intended to identify such forward-looking statements. All forward-looking statements involve significant risks and uncertainties that could cause actual results to differ materially from those expressed or implied in the forward-looking statements, many of which are generally outside the control of Motorsport Games and are difficult to predict. Examples of such risks and uncertainties include, without limitation, unexpected developments with respect to the reverse stock split, including, without limitation, future decreases in the price of the Company’s Class A common stock whether due to, among other things, the announcement of the reverse stock split, the Company’s inability to make its Class A common stock more attractive to a broader range of institutional or other investors. Additional factors that could cause actual results to differ materially from those expressed or implied in the forward-looking statements can be found in Motorsport Games’ filings with the SEC, including its Annual Report on Form 10-K for the fiscal year ended December 31, 2021, its Quarterly Reports on Form 10-Q filed with the SEC during 2022, as well as in its subsequent filings with the SEC. Motorsport Games anticipates that subsequent events and developments may cause its plans, intentions and expectations to change. Motorsport Games assumes no obligation, and it specifically disclaims any intention or obligation, to update any forward-looking statements, whether as a result of new information, future events or otherwise, except as expressly required by law. Forward-looking statements speak only as of the date they are made and should not be relied upon as representing Motorsport Games’ plans and expectations as of any subsequent date.
Website and Social Media Disclosure:
Investors and others should note that we announce material financial information to our investors using our investor relations website (ir.motorsportgames.com), SEC filings, press releases, public conference calls and webcasts. We use these channels, as well as social media and blogs, to communicate with our investors and the public about our company and our products. It is possible that the information we post on our websites, social media and blogs could be deemed to be material information. Therefore, we encourage investors, the media and others interested in our company to review the information we post on the websites, social media channels and blogs, including the following (which list we will update from time to time on our investor relations website):
Websites
Social Media
motorsportgames.com
Twitter: @msportgames & @traxiongg
traxion.gg
Instagram: msportgames &traxiongg
motorsport.com
Facebook: Motorsport Games &traxiongg
LinkedIn: Motorsport Games
Twitch: traxiongg
Reddit: traxiongg
The contents of these websites and social media channels are not part of, nor will they be incorporated by reference into, this press release.
SASKATOON, Saskatchewan, Canada, November 9, 2022 – MustGrow Biologics Corp. (CSE: MGRO; OTCQB: MGROF; FRA: 0C0) (the “Company” or “MustGrow”), is pleased to announce that the TSX Venture Exchange (“TSXV“) has approved the Company’s application to list its common shares (the “Shares“) on the TSXV. The Shares will commence trading on the TSXV under the ticker symbol “MGRO” at the opening of the Market on November 11, 2022. Shareholders will not be required to take any action in connection with MustGrow’s listing on the TSXV. The Shares will also continue to be listed on the OTCQB Marketplace in the United States under the symbol “MGROF” and on the Frankfurt Stock Exchange under the symbol “0C0”.
In connection with the listing of the Shares on the TSXV, the Company has submitted a request to voluntarily delist the Shares from the Canadian Securities Exchange (“CSE“). The last day of trading of the Company’s shares on the CSE will be November 10, 2022.
For further details, please refer to the Listing Application on the Company’s SEDAR profile available at www.sedar.com.
———
About MustGrow
MustGrow is an agriculture biotech company developing organic biopesticides and bioherbicides by harnessing the natural defense mechanism of the mustard plant to protect the global food supply from diseases, insect pests, and weeds. MustGrow and its leading global partners – Janssen PMP (pharmaceutical division of Johnson & Johnson), Bayer, Sumitomo Corporation, and Univar Solutions’ NexusBioAg – are developing mustard-based organic solutions to potentially replace harmful synthetic chemicals. Over 150 independent tests have been completed, validating MustGrow’s safe and effective approach to crop and food protection. Pending regulatory approval, MustGrow’s patented liquid products could be applied through injection, standard drip, or spray equipment, improving functionality and performance features. Now a platform technology, MustGrow and its global partners are pursuing applications in several different industries from preplant soil treatment and weed control, to postharvest disease control and food preservation. MustGrow has approximately 49.7 million basic common shares issued and outstanding and 55.6 million shares fully diluted. For further details, please visit www.mustgrow.ca.
Certain statements included in this news release constitute “forward-looking statements” which involve known and unknown risks, uncertainties and other factors that may affect the results, performance or achievements of MustGrow.
Generally, forward-looking information can be identified by the use of forward-looking terminology such as “plans”, “expects”, “is expected”, “budget”, “estimates”, “intends”, “anticipates” or “does not anticipate”, or “believes”, or variations of such words and phrases or statements that certain actions, events or results “may”, “could”, “would”, “might”, “occur” or “be achieved”. Examples of forward-looking statements in this news release include statements MustGrow makes regarding the anticipated date of the commencement of trading of the Company’s Shares on the TSXV.
Forward-looking statements are subject to a number of risks and uncertainties that may cause the actual results of MustGrow to differ materially from those discussed in such forward-looking statements, and even if such actual results are realized or substantially realized, there can be no assurance that they will have the expected consequences to, or effects on, MustGrow. Important factors that could cause MustGrow’s actual results and financial condition to differ materially from those indicated in the forward-looking statements include, among others, the following: (i) the preferences and choices of agricultural regulators with respect to product approval timelines; (ii) the ability of MustGrow’s partners to meet obligations under their respective agreements; and (iii) other risks described in more detail in MustGrow’s Annual Information Form for the year ended December 31, 2021 and other continuous disclosure documents filed by MustGrow with the applicable securities regulatory authorities which are available at www.sedar.com. Readers are referred to such documents for more detailed information about MustGrow, which is subject to the qualifications, assumptions and notes set forth therein.
This release does not constitute an offer for sale of, nor a solicitation for offers to buy, any securities in the United States.
Neither the CSE, the TSXV, nor their Regulation Services Provider (as that term is defined in the policies of the CSE and TSXV), nor the OTC Markets has approved the contents of this release or accepts responsibility for the adequacy or accuracy of this release.
HOUSTON, Nov. 09, 2022 (GLOBE NEWSWIRE) — Orion Group Holdings, Inc. (NYSE: ORN) (the “Company”), a leading specialty construction company, today announced a contract award for its Concrete segment valued at over $40 million.
Under this contract, the Company will construct a 40-story multi-family residential building in the Houston area, beginning in Q1 2023 with expected completion in Q3 2024. The team will perform construction of the mat foundation, an interior stair and elevator core, forming and placing concrete of the elevated structure, along with placement of rebar. The building includes a nine-story parking structure, 30 stories of living space, and an amenity level with an outdoor terrace. One of the company’s tower cranes will be supporting the construction of the project.
This contract along with other contract awards in Q3 totaling $128M, comprised of $53M in Concrete and $75M in Marine, will be completed throughout 2023 and 2024.
“Our recent success winning work across all segments will help set us up for a stronger 2023 and beyond,” said Travis Boone, Orion’s President and Chief Executive Officer. “We are continuing to expand our client base and focus on our key markets in both Marine and Concrete.”
About Orion Group Holdings Orion Group Holdings, Inc., a leading specialty construction company serving the infrastructure, industrial and building sectors, provides services both on and off the water in the continental United States, Alaska, Canada and the Caribbean Basin through its marine segment and its concrete segment. The Company’s marine segment provides construction and dredging services relating to marine transportation facility construction, marine pipeline construction, marine environmental structures, dredging of waterways, channels and ports, environmental dredging, design, and specialty services. Its concrete segment provides turnkey concrete construction services including pour and finish, dirt work, layout, forming, rebar, and mesh across the light commercial, structural and other associated business areas. The Company is headquartered in Houston, Texas with regional offices throughout its operating areas.
Forward-Looking Statements The matters discussed in this press release may constitute or include projections or other forward-looking statements within the meaning of the Private Securities Litigation Reform Act of 1995, the provisions of which the Company is availing itself. Certain forward-looking statements can be identified by the use of forward-looking terminology, such as ‘believes’, ‘expects’, ‘may’, ‘will’, ‘could’, ‘should’, ‘seeks’, ‘approximately’, ‘intends’, ‘plans’, ‘estimates’, or ‘anticipates’, or the negative thereof or other comparable terminology, or by discussions of strategy, plans, objectives, intentions, estimates, forecasts, outlook, assumptions, or goals. In particular, statements regarding future operations or results, including those set forth in this press release and any other statement, express or implied, concerning future operating results or the future generation of or ability to generate revenues, income, net income, profit, EBITDA, EBITDA margin, or cash flow, including to service debt, and including any estimates, forecasts or assumptions regarding future revenues or revenue growth, are forward-looking statements. Forward looking statements also include estimated project start date, anticipated revenues, and contract options which may or may not be awarded in the future. Forward looking statements involve risks, including those associated with the Company’s fixed price contracts that impacts profits, unforeseen productivity delays that may alter the final profitability of the contract, cancellation of the contract by the customer for unforeseen reasons, delays or decreases in funding by the customer, levels and predictability of government funding or other governmental budgetary constraints and any potential contract options which may or may not be awarded in the future, and are the sole discretion of award by the customer. Past performance is not necessarily an indicator of future results. In light of these and other uncertainties, the inclusion of forward-looking statements in this press release should not be regarded as a representation by the Company that the Company’s plans, estimates, forecasts, goals, intentions, or objectives will be achieved or realized. Readers are cautioned not to place undue reliance on these forward-looking statements, which speak only as of the date hereof. The Company assumes no obligation to update information contained in this press release whether as a result of new developments or otherwise.
Please refer to the Company’s Annual Report on Form 10-K, filed on March 7, 2022, which is available on its website at www.oriongroupholdingsinc.com or at the SEC’s website at www.sec.gov, for additional and more detailed discussion of risk factors that could cause actual results to differ materially from our current expectations, estimates or forecasts.
CALGARY, Alberta, Nov. 09, 2022 (GLOBE NEWSWIRE) — InPlay Oil Corp. (TSX: IPO) (OTCQX: IPOOF) (“InPlay” or the “Company”) announces its record setting financial and operating results for the three and nine months ended September 30, 2022 and the implementation of an inaugural base dividend. The implementation of the inaugural base dividend is a significant milestone in the Company’s strategy of providing additional strong returns to shareholders through the return of capital along with the generation of free adjusted funds flow (“FAFF”)(4) and top-tier light oil weighted production per share growth which has been made possible by the Company’s strong financial and operational position.
InPlay’s condensed unaudited interim financial statements and notes, as well as Management’s Discussion and Analysis (“MD&A”) for the three and nine months ended September 30, 2022 will be available at “www.sedar.com” and our website at “www.inplayoil.com”. An updated presentation will be posted to our website in due course.
Inaugural Base Dividend
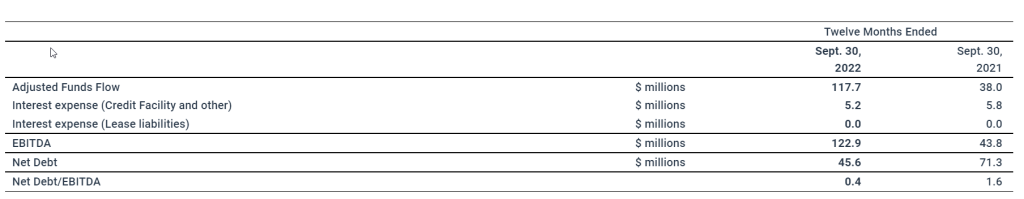
InPlay is pleased to announce that its Board of Directors has approved the implementation of a base cash dividend of $0.015/share per month. The initial dividend is payable on November 30, 2022 to holders of the Company’s common shares of record at the close of business on November 18, 2022. The Company continues to make strong progress with respect to its debt reduction targets with a trailing 12 month net debt(2) to earnings before interest, taxes and depletion (“EBITDA”) ratio(4) of less than 0.4x at the end of the third quarter, which is forecast to be approximately 0.1x to 0.2x at year end (inclusive of the monthly base dividend). Any dividend payment after the initial one will be subject to the approval of InPlay’s Board of Directors at the time of declaration.
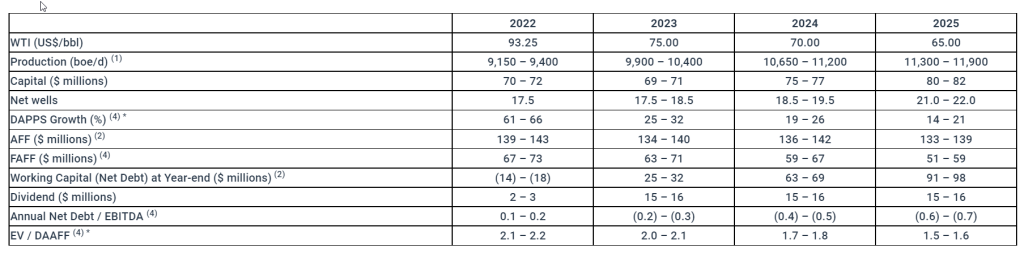
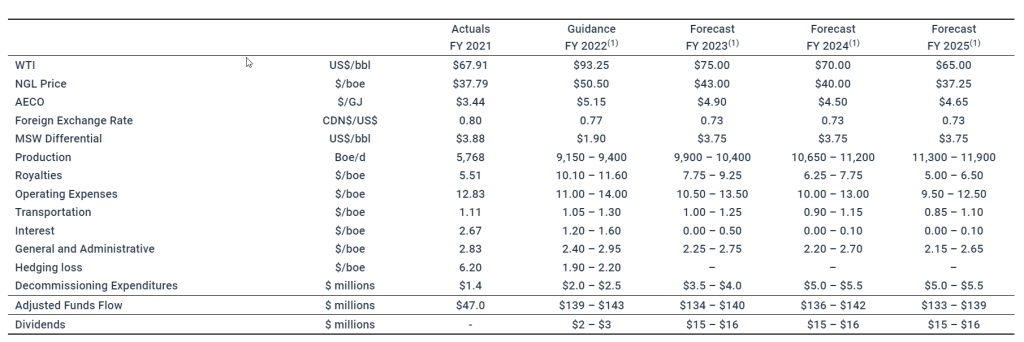
In determining the initial base dividend rate, InPlay’s Board of Directors took into account the Company’s strong balance sheet and the sustainability of the dividend in the event of a significant drop in commodity prices. In accordance with the recently released long term forecast, the Company projects that the base dividend is sustainable in a flat US$55/bbl WTI price environment in 2023 through 2025 with net debt to EBITDA levels remaining below 0.3x. Using forward strip pricing, as disclosed in our long term forecast announced on Sept 28, 2022 (which is approximately USD $5 – $7 per barrel lower than current WTI forward strip pricing), the Company is forecasting strong FAFF resulting in a build in our positive working capital balance (inclusive of capital expenditures and the monthly base dividend) to $91 – $98 million through the end of 2025 as outlined in greater detail in the “Outlook” section below. Over time, the Company anticipates that excess FAFF will be used for special dividends, share buybacks, tactical capital investment and strategic acquisitions.
The monthly cash dividend is expected to be designated as an “eligible dividend” for Canadian federal and provincial income tax purposes.
Third Quarter 2022 Financial & Operating Highlights
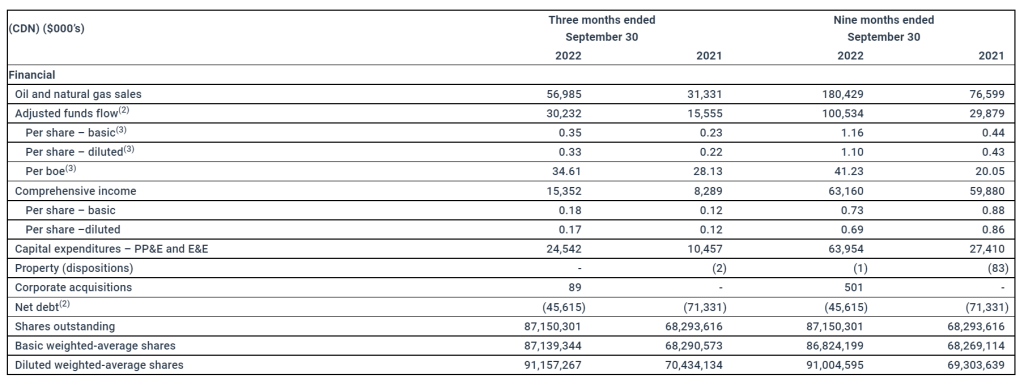
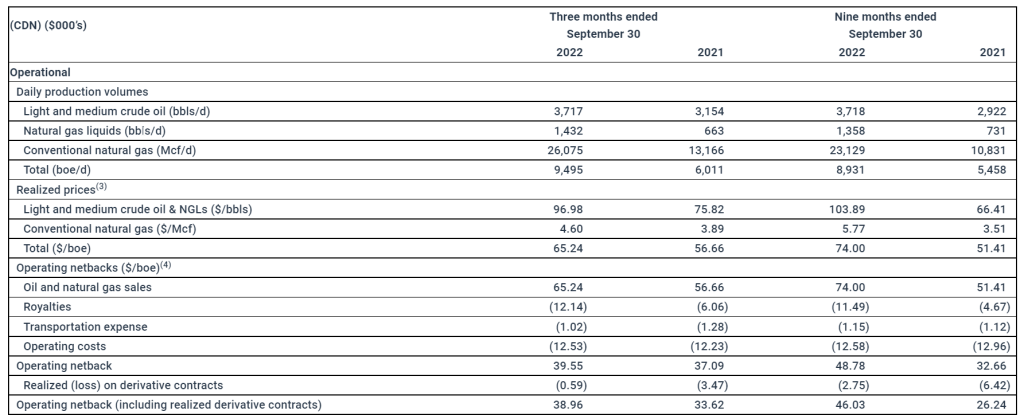
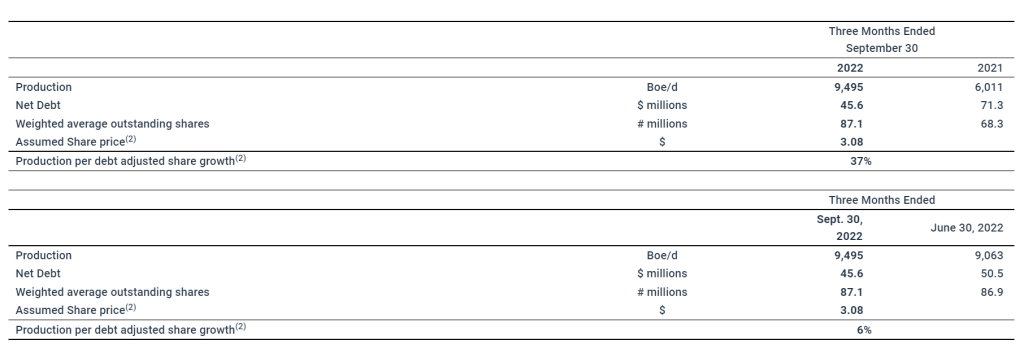
Achieved record average quarterly production of 9,495 boe/d(1) (54% light crude oil and NGLs), an increase of 58% from third quarter production in 2021 of 6,011 boe/d(1) (64% light crude oil and NGLs) and an increase of 5% compared to our previous record of 9,063 boe/d(1) (57% light crude oil and NGLs) in the second quarter of 2022. Average production per weighted average basic share increased 24% compared to the third quarter of 2021 (37% on a debt adjusted(4) basis) and 4% compared to the second quarter of 2022 (6% on a debt adjusted basis).
Generated quarterly adjusted funds flow (“AFF”)(2) of $30.2 million ($0.35 per weighted average basic share(3)), an increase of 94% compared to $15.6 million ($0.23 per weighted average basic share) in the third quarter of 2021. On a year-to-date basis, generated AFF of $100.5 million ($1.16 per weighted average basic share(3)), an increase of 236% compared to $29.9 million ($0.44 per weighted average basic share) in 2021.
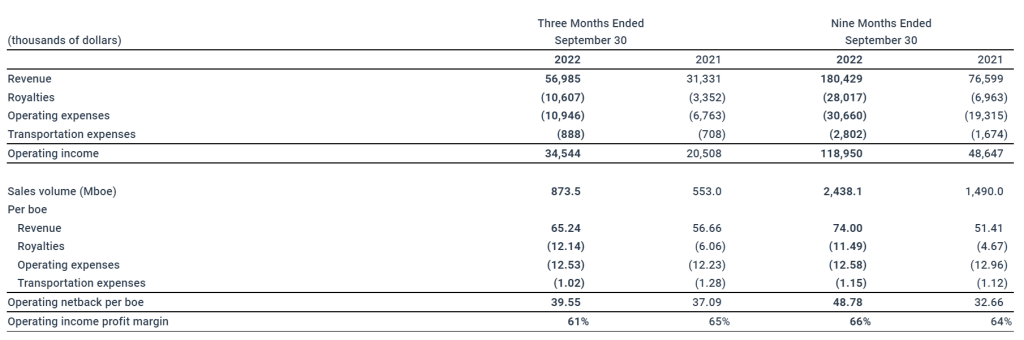
Increased operating netbacks(4) on a year to date basis by 49% to $48.78/boe from $32.66/boe in 2021.
Realized quarterly operating income(4) of $34.5 million, an increase of 68% compared to $20.5 million in the third quarter of 2021. On a year-to-date basis, realized quarterly operating income $119.0 million, an increase of 145% compared to $48.6 million in 2021.
Maintained operating expenses at $12.53/boe compared to $12.23/boe in the third quarter of 2021 and $12.28/boe in the second quarter of 2022, despite rising costs of industry services as well as fuel and energy costs.
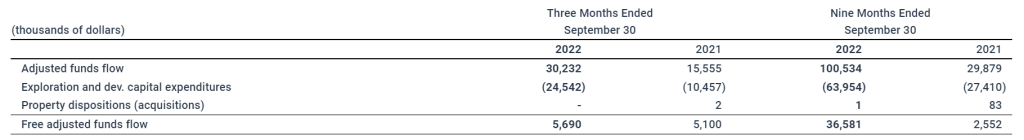
Generated FAFF of $5.7 million resulting in a 10% reduction to net debt from June 30, 2022 with the majority of 2022 annual capital expenditures already incurred. Strong FAFF and resulting debt reductions are expected to accumulate throughout the fourth quarter (inclusive of the monthly base dividend).
Achieved a trailing twelve month net debt to EBITDA ratio of less than 0.4x to September 30, 2022 with a ratio of between 0.1x to 0.2x forecasted by year end (inclusive of the monthly base dividend).
Realized net income of $15.4 million ($0.18 per basic share; $0.17 per diluted share). On a year-to-date basis, realized net income of $63.2 million ($0.73 per basic share; $0.69 per diluted share).
Financial and Operating Results
Third Quarter 2022 Financial & Operations Overview
Production averaged 9,495 boe/d(1) (54% light crude oil & NGLs) of sales in the third quarter of 2022, the sixth consecutive quarter that the Company has increased its quarterly production record. Quarterly production increased by 58% compared to 6,011 boe/d(1) (64% light crude oil & NGLs) in the third quarter of 2021 and 5% compared to 9,063 boe/d(1) (57% light crude oil & NGLs) in the second quarter of 2022, our previous quarterly record. This resulted in $30.2 million of AFF generated during the third quarter of 2022 and $5.7 million of FAFF which has reduced net debt levels by 10% to $45.6 million at September 30, 2022. On a year-to-date basis, the Company has generated AFF of $100.5 million and FAFF of $36.6 million resulting in a 43% reduction to net debt from December 31, 2021. Liquidity ratios to the end of the quarter continued to improve resulting in a trailing twelve month net debt to EBITDA ratio of less than 0.4x to September 30, 2022.
InPlay’s capital program for the third quarter of 2022 consisted of $24.5 million of capital expenditures. During the quarter, the Company completed and brought on production two (1.9 net) Extended Reach Horizontal (“ERH”) wells in Willesden Green that were drilled in the second quarter. Also in Willesden Green, the Company drilled, completed and brought on production three (2.9 net) ERH wells. Drilling operations were completed on an additional two (1.9 net) ERH wells in Willesden Green during the third quarter and these wells were brought on production in October. The Company also allocated capital to the construction of two Vapor Recovery Units which will increase gas conservation and reduce greenhouse gas emissions.
Efficient field operations and increased production levels allowed the Company to limit operating cost increases, achieving operating costs of $12.53/boe compared to $12.23/boe in the third quarter of 2021 and $12.28/boe in the second quarter of 2022. The Company continues to focus on operational efficiency and is proactive in reducing the impact of the inflationary pressures and supply chain disruptions that are impacting the oil and gas industry. This resulted in strong operating income and operating netbacks during the quarter of $34.5 million and $39.55/boe respectively.
Outlook
InPlay began its fourth quarter capital program drilling one (0.95 net) ERH well in Willesden Green which was brought on production in late October and is flowing without artificial lift and the start of drilling operations with our first two (2.0 net) Belly River wells. InPlay utilized the technologies and expertise developed in our Cardium play over the years to complete these Belly River drills in 5.4 and 5.6 days respectively. This was a dramatic improvement compared to our most recent two one-mile drilling operations in the area in 2016 averaging approximately 10 days per well and approximately 2.5 days quicker than recent one-mile wells drilled in the area by other operators.
Given the continued strong operational results and positive future commodity prices, the Company reiterates its 2022 guidance and long-term forecast as released September 27, 2022 with the incorporation of the base dividend. The Company remains committed to providing top-tier production per share growth and a return of capital to shareholders. This base dividend and the recently implemented share buyback program in addition to our forecasted measured production per share growth places InPlay in a solid position to continue realizing on meaningful returns to shareholders over the long term.
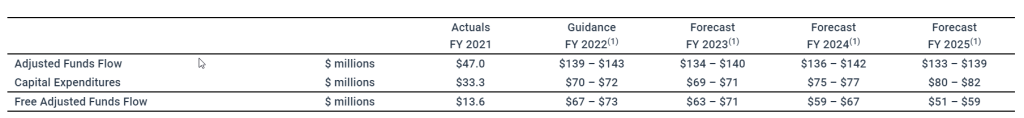
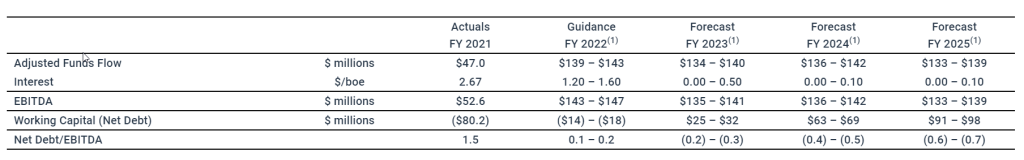
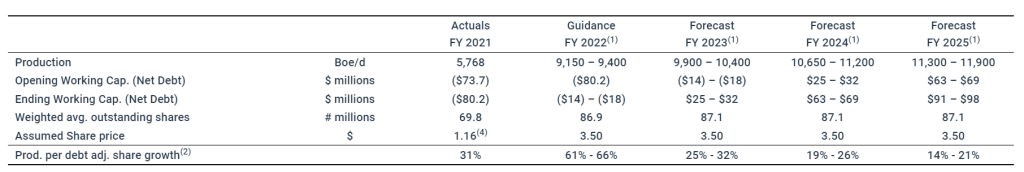
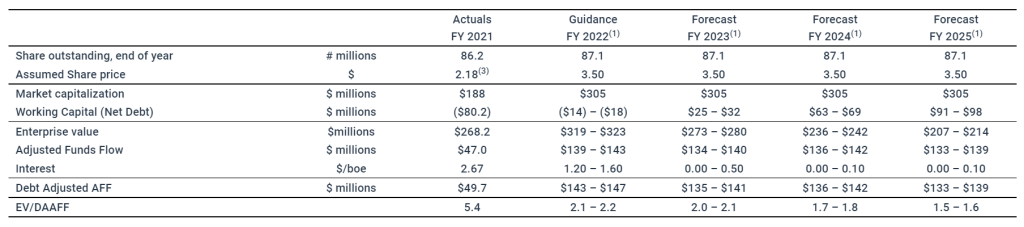
The table below reiterates the highlights of our 2022 guidance and long-term forecast at our current share price, including the impact of our inaugural base dividend:
* Assumes a $3.50 share price
The amounts above do not include potential future purchases through the Company’s normal course issuer bid (“NCIB”).
As outlined above in the long term forecast, the Company is forecasting to generate material FAFF resulting in a growing positive working capital balance through to 2025. Our strategy for the accumulating additional FAFF is to provide additional means for returns to shareholders through dividends, share buybacks, increased tactical capital investment and accretive strategic acquisitions.
InPlay is pleased to achieve this significant milestone of implementing our inaugural base dividend and would like to thank our employees, board members, lenders and shareholders for their support. The Company looks forward to releasing our 2023 budget outlining our capital program for the year in early January.
Doug Bartole President and Chief Executive Officer InPlay Oil Corp. Telephone: (587) 955-0632
See “Production Breakdown by Product Type” at the end of this press release.
Capital management measure. See “Non-GAAP and Other Financial Measures” contained within this press release.
Supplementary financial measure. See “Non-GAAP and Other Financial Measures” contained within this press release.
Non-GAAP financial measure or ratio that does not have a standardized meaning under International Financial Reporting Standards (IFRS) and GAAP and therefore may not be comparable with the calculations of similar measures for other companies. Please refer to “Non-GAAP and Other Financial Measures” contained within this press release.
Reader Advisories
Non-GAAP and Other Financial Measures
Throughout this press release and other materials disclosed by the Company, InPlay uses certain measures to analyze financial performance, financial position and cash flow. These non-GAAP and other financial measures do not have any standardized meaning prescribed under GAAP and therefore may not be comparable to similar measures presented by other entities. The non-GAAP and other financial measures should not be considered alternatives to, or more meaningful than, financial measures that are determined in accordance with GAAP as indicators of the Company performance. Management believes that the presentation of these non-GAAP and other financial measures provides useful information to shareholders and investors in understanding and evaluating the Company’s ongoing operating performance, and the measures provide increased transparency and the ability to better analyze InPlay’s business performance against prior periods on a comparable basis.
Non-GAAP Financial Measures and Ratios
Included in this document are references to the terms “free adjusted funds flow”, “operating income”, “operating netback per boe”, “operating income profit margin”, “Net Debt to EBITDA” and “Debt adjusted production per share”. Management believes these measures and ratios are helpful supplementary measures of financial and operating performance and provide users with similar, but potentially not comparable, information that is commonly used by other oil and natural gas companies. These terms do not have any standardized meaning prescribed by GAAP and should not be considered an alternative to, or more meaningful than “profit (loss) before taxes”, “profit (loss) and comprehensive income (loss)”, “adjusted funds flow”, “capital expenditures”, “corporate acquisitions, net of cash acquired”, “net debt”, “weighted average number of common shares (basic)” or assets and liabilities as determined in accordance with GAAP as a measure of the Company’s performance and financial position.
Free Adjusted Funds Flow
Management considers FAFF an important measure to identify the Company’s ability to improve its financial condition through debt repayment and its ability to provide returns to shareholders. FAFF should not be considered as an alternative to or more meaningful than AFF as determined in accordance with GAAP as an indicator of the Company’s performance. FAFF is calculated by the Company as AFF less exploration and development capital expenditures and property dispositions (acquisitions) and is a measure of the cashflow remaining after capital expenditures before corporate acquisitions that can be used for additional capital activity, corporate acquisitions, repayment of debt or decommissioning expenditures or potentially return of capital to shareholders. Refer below for a calculation of historical FAFF and to the “Forward Looking Information and Statements” section for a calculation of forecast FAFF.
Operating Income/Operating Netback per boe/Operating Income Profit Margin
InPlay uses “operating income”, “operating netback per boe” and “operating income profit margin” as key performance indicators. Operating income is calculated by the Company as oil and natural gas sales less royalties, operating expenses and transportation expenses and is a measure of the profitability of operations before administrative, share-based compensation, financing and other non-cash items. Management considers operating income an important measure to evaluate its operational performance as it demonstrates its field level profitability. Operating income should not be considered as an alternative to or more meaningful than net income as determined in accordance with GAAP as an indicator of the Company’s performance. Operating netback per boe is calculated by the Company as operating income divided by average production for the respective period. Management considers operating netback per boe an important measure to evaluate its operational performance as it demonstrates its field level profitability per unit of production. Operating income profit margin is calculated by the Company as operating income as a percentage of oil and natural gas sales. Management considers operating income profit margin an important measure to evaluate its operational performance as it demonstrates how efficiently the Company generates field level profits from its sales revenue. Refer below for a calculation of operating income, operating netback per boe and operating income profit margin.
Net Debt to EBITDA
Management considers Net Debt to EBITDA an important measure as it is a key metric to identify the Company’s ability to fund financing expenses, net debt reductions and other obligations. EBITDA is calculated by the Company as adjusted funds flow before interest expense. When this measure is presented quarterly, EBITDA is annualized by multiplying by four. When this measure is presented on a trailing twelve month basis, EBITDA for the twelve months preceding the net debt date is used in the calculation. This measure is consistent with the EBITDA formula prescribed under the Company’s Senior Credit Facility. Net Debt to EBITDA is calculated as Net Debt divided by EBITDA. Refer below for a calculation of Net Debt to EBITDA and to the “Forward Looking Information and Statements” section for a calculation of forecast Net Debt to EBITDA.
Production per Debt Adjusted Share
InPlay uses “Production per debt adjusted share” as a key performance indicator. Debt adjusted shares should not be considered as an alternative to or more meaningful than common shares as determined in accordance with GAAP as an indicator of the Company’s performance. Debt adjusted shares is a non-GAAP measure used in the calculation of Production per debt adjusted share and is calculated by the Company as common shares outstanding plus the change in net debt divided by the Company’s current trading price on the TSX, converting net debt to equity. Debt adjusted shares should not be considered as an alternative to or more meaningful than weighted average number of common shares (basic) as determined in accordance with GAAP as an indicator of the Company’s performance. Management considers Debt adjusted share is a key performance indicator as it adjusts for the effects of capital structure in relation to the Company’s peers. Production per debt adjusted share is calculated by the Company as production divided by debt adjusted shares. Management considers Production per debt adjusted share is a key performance indicator as it adjusts for the effects of changes in annual production in relation to the Company’s capital structure. Refer below for a calculation of Production per debt adjusted share and to to the “Forward Looking Information and Statements” section for a calculation of forecast Production per debt adjusted share.
EV / DAAFF
InPlay uses “enterprise value to debt adjusted AFF” or “EV/DAAFF” as a key performance indicator. EV/DAAFF is calculated by the Company as enterprise value divided by debt adjusted AFF for the relevant period. Debt adjusted AFF (“DAAFF”) is calculated by the Company as adjusted funds flow plus financing costs. Enterprise value is a capital management measures that is used in the calculation of EV/DAAFF. Enterprise value is calculated as the Company’s market capitalization plus working capital (net debt). Management considers enterprise value a key performance indicator as it identifies the total capital structure of the Company. Management considers EV/DAAFF a key performance indicator as it is a key metric used to evaluate the sustainability of the Company relative to other companies while incorporating the impact of differing capital structures. Refer to the “Forward Looking Information and Statements” section for a calculation of forecast EV/DAAFF.
Capital Management Measures
Adjusted Funds Flow
Management considers adjusted funds flow to be an important measure of InPlay’s ability to generate the funds necessary to finance capital expenditures. AFF is a GAAP measure and is disclosed in the notes to the Company’s consolidated financial statements for the year ending December 31, 2021 and the most recently filed quarterly financial statements. All references to AFF throughout this document are calculated as funds flow adjusting for decommissioning expenditures and transaction and integration costs. This item is adjusted from funds flow as decommissioning expenditures are incurred on a discretionary and irregular basis and are primarily incurred on previous operating assets and transaction costs are non-recurring costs for the purposes of an acquisition, making the exclusion of these items relevant in Management’s view to the reader in the evaluation of InPlay’s operating performance. The Company also presents AFF per share whereby per share amounts are calculated using weighted average shares outstanding consistent with the calculation of profit (loss) per common share.
Net Debt / Working Capital
Net debt / working capital is a GAAP measure and is disclosed in the notes to the Company’s consolidated financial statements for the year ending December 31, 2021 and the most recently filed quarterly financial statements. The Company closely monitors its capital structure with a goal of maintaining a strong balance sheet to fund the future growth of the Company. The Company monitors net debt / working capital as part of its capital structure. The Company uses net debt / working capital (bank debt plus accounts payable and accrued liabilities less accounts receivables and accrued receivables, prepaid expenses and deposits and inventory) as an alternative measure of outstanding debt. Management considers net debt / working capital an important measure to assist in assessing the liquidity of the Company.
Supplementary Measures
“Average realized crude oil price” is comprised of crude oil commodity sales from production, as determined in accordance with IFRS, divided by the Company’s crude oil production. Average prices are before deduction of transportation costs and do not include gains and losses on financial instruments.
“Average realized NGL price” is comprised of NGL commodity sales from production, as determined in accordance with IFRS, divided by the Company’s NGL production. Average prices are before deduction of transportation costs and do not include gains and losses on financial instruments.
“Average realized natural gas price” is comprised of natural gas commodity sales from production, as determined in accordance with IFRS, divided by the Company’s natural gas production. Average prices are before deduction of transportation costs and do not include gains and losses on financial instruments.
“Average realized commodity price” is comprised of commodity sales from production, as determined in accordance with IFRS, divided by the Company’s production. Average prices are before deduction of transportation costs and do not include gains and losses on financial instruments.
“AFF per weighted average basic share” is comprised of AFF divided by the basic weighted average common shares.
“AFF per weighted average diluted share” is comprised of AFF divided by the diluted weighted average common shares.
“AFF per boe” is comprised of AFF divided by total production.
Forward-Looking Information and Statements
This news release contains certain forward–looking information and statements within the meaning of applicable securities laws. The use of any of the words “expect”, “anticipate”, “continue”, “estimate”, “may”, “will”, “project”, “should”, “believe”, “plans”, “intends”, “forecast”, “targets”, “framework” and similar expressions are intended to identify forward-looking information or statements. In particular, but without limiting the foregoing, this news release contains forward looking information and statements pertaining to the following: the Company’s business strategy, milestones and objectives including, without limitation, the Company’s forecast net debt to EBITDA ratio at year ended 2022; InPlay’s expectations regarding the sustainability of the base monthly dividend, including in the event of a drop in commodity prices; the projection that the dividend is sustainable in a flat $US 55/bbl WTI price environment; the expectation that the net debt to EBITDA ratio will continue to drop; the anticipated generation of strong FAFF through 2025 and our expected working capital balance; the expectation that additional FAFF will be used for special dividends, share buybacks, tactical capital investment and strategic acquisitions; the expectation of strong debt reductions in the fourth quarter of 2022; the expected results from the construction of the two Vapor Recovery Units; the anticipated timing of the release of the Company’s 2023 budget; expectations regarding future commodity prices; future oil and natural gas prices; future liquidity and financial capacity; future results from operations and operating metrics; future costs, expenses and royalty rates; future interest costs; the exchange rate between the $US and $Cdn; the anticipated tax treatment of the monthly base dividend; future development, exploration, acquisition, development and infrastructure activities and related capital expenditures, including our planned 2022 capital program and associated guidance and long-term forecast to 2025.
Without limitation of the foregoing, readers are cautioned that the Company’s future dividend payments to shareholders of the Company, if any, and the level thereof will be subject to the discretion of the Board of Directors of InPlay. The Company’s dividend policy and funds available for the payment of dividends, if any, from time to time, is dependent upon, among other things, levels of FAFF, leverage ratios, financial requirements for the Company’s operations and execution of its growth strategy, fluctuations in commodity prices and working capital, the timing and amount of capital expenditures, credit facility availability and limitations on distributions existing thereunder, and other factors beyond the Company’s control. Further, the ability of the Company to pay dividends will be subject to applicable laws, including satisfaction of solvency tests under the Business Corporations Act (Alberta), and satisfaction of certain applicable contractual restrictions contained in the agreements governing the Company’s outstanding indebtedness.
Forward-looking statements or information are based on a number of material factors, expectations or assumptions of InPlay which have been used to develop such statements and information but which may prove to be incorrect. Although InPlay believes that the expectations reflected in such forward looking statements or information are reasonable, undue reliance should not be placed on forward-looking statements because InPlay can give no assurance that such expectations will prove to be correct. In addition to other factors and assumptions which may be identified herein, assumptions have been made regarding, among other things: the impact of increasing competition; the general stability of the economic and political environment in which InPlay operates; the timely receipt of any required regulatory approvals; the ability of InPlay to obtain qualified staff, equipment and services in a timely and cost efficient manner; drilling results; the ability of the operator of the projects in which InPlay has an interest in to operate the field in a safe, efficient and effective manner; the ability of InPlay to obtain debt financing on acceptable terms; the timing and amount of purchases under the Company’s NCIB; the anticipated tax treatment of the monthly base dividend; field production rates and decline rates; the ability to replace and expand oil and natural gas reserves through acquisition, development and exploration; the timing and cost of pipeline, storage and facility construction and the ability of InPlay to secure adequate product transportation; future commodity prices; that various conditions to a shareholder return strategy can be satisfied; expectations regarding the potential impact of COVID-19 and the Russia/Ukraine conflict; currency, exchange and interest rates; regulatory framework regarding royalties, taxes and environmental matters in the jurisdictions in which InPlay operates; and the ability of InPlay to successfully market its oil and natural gas products. The forward-looking information and statements included herein are not guarantees of future performance and should not be unduly relied upon. Such information and statements, including the assumptions made in respect thereof, involve known and unknown risks, uncertainties and other factors that may cause actual results or events to defer materially from those anticipated in such forward-looking information or statements including, without limitation: the continuing impact of the COVID-19 pandemic and the Russia/Ukraine conflict; inflation and the risk of a global recession; changes in our planned 2022 capital program; changes in our approach to shareholder returns, including in relation to the Company’s NCIB and the timing and amount of any potential purchases thereunder; changes in commodity prices and other assumptions outlined herein; the risk that dividend payments may be reduced, suspended or cancelled; the potential for variation in the quality of the reservoirs in which we operate; changes in the demand for or supply of our products; unanticipated operating results or production declines; changes in tax or environmental laws, royalty rates or other regulatory matters; changes in development plans or strategies of InPlay or by third party operators of our properties; changes in our credit structure, increased debt levels or debt service requirements; inaccurate estimation of our light crude oil and natural gas reserve and resource volumes; limited, unfavorable or a lack of access to capital markets; increased costs; a lack of adequate insurance coverage; the impact of competitors; and certain other risks detailed from time-to-time in InPlay’s continuous disclosure documents filed on SEDAR including our Annual Information Form and our MD&A.
This press release contains future-oriented financial information and financial outlook information (collectively, “FOFI”) about InPlay’s financial and leverage targets and objectives, InPlay’s long-term forecast, and potential dividends and share buybacks, all of which are subject to the same assumptions, risk factors, limitations, and qualifications as set forth in the above paragraphs. The actual results of operations of InPlay and the resulting financial results will likely vary from the amounts set forth in this press release and such variation may be material. InPlay and its management believe that the FOFI has been prepared on a reasonable basis, reflecting management’s best estimates and judgments. However, because this information is subjective and subject to numerous risks, it should not be relied on as necessarily indicative of future results. Except as required by applicable securities laws, InPlay undertakes no obligation to update such FOFI. FOFI contained in this press release was made as of the date of this press release and was provided for the purpose of providing further information about InPlay’s anticipated future business operations and strategy. Readers are cautioned that the FOFI contained in this press release should not be used for purposes other than for which it is disclosed herein.
The internal projections, expectations, or beliefs underlying our Board approved 2022 capital budget and associated guidance, as well as management’s preliminary estimates and targets in respect of plans for 2023 and beyond, are subject to change in light of the impact of the COVID-19 pandemic, and any related actions taken by businesses and governments, ongoing results, prevailing economic circumstances, volatile commodity prices, and industry conditions and regulations. InPlay’s financial outlook and guidance provides shareholders with relevant information on management’s expectations for results of operations, excluding any potential acquisitions or dispositions, for such time periods based upon the key assumptions outlined herein. In this document reference is made to the Company’s longer range 2023 and beyond internal plan and associated economic model. Such information reflects internal targets used by management for the purposes of making capital investment decisions and for internal long range planning and budget preparation. Readers are cautioned that events or circumstances could cause capital plans and associated results to differ materially from those predicted and InPlay’s guidance for 2022, and more particularly 2023 and beyond, may not be appropriate for other purposes. Accordingly, undue reliance should not be placed on same.
The forward-looking information and statements contained in this news release speak only as of the date hereof and InPlay does not assume any obligation to publicly update or revise any of the included forward-looking statements or information, whether as a result of new information, future events or otherwise, except as may be required by applicable securities laws.
The key budget and underlying material assumptions used by the Company in the development of its 2022 guidance and long-term forecast including forecasted production, operating income, capital expenditures, AFF, FAFF, working capital (net debt), Net Debt/EBITDA, production per debt adjusted share and EV/DAAFF are as follows:
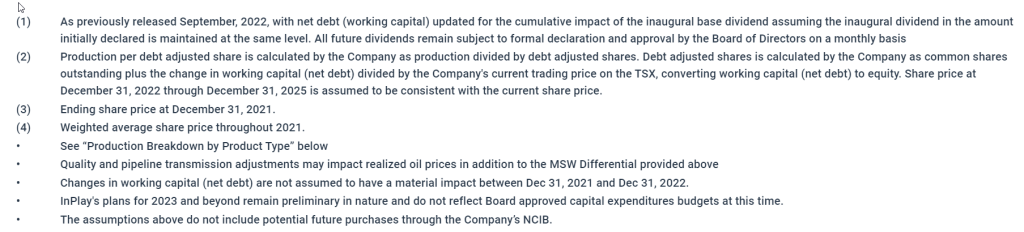
Production Breakdown by Product Type Disclosure of production on a per boe basis in this press release consists of the constituent product types as defined in NI 51-101 and their respective quantities disclosed in the table below:
Notes:
This reflects the mid-point of the Company’s 2022 production guidance range of 9,150 to 9,400 boe/d.
This reflects the mid-point of the Company’s annual production forecast range.
With respect to forward-looking production guidance, product type breakdown is based upon management’s expectations based on reasonable assumptions but are subject to variability based on actual well results.
References to crude oil, NGLs or natural gas production in this press release refer to the light and medium crude oil, natural gas liquids and conventional natural gas product types, respectively, as defined in National Instrument 51-101, Standards of Disclosure for Oil and Gas Activities (“Nl 51-101”).
BOE Equivalent Barrel of oil equivalents or BOEs may be misleading, particularly if used in isolation. A BOE conversion ratio of 6 mcf: 1 bbl is based on an energy equivalency conversion method primarily applicable at the burner tip and does not represent a value equivalency at the wellhead. Given that the value ratio based on the current price of crude oil as compared to natural gas is significantly different than the energy equivalency of 6:1, utilizing a 6:1 conversion basis may be misleading as an indication of value.
CHATHAM, N.J., Nov. 09, 2022 (GLOBE NEWSWIRE) — Tonix Pharmaceuticals Holding Corp. (Nasdaq: TNXP), a clinical-stage biopharmaceutical company, today announced a poster presentation by an academic collaborator at Neuroscience 2022 by the Society for Neuroscience being held November 12-16, 2022, at the San Diego Convention Center in San Diego, Calif.
Poster Presentation Details:
Title:
In Vitro Impact of Oxytocin on Human Sensory Neurons
Session:
Poster Session I
Date:
November 14, 2022
Time:
1:00 p.m. – 2:00 p.m. PT
Authors:
David C. Yeomans, Ph.D., Associate Professor, Anesthesiology, Perioperative and Pain Medicine, Stanford University and David Hsu, Ph.D., Senior Scientist, Tonix Pharmaceuticals
Presenter:
David C. Yeomans, Ph.D., Associate Professor, Anesthesiology, Perioperative and Pain Medicine, Stanford University
Tonix is a clinical-stage biopharmaceutical company focused on discovering, licensing, acquiring and developing therapeutics to treat and prevent human disease and alleviate suffering. Tonix’s portfolio is composed of central nervous system (CNS), rare disease, immunology and infectious disease product candidates. Tonix’s CNS portfolio includes both small molecules and biologics to treat pain, neurologic, psychiatric and addiction conditions. Tonix’s lead CNS candidate, TNX-102 SL (cyclobenzaprine HCl sublingual tablet), is in mid-Phase 3 development for the management of fibromyalgia with a new Phase 3 study launched in the second quarter of 2022 and interim data expected in the second quarter of 2023. TNX-102 SL is also being developed to treat Long COVID, a chronic post-acute COVID-19 condition. Tonix initiated a Phase 2 study in Long COVID in the third quarter of 2022 and expects interim data in the second quarter of 2023. TNX-1300 (cocaine esterase) is a biologic designed to treat cocaine intoxication and has been granted Breakthrough Therapy designation by the FDA. A Phase 2 study of TNX-1300 is expected to be initiated in the first quarter of 2023. TNX-1900 (intranasal potentiated oxytocin), a small molecule in development for chronic migraine, is expected to enter the clinic with a Phase 2 study in the fourth quarter of 2022. TNX-601 ER (tianeptine hemioxalate extended-release tablets) is a once-daily formulation of tianeptine being developed as a potential treatment for major depressive disorder (MDD) with a Phase 2 study expected to be initiated in the first quarter of 2023. Tonix’s rare disease portfolio includes TNX-2900 (intranasal potentiated oxytocin) for the treatment of Prader-Willi syndrome. TNX-2900 has been granted Orphan Drug designation by the FDA. Tonix’s immunology portfolio includes biologics to address organ transplant rejection, autoimmunity and cancer, including TNX-1500, which is a humanized monoclonal antibody targeting CD40-ligand (CD40L or CD154) being developed for the prevention of allograft and xenograft rejection and for the treatment of autoimmune diseases. A Phase 1 study of TNX-1500 is expected to be initiated in the first half of 2023. Tonix’s infectious disease pipeline consists of a vaccine in development to prevent smallpox and monkeypox, next-generation vaccines to prevent COVID-19, and a platform to make fully human monoclonal antibodies to treat COVID-19. TNX-801, Tonix’s vaccine in development to prevent smallpox and monkeypox, also serves as the live virus vaccine platform or recombinant pox vaccine (RPV) platform for other infectious diseases. A Phase 1 study of TNX-801 is expected to be initiated in Kenya in the first half of 2023. Tonix’s lead vaccine candidate for COVID-19 is TNX-1850, a live virus vaccines based on Tonix’s recombinant pox live virus vector vaccine platform.
*All of Tonix’s product candidates are investigational new drugs or biologics and have not been approved for any indication.
This press release and further information about Tonix can be found at www.tonixpharma.com.
Forward Looking Statements Certain statements in this press release are forward-looking within the meaning of the Private Securities Litigation Reform Act of 1995. These statements may be identified by the use of forward-looking words such as “anticipate,” “believe,” “forecast,” “estimate,” “expect,” and “intend,” among others. These forward-looking statements are based on Tonix’s current expectations and actual results could differ materially. There are a number of factors that could cause actual events to differ materially from those indicated by such forward-looking statements. These factors include, but are not limited to, risks related to the failure to obtain FDA clearances or approvals and noncompliance with FDA regulations; delays and uncertainties caused by the global COVID-19 pandemic; risks related to the timing and progress of clinical development of our product candidates; our need for additional financing; uncertainties of patent protection and litigation; uncertainties of government or third party payor reimbursement; limited research and development efforts and dependence upon third parties; and substantial competition. As with any pharmaceutical under development, there are significant risks in the development, regulatory approval and commercialization of new products. Tonix does not undertake an obligation to update or revise any forward-looking statement. Investors should read the risk factors set forth in the Annual Report on Form 10-K for the year ended December 31, 2021, as filed with the Securities and Exchange Commission (the “SEC”) on March 14, 2022, and periodic reports filed with the SEC on or after the date thereof. All of Tonix’s forward-looking statements are expressly qualified by all such risk factors and other cautionary statements. The information set forth herein speaks only as of the date thereof.
Kandi Technologies Group, Inc. (KNDI), headquartered in Jinhua Economic Development Zone, Zhejiang Province, is engaged in the research, development, manufacturing, and sales of various vehicular products. Kandi conducts its primary business operations through its wholly-owned subsidiary, Zhejiang Kandi Technologies Group Co., Ltd. (“Zhejiang Kandi Technologies”), formerly, Zhejiang Kandi Vehicles Co., Ltd.) and its subsidiaries including Zhejiang Kandi Smart Battery Swap Technology Co., Ltd, and SC Autosports, LLC (d/b/a Kandi America), the wholly-owned subsidiary of Kandi in the United States, and its wholly-owned subsidiary, Kandi America Investment, LLC. Zhejiang Kandi Technologies has established itself as one of China’s leading manufacturers of pure electric vehicle parts and off-road vehicles.
Michael Heim, CFA, Senior Research Analyst, Noble Capital Markets, Inc.
Refer to the full report for the price target, fundamental analysis, and rating.
Kandi reports positive earnings. 2022-3Q net income was $1.1 million or $0.01 per share up from ($7.9 million) or ($0.10) and surpassing our ($2.4 million) or ($0.03) estimate. Positive results reflect improved results for off-road vehicles (UTVs, Golf Carts, etc.). Off-road vehicles reported revenues of $21.7 million versus $6.8 million last year and our $7.5 million estimate. Kandi began emphasizing off-road vehicles last spring. Kandi golf carts can now be found at Lowes Corporation in addition to licensed dealers. The company continues to develop new models including cross over UTV-golf cart vehicles.
Positive net income comes despite operating income losses. Operating income for the third quarter was ($2.2 million) versus ($9.0 million). The difference between operating income and net income can be explained by positive interest and other income as well as negative tax expense. The company reported $210 million in cash or approximately $2.75 per share at the end of the quarter positively contributing to interest income. The company believes it is prudent to maintain a large cash position to fund research and development as markets develop. That said, it has authorized a share repurchase program which we believe it will utilize if its share price drops below $2.50 per share.
This Company Sponsored Research is provided by Noble Capital Markets, Inc., a FINRA and S.E.C. registered broker-dealer (B/D).
*Analyst certification and important disclosures included in the full report. NOTE: investment decisions should not be based upon the content of this research summary. Proper due diligence is required before making any investment decision.
The E.W. Scripps Company (NASDAQ: SSP) is a diversified media company focused on creating a better-informed world. As one of the nation’s largest local TV broadcasters, Scripps serves communities with quality, objective local journalism and operates a portfolio of 61 stations in 41 markets. The Scripps Networks reach nearly every American through the national news outlets Court TV and Newsy and popular entertainment brands ION, Bounce, Defy TV, Grit, ION Mystery, Laff and TrueReal. Scripps is the nation’s largest holder of broadcast spectrum. Scripps runs an award-winning investigative reporting newsroom in Washington, D.C., and is the longtime steward of the Scripps National Spelling Bee. Founded in 1878, Scripps has held for decades to the motto, “Give light and the people will find their own way.”
Michael Kupinski, Director of Research, Noble Capital Markets, Inc.
Patrick McCann, Research Associate, Noble Capital Markets, Inc.
Refer to the full report for the price target, fundamental analysis, and rating.
Q3 miss. The company reported Q3 revenue of $612.1 million, below our estimate of $638.5 million. Adj. EBITDA of $149.1 million missed our forecast of $170.5. The disappointing quarter was due to lower-than-expected Political revenue.
Political below expectations. The company recorded $63.2 million in Political revenue, compared with our forecast of $90.0 million. Management attributed the slowed Political revenue pace to spending falloffs in Florida and Montana as certain races became less competitive than initially expected. Political dollars shifted to more competitive markets where the company did not have a large TV station footprint. Notably, Political was still up strongly over the prior election cycle.
This Research is provided by Noble Capital Markets, Inc., a FINRA and S.E.C. registered broker-dealer (B/D).
*Analyst certification and important disclosures included in the full report. NOTE: investment decisions should not be based upon the content of this research summary. Proper due diligence is required before making any investment decision.
ACCO Brands Corporation is one of the world’s largest designers, marketers and manufacturers of branded academic, consumer and business products. Our widely recognized brands include AT-A-GLANCE®, Esselte®, Five Star®, GBC®, Kensington®, Leitz®, Mead®, PowerA®, Quartet®, Rapid®, Rexel®, Swingline®, Tilibra®, and many others. Our products are sold in more than 100 countries around the world. More information about ACCO Brands, the Home of Great Brands Built by Great People, can be found at www.accobrands.com.
Joe Gomes, Senior Research Analyst, Noble Capital Markets, Inc.
Joshua Zoepfel, Research Associate, Noble Capital Markets, Inc.
Refer to the full report for the price target, fundamental analysis, and rating.
Lots of Positives. A solid back-to-school sell-through in North America, increased market share, a rebound in sales of commercial products, double digit growth in the Kensington brand and computer accessories category, the International segment up over 30% on a comp basis, and growth for gaming accessories in the EMEA and International regions.
But a Tough Environment. Significant high inflation, war in Ukraine, the current energy crisis, and the stronger U.S. dollar, are causing retailers to be cautious on inventory replenishment and impacting consumer sentiment. Lower sales volume has resulted in stranded fixed costs in manufacturing facilities.
This Company Sponsored Research is provided by Noble Capital Markets, Inc., a FINRA and S.E.C. registered broker-dealer (B/D).
*Analyst certification and important disclosures included in the full report. NOTE: investment decisions should not be based upon the content of this research summary. Proper due diligence is required before making any investment decision.
Ocugen, Inc. is a biotechnology company focused on developing and commercializing novel gene therapies, biologicals, and vaccines. The lead product, Covaxin, is a killed-virus vaccine for COVID-19 in-licensed from Bharat Biotech (India). The lead product in its gene therapy program, OCU400, is in Phase 1/2 clinical trials for retinitis pigmentosa.
Robert LeBoyer, Vice President, Research Analyst, Life Sciences , Noble Capital Markets, Inc.
Refer to the full report for the price target, fundamental analysis, and rating.
Financial Results Met Expectations. Ocugen reported a 3Q loss of $21.9 million or $(0.10) per share, close to our estimates of $21.2 million and $(0.10) for the quarter. Cash on hand at September 30, 2022 was $101.6 million, which the company expects to last through 2023.
COVID-19 Programs Are Moving Forward. The Phase 2/3 immuno-bridging study for COVAXIN has completed enrollment with data release expected in early 2023. This study is testing COVAXIN to determine the immune response in the current US population, providing a “bridge” for comparability with the Phase 3 trial conducted in India. The study enrolled patients who were unvaccinated and patients that received mRNA vaccines to determine both initial and booster efficacy. Once completed, Ocugen plans to work with government agencies for support and funding for regulatory approval of its COVID-19 products.
This Company Sponsored Research is provided by Noble Capital Markets, Inc., a FINRA and S.E.C. registered broker-dealer (B/D).
*Analyst certification and important disclosures included in the full report. NOTE: investment decisions should not be based upon the content of this research summary. Proper due diligence is required before making any investment decision.
Energy Fuels is a leading U.S.-based uranium mining company, supplying U3O8 to major nuclear utilities. Energy Fuels also produces vanadium from certain of its projects, as market conditions warrant, and is ramping up commercial-scale production of REE carbonate. Its corporate offices are in Lakewood, Colorado, near Denver, and all its assets and employees are in the United States. Energy Fuels holds three of America’s key uranium production centers: the White Mesa Mill in Utah, the Nichols Ranch in-situ recovery (“ISR”) Project in Wyoming, and the Alta Mesa ISR Project in Texas. The White Mesa Mill is the only conventional uranium mill operating in the U.S. today, has a licensed capacity of over 8 million pounds of U3O8 per year, has the ability to produce vanadium when market conditions warrant, as well as REE carbonate from various uranium-bearing ores. The Nichols Ranch ISR Project is on standby and has a licensed capacity of 2 million pounds of U3O8 per year. The Alta Mesa ISR Project is also on standby and has a licensed capacity of 1.5 million pounds of U3O8 per year. In addition to the above production facilities, Energy Fuels also has one of the largest NI 43-101 compliant uranium resource portfolios in the U.S. and several uranium and uranium/vanadium mining projects on standby and in various stages of permitting and development. The primary trading market for Energy Fuels’ common shares is the NYSE American under the trading symbol “UUUU,” and the Company’s common shares are also listed on the Toronto Stock Exchange under the trading symbol “EFR.” Energy Fuels’ website is www.energyfuels.com.
Michael Heim, CFA, Senior Research Analyst, Noble Capital Markets, Inc.
Refer to the full report for the price target, fundamental analysis, and rating.
CEO Marc Chalmers held a call with analysts and investors devoid of new announcements. Financial results were not even discussed save a quick mention that net income was $(9.2) million versus $(7.9) million, in line with our $(8.8) million estimate. Working capital remains strong at $122 million, 73% of which is cash. Management acknowledged that new releases have been slow this quarter, but emphasized that Energy Fuels is making extraordinary progress towards its goals. In a shortened and noticeably energetic presentation, management said several key quotes demonstrating their optimism towards the progress the company was making.
Uranium production is close. Management indicated that “utilities are moving away from Russian supply”. It reiterated that it has entered into three contracts with utilities that begin in 2023 and that the company has hired 20 employees to get uranium mining to be “push button ready” in “12 months or less”. Mr. Chalmers indicated that utilities in existing supply contracts want to “flex up” to higher levels and that he expects the company to sign additional contracts soon. UUUU has 760,000 lbs. in inventory to fulfill contracts and expects to mine 130,000-140,000 lbs. and produce 170,000 lbs. from unprocessed ore in 2023. No update on DOE plans to purchase up to 1 million lbs. for a national uranium reserve but UUUU is in a good position to be selected.
This Company Sponsored Research is provided by Noble Capital Markets, Inc., a FINRA and S.E.C. registered broker-dealer (B/D).
*Analyst certification and important disclosures included in the full report. NOTE: investment decisions should not be based upon the content of this research summary. Proper due diligence is required before making any investment decision.
Why Meta’s Share Price Collapse is Good News for the Future of Social Media
Facebook may not be the original social media platform, but it has stood the test of time – until recently. Meta, the company that owns Facebook, Instagram, and WhatsApp, saw its value plummet by around $80 billion (£69 billion) in just one day at the end of October after its third-quarter profits halved amid the global slowdown. Meta is now valued at around $270 billion compared with more than $1 trillion last year.
Several issues have caused investors to turn away from the social media giant, including falling advertising revenue, a conflict with Apple over its app store charging policy, and competition for younger audiences from newer platforms such as TikTok.
Meta’s chief executive Mark Zuckerberg has also used his majority control to double down on his ambitions for the “metaverse”, a virtual reality project on which he has already spent more than $100 billion – with questionable results, according to the initial investor and media reaction. Zuckerberg has promised even more investment in the metaverse next year.
It’s tempting to describe this spending spree as a billionaire’s “insane fantasy”, but there is a simpler explanation. As dominant platforms compete for a limited amount of advertising revenue, regulation – particularly when it differs between countries or regions – has created space for more competitors. This is good news for new social media companies, but it also means that the only way Meta is likely to be able to keep its dominant position is by placing a massive bet on the technology of the future. Zuckerberg believes that means the metaverse, but this remains to be seen.
Tech’s Changing Fortunes
Even with its recent troubles, Meta owns the largest social network in the world. Those recent results that caused investors to flee in their droves still showed total revenues of $27 billion and profits of $4.4 billion.
To maintain its position as the market leader in the past, Meta has typically bought its most promising competitors as early as possible. Integrating these newly acquired startups into the company’s ecosystem helped to maximize advertising revenue and preclude competition.
Research shows that digital markets are typically dominated by a single firm, but also that these firms tend to be much more specialized than the major companies of the past. Meta is only active in social media and makes money almost exclusively by selling advertising.
Attempts by such firms to expand into other areas typically fail – know anyone with a Facebook phone? And while you may not remember Google’s attempt at social media, iPhone users are probably at least aware of Apple’s maps app.
So Facebook relies on consumers using devices produced by other tech companies to make money. But as global social media advertising revenue slows down, this is becoming more difficult. Apple has begun charging Meta for the revenue it makes from iPhone users, for example. And research shows that, when two companies compete to make money from the same captive source, their successive markups not only push prices higher for consumers but also keep profits lower for both firms.
Global Domination Fail
Meta’s strategy has, until recently, allowed it to rule social media in western markets – but not in China, a country of more than 300 million social media users. Since 2009, Facebook has been blocked by the country’s “great firewall”, the largest and most sophisticated system of censorship in the world.
Reported attempts to adapt Facebook to suit Chinese government media control have never been successful. And so, Chinese company ByteDance was able to launch a news platform called Toutiao in 2012 without having to compete with a dominant social network. In 2016, ByteDance launched Douyin, a social media platform for publishing short videos, which was subsequently released to the rest of the world in 2018 as TikTok.
Despite not being profitable, ByteDance’s market capitalization is now estimated at around $300 billion – versus Meta’s current £270 billion valuation. It is also popular among younger users, that tend to be much more avid social media users.
Meta cannot simply buy TikTok: it is too big, not publicly traded and under tight control by the Chinese government. Zuckerberg’s firm has instead tried to compete by launching similar features on Instagram. Ironically, the only large market where this strategy is really working is India, a country that banned TikTok in 2021 due to a military conflict with China.
Fair Competition
At the same time that TikTok has been expanding beyond Meta’s reach, western regulators have also started to examine the impact of the lack of competition in digital markets on innovation. While research shows that the winner-take-all nature of highly innovative markets is typically good for consumers, this is only true when all companies get a fair chance to become dominant.
In addition to recent rulings against tech company dominance by its highest court, the European Union also recently introduced the Digital Markets Act. This outlaws many practices used by dominant firms to preserve their status in a market.
This article was republished with permission from The Conversation, a news site dedicated to sharing ideas from academic experts. It represents the research-based findings and thoughts of Renaud Foucart, Senior Lecturer in Economics, Lancaster University Management School, Lancaster University.