Release – AdTheorent Holding Company, Inc. Announces Withdrawal of Acquisition Proposal from Third Party and Next Steps in Cadent Transaction

Research News and Market Data on ADTH

May 16, 2024

PDF Version

NEW YORK, May 16, 2024 (GLOBE NEWSWIRE) — AdTheorent Holding Company, Inc. (“AdTheorent” or the “Company”) (Nasdaq: ADTH), a machine learning pioneer delivering measurable value for programmatic advertisers, today announced that the third party that had submitted a non-binding acquisition proposal to acquire the Company for $3.35 per share has withdrawn such proposal, and has informed the Company that it does not intend to submit another acquisition proposal. This proposal had been submitted during the go-shop period that followed AdTheorent’s announcement of the execution of a definitive merger agreement (the “Merger Agreement”) pursuant to which Cadent, LLC (“Cadent”), a leading provider of platform-based converged TV advertising solutions and a portfolio company of Novacap, one of North America’s established private equity firms, agreed to acquire all outstanding shares of AdTheorent common stock for $3.21 per share in cash, or approximately $324 million. 

The Company recently disclosed that the waiting period under the Hart-Scott-Rodino (“HSR”) Antitrust Improvements Act of 1976 expired on May 6, 2024. Expiration of the HSR waiting period was a condition to the closing of the pending transaction with Cadent.

The Company and Cadent continue to remain subject to the Merger Agreement, and pursuant thereto, the Company intends to mail as promptly as reasonably practicable a definitive proxy statement to its stockholders in connection with a special meeting of stockholders to approve the Cadent transaction.   

About AdTheorent:

AdTheorent uses advanced machine learning technology and privacy-forward solutions to deliver impactful advertising campaigns for marketers. AdTheorent’s advanced machine learning-powered media buying platform powers its predictive targeting, predictive audiences, geo-intelligence, audience extension solutions and in-house creative capability, Studio A\T. Focused on the predictive value of machine learning models, AdTheorent’s product suite and flexible transaction models allow advertisers to identify the most qualified potential consumers coupled with the optimal creative experience to deliver superior results, measured by each advertiser’s real-world business goals. AdTheorent is headquartered in New York, with fourteen locations across the United States and Canada.

AdTheorent is consistently recognized with numerous technology, product, growth and workplace awards. AdTheorent was named “Best Buy-Side Programmatic Platform” in the 2023 Digiday Technology Awards and was honored with an AI Breakthrough Award and “Most Innovative Product” (B.I.G. Innovation Awards) for six consecutive years. Additionally, AdTheorent is the only seven-time recipient of Frost & Sullivan’s “Digital Advertising Leadership Award.” In September 2023, evidencing its continued prioritization of its team, AdTheorent was named a Crain’s Top 100 Best Place to Work in NYC for the tenth consecutive year. AdTheorent ranked tenth in the Large Employer Category and 26th Overall in 2023. For more information, visit adtheorent.com.

Additional Information and Where to Find It:

This release may be deemed to be solicitation material in respect of the transaction contemplated by the Merger Agreement (the “proposed merger”). In connection with the proposed merger, the Company filed its Preliminary Proxy Statement on April 30, 2024. This communication is not a substitute for the Preliminary Proxy Statement or any other document that AdTheorent may file with the SEC or send to its stockholders in connection with the proposed merger. When the Company files its proxy statement in definitive form (the “Definitive Proxy Statement”) with the SEC, the Company will mail the Definitive Proxy Statement and a proxy card to each stockholder entitled to vote at the special meeting relating to the proposed merger. INVESTORS AND STOCKHOLDERS OF THE COMPANY ARE URGED TO READ ALL RELEVANT DOCUMENTS FILED WITH THE SEC, INCLUDING THE COMPANY’S DEFINITIVE PROXY STATEMENT (WHEN AVAILABLE), BECAUSE THEY CONTAIN OR WILL CONTAIN IMPORTANT INFORMATION ABOUT THE PROPOSED MERGER. Investors and security holders are or will be able to obtain the documents (when available) free of charge at the SEC’s website at www.sec.gov, or free of charge from the Company by directing a request to David DeStefano, Investor Relations at AdTheorentIR@icrinc.com or (203) 682-8383.

Participants in the Solicitation:

AdTheorent, Cadent, and their respective directors, executive officers and other members of management and employees, under SEC rules, may be deemed to be “participants” in the solicitation of proxies from stockholders of AdTheorent in favor of the proposed merger. Additional information about AdTheorent’s directors and executive officers is set forth in AdTheorent’s Form 10-K/A for the year ended December 31, 2023, which was filed with the SEC on April 25, 2024 (the “Form 10-K/A”). To the extent holdings of AdTheorent’s securities by its directors or executive officers have changed since the amounts set forth in the Form 10-K/A, such changes have been or will be reflected on Initial Statements of Beneficial Ownership on Form 3 or Statements of Change in Ownership on Form 4 filed with the SEC. Additional information concerning the interests of AdTheorent’s participants in the solicitation, which may, in some cases, be different than those of AdTheorent’s stockholders generally, will be set forth in the Definitive Proxy Statement relating to the proposed merger when it becomes available.

No Offer or Solicitation:

This release is not intended to and shall not constitute an offer to buy or sell or the solicitation of an offer to buy or sell any securities, or a solicitation of any vote or approval, nor shall there be any offer, solicitation or sale of securities in any jurisdiction in which such offer, solicitation or sale would be unlawful prior to registration or qualification under the securities laws of any such jurisdiction. No offer of securities shall be made in the United States absent registration under the Securities Act of 1933, as amended, or pursuant to an exemption from, or in a transaction not subject to, such registration requirements.

Forward Looking Statements:

This release contains “forward-looking statements” within the meaning of the safe harbor provisions of the U.S. Private Securities Litigation Reform Act of 1995. Forward-looking statements include, without limitation, any statement that may predict, forecast, indicate or imply future results, performance or achievements, and may contain words such as “believe,” “anticipate,” “expect,” “estimate,” “intend,” “project,” “plan,” or words or phrases with similar meaning. Such statements may also include statements regarding the completion of the proposed merger and the expected timing of the completion of the proposed merger, the management of AdTheorent upon completion of the proposed merger and AdTheorent’s plans upon completion of the proposed merger. Forward-looking statements should not be read as a guarantee of future performance or results and will not necessarily be accurate indications of the times at, or by, which such performance or results will be achieved. Forward-looking statements are based on current expectations, forecasts and assumptions that involve risks and uncertainties, including, but not limited to, the market for programmatic advertising developing slower or differently than AdTheorent’s expectations, the demands and expectations of clients and the ability to attract and retain clients and other economic, competitive, governmental and technological factors outside of AdTheorent’s control, that may cause AdTheorent’s business, strategy or actual results to differ materially from the forward-looking statements. Actual future results, performance or achievements may differ materially from historical results or those anticipated depending on a variety of factors, some of which are beyond the control of AdTheorent, including, but not limited to, the occurrence of any event, change or other circumstances that could give rise to the termination of the Merger Agreement, including under circumstances that would require the Company to pay a termination fee; the inability to complete the proposed merger due to the failure to obtain stockholder approval for the proposed merger or the failure to satisfy other conditions to completion of the proposed merger; risks related to disruption of management’s attention from AdTheorent’s ongoing business operations due to the proposed merger; unexpected costs, charges or expenses resulting from the proposed merger; AdTheorent’s ability to retain and hire key personnel in light of the proposed merger; certain restrictions during the pendency of the proposed merger that may impact AdTheorent’s ability to pursue certain business opportunities or strategic transactions; the ability of the buyer to obtain the necessary financing arrangements set forth in the commitment letters received in connection with the proposed merger; potential litigation relating to the proposed merger that could be instituted against the parties to the Merger Agreement or their respective directors, managers or officers, including the effects of any outcomes related thereto; the effect of the announcement of the proposed merger on AdTheorent’s relationships with its customers, operating results and business generally; and the risk that the proposed merger will not be consummated in a timely manner, if at all. AdTheorent refers you to the “Risk Factors” and “Management’s Discussion and Analysis of Financial Condition and Results of Operations” sections of the Company’s Form 10-K for the fiscal year ended December 31, 2023, and comparable sections of the Company’s Quarterly Reports on Form 10-Q and other filings, which have been filed with the SEC and are available on the SEC’s website at www.sec.gov. All of the forward-looking statements made in this report are expressly qualified by the cautionary statements contained or referred to herein. The actual results or developments anticipated may not be realized or, even if substantially realized, they may not have the expected consequences to or effects on AdTheorent or its business or operations. Readers are cautioned not to rely on the forward-looking statements contained in this report. Forward-looking statements speak only as of the date they are made and AdTheorent does not undertake any obligation to update, revise or clarify these forward-looking statements, whether as a result of new information, future events or otherwise, except as may be required by applicable law.

Investor Contact:

David DeStefano, ICR
AdTheorentIR@icrinc.com
(203) 682-8383

Press Contact:

Melanie Berger, AdTheorent
melanie@adtheorent.com
(850) 567-0082

Russell Reconstitution 2024, What Investors Should Know

The Annual Russell Index Revision and Dates to Watch (2024)

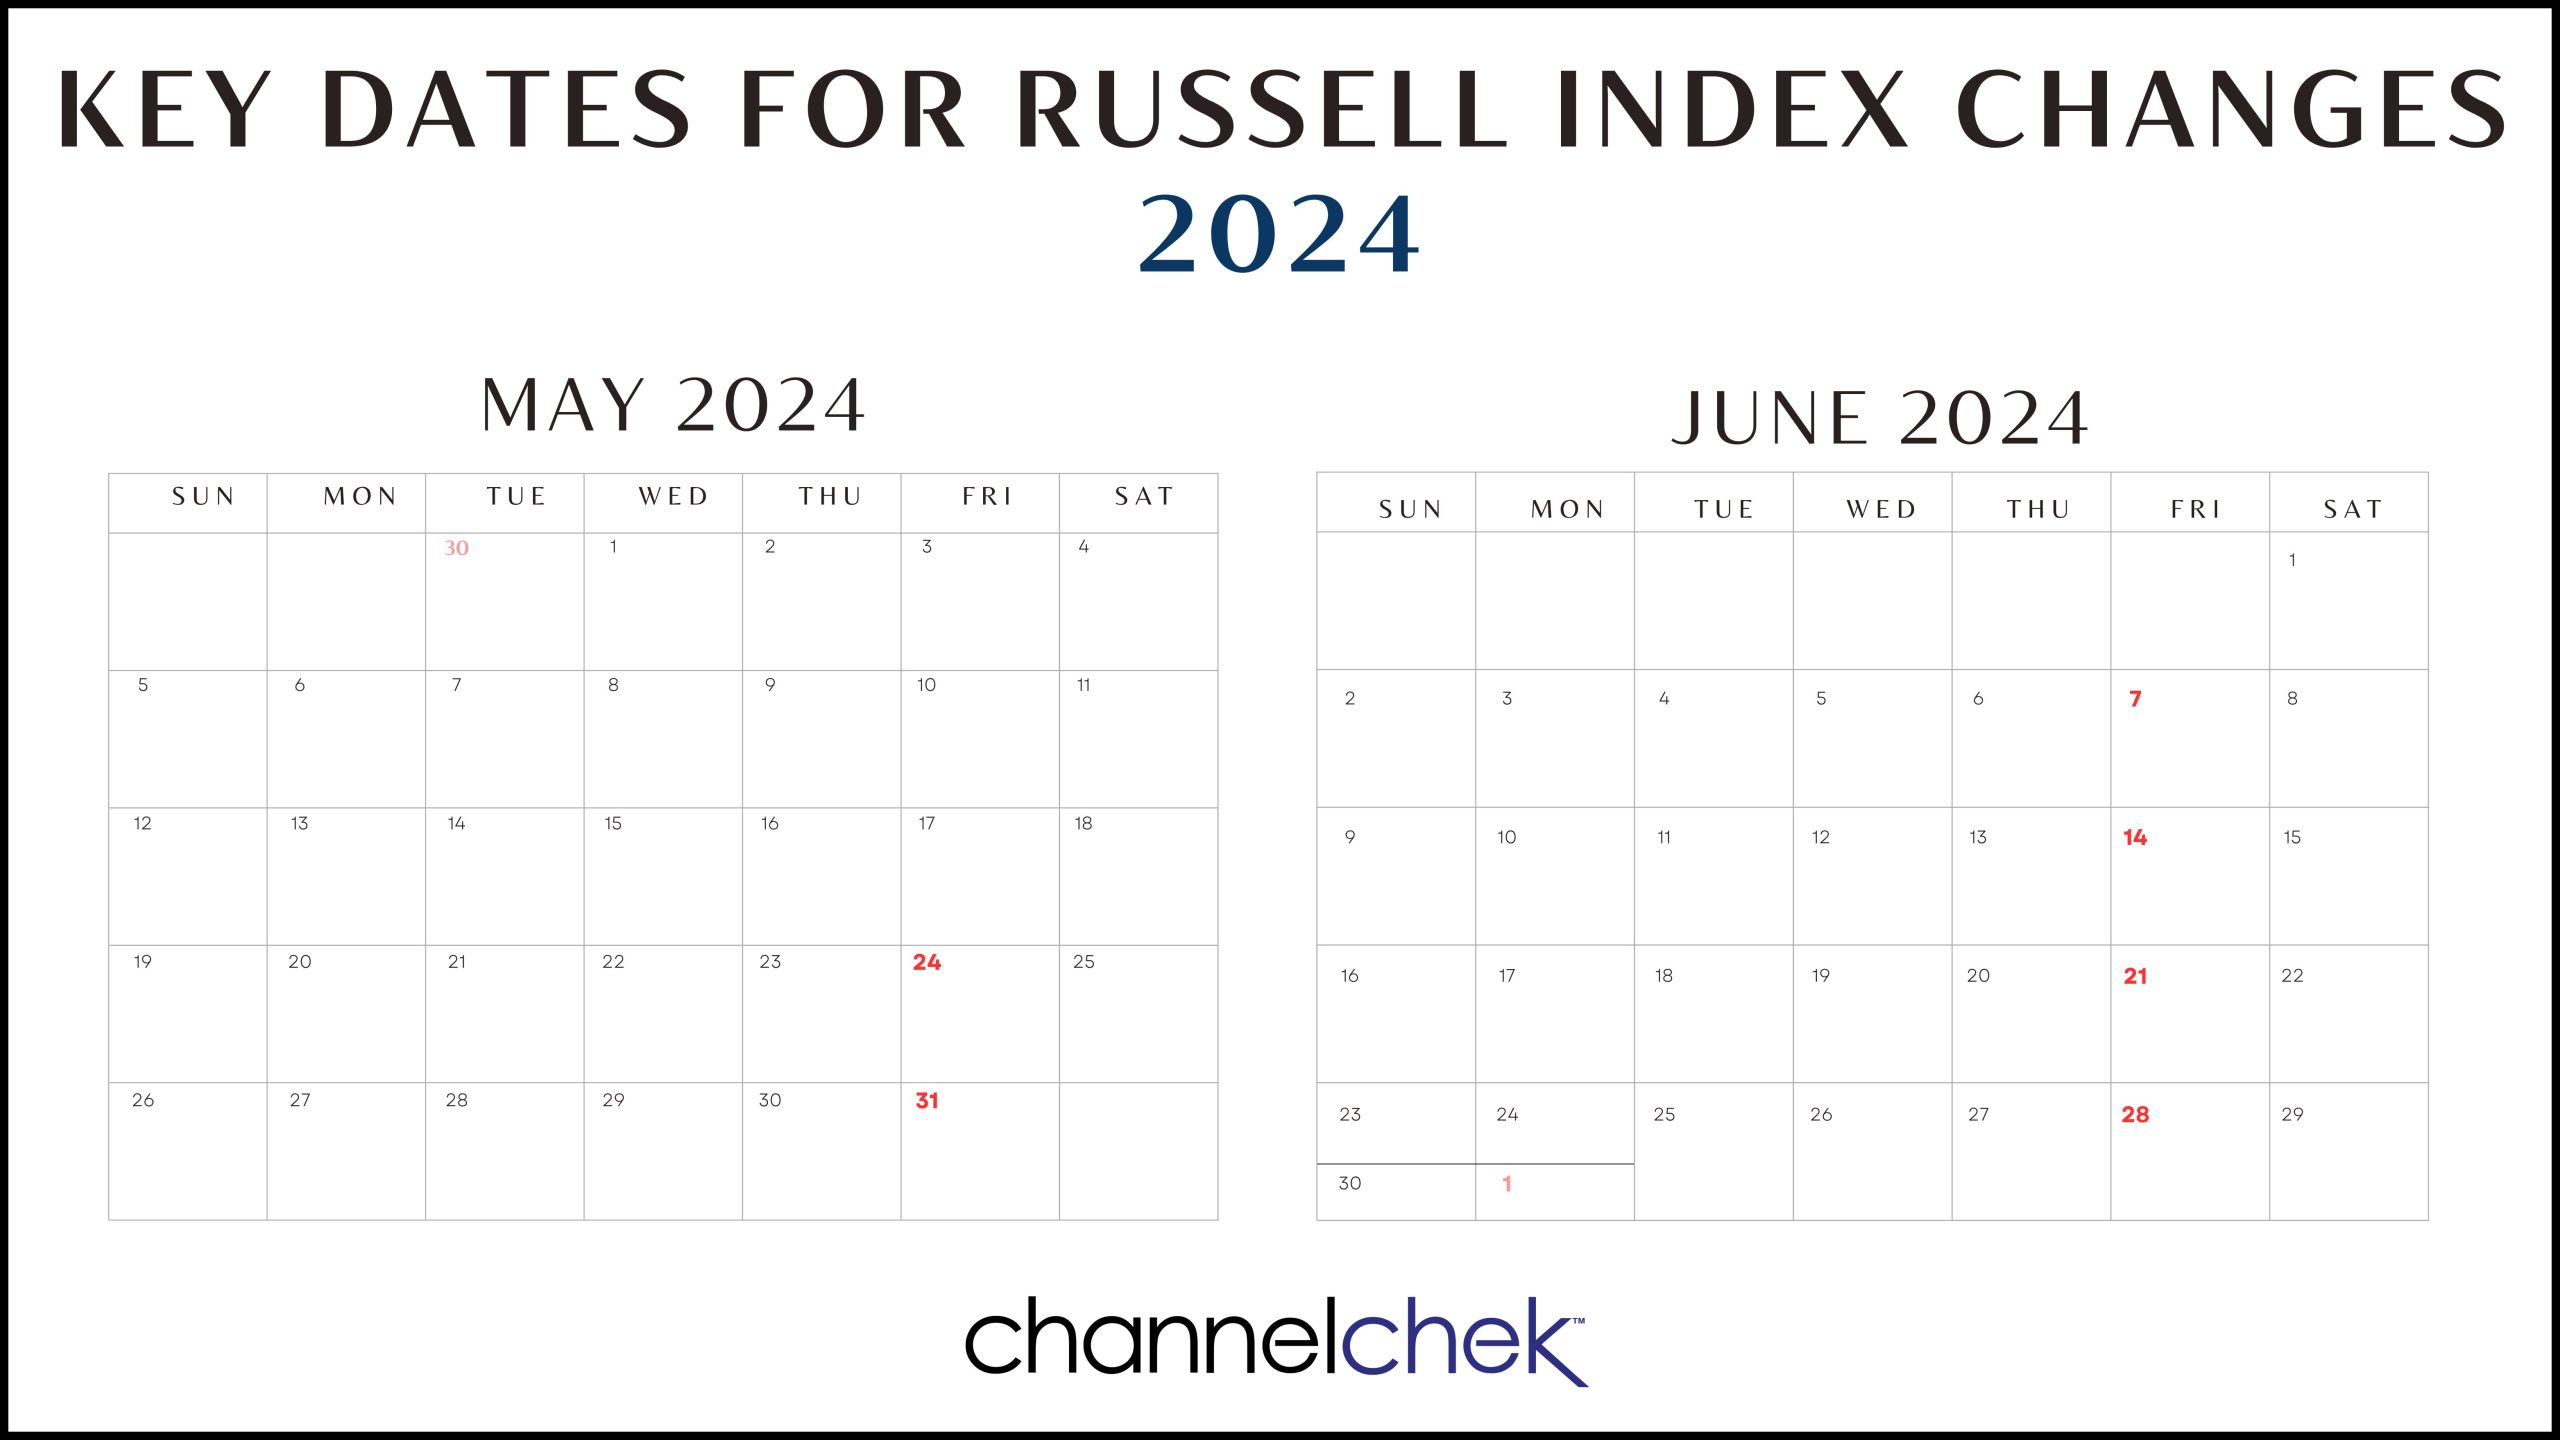
The yearly process of recasting the Russell Indexes begins on Tuesday, April 30 and will be complete by market opening on June 30. During the period in between, FTSE Russell will rank stocks for additions, for deletions and evaluate the companies to make sure they conform overall. The methodology for inserting and removing tickers in the Russell 3000, Russell 2000, and Russell 1000 is intentionally transparent to help eliminate price shocks. Price movements do of course occur along the way, and investors try to foresee and capitalize on them. Channelchek will be providing updates that may uncover opportunities, or at least provide an understanding of stock price swings during this period.

Background

Russell index products are widely used by institutional and retail investors throughout the world. There is more than $20.1 trillion currently benchmarked to a Russell index. This includes approximately $12.1 trillion benchmarked to the Russell US Equity indexes. The trading volume of some companies moving into an index will heighten around the last Friday in June as fund managers seek to maintain level tracking with their benchmark target.

Opportunity

For non-passive investing, determining which stocks may benefit from moving up to a large-cap index, down to a smaller one, or into or out of the measurements is an annual event causing volatility around stocks. There has, of course, the potential for very profitable long and short trades. And the potential for an unwitting investor to be holding a company moving out of an index, which could cause less interest in the stock, and perhaps unfortunate performance.

Active investors should make themselves aware of the forces at play so they may either get out of the way or determine if they should become involved by taking positions with those being added or those at the end of their reign within one of the Russell measurements.

Dramatic Valuation Shifts

The leading industries and altered market-cap of companies of a year ago have changed dramatically from last year’s reconstitution. This will be reflected in the 2023 rebalancing and is going to impact a much larger number of companies than most years. That is to say, a higher percentage of companies than normal will move in, out, or to another index, and may be subject to amplified price movement.

The 2024 Russell Reconstitution Schedule:

• Tuesday, April 30th – “Rank Day” – Index membership eligibility for 2024 Russell Reconstitution determined from constituent market capitalization at market close.

• Friday, May 24 – Preliminary index additions & deletions membership lists posted to the FTSE Russell website after 6 PM US eastern time.

•   Friday, May 31st, June 7th, 14th and 21st – Preliminary membership lists (reflecting any updates) posted to the FTSE Russell website after 6 PM US eastern time.

• Monday, June 10th – “Lock-down” period begins with the updates to reconstitution membership considered to be final.

• Friday, June 28th – Russell Reconstitution is final after the close of the US equity markets.

• Monday, July 1st – Equity markets open with the newly reconstituted Russell US Indexes.

Take-Away

The annual reconstitution is a significant driver of dramatic shifts in some stock prices as portfolio managers have their holding needs shifted within a very short period of time. Longer-term demand for certain equities is altered as well. Sizable price movements and volatility are expected, especially around the last week in June. In fact, the opening day of the reconstitution is typically one of the highest trading-volume days of the year in the US equity markets.

The market event impacts more than $9 trillion of investor assets benchmarked to or invested in products based on the Russell US Indexes. Portfolio managers that are required to track one of these indexes will work to have minimal portfolio slippage away from their benchmark.  The days and weeks from April 30 through the last Friday in June can create opportunities for investors seeking to benefit from price moves, Channelchek will be covering the event as stocks to be added to, or removed from this year’s Russell Reconstitution and other information plays out.

Take a look at the Russell Reconstitution Guide for 2025

Want small cap opportunities delivered straight to your inbox?

Channelchek’s free newsletter will give you exclusive access to our expert research, news, and insights to help you make informed investment decisions.

Get Instant Access

Release – Bit Digital, Inc. Announces First Quarter of Fiscal Year 2024 Financial Results

Research News and Market Data on BTBT

NEW YORK, May 15, 2024 /PRNewswire/ — Bit Digital, Inc. (Nasdaq: BTBT) (the “Company”), a sustainable platform for digital assets and artificial intelligence (“AI”) infrastructure headquartered in New York City, today announced its unaudited financial results for the First Quarter ended March 31, 2024. 

Financial Highlights for the First Quarter of 2024

  • Total revenue was $30.3 million for the First Quarter of 2024, a 266% increase compared to the First Quarter of 2023. The increase was primarily driven by the commencement of our Bit Digital AI business and by a higher realized bitcoin price.
  • Revenue from bitcoin mining was $21.9 million for the First Quarter of 2024, a 166% increase compared to the prior year’s quarter. The Company’s Bit Digital AI business, referred to as High performance computing services (“HPC”), began generating revenue in January 2024, and recognized $8.1 million of revenue during the quarter. The Company issued a one-time service credit of $1.3 million to its HPC customer as compensation for decreased utilization during the initial deployment period, which included testing and optimization phases. Illustratively, adding back this credit would yield pro forma gross margins of approximately 72% on a net basis compared to reported gross margins of 61% for the segment. Revenue from ETH staking was approximately $0.3 million.
  • The Company had cash, cash equivalents and restricted cash of $35.5 million, and total liquidity (defined as cash equivalents and restricted cash, USDC, and the fair market value of digital assets) of approximately $163.21 million, as of March 31, 2024.
  • Total assets were $291.1 million and Shareholders’ Equity amounted to $265.2 million as of March 31, 2024.
  • Adjusted EBITDA2 was $58.5 million for the First Quarter of 2024 compared to $1.5 million for the First Quarter of 2023.
  • GAAP earnings per share was $0.43 on a fully-diluted basis for the First Quarter of 2024 compared to a loss of $0.03 for the First Quarter of 2023.

Operational Highlights for the First Quarter 2024

  • The Company earned 410.7 bitcoins during the First Quarter of 2024, a 13% increase from the prior year. Growth was primarily driven by a higher active hash rate and partially offset by an increase in network difficulty.
  • The Company paid approximately $0.05 per kilowatt hour to its hosting partners for electricity consumed during the First Quarter of 2024.
  • The average fleet efficiency for the active fleet was approximately 28.3 J/TH as of March 31, 2024.
  • The Company earned 111.1 ETH in native staking and 1.3 ETH in liquid staking, respectively, in the First Quarter of 2024.
  • Treasury holdings of BTC and ETH were 956.4 and 16,031.43, respectively, with a fair market value of approximately $68.2 million and $58.5 million on March 31, 2024, respectively.
  • The BTC equivalent4 of our digital asset holdings as of March 31, 2024 (defined as if all ETH and USDC holdings were converted into BTC as of that date) was approximately 1,790.0 BTC5, or approximately $127.7 million.
  • As of March 31, 2024, we had 48,898 miners owned or operating (in Iceland) for bitcoin mining with a total maximum hash rate of 4.2 EH/S.
  • The Company’s active hash rate of its bitcoin mining fleet was approximately 2.76 EH/s as of March 31, 2024.
  • The Company purchased approximately 2,350 bitcoin mining units during the First Quarter of 2024.
  • Approximately 85% of our fleet’s run-rate electricity consumption was generated from carbon-free energy sources as of March 31, 2024. These figures are based on data provided by our hosts, publicly available sources, and internal estimates, demonstrating our commitment to sustainable practices in the digital asset mining industry.
  • The Company had approximately 3,008 ETH actively staked in native staking protocols as of March 31, 2024. The decrease relative to the prior quarter was due to the Company changing its provider for native staking solutions. As of April 30, 2024, the Company had approximately 17,184 ETH actively staked in native staking protocols.
  • On January 22, 2024, approximately 192 servers (1,536 GPUs) began generating revenue from the Company’s AI customer contract. Subsequently, approximately 64 additional servers (512 GPUs) commenced revenue generation on February 2, 2024.
  • On January 26, 2024, the Company finalized an agreement with Coinmint for up to 6 MW of additional mining capacity at Coinmint’s hosting facility in Massena, New York. This new agreement brings the Company’s total contracted hosting capacity with Coinmint to approximately 46 MW.

Management Commentary

“Our First Quarter 2024 results represent a strong start to the year with revenue growing by more than 250% and GAAP Net Income in excess of $50 million. The primary drivers for the improved performance were the commencement of our Bit Digital AI business and a higher realized bitcoin price.

We were well prepared for the halving which occurred in April 2024. Our balance sheet remains a core strength with over $160 million of total liquidity as of March 31, 2024, zero debt, and a growing revenue stream that is not correlated to the economics of bitcoin mining. While we continue to evaluate the post-halving bitcoin mining landscape, our goal of reaching 6.0 EH/s this year remains intact. We are actively engaged in discussions for both incremental hosting opportunities and potential acquisitions.

We continue to believe that capital allocation optionality provided by our complementary business lines is a key differentiator for our Company. We are actively evaluating a number of growth opportunities, both organic and inorganic, across each of our business lines. We are in the late stages of finalizing an agreement to double the size of the GPU fleet for our anchor client and our negotiations with prospective clients are progressing well. Our target of reaching a $100 million annualized revenue run-rate by year-end for this segment remains intact.”

About Bit Digital

Bit Digital, Inc. is a sustainable platform for digital assets and artificial intelligence (“AI”) infrastructure headquartered in New York City. Our bitcoin mining operations are located in the US, Canada, and Iceland. The Company has established a business line, Bit Digital AI, that offers infrastructure services for artificial intelligence applications.  For additional information, please contact ir@bit-digital.com or visit our website at www.bit-digital.com.

Investor Notice 

Investing in our securities involves a high degree of risk. Before making an investment decision, you should carefully consider the risks, uncertainties and forward-looking statements described under “Risk Factors” in Item 3.D of our Annual Report on Form 20-F for the fiscal year ended December 31, 2023. If any material risk was to occur, our business, financial condition or results of operations would likely suffer. In that event, the value of our securities could decline and you could lose part or all of your investment. The risks and uncertainties we describe are not the only ones facing us. Additional risks not presently known to us or that we currently deem immaterial may also impair our business operations. In addition, our past financial performance may not be a reliable indicator of future performance, and historical trends should not be used to anticipate results in the future. Future changes in the network-wide mining difficulty rate or bitcoin hash rate may also materially affect the future performance of Bit Digital’s production of bitcoin. Actual operating results will vary depending on many factors including network difficulty rate, total hash rate of the network, the operations of our facilities, the status of our miners, and other factors. See “Safe Harbor Statement” below.

Safe Harbor Statement 

This press release may contain certain “forward-looking statements” relating to the business of Bit Digital, Inc., and its subsidiary companies. All statements, other than statements of historical fact included herein are “forward-looking statements.” These forward-looking statements are often identified by the use of forward-looking terminology such as “believes,” “expects,” or similar expressions, involving known and unknown risks and uncertainties. Although the Company believes that the expectations reflected in these forward-looking statements are reasonable, they do involve assumptions, risks and uncertainties, and these expectations may prove to be incorrect. Investors should not place undue reliance on these forward-looking statements, which speak only as of the date of this press release. The Company’s actual results could differ materially from those anticipated in these forward-looking statements as a result of a variety of factors, including those discussed in the Company’s periodic reports that are filed with the Securities and Exchange Commission and available on its website at http://www.sec.gov. All forward-looking statements attributable to the Company or persons acting on its behalf are expressly qualified in their entirety by these factors. Other than as required under the securities laws, the Company does not assume a duty to update these forward-looking statements.

Footnotes:

1 This figure excludes approximately 2,701 ETH that were transferred to an internally managed fund.

2 Adjusted EBITDA refers to earnings before interest expense, income tax expense and depreciation and amortization expense (“EBITDA”) adjusted to eliminate the effects of certain non-cash and / or non-recurring items.

3 This figure excludes approximately 2,701 ETH that were transferred to an internally managed fund.

4 “BTC equivalent” is a hypothetical illustration of the value of our digital asset portfolio in bitcoin terms. BTC equivalent is defined as if all non-BTC digital assets, comprised of ETH and USDC, were converted into BTC as of March 31, 2024, and added to our existing BTC balance. Conversion values are found using the closing price on coinmarketcap.com.

5 This figure excludes approximately 2,701 ETH that were transferred to an internally managed fund.

Release – Schwazze Announces First Quarter 2024 Financial Results

Research News and Market Data on SHWZ

DENVER, May 15, 2024 /CNW/ – Medicine Man Technologies, Inc., operating as Schwazze, (OTCQX: SHWZ) (Cboe CA: SHWZ) (“Schwazze” or the “Company”), today announced financial and operational results for the first quarter ended March 31, 2024.

“We delivered another period of revenue growth in Q1 as we further refined our retail strategy while contending with the prolonged competitive challenges in Colorado and New Mexico,” said Forrest Hoffmaster, Interim CEO of Schwazze. “Throughout the quarter, we continued to sharpen our pricing and promotional efforts while enhancing the in-store experience, widening assortment, improving in-stock position, and advancing our loyalty program to attract and retain new customers. We also strengthened our wholesale business with quarter-over-quarter growth, while surpassing 30% total door penetration across both states.”

“The Colorado market remains highly competitive with more than 680 active recreational licenses, underscoring the importance of delivering an exceptional customer experience and fully integrated retail support program. Although retail pricing has recently stabilized, Colorado sales in Q1 were down 10% year-over-year due to lower volumes. Nonetheless, we significantly outpaced the market as our sales were up 9%, demonstrating the effectiveness of our operating playbook to compete in challenging environments. We expect to continue driving improvements in customer acquisition, retention, and loyalty as we further increase market share in the state.”

“In New Mexico, the proliferation of new licenses continued to outpace state cannabis sales as store count in Q1 increased 31% year-over-year while the market grew only 13%. In addition to pricing and promotional efforts, we’ve focused on driving traffic into our stores by expanding assortment with high quality flower and delivering an elevated customer experience. The New Mexico regulatory body has also increased its license enforcement efforts in recent months, contributing to more than 70 store closures and a 33% sequential decrease in net new store openings in the first quarter. We will continue to support the New Mexico Cannabis Control Division as it develops its regulatory framework.”

“Over the past four years we have rapidly scaled our footprint through 13 acquisitions, building a leading retail presence in both Colorado and New Mexico. We are beginning to see positive momentum from our pricing and promotional strategy and will remain focused on driving operating efficiencies while further optimizing our assets as we consolidate cultivation facilities and eliminate underperforming stores that do not meet our high-margin thresholds. We believe these initiatives, coupled with our operating playbook and strict cost controls, will enable us to return to stronger levels of profitability moving forward.”

First Quarter 2024 Financial Summary

  • Announced the grand opening of a medical and recreational dispensary in March under the Everest Apothecary banner in Las Cruces, New Mexico, increasing the Company’s retail footprint to 34 stores across the state.
  • Increased wholesale penetration in the first quarter to more than 30% of total doors in Colorado and New Mexico.
  • Lowell Herb Co. pre-roll sales increased more than 3x quarter-over-quarter in Colorado, where it continues to be the #1 pre-roll in the state.
  • Wana gummy sales up more than 2x quarter-over-quarter in New Mexico.

First Quarter 2024 Financial Results

Total revenue in the first quarter of 2024 increased 4% to $41.6 million compared to $40.0 million for the same quarter last year. The increase was primarily due to growth from new stores compared to the prior year period, partially offset by continued pricing pressure and the proliferation of new licenses in New Mexico.

Gross profit for the first quarter of 2024 was $17.9 million or 43.1% of total revenue, compared to $21.8 million or 54.6% of total revenue for the same quarter last year. The decrease in gross margin was primarily driven by the aforementioned pricing pressure in New Mexico, as well as higher medical sales mix in Colorado.

____________________________
1 Q4 2023 Gross Profit includes one-time, non-cash inventory adjustments of approximately $13.1 million comprised of $3.1 million of product consolidation, obsolescence, and shrinkage expenses, $4.3 million of net realizable value adjustments, and $5.8 million of fair value adjustments on acquired inventory in New Mexico in 2023. 
2  Adjusted EBITDA is a non-GAAP measure as defined by the SEC, and represents earnings before interest, taxes, depreciation, and amortization, adjusted for other income, non-cash share-based compensation, one-time transaction related expenses, or other non-operating costs. The Company uses Adjusted EBITDA as it believes it better explains the results of its core business. See “ADJUSTED EBITDA RECONCILIATION (NON-GAAP)” section herein for an explanation and reconciliations of non-GAAP measure used throughout this release.

Operating expenses for the first quarter of 2024 were $20.6 million compared to $16.2 million for the same quarter last year. The year-ago period benefitted from a payroll tax credit of $3.9M. The remaining increase was primarily driven by personnel expenses and four-wall SG&A costs associated with 21 additional stores in Colorado and New Mexico that are still ramping.

Loss from operations for the first quarter of 2024 was $2.7 million compared to income from operations of $5.6 million in the same quarter last year. Net loss was $16.1 million for the first quarter of 2024 compared to net income of $1.7 million for the same quarter last year.

Adjusted EBITDA for the first quarter of 2024 was $7.3 million compared to $14.5 million for the same quarter last year. The decrease in Adjusted EBITDA was primarily driven by lower gross margin and higher operating expenses associated with the 21 additional stores that are still ramping.

As of March 31, 2024, cash and cash equivalents were $13.2 million compared to $19.2 million on December 31, 2023. Total debt as of March 31, 2024, was $159.7 million compared to $156.8 million on December 31, 2023.

Conference Call

The Company will conduct a conference call today, May 15, 2024, at 5:00 p.m. Eastern time to discuss its results for the first quarter ended March 31, 2024.

Schwazze management will host the conference call, followed by a question-and-answer period. Interested parties may submit questions to the Company prior to the call by emailing ir@schwazze.com.

Date: Wednesday, May 15, 2024
Time: 5:00 p.m. Eastern time
Toll-free dial-in: (888) 664-6383
International dial-in: (416) 764-8650
Conference ID: 84167910
Webcast: SHWZ Q1 2024 Earnings Call

The conference call will also be broadcast live and available for replay on the investor relations section of the Company’s website at https://ir.schwazze.com.

Toll-free replay number: (888) 390-0541
International replay number: (416) 764-8677
Replay ID: 167910

If you have any difficulty registering or connecting with the conference call, please contact Elevate IR at (720) 330-2829.

About Schwazze

Schwazze (OTCQX: SHWZ) (Cboe CA: SHWZ) is building a premier vertically integrated regional cannabis company with assets in Colorado and New Mexico and will continue to explore taking its operating system to other states where it can develop a differentiated regional leadership position. Schwazze is the parent company of a portfolio of leading cannabis businesses and brands spanning seed to sale.

Schwazze is anchored by a high-performance culture that combines customer-centric thinking and data science to test, measure, and drive decisions and outcomes. The Company’s leadership team has deep expertise in retailing, wholesaling, and building consumer brands at Fortune 500 companies as well as in the cannabis sector.

Medicine Man Technologies, Inc. was Schwazze’s former operating trade name. The corporate entity continues to be named Medicine Man Technologies, Inc. Schwazze derives its name from the pruning technique of a cannabis plant to enhance plant structure and promote healthy growth. To learn more about Schwazze, visit https://schwazze.com/.

Forward-Looking Statements

This press release contains “forward-looking statements” within the meaning of the U.S. Private Securities Litigation Reform Act of 1995, Section 27A of the Securities Act of 1933, as amended, and Section 21E of the Securities Exchange Act of 1934, as amended. These forward-looking statements include financial outlooks; any projections of net sales, earnings, or other financial items; any statements of the strategies, plans and objectives of our management team for future operations; expectations in connection with the Company’s previously announced business plans; any statements regarding future economic conditions or performance; and statements regarding the intent, belief or current expectations of our management team. Such statements may be preceded by the words “may,” “will,” “could,” “would,” “should,” “expect,” “intends,” “plans,” “strategy,” “prospects,” “anticipate,” “believe,” “approximately,” “estimate,” “predict,” “project,” “potential,” “continue,” “ongoing,” or the negative of these terms or other words of similar meaning in connection with a discussion of future events or future operating or financial performance, although the absence of these words does not necessarily mean that a statement is not forward-looking. We have based our forward-looking statements on management’s current expectations and assumptions about future events and trends affecting our business and industry. Although we do not make forward-looking statements unless we believe we have a reasonable basis for doing so, we cannot guarantee their accuracy. Therefore, forward-looking statements are not guarantees of future events or performance, are based on certain assumptions, and are subject to various known and unknown risks and uncertainties, many of which are beyond the Company’s control and cannot be predicted or quantified. Consequently, actual events and results may differ materially from those expressed or implied by such forward-looking statements. Such risks and uncertainties include, without limitation, risks and uncertainties associated with (i) regulatory limitations on our products and services and the uncertainty in the application of federal, state, and local laws to our business, and any changes in such laws; (ii) our ability to manufacture our products and product candidates on a commercial scale on our own or in collaboration with third parties; (iii) our ability to identify, consummate, and integrate anticipated acquisitions; (iv) general industry and economic conditions; (v) our ability to access adequate capital upon terms and conditions that are acceptable to us; (vi) our ability to pay interest and principal on outstanding debt when due; (vii) volatility in credit and market conditions; (viii) the loss of one or more key executives or other key employees; and (ix) other risks and uncertainties related to the cannabis market and our business strategy. More detailed information about the Company and the risk factors that may affect the realization of forward-looking statements is set forth in the Company’s filings with the Securities and Exchange Commission (SEC), including the Company’s Annual Report on Form 10-K and its Quarterly Reports on Form 10-Q. Investors and security holders are urged to read these documents free of charge on the SEC’s website at http://www.sec.gov. The Company assumes no obligation to publicly update or revise its forward-looking statements as a result of new information, future events or otherwise except as required by law.

Investor Relations Contact
Sean Mansouri, CFA or Aaron D’Souza
Elevate IR
(720) 330-2829
ir@schwazze.com

MEDICINE MAN TECHNOLOGIES, INC.
CONDENSED CONSOLIDATED BALANCE SHEETS
For the Periods Ended March 31, 2024 and December 31, 2023
Expressed in U.S. Dollars

Click Here for Full Report

Snail (SNAL) – Revenue Deferrals Causes Noisy Results


Thursday, May 16, 2024

Snail is a leading, global independent developer and publisher of interactive digital entertainment for consumers around the world, with a premier portfolio of premium games designed for use on a variety of platforms, including consoles, PCs and mobile devices.

Michael Kupinski, Director of Research, Equity Research Analyst, Digital, Media & Technology , Noble Capital Markets, Inc.

Patrick McCann, CFA, Research Analyst, Noble Capital Markets, Inc.

Refer to the full report for the price target, fundamental analysis, and rating.

Q1 results. The company reported Q1 revenue of $14.1 million, and adj. EBITDA loss of $1.9 million, both of which were lower than our estimates of $24.0 million and $2.8 million, respectively, as illustrated in Figure #1 Results. Importantly, the company deferred $5.5 million of revenue in the quarter, which contributed to the results falling short of expectations. We expect revenue deferrals to be the cause of some noise in operating results during 2024, as the company prepares for the launch of ARK 2.

Deferred revenue recognition. The deferred ASA revenue will be split evenly across five DLCS that are included in the sale of the game and recognized as the DLCs are released. Three of the DLCs included in ASA will be released in 2024 (Q2, Q3, Q4) with the remaining two expected in 2025. Importantly, a portion of the revenue from the sale of ASA are being deferred, but not all of the associated costs are being deferred.


Get the Full Report

Equity Research is available at no cost to Registered users of Channelchek. Not a Member? Click ‘Join’ to join the Channelchek Community. There is no cost to register, and we never collect credit card information.

This Company Sponsored Research is provided by Noble Capital Markets, Inc., a FINRA and S.E.C. registered broker-dealer (B/D).

*Analyst certification and important disclosures included in the full report. NOTE: investment decisions should not be based upon the content of this research summary. Proper due diligence is required before making any investment decision. 

Seanergy Maritime (SHIP) – Strong results give us room to raise our target again


Thursday, May 16, 2024

Seanergy Maritime Holdings Corp. is the only pure-play Capesize ship-owner publicly listed in the US. Seanergy provides marine dry bulk transportation services through a modern fleet of Capesize vessels. The Company’s operating fleet consists of 17 Capesize vessels with an average age of approximately 12 years and aggregate cargo carrying capacity of approximately 3,011,083 dwt. The Company is incorporated in the Marshall Islands and has executive offices in Glyfada, Greece. The Company’s common shares trade on the Nasdaq Capital Market under the symbol “SHIP” and its Class B warrants under “SHIPZ”.

Michael Heim, Senior Vice President, Equity Research Analyst, Energy & Transportation, Noble Capital Markets, Inc.

Refer to the full report for the price target, fundamental analysis, and rating.

Favorable results reflect higher pricing and an expanding fleet. Higher TCE rates reflect increased steel and coal activity as well as increased demand for shipping days due to disruptions in the Red Sea. Management used the favorable environment to lock in pricing for additional operating days in 2024. Management also announced the purchase of its 19th ship.

Strong cash flow allowed the company to pay a special dividend and pay down debt. The company is committed to return proceeds to shareholders though dividends and share repurchases. It made a modest reduction of debt during the quarter, helping to lower financing costs. Interest costs will most likely rise with the next ship purchase.


Get the Full Report

Equity Research is available at no cost to Registered users of Channelchek. Not a Member? Click ‘Join’ to join the Channelchek Community. There is no cost to register, and we never collect credit card information.

This Company Sponsored Research is provided by Noble Capital Markets, Inc., a FINRA and S.E.C. registered broker-dealer (B/D).

*Analyst certification and important disclosures included in the full report. NOTE: investment decisions should not be based upon the content of this research summary. Proper due diligence is required before making any investment decision. 

Codere Online (CDRO) – Q1 Beats: Delivering on Its Strategy


Thursday, May 16, 2024

Codere Online refers, collectively, to Codere Online Luxembourg, S.A. and its subsidiaries. Codere Online launched in 2014 as part of the renowned casino operator Codere Group. Codere Online offers online sports betting and online casino through its state-of-the art website and mobile application. Codere currently operates in its core markets of Spain, Italy, Mexico, Colombia, Panama and the City of Buenos Aires (Argentina). Codere Online’s online business is complemented by Codere Group’s physical presence throughout Latin America, forming the foundation of the leading omnichannel gaming and casino presence in the region.

Michael Kupinski, Director of Research, Equity Research Analyst, Digital, Media & Technology , Noble Capital Markets, Inc.

Patrick McCann, CFA, Research Analyst, Noble Capital Markets, Inc.

Refer to the full report for the price target, fundamental analysis, and rating.

Q1 results. The company reported Q1 revenue of €53.0 million, beating our estimate of €45.0 million by 17.8%. Adj. EBITDA in the quarter was positive €1.7 million, which beat our estimate of a loss of €1.0 million, illustrated in Figure #1 Results. Notably, the company grew revenue by 34% from the prior year period. 

Favorable outlook. The company benefitted from strong revenue growth in Mexico and Spain, which were up 51% and 21%, respectively. Additionally, the company grew its total active customer base by 25% in both markets, and obtained regulatory approval in the province of Mendoza, Argentina. In our view, the company is poised to carry strong momentum through 2024 as it swings toward positive cash flow on a full-year basis.


Get the Full Report

Equity Research is available at no cost to Registered users of Channelchek. Not a Member? Click ‘Join’ to join the Channelchek Community. There is no cost to register, and we never collect credit card information.

This Company Sponsored Research is provided by Noble Capital Markets, Inc., a FINRA and S.E.C. registered broker-dealer (B/D).

*Analyst certification and important disclosures included in the full report. NOTE: investment decisions should not be based upon the content of this research summary. Proper due diligence is required before making any investment decision. 

Bit Digital (BTBT) – A Look into the First Quarter


Thursday, May 16, 2024

Joe Gomes, CFA, Managing Director, Equity Research Analyst, Generalist , Noble Capital Markets, Inc.

Joshua Zoepfel, Research Associate, Noble Capital Markets, Inc.

Refer to the full report for the price target, fundamental analysis, and rating.

Guided by AI. Total revenue for the Company grew 266% y-o-y, driven by higher realized bitcoin price and from the Company’s AI business. The Company recognized $8.1 million of revenue during the quarter and reported a gross margin of 61%. With the potential increase of the segment’s AI contract earlier in the year, we expect the performance of the segment to rival its mining revenue in the coming quarters.

Mining Side. Bit Digital’s bitcoin mining revenue was $21.9 million, a 168% increase from the previous year, as a higher hash rate coupled with the higher bitcoin price drove the revenue. As noted in our previous report, the active hash rate was 2.76 EH/s as of April 30, 2024. The Company has a total of 48,898 miners owned or operating for a total maximum hash rate of 4.2 EH/s. We believe the Company is well on its way towards its active hash goal of 6.0 EH/s.


Get the Full Report

Equity Research is available at no cost to Registered users of Channelchek. Not a Member? Click ‘Join’ to join the Channelchek Community. There is no cost to register, and we never collect credit card information.

This Company Sponsored Research is provided by Noble Capital Markets, Inc., a FINRA and S.E.C. registered broker-dealer (B/D).

*Analyst certification and important disclosures included in the full report. NOTE: investment decisions should not be based upon the content of this research summary. Proper due diligence is required before making any investment decision. 

Inflation Finally Cools – Here’s the Key Number That Stunned Economists

The latest data from the Bureau of Labor Statistics provided a glimmer of hope in the battle against stubbornly high inflation. The Consumer Price Index (CPI) rose by 0.3% in April compared to the previous month, marking the slowest monthly increase in three months. On an annual basis, consumer prices climbed 3.4%, a slight deceleration from March’s 3.5% rise.

These figures indicate that inflationary pressures may be starting to abate, albeit gradually. The monthly increase came in lower than economists’ forecasts of a 0.4% uptick, while the annual rise matched expectations. After months of persistently elevated inflation, any signs of cooling are welcomed by consumers, businesses, and policymakers alike.

The slight easing of inflation was driven by a moderation in some key components of the CPI basket. Notably, the shelter index, which includes rents and owners’ equivalent rent, experienced a slowdown in its annual growth rate, rising 5.5% year-over-year compared to the previous month’s higher rate. However, shelter costs remained a significant contributor to the monthly increase in core prices, excluding volatile food and energy components.

Speaking of core inflation, it also showed signs of cooling, with prices rising 0.3% month-over-month and 3.6% annually, slightly lower than March’s figures. Both measures met economists’ expectations, providing further evidence that the overall inflationary trend may be moderating.

One area that continued to exert upward pressure on prices was energy costs. The energy index jumped 1.1% in April, matching March’s increase, with gasoline prices rising by 2.8% over the previous month. However, it’s worth noting that energy prices can be volatile and subject to fluctuations in global markets and geopolitical factors.

On the other hand, food prices remained relatively stable, with the food index increasing by 2.2% annually but remaining flat from March to April. Within this category, prices for food at home decreased by 0.2%, while prices for food away from home rose by 0.3%.

The April inflation report had a positive impact on financial markets, with investors anticipating a potential easing of monetary policy by the Federal Reserve later this year. The 10-year Treasury yield fell about 6 basis points, and markets began pricing in a roughly 53% chance of the Fed cutting rates at its September meeting, up from about 45% the previous month.

While the April data provided some respite from the relentless climb in consumer prices, it’s important to remember that inflation remains well above the Fed’s 2% target. The battle against inflation is far from over, and the central bank has reiterated its commitment to maintaining tight monetary policy until price stability is firmly established.

As markets and consumers digest the latest inflation report, all eyes will be on the Fed’s upcoming policy meetings and any potential shifts in their stance. A sustained cooling of inflationary pressures could pave the way for more accommodative monetary policy, but any resurgence in price growth could prompt further tightening measures.

In the meantime, businesses and households alike will continue to grapple with the effects of elevated inflation, adjusting their spending and investment decisions accordingly. The April data offers a glimmer of hope, but the road to price stability remains long and arduous.

Want small cap opportunities delivered straight to your inbox?

Channelchek’s free newsletter will give you exclusive access to our expert research, news, and insights to help you make informed investment decisions.

Get Instant Access

Release – Seanergy Maritime Reports Record Financial Results for the Quarter Ended March 31, 2024 and Declares Cash Dividends of $0.15 Per Share

Research News and Market Data on SHIP

Other Highlights and Developments:

  • Record first quarter net income of $10.2 million
  • Cash dividends of $0.15 per share consisting of a quarterly cash dividend of $0.025 per share for Q1 2024 and a special cash dividend of $0.125 per share
  • Total cash dividends of $1.60 per share, or $29.6 million, declared since March 2022
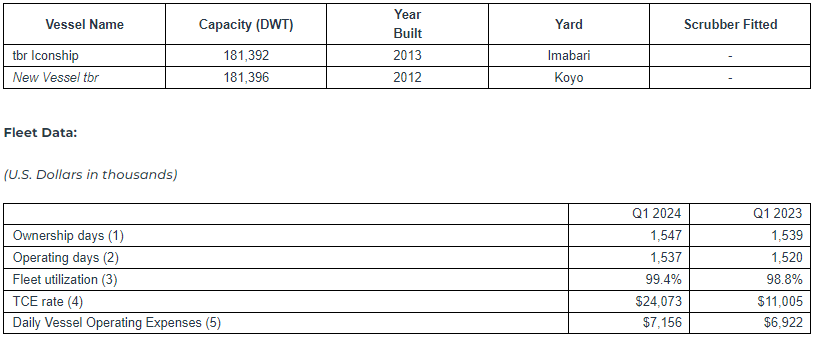
  • Acquisition of two Japanese Capesize vessels, built in 2013 and 2012, with estimated deliveries in Q2 and H2 2024, respectively
  • New financing and refinancing transactions of $58.3 million

ATHENS, Greece, May 15, 2024 (GLOBE NEWSWIRE) — Seanergy Maritime Holdings Corp. (“Seanergy” or the “Company”) (NASDAQ: SHIP), announced today its financial results for the first quarter ended March 31, 2024. The Company also declared a quarterly cash dividend of $0.025 per common share and a special cash dividend of $0.125 per common share for the first quarter of 2024.

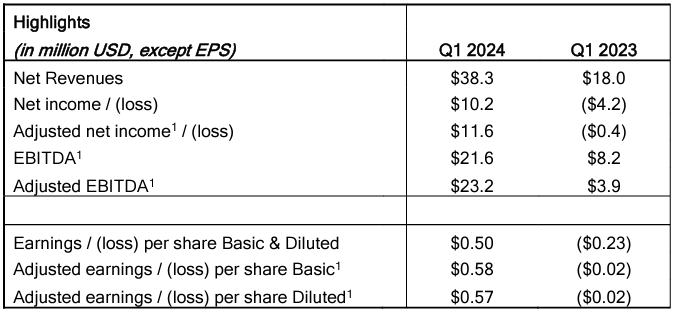
For the quarter ended March 31, 2024, the Company generated Net Revenues of $38.3 million, compared to $18.0 million in the first quarter of 2023. Net Income and Adjusted Net Income for the quarter were $10.2 million and $11.6 million, respectively, compared to Net Loss of $4.2 million and Adjusted Net Loss of $0.4 million in the first quarter of 2023. EBITDA and Adjusted EBITDA for the quarter were $21.6 million and $23.2 million, respectively, compared to $8.2 million and $3.9 million, respectively, for the same period of 2023. The daily Time Charter Equivalent (“TCE”2) of the fleet for the first quarter of 2024 was $24,073, compared to $11,005 in the same period of 2023.

Cash and cash-equivalents and restricted cash, as of March 31, 2024, stood at $24.2 million. Stockholders’ equity at the end of the first quarter was $240.6 million. Long-term debt (senior loans, finance lease liability and other financial liabilities) net of deferred charges stood at $223.2 million, while the book value of the fleet, including a chartered-in vessel and the advances for vessels acquisitions, was $442.0 million.

__________________________
1 Adjusted earnings / (loss) per share, Adjusted Net Income / (loss), EBITDA and Adjusted EBITDA are non-GAAP measures. Please see the reconciliation below of Adjusted earnings / (loss) per share, Adjusted Net Income / (loss), EBITDA and Adjusted EBITDA to net income, the most directly comparable U.S. GAAP measure.
2 TCE rate is a non-GAAP measure. Please see the reconciliation below of TCE rate to net revenues from vessels, the most directly comparable U.S. GAAP measure.


Stamatis Tsantanis, the Company’s Chairman & Chief Executive Officer, stated:

“We are pleased to report that in the first quarter of 2024 we achieved record profits on the back of the continuing positive momentum in the Capesize market. This was mainly driven by higher iron ore exports, healthy coal volumes, as well as certain geopolitical events.

“Seanergy generated a net income of $10.2 million, compared to a net loss of $4.2 million in the same period of 2023, as our fleet performed in line with the market with a daily time charter equivalent of approximately $24,000.

“In light of our strong performance and consistent with our commitment to rewarding our shareholders, our Board authorized paying a quarterly and special cash dividend of $0.15 per share. With these dividends, we have declared total cash dividends of $1.60 per share, or $29.6 million, since March 2022. Given the strong Capesize outlook, we are optimistic that we are well-positioned to continue executing on our clear corporate strategy, which entails rewarding our shareholders generously while growing and renewing our fleet.  

“With regard to our guidance for the second quarter of 2024, based on current FFA levels, we expect our daily TCE to be equal to approximately $26,400, likely outperforming the Capesize market thanks to our proactive hedging strategy. Looking beyond that, for the second half of the year we have converted about 33% of our ownership days to a fixed daily rate of approximately $30,000. We remain vigilant on market developments and are keen to secure attractive daily rates that offer high returns on capital.

“Moving on to fleet developments since our last quarterly update, in March we agreed to acquire an additional Capesize vessel built in 2012 in Japan for a price of $35.6 million that we expect to fund through a combination of cash on hand and debt. Delivery is expected to take place in the second half of 2024, while we continue to evaluate opportunities to add high-performing ships to our fleet. Furthermore, we recently obtained credit committee approval from one of our close lending partners for a new sale and leaseback agreement to finance the previously announced acquisition of the M/V Iconship along with the refinancing of an existing facility at a considerably lower interest margin.

“To conclude with a brief market update, contrary to regular seasonality, the first quarter of 2024 was the strongest of the past decade for Capesize earnings. Brazilian iron ore exports rose about 12% year on year and were the highest since 2019, while coal seaborne trade remained at very high levels. The limited vessel orderbook of the past years seems to be contributing to a gradually improving supply and demand balance, while the geopolitical uncertainty related to the Red Sea crisis has also been marginally constructive for Capesize earnings. On a forward-looking note, the current orderbook suggests fleet growth of about 2% per year for 2025 and 2026, which will likely be surpassed by vessel demand growth according to most industry sources. Longer term, the commitment of major miners to future growth projects as well as the limits on fleet growth brought about by stricter environmental regulations are expected to lead to strong market conditions.

“Seanergy has proven its ability to execute on its fleet growth plan and with its high-quality vessels, strong balance sheet and successful commercial strategy, is well positioned to continue creating shareholder value.”

Company Fleet:

(1) The Company has the option to convert the index-linked rate to fixed for periods ranging between 1 and 12 months, based on the prevailing Capesize FFA Rate for the selected period.

(2) The latest redelivery date does not include any additional optional periods.

(3) The vessel is operated by the Company on the basis of a 12-month bareboat charter-in contract with the owners of the vessel, including a purchase option at the end of the bareboat charter.

Vessels to be delivered:

(1) Ownership days are the total number of calendar days in a period during which the vessels in a fleet have been owned or chartered in. Ownership days are an indicator of the size of the Company’s fleet over a period and affect both the amount of revenues and the amount of expenses that the Company recorded during a period.

(2) Operating days are the number of available days in a period less the aggregate number of days that the vessels are off-hire due to unforeseen circumstances. Available days are the number of ownership days less the aggregate number of days that our vessels are off-hire due to major repairs, dry-dockings, lay-up or special or intermediate surveys. Operating days include the days that our vessels are in ballast voyages without having finalized agreements for their next employment. The Company’s calculation of operating days may not be comparable to that reported by other companies.

(3) Fleet utilization is determined by dividing operating days by ownership days for the relevant period. Fleet Utilization is used to measure a company’s ability to efficiently find suitable employment for its vessels and minimize the number of days that its vessels are off-hire for unforeseen events. We believe it provides additional meaningful information and assists management in making decisions regarding areas where we may be able to improve efficiency and increase revenue and because we believe that it provides useful information to investors regarding the efficiency of our operations.

(4) TCE rate is defined as the Company’s net revenue less voyage expenses during a period divided by the number of the Company’s operating days during the period. Voyage expenses include port charges, bunker (fuel oil and diesel oil) expenses, canal charges and other commissions. The Company includes the TCE rate, which is not a recognized measure under U.S. GAAP, as it believes it provides additional meaningful information in conjunction with net revenues from vessels, the most directly comparable U.S. GAAP measure, and because it assists the Company’s management in making decisions regarding the deployment and use of our vessels and because the Company believes that it provides useful information to investors regarding our financial performance. The Company’s calculation of TCE rate may not be comparable to that reported by other companies. The following table reconciles the Company’s net revenues from vessels to the TCE rate.

(In thousands of U.S. Dollars, except operating days and TCE rate)

(5) Vessel operating expenses include crew costs, provisions, deck and engine stores, lubricants, insurance, maintenance and repairs. Daily Vessel Operating Expenses are calculated by dividing vessel operating expenses, excluding pre delivery costs, by ownership days for the relevant time periods. The Company’s calculation of daily vessel operating expenses may not be comparable to that reported by other companies. The following table reconciles the Company’s vessel operating expenses to daily vessel operating expenses.

(In thousands of U.S. Dollars, except ownership days and Daily Vessel Operating Expenses)

Earnings Before Interest, Taxes, Depreciation and Amortization (“EBITDA”) represents the sum of net income / (loss), Interest and finance costs, net, depreciation and amortization and income taxes, if any, during a period. EBITDA is not a recognized measurement under U.S. GAAP. Adjusted EBITDA represents EBITDA adjusted to exclude stock-based compensation, loss on forward freight agreements, net, loss on extinguishment of debt, and the gain on sale of vessel, which the Company believes are not indicative of the ongoing performance of its core operations.

EBITDA and adjusted EBITDA are presented as we believe that these measures are useful to investors as a widely used means of evaluating operating profitability. Management also uses these non-GAAP financial measures in making financial, operating and planning decisions and in evaluating the Company’s performance. EBITDA and adjusted EBITDA as presented here may not be comparable to similarly titled measures presented by other companies. These non-GAAP measures should not be considered in isolation from, as a substitute for, or superior to, financial measures prepared in accordance with U.S. GAAP.

Adjusted Net income / (loss) Reconciliation and calculation of Adjusted Earnings / (loss) Per Share

(In thousands of U.S. Dollars, except for share and per share data)

To derive Adjusted Net Income / (loss) and Adjusted Earnings / (loss) Per Share, both non-GAAP financial measures, from Net Income / (loss), we exclude non-cash items, as provided in the table above. We believe that Adjusted Net Income / (loss) and Adjusted Earnings / (loss) Per Share assist our management and investors by increasing the comparability of our performance from period to period since each such measure eliminates the effects of such non-cash items as stock based compensation, loss on extinguishment of debt and other items which may vary from year to year, for reasons unrelated to overall operating performance. In addition, we believe that the presentation of the respective measure provides investors with supplemental data relating to our results of operations, and therefore, with a more complete understanding of factors affecting our business than with GAAP measures alone. Our method of computing Adjusted Net Income / (loss) and Adjusted Earnings / (loss) Per Share may not necessarily be comparable to other similarly titled captions of other companies due to differences in methods of calculation.

Second Quarter 2024 TCE Guidance:

As of the date hereof, approximately 79% of the Company fleet’s expected operating days in the second quarter of 2024 have been fixed at an estimated TCE of approximately $27,115. Assuming that for the remaining operating days of our index-linked T/Cs, the respective vessels’ TCE will be equal to the average Forward Freight Agreement (“FFA”) rate of $24,200 per day (based on the FFA curve of April 29, 2024), our estimated TCE for the second quarter of 2024 will be approximately $26,4083. The following table provides the break-down of index-linked charter and fixed-rate charters in the second quarter of 2024:

3 This guidance is based on certain assumptions and there can be no assurance that these TCE estimates, or projected utilization will be realized. TCE estimates include certain floating (index) to fixed rate conversions concluded in previous periods. For vessels on index-linked T/Cs, the TCE realized will vary with the underlying index, and for the purposes of this guidance, the TCE assumed for the remaining operating days of the quarter for an index-linked T/C is equal to the average FFA rate of $24,200 based on the curve of April 29, 2024. Spot estimates are provided using the load-to-discharge method of accounting. The rates quoted are for days currently contracted. Increased ballast days at the end of the quarter will reduce the additional revenues that can be booked based on the accounting cut-offs and therefore the resulting TCE will be reduced accordingly.

First Quarter and Recent Developments:

Distribution of Q4 2023 Dividend and Declaration of Q1 2024 Dividends

On April 10, 2024, the Company paid a quarterly dividend of $0.025 per share and a special dividend of $0.075 per share, for the fourth quarter of 2023, to all shareholders of record as of March 25, 2024.

Continuing its quarterly dividend payments, the Company has declared a quarterly cash dividend of $0.025 per common share for the first quarter of 2024 payable on or about July 10, 2024 to all shareholders of record as of June 25, 2024. In addition, the Company has declared a special dividend of $0.125 per common share to all shareholders of record as of June 25, 2024 which will be paid on or about July 10, 2024.

At-The-Market Offering Program  

Since the filing of the Company’s annual report, the Company has issued and sold 267,585 common shares at an average price of $9.67 per share, resulting in gross proceeds of $2.6 million under the up to $30.0 million “at-the-market” equity offering program initiated in December 2023 with B. Riley as sales agent.

As of May 13, 2024, the Company had 20,779,660 common shares issued and outstanding.

Vessel Transactions and Commercial Updates

Vessel Acquisitions

On February 5, 2024, the Company agreed to acquire a 181,392 dwt Capesize bulk carrier, built in 2013 in Japan, which will be renamed M/V Iconship. The purchase price of $33.7 million is expected to be funded through cash on hand and the AVIC Sale & leaseback agreement. The M/V Iconship is expected to be delivered to the Company within June 2024.

On March 18, 2024, the Company agreed to acquire a 181,396 dwt Capesize bulk carrier, built in 2012 in Japan. The purchase price of $35.6 million is expected to be funded through a combination of cash on hand and debt financing. The vessel is expected to be delivered to the Company between July and October 2024.

M/V Knightship – Time charter extension

In May 2024, the charterer of the M/V Knightship exercised the second optional period extending the time charter which will commence in December 2024. The extension period is for a minimum of 11 months to a maximum of 13 months, while all other main terms of the time charter remain the same.

Financing Updates

AVIC Sale & leaseback agreement

The Company obtained credit committee approval from one of its close lending partners for three separate sale and leaseback agreements of $58.3 million in aggregate to refinance the sale and leaseback agreements with CMBFL, secured by the M/Vs Hellasship and Patriotship, and to partially finance the acquisition of the M/V Iconship. The vessels will be sold and chartered back on a bareboat basis for a five-year period commencing on each delivery date. The Company will have continuous options to repurchase the vessels at predetermined prices at any time of the bareboat charter. At the end of the bareboat period, Seanergy will have the obligation to purchase the vessels for an aggregate amount of approximately $31.5 million. Each financing will bear interest of 3-month term SOFR plus 2.55% per annum. The new interest rate will be approximately 120 bps lower than the rate of the refinanced sale and leaseback agreements. In aggregate for the three vessels, the charterhire principals will amortize over twenty consecutive quarterly installments, averaging approximately $1.3 million per quarter. The agreements are subject to the completion of definitive documentation.

Conference Call:

The Company’s management will host a conference call to discuss financial results on May 15, 2024 at 10:00 a.m. Eastern Time.

Audio Webcast:

There will be a live, and then archived, webcast of the conference call available through the Company’s website. To listen to the archived audio file, visit our website, following the Webcasts & Presentations section under our Investor Relations page. Participants to the live webcast should register on the Seanergy website approximately 10 minutes prior to the start of the webcast, following this link.

Conference Call Details:

Participants have the option to register for the call using the following link. You can use any number from the list or add your phone number and let the system call you right away.

Click Here for Full Report

Release – PDS Biotech Provides Business Update and Reports First Quarter 2024 Financial Results

Research News and Market Data on PDSB

Provided Positive, Updated Data from Phase 2 VERSATILE-002 Clinical Trial with Versamune® HPV in Combination with KEYTRUDA® in Recurrent or Metastatic Head and Neck Cancer

Expanded Global Intellectual Property Surrounding Versamune® Platform

PRINCETON, N.J., May 15, 2024 (GLOBE NEWSWIRE) — PDS Biotechnology Corporation (Nasdaq: PDSB) (“PDS Biotech” or the “Company”), a late-stage immunotherapy company focused on transforming how the immune system targets and kills cancers and the development of infectious disease vaccines, today provided a business update and reported financial results for the first quarter of 2024. The press release will be available in the Investor Relations section of the Company’s website at www.pdsbiotech.com.

Recent Developments

  • Hosted a Key Opinion Leader event on May 8, 2024, during which prominent experts in head and neck squamous cell cancer (“HNSCC”) discussed positive, updated VERSATILE-002 data and the unmet need in HPV16-positive HNSCC. A replay of the event can be found here.
  • Announced updated results from the VERSATILE-002 Phase 2 trial evaluating first line treatment of patients with HPV16-positive recurrent or metastatic HNSCC using Versamune® HPV + KEYTRUDA® (pembrolizumab) (n=53).
    • Median overall survival is 30 months; Published results for immune checkpoint inhibitors are 7-18 months.
    • The cohort met its primary endpoint of best overall response (BOR).
    • BOR by investigator assessment is 34% (Combined Positive Score (CPS) ≥1; n=18/53); 48% (CPS≥20; n=10/21); Published results for ICIs are <20% (CPS>1) and <25% (CPS≥20).
      • CPS is used to assess PD-L1 expression
    • Progression free survival is 6.3 months (CPS≥1); 14.1 months (CPS≥20); Published results for immune checkpoint inhibitors 2-3 months.
    • VERSATILE-002 data to date indicate a durable response in first line recurrent or metastatic HNSCC patients with CPS≥1.
    • The combination of Versamune® HPV + pembrolizumab was well tolerated.
  • Announced an updated clinical strategy with a two-part registrational trial focused on the triple combination of Versamune® HPV + PDS01ADC + pembrolizumab as a first line treatment in HPV16-positive recurrent or metastatic HNSCC.
    • PDS01ADC is the Company’s novel, investigational tumor-targeting IL-12-fused antibody-drug conjugate (ADC), which has shown promise in a clinical trial of Versamune® HPV + PDS01ADC + an investigational ICI conducted by the National Cancer Institute.
    • Part one of the clinical trial will focus on dose optimization with a data readout based on safety and objective response rate.
    • The randomized second part of the trial will include an interim data readout with overall survival as its primary endpoint.
  • Further strengthened management with the addition of Stephan Toutain, M.S., MBA, as Chief Operating Officer. Mr. Toutain brings extensive operational and commercial experience to PDS Biotech.

Versamune® Platform Intellectual Property

  • Company received patents granted by the Israel Patent Office and IP Australia that will extend protections for the Company’s novel investigational T cell activating Versamune® platform through Dec. 2038 and Nov. 2036, respectively.
    • The Israel Patent Office granted patent No. 275154 titled, “Methods and compositions comprising cationic lipids for stimulating type I interferon genes,” extending protections for compositions using the Versamune® platform and comprising of cationic lipid for activating type I interferons. This patent covers all formulations and compositions that include Versamune to activate a T cell response.
    • IP Australia granted patent No. 2016354590 titled, “Lipids as synthetic vectors to enhance antigen processing and presentation ex-vivo in dendritic cell therapy.” This patent covers the use of Versamune® compositions that reduce the populations of immune suppressive cells in the tumor and its application for the development of dendritic cell-based approaches to immunotherapy.

First Quarter 2024 Financial Results
Reported net loss was approximately $10.6 million, or $0.30 per basic share and diluted share, for the three months ended March 31, 2024, compared to a net loss of $9.7 million, or $0.32 per basic share and diluted share, for the three months ended March 31, 2023. The increase was due to higher operating and net interest expenses.

Research and development expenses increased to approximately $6.7 million for the three months ended March 31, 2024, from $5.8 million for the three months ended March 31, 2023. The increase of $0.9 million was primarily attributable to an increase of $1.2 million in clinical studies and medical affairs offset by a decrease of $0.1 million in personnel costs, $0.1 million in professional fees and $0.1 million in manufacturing expenses.

General and administrative expenses decreased to approximately $3.4 million for the three months ended March 31, 2024, from approximately $3.6 million for the three months ended March 31, 2023. The decrease of $0.2 million was primarily attributable to an increase of $0.3 million in professional fees offset by a decrease of $0.5 million in personnel costs.

Total operating expenses increased to approximately $10.1 million for the three months ended March 31, 2024 from $9.4 million for the three months ended March 31, 2023.

Net interest expenses increased to approximately $0.5 million for the three months ended March 31, 2024 from $0.2 million for the three months ended March 31, 2023.

Cash and cash equivalents as of March 31, 2024, totaled approximately $66.6 million.

About PDS Biotechnology
PDS Biotechnology is a late-stage immunotherapy company focused on transforming how the immune system targets and kills cancers and the development of infectious disease vaccines. The Company plans to initiate a pivotal clinical trial in 2024 to advance its lead program in advanced head and neck squamous cell cancers (HNSCC). PDS Biotech’s lead program is a proprietary dual-acting combination of IL-12 fused antibody drug conjugate (ADC) PDS01ADC and T-cell activator Versamune® HPV in regimen with a standard-of-care immune checkpoint inhibitor. We believe that proof-of-concept long-term data have shown positive survival results and tumor shrinkage with this combination and indicate favorable tolerability.

We believe that with a novel investigational “inside-outside” mechanism, the PDS01ADC and Versamune® HPV immunotherapy has shown compelling results with potential to successfully disrupt a tumor’s inside defenses, while also generating potent, targeted killer T-cells to attack the tumor from the outside. We believe that data from more than 350 patients, as well as ongoing clinical trials across multiple tumor types and standard treatment regimens, have validated the potential for both platforms and point to potential broad utility.

Our Infectimune® based vaccines have demonstrated the potential to induce not only robust and durable neutralizing antibody responses, but also powerful T-cell responses, including long-lasting memory T-cell responses in pre-clinical studies to date. For more information, please visit www.pdsbiotech.com.

Forward Looking Statements
This communication contains forward-looking statements (including within the meaning of Section 21E of the United States Securities Exchange Act of 1934, as amended, and Section 27A of the United States Securities Act of 1933, as amended) concerning PDS Biotechnology Corporation (the “Company”) and other matters. These statements may discuss goals, intentions and expectations as to future plans, trends, events, results of operations or financial condition, or otherwise, based on current beliefs of the Company’s management, as well as assumptions made by, and information currently available to, management. Forward-looking statements generally include statements that are predictive in nature and depend upon or refer to future events or conditions, and include words such as “may,” “will,” “should,” “would,” “expect,” “anticipate,” “plan,” “likely,” “believe,” “estimate,” “project,” “intend,” “forecast,” “guidance”, “outlook” and other similar expressions among others. Forward-looking statements are based on current beliefs and assumptions that are subject to risks and uncertainties and are not guarantees of future performance. Actual results could differ materially from those contained in any forward-looking statement as a result of various factors, including, without limitation: the Company’s ability to protect its intellectual property rights; the Company’s anticipated capital requirements, including the Company’s anticipated cash runway and the Company’s current expectations regarding its plans for future equity financings; the Company’s dependence on additional financing to fund its operations and complete the development and commercialization of its product candidates, and the risks that raising such additional capital may restrict the Company’s operations or require the Company to relinquish rights to the Company’s technologies or product candidates; the Company’s limited operating history in the Company’s current line of business, which makes it difficult to evaluate the Company’s prospects, the Company’s business plan or the likelihood of the Company’s successful implementation of such business plan; the timing for the Company or its partners to initiate the planned clinical trials for PDS01ADC, PDS0101, PDS0203 and other Versamune® and Infectimune® based product candidates; the future success of such trials; the successful implementation of the Company’s research and development programs and collaborations, including any collaboration studies concerning PDS01ADC, PDS0101, PDS0203 and other Versamune® and Infectimune® based product candidates and the Company’s interpretation of the results and findings of such programs and collaborations and whether such results are sufficient to support the future success of the Company’s product candidates; the success, timing and cost of the Company’s ongoing clinical trials and anticipated clinical trials for the Company’s current product candidates, including statements regarding the timing of initiation, pace of enrollment and completion of the trials (including the Company’s ability to fully fund its disclosed clinical trials, which assumes no material changes to the Company’s currently projected expenses), futility analyses, presentations at conferences and data reported in an abstract, and receipt of interim or preliminary results (including, without limitation, any preclinical results or data), which are not necessarily indicative of the final results of the Company’s ongoing clinical trials; any Company statements about its understanding of product candidates mechanisms of action and interpretation of preclinical and early clinical results from its clinical development programs and any collaboration studies; the Company’s ability to continue as a going concern; and other factors, including legislative, regulatory, political and economic developments not within the Company’s control. The foregoing review of important factors that could cause actual events to differ from expectations should not be construed as exhaustive and should be read in conjunction with statements that are included herein and elsewhere, including the other risks, uncertainties, and other factors described under “Risk Factors,” “Management’s Discussion and Analysis of Financial Condition and Results of Operations” and elsewhere in the documents we file with the U.S. Securities and Exchange Commission. The forward-looking statements are made only as of the date of this press release and, except as required by applicable law, the Company undertakes no obligation to revise or update any forward-looking statement, or to make any other forward-looking statements, whether as a result of new information, future events or otherwise.  

Versamune® and Infectimune® are registered trademarks of PDS Biotechnology Corporation.

Keytruda® is a registered trademark of Merck Sharp and Dohme LLC, a subsidiary of Merck & Co., Inc., Rahway, N.J., USA.

Investor Contact:
Mike Moyer
LifeSci Advisors
Phone +1 (617) 308-4306
Email: mmoyer@lifesciadvisors.com

Media Contact:
Gina Mangiaracina
6 Degrees
Phone +1 (917) 797-7904
Email: gmangiaracina@6degreespr.com

View full release HERE.

Release – ZyVersa Therapeutics Reports First Quarter, 2024 Financial Results and Provides Business Update

Research News and Market Data on ZVSA

May 15, 2024

PDF Version

Key Highlights:

  • Second research site selected to enhance enrollment in the Phase 2a clinical trial for Cholesterol Efflux MediatorTM VAR 200 in patients with diabetic kidney disease planned to begin H1-2024.
  • GLP toxicology studies for Inflammasome ASC Inhibitor IC 100 scheduled to begin H1-2024, with planned Investigational New Drug (IND) submission Q4-2024, and Phase 1 clinical trial initiation Q1-2025.Atherosclerosis preclinical data readout for Inflammasome ASC Inhibitor IC 100 on schedule for H1-2024.
  • Initiation of preclinical study to assess Inflammasome ASC Inhibitor IC 100 for obesity-associated metabolic comorbidities scheduled to begin Q2-2024 with completion expected by year’s end.
  • Raised $2.7 million from exercising of investor warrants.

WESTON, Fla., May 15, 2024 (GLOBE NEWSWIRE) — ZyVersa Therapeutics, Inc. (Nasdaq: ZVSA, or “ZyVersa”), a clinical-stage specialty biopharmaceutical company developing first-in-class drugs for the treatment of renal and inflammatory diseases with high unmet medical needs, reports financial results for the quarter ended March 31, 2024 and provides business update.

“We are pleased to announce that ZyVersa is on track to achieve key development milestones over the next 3 quarters,” stated Stephen C. Glover, ZyVersa’s Co-founder, Chairman, CEO, and President. “Our Phase 2a clinical trial with Cholesterol Efflux MediatorTM VAR 200 in diabetic kidney disease is expected to enroll the first patient(s) within the next few months, with initial data read-out in the second half of the year. Inflammasome ASC Inhibitor IC 100’s indication expansion studies are nearing completion for atherosclerosis, expected to conclude in June, and obesity-associated metabolic comorbidities, expected to conclude by year’s end. IND preparation has been initiated for IC 100, with submission targeted for year’s end, and initiation of a phase 1 clinical trial in first quarter 2025. We believe achievement of these milestones is a key inflection point for ZyVersa and for shareholder value.” 

BUSINESS Update

CHOLESTEROL EFFLUX MEDIATORTM VAR 200 FOR RENAL DISEASE

  • Phase 2a clinical trial in diabetic kidney disease is on target to begin H1-2024
    • CRO, George Clinical, was engaged in December 2023 to initiate and manage the trial.
    • A central Institutional Review Board (IRB) approved the clinical trial protocol for trial initiation.
    • Two clinical research sites have been selected, with contracting nearing completion.
    • Enrollment of first patient(s) is expected in the next few months.

INFLAMMASOME ASC INHIBITOR IC 100 FOR INFLAMMATORY DISEASES

  • Inflammasome ASC Inhibitor IC 100’s preclinical program nearing completion, with GLP toxicology studies expected to begin H1-2024. IND submission is planned for Q4-2024, followed by initiation of a Phase 1 clinical trial in Q1-2025.
  • Data from a scientific collaboration with an undisclosed partner to assess the potential of Inflammasome ASC Inhibitor IC 100 as a treatment for atherosclerosis in a well-established animal model is expected in June.
  • A scientific collaboration with inflammasome and neurology experts at University of Miami Miller School of Medicine to assess the potential of Inflammasome ASC Inhibitor IC 100 as a treatment for obesity-associated metabolic comorbidities is expected to begin in Q2-2024, with completion in Q4-2024.
  • In vitro preclinical research funded by The Michael J. Fox Foundation (MJFF) and conducted by researchers at University of Miami (UM) Miller School of Medicine supported Inflammasome ASC Inhibitor IC 100’s mechanism of action and potential to block damaging neuroinflammation that induces neural degeneration in Parkinson’s disease. At the suggestion of MJFF, UM researchers are developing a grant request to further the research in an established animal model.

FIRST QUARTER FINANCIAL RESULTS

Net losses were approximately $2.8 million for the three months ended March 31, 2024, with an improvement of $0.7 million or 20.2% compared to a net loss of approximately $3.5 million, for the three months ended March 31, 2023.

Based on its current operating plan, ZyVersa expects its cash of $2.0 million as of March 31, 2024 will be sufficient to fund its operating expenses and capital expenditure requirements on a month-to-month basis. ZyVersa will need additional financing to support its continuing operations and to meet its stated milestones. ZyVersa will seek to fund its operations and clinical activity through public or private equity or debt financings or other sources, which may include government grants, collaborations with third parties or outstanding warrant exercises. During Q1, ZyVersa raised approximately $2.7 million from investors exercising in-the-money warrants.

Research and development expenses were $0.5 million for the three months ended March 31, 2024, a decrease of $0.5 million or 51.4% from $1.1 million for the three months ended March 31, 2023. The decrease is attributable to lower manufacturing costs of IC 100 of $0.4 million and lower research and development payroll costs of $0.2 million due to fewer employees. This was offset by an increase in CRO fees of $0.1 million for VAR 200.

General and administrative expenses were $2.3 million for the three months ended March 31, 2024, a decrease of $1.2 million or 34.6% from $3.5 million for the three months ended March 31, 2023. The decrease is primarily attributable to a decrease of $0.4 million in payments for the Effectiveness Failure related to the PIPE shares, a decrease of $0.4 million for bonus accruals, a $0.2 million decrease in accounting fees and a $0.1 million decrease in director and officer insurance.

About ZyVersa Therapeutics, Inc.

ZyVersa (Nasdaq: ZVSA) is a clinical stage specialty biopharmaceutical company leveraging advanced, proprietary technologies to develop first-in-class drugs for patients with renal and inflammatory diseases who have significant unmet medical needs. The Company is currently advancing a therapeutic development pipeline with multiple programs built around its two proprietary technologies – Cholesterol Efflux Mediator™ VAR 200 for treatment of kidney diseases, and Inflammasome ASC Inhibitor IC 100, targeting damaging inflammation associated with numerous CNS and peripheral inflammatory diseases. For more information, please visit www.zyversa.com.

Cautionary Statement Regarding Forward-Looking Statements

Certain statements contained in this press release regarding matters that are not historical facts, are forward-looking statements within the meaning of Section 21E of the Securities Exchange Act of 1934, as amended, and the Private Securities Litigation Reform Act of 1995. These include statements regarding management’s intentions, plans, beliefs, expectations, or forecasts for the future, and, therefore, you are cautioned not to place undue reliance on them. No forward-looking statement can be guaranteed, and actual results may differ materially from those projected. ZyVersa Therapeutics, Inc. (“ZyVersa”) uses words such as “anticipates,” “believes,” “plans,” “expects,” “projects,” “future,” “intends,” “may,” “will,” “should,” “could,” “estimates,” “predicts,” “potential,” “continue,” “guidance,” and similar expressions to identify these forward-looking statements that are intended to be covered by the safe-harbor provisions. Such forward-looking statements are based on ZyVersa’s expectations and involve risks and uncertainties; consequently, actual results may differ materially from those expressed or implied in the statements due to a number of factors, including ZyVersa’s plans to develop and commercialize its product candidates, the timing of initiation of ZyVersa’s planned preclinical and clinical trials; the timing of the availability of data from ZyVersa’s preclinical and clinical trials; the timing of any planned investigational new drug application or new drug application; ZyVersa’s plans to research, develop, and commercialize its current and future product candidates; the clinical utility, potential benefits and market acceptance of ZyVersa’s product candidates; ZyVersa’s commercialization, marketing and manufacturing capabilities and strategy; ZyVersa’s ability to protect its intellectual property position; and ZyVersa’s estimates regarding future revenue, expenses, capital requirements and need for additional financing.

New factors emerge from time-to-time, and it is not possible for ZyVersa to predict all such factors, nor can ZyVersa assess the impact of each such factor on the business or the extent to which any factor, or combination of factors, may cause actual results to differ materially from those contained in any forward-looking statements. Forward-looking statements included in this press release are based on information available to ZyVersa as of the date of this press release. ZyVersa disclaims any obligation to update such forward-looking statements to reflect events or circumstances after the date of this press release, except as required by applicable law.

This press release does not constitute an offer to sell, or the solicitation of an offer to buy, any securities.

Corporate, Media, IR Contact

Karen Cashmere
Chief Commercial Officer
kcashmere@zyversa.com
786-251-9641 

View full release HERE.

Release – Unicycive Therapeutics Presents Bioequivalence Data On Oxylanthanum Carbonate (OLC) At The National Kidney Foundation Spring Clinical Meeting

Research News and Market Data on UNCY

Unicycive Therapeutics Presents Bioequivalence Data On Oxylanthanum Carbonate (OLC) At The National Kidney Foundation Spring Clinical Meeting

May 15, 2024 7:03am EDT Download as PDF

– OLC Demonstrates Bioequivalence to Lanthanum Carbonate –

– Additional Poster Highlights Key Features of OLC as Perceived by Renal Dieticians –

LOS ALTOS, Calif., May 15, 2024 (GLOBE NEWSWIRE) — Unicycive Therapeutics, Inc. (Nasdaq: UNCY), a clinical-stage biotechnology company developing therapies for patients with kidney disease (the “Company or “Unicycive”), today announced that two posters related to the Company’s lead product candidate, oxylanthanum carbonate (OLC), were presented at the National Kidney Foundation (NKF) Spring Clinical Meeting. OLC is a next-generation lanthanum-based phosphate binding agent utilizing proprietary nanoparticle technology being developed for the treatment of hyperphosphatemia in patients with chronic kidney disease (CKD).

“The NKF Spring Clinical Meeting was an important meeting for Unicycive as we were able to present data from the OLC bioequivalence study and our second poster was featured as a top-rated submission,” said Shalabh Gupta, MD, Chief Executive Officer of Unicycive. “Phosphate binders are integral to the management of hyperphosphatemia in patients with CKD and their effectiveness is adversely affected by non-adherence and limitations of phosphate binding capacity relative to dietary intake. Our data confirms that OLC is bioequivalent to lanthanum carbonate (LC) by showing similar outcomes in both groups with respect to mean change in urinary phosphate excretion. Importantly, OLC demonstrated a well-tolerated safety profile with no serious adverse events. This data is important as it serves as one of the key components for our New Drug Application filing with the FDA under the 505(b)(2) regulatory pathway.”

Dr. Gupta, concluded, “We are grateful to Dr. Hill Gallant who delivered a poster presentation on a survey of renal dieticians who play a critical role in helping patients manage serum phosphate and are close witnesses to patients’ experiences and challenges with phosphate management. The findings of the survey concluded that strategies that reduce pill burden and increase ease of use for patients are needed, reinforcing our belief that, if approved, the characteristics of OLC including the reduction of pill volume may increase compliance and improve the quality of life for patients living with this condition.”

Presentation Details:

Title: Two-Way Crossover Study to Establish Pharmacodynamic Bioequivalence Between Oxylanthanum Carbonate and Lanthanum Carbonate
Lead Author: Vandana Mathur, MD
Results: The poster presentation described the results of the randomized, crossover bioequivalence study comparing OLC with lanthanum carbonate (LC). The study was a Phase 1, single-center, randomized 1:1, open-label, controlled, 2-way crossover study designed to demonstrate the pharmacodynamic (PD) equivalence between two phosphate binders: orally administered OLC as compared to LC. Both treatments were administered at doses of one 1000 mcg tablet three-times-a-day (TID) in healthy volunteers who received the same standardized meals to control for daily phosphate intake. OLC tablets are swallowed whole as opposed to the LC tablets that must be chewed completely. The study consisted of a screening period, two dosing periods separated by a 14-day washout period, and a follow-up period 7 days after last study drug dose. The primary PD variable was Least Squares (LS) mean change in urinary phosphate excretion from baseline (48hrs prior to dosing) to Evaluation Period (Days 1-3). The baseline characteristics were balanced between OLC/LC and LC/OLC sequences. LS mean change from baseline for OLC (-320.4mg/day) was similar to the LS mean change from BL for LC (-324.0mg/day). The 90% confidence interval for the LS mean change in urinary phosphate excretion from baseline (test-reference) was (-37.83, 45.12), which was entirely contained within the predefined ±20% acceptance range of (-64.80, 64,80). There were no serious adverse events (SAEs) and no treatment discontinuations. The incidence of treatment-emergent adverse events (TEAEs) and related AEs were also the same in both groups at 35% and 25%, respectively.

Title: Renal Dietitians Perceive Phosphate Binder and Low-Phosphate Diet Non-Compliance as Top Reasons for Above Target Serum Phosphorous Concentrations
Lead Author: Kathleen Hill Gallant, PhD, RD
Results: The poster presentation delivers results of a recent dietitian survey evaluating perceived reasons for noncompliance to phosphate binder (PB) therapy and identifies the most appealing potential aspects of OLC. The poster concluded that strategies that reduce pill burden and increase ease of use for patients may promote PB treatment compliance, which may improve patient outcomes. OLC, which is a smaller tablet that can be swallowed whole without chewing, may address compliance issues seen with current PBs. In fact, 47% of dieticians noted the high perceived potency of OLC and 34% noted its perceived lower number of pills required as the most appealing aspects of OLC.

Recent studies reported PB non-adherence rates of up to 78% in patients with end-stage kidney disease on dialysis. For the analysis, 100 renal dietitians were surveyed and there were several key findings. The most common reasons for phosphate levels above the target range were non-compliance to PB prescription (36%) or low phosphate diet (34%). The two leading reasons for PB discontinuation were too many pills and formulation issues. One-third of dietitians attributed non-compliance with patients forgetting to take their PBs with meals or snacks and 16% attributed it to high pill burden.

About Oxylanthanum Carbonate (OLC)

Oxylanthanum carbonate is a next-generation lanthanum-based phosphate binding agent utilizing proprietary nanoparticle technology being developed for the treatment of hyperphosphatemia in patients with chronic kidney disease (CKD). OLC has over forty issued and granted patents globally. Its potential best-in-class profile may have meaningful patient adherence benefits over currently available treatment options as it requires a lower pill burden for patients in terms of number and size of pills per dose that are swallowed instead of chewed. Based on a survey conducted in 2022, Nephrologists stated that the greatest unmet need in the treatment of hyperphosphatemia with phosphate binders is a lower pill burden and better patient compliance.1 The global market opportunity for treating hyperphosphatemia is projected to be in excess of $2.5 billion in 2023, with the United States accounting for more than $1 billion of that total. Despite the availability of several FDA-cleared medications, 75 percent of U.S. dialysis patients fail to achieve the target phosphorus levels recommended by published medical guidelines.

Unicycive is seeking FDA approval of OLC via the 505(b)(2) regulatory pathway. As part of the clinical development program, two clinical studies were conducted in over 100 healthy volunteers. The first study was a dose-ranging Phase I study to determine safety and tolerability. The second study was a randomized, open-label, two-way crossover bioequivalence study to establish pharmacodynamic bioequivalence between OLC and Fosrenol. Based on the topline results of the bioequivalence study, pharmacodynamic (PD) bioequivalence of OLC to Fosrenol was established.

Fosrenol® is a registered trademark of Shire International Licensing BV.
1Reason Research, LLC 2022 survey. Results here.

About Hyperphosphatemia

Hyperphosphatemia is a serious medical condition that occurs in nearly all patients with End Stage Renal Disease (ESRD). If left untreated, hyperphosphatemia leads to secondary hyperparathyroidism (SHPT), which then results in renal osteodystrophy (a condition similar to osteoporosis and associated with significant bone disease, fractures and bone pain); cardiovascular disease with associated hardening of arteries and atherosclerosis (due to deposition of excess calcium-phosphorus complexes in soft tissue). Importantly, hyperphosphatemia is independently associated with increased mortality for patients with chronic kidney disease on dialysis. Based on available clinical data to date, over 80% of patients show signs of cardiovascular calcification by the time they become dependent on dialysis.

Dialysis patients are already at an increased risk for cardiovascular disease (because of underlying diseases such as diabetes and hypertension), and hyperphosphatemia further exacerbates this. Treatment of hyperphosphatemia is aimed at lowering serum phosphate levels via two means: (1) restricting dietary phosphorus intake; and (2) using, on a daily basis, and with each meal, oral phosphate binding drugs that facilitate fecal elimination of dietary phosphate rather than its absorption from the gastrointestinal tract into the bloodstream.

About Unicycive Therapeutics

Unicycive Therapeutics is a biotechnology company developing novel treatments for kidney diseases. Unicycive’s lead drug candidate, oxylanthanum carbonate (OLC), is a novel investigational phosphate binding agent being developed for the treatment of hyperphosphatemia in chronic kidney disease patients on dialysis. UNI-494 is a patent-protected new chemical entity in late preclinical development for the treatment of acute kidney injury. For more information, please visit Unicycive.com and follow us on LinkedIn and YouTube.

Forward-looking statements

Certain statements in this press release are forward-looking within the meaning of the Private Securities Litigation Reform Act of 1995. These statements may be identified using words such as “anticipate,” “believe,” “forecast,” “estimated” and “intend” or other similar terms or expressions that concern Unicycive’s expectations, strategy, plans or intentions. These forward-looking statements are based on Unicycive’s current expectations and actual results could differ materially. There are several factors that could cause actual events to differ materially from those indicated by such forward-looking statements. These factors include, but are not limited to, clinical trials involve a lengthy and expensive process with an uncertain outcome, and results of earlier studies and trials may not be predictive of future trial results; our clinical trials may be suspended or discontinued due to unexpected side effects or other safety risks that could preclude approval of our product candidates; risks related to business interruptions, which could seriously harm our financial condition and increase our costs and expenses; dependence on key personnel; substantial competition; uncertainties of patent protection and litigation; dependence upon third parties; and risks related to failure to obtain FDA clearances or approvals and noncompliance with FDA regulations. Actual results may differ materially from those indicated by such forward-looking statements as a result of various important factors, including: the uncertainties related to market conditions and other factors described more fully in the section entitled ‘Risk Factors’ in Unicycive’s Annual Report on Form 10-K for the year ended December 31, 2023, and other periodic reports filed with the Securities and Exchange Commission. Any forward-looking statements contained in this press release speak only as of the date hereof, and Unicycive specifically disclaims any obligation to update any forward-looking statement, whether as a result of new information, future events or otherwise.

Investor Contact:

ir@unicycive.com
(650) 543-5470

SOURCE: Unicycive Therapeutics, Inc.

Released May 15, 2024