Noble Capital Markets Media Sector Review – Q3 2023

INTERNET AND DIGITAL MEDIA COMMENTARY

Internet & Digital Media Stocks Outperform – But Don’t Get Too Excited

After increasing by 8% in the second quarter of 2023, the S&P 500 was unable to hold onto those gains in the third quarter.  The S&P index decreased by 4% in the third quarter, a decline which we attribute to the market revising its interest rate expectations to one in which rates would remain “higher for longer”.  Large cap stocks that weighed on the broad market index included tech stocks such as Apple (AAPL: -12%), Microsoft (MSFT: -7%) and Tesla (TSLA:  -4%).  Despite this small step backwards, the S&P 500 Index increased by 20% through the first nine months of the year. 

Each of Noble’s Internet and Digital Media Indices, which are market cap weighted, outperformed the S&P 500 in the third quarter, but the double-digit gains from the previous quarter (2Q 2023) moderated significantly.  Sectors that outperformed the S&P 500’s 4% increase include Noble’s Digital Media Index (+6%), Social Media Index (+4%), Gaming Index (+3%), Ad Tech Index (+1%) and MarTech Index (-3%).  Despite these relatively positive results, the prevailing theme within each sector was that the largest cap stocks performed the best while smaller cap stocks across a variety of sectors struggled.

STOCK MARKET PERFORMANCE: INTERNET AND DIGITAL MEDIA

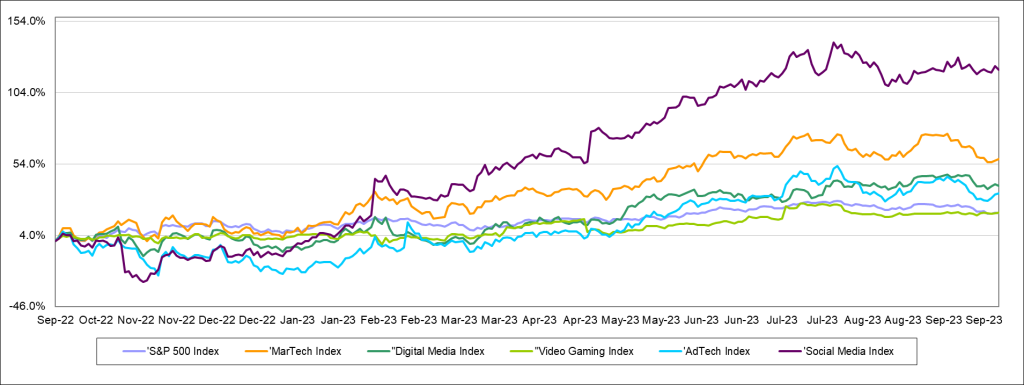
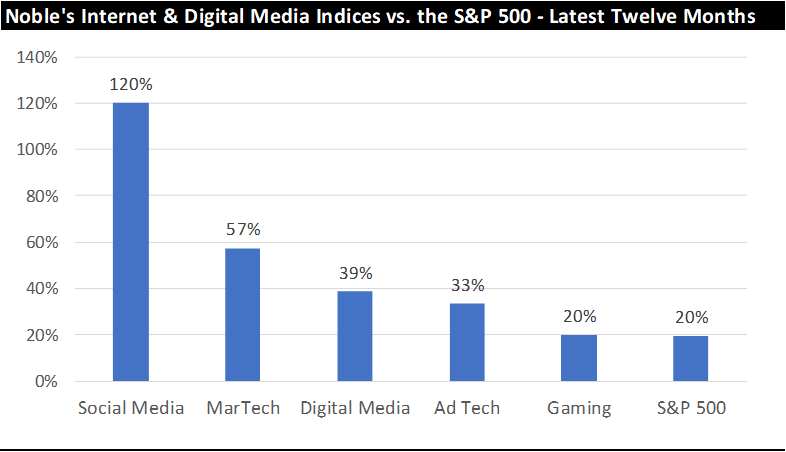
Perhaps more importantly, each of Noble’s Internet and Digital Media Indices have outperformed the S&P 500 over the latest twelve months.  The S&P 500 Index has increased by 20% over the last year (through 9/30/2023), which trailed the performance of the each of Noble’s Internet and Digital Media Indices, as shown below:

Alphabet Powers Digital Media Index Higher Despite Broader-Based Sector Weakness

The best performing index during the quarter was the Noble’s Digital Media Index, but the sector’s “strong” performance is deceiving.  Shares of Alphabet (a.k.a. Google:  GOOGL) increased by 9% during the quarter, and the company size relative to its peers helps explain the vast majority of the sector’s performance.  Google’s market cap is 8x larger than its next largest “peer” in Netflix, and it is 160 times that of the average market cap of its Digital Media peers.  Google beat expectations across all metrics (revenue, EBITDA, free cash flow) and guided to improved profitability as it streamlines workflows.  The company is also increasingly perceived as a beneficiary of AI.  While Alphabet shares performed well, they mask the fact that shares of only 2 of the sector’s 12 stocks were up during the third quarter.  The other Digital Media stock that performed well in the quarter was FUBO (FUBO), whose shares increased by 29% in 3Q 2023.  Of the 10 other digital content providers in the sector, 7 of them posted double-digit stock price declines in the third quarter.    

Large Cap Meta Powers the Social Media Index Higher

Shares in Meta Platforms (formerly Facebook) rose for the third straight quarter.  Shares increased by 5% and were up 150% through the first nine months of the year.  Meta shares increased by 8% at the start of the third quarter due to excitement around the launch of Threads, Meta’s answer to Twitter.  Over 100 million people signed up for Threads within the first five days of its rollout and positions the company well for continued revenue growth once it begins to monetize this new opportunity.    

As with the Digital Media Index, the in the Social Media Index masked underlying weakness across several smaller cap stocks.  Of the 6 stocks in the Social Media Index, only Meta shares increased during the quarter.  Several social media companies performed poorly during the quarter including Spark Networks (LOVL.Y: -59%), which filed to delist its shares, Nextdoor Holdings (KIND: -44%), which has struggled to reach profitability, and Snap (SNAP: -25%), which guided to revenue declines in 3Q 2023.    

Video Gaming, Ad Tech and MarTech Indices Continue the Trend:  “No Love” For Small Cap Stocks

As was the case in the Digital Media and Social Media sectors, the same trends held true in the other sectors:  in general, large cap stocks outperformed small cap stocks.  For example, Noble’s Video Gaming Index increased by 3% in the third quarter, driven by Activision Blizzard (ATVI: +11%), and to a lesser extent SciPlay Corp (SCP: +16%).  However, 7 other stocks in the video gaming sector posted stock price declines in the third quarter.  Larger cap names such as EA Sports (EA: -7%) and Take-Two Interactive (TTWO: -5%) posted mid-single digit stock price declines while every small cap video gaming stock posted double digit declines. 

Noble’s Ad Tech Index increased by 1% during the quarter driven by shares of AppLovin (APP: +55%), and Taboola (TBLA: +22%).  However, just 7 of the sector’s 20 stocks were up for the quarter, and 10 stocks in the sector posted double digit declines.

Finally, Noble’s MarTech Index decreased by 3% (the only index that declined during the quarter), with the sector’s largest companies, Adobe (ADBE: +4%) and Shopify (SHOP: -16%) posting mixed results.  Outside of these mega-cap stocks, the theme of underlying weakness prevailed:  only 5 of the 20 stocks in the sector posted stock price increases, while one was flat and the other 14 were down.  Eleven of the 20 stocks in the MarTech sector posted double digit stock price declines.   

3Q 2023 Internet and Digital Media M&A – A Significant Slowdown  

According to Dealogic, which tracks global M&A, deal activity in North America decreased by 37% to 8,600 deals in the third quarter, however, the value of deals in North America increased by 34% to $375 billion.  Dealogic noted that there was an increase in the number of scaled transactions (those with deal values in the $1 billion to $2 billion range), which increased to the highest level in 7 quarters.  We did not see this phenomenon in Noble’s Internet & Digital Media sectors. 

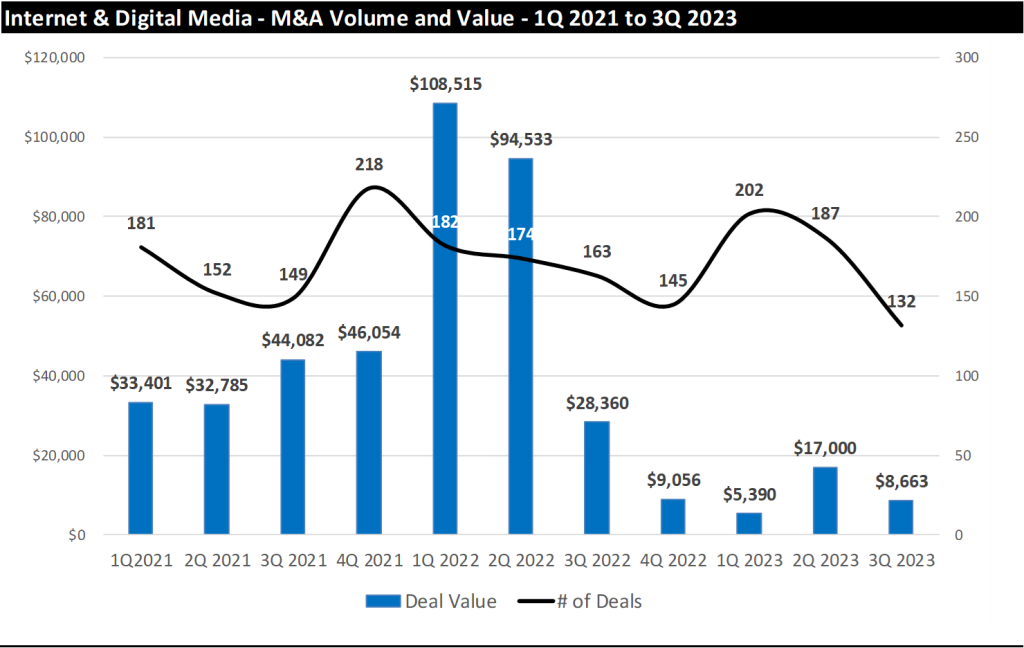
Based on our analysis, deal making in the Internet & Digital Media sectors in the third quarter of 2023 slowed rather dramatically.  The total number of Internet & Digital Media deals we tracked in the quarter decreased by 29% sequentially to 132 deals in 3Q 2023 down from 169 deals in 2Q 2023.  On a year-over-year basis, the total number of deals decreased by 22% to 132 deals in 3Q 2023 from 187 deals in the third 3Q 2022. 

The decline in the number of deals was exceeded only by the decline in the dollar value of M&A deals.  Announced M&A deal value fell sequentially by 50% to $8.7 billion in 3Q 2023 compared to $17.2 billion in announced deals in 2Q 2023.  While total deal value of announced deals decreased significantly on a quarter-over-quarter basis, the decrease was even more pronounced on a year-over-year basis, as deal values decreased by 71% to $8.7 billion in deal value from $29.4 billion in 3Q 2022, as shown in the chart on the next page.

From a deal activity perspective, the most active sectors we tracked were Digital Content (39 deals), MarTech (36 deals) and Agency & Analytics (27 deals).  From a dollar value perspective, Information Services led with $7.5 billion, followed by Digital Content with $633 million and MarTech with $255 million, as shown below (left).  

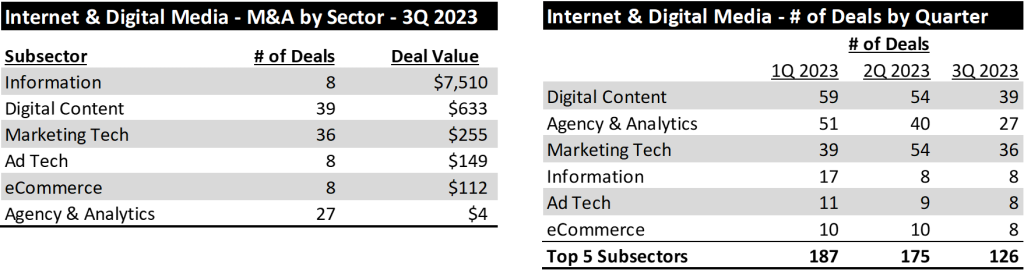
As shown above (right), the number of transactions has fallen in each of the last two quarters.  Across the top 5 subsectors of Internet and Digital Media, the number of transactions has fallen from 187 transactions in the first quarter to 126 transactions in the third quarter. 

We attribute this decline to a variety of factors.  First, an increase in interest rates has resulted in far fewer transactions in excess of $10 billion.  With rates 300 basis points higher than at the start of the year, an incremental $10 billion in debt implies a $30 million per year increase in interest expense.  These higher rates result in lower returns for acquirers.  Second, we believe traditional lenders have become more cautious in providing the necessary capital to fund acquisitions.  Some have pointed to commercial banks and their large exposure to commercial real estate as a reason for this more cautious view.  Finally, for advertising-based businesses, there are some indications that brands are waiting longer before committing to or booking ad campaigns, which has reduced visibility and made financial forecasting more difficult. 

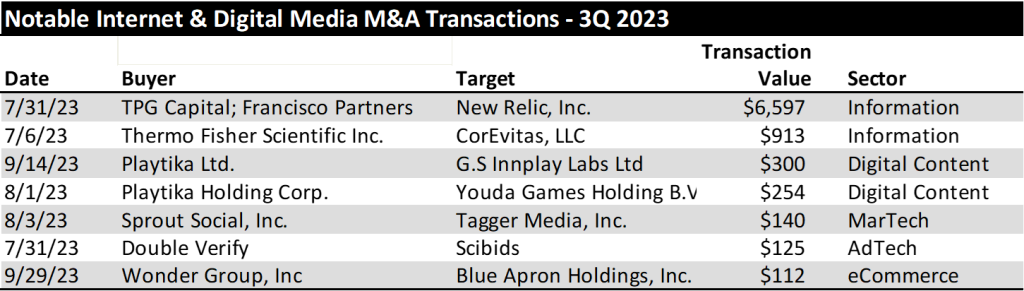
Information and Video Gaming Deals Drive the Largest Transactions in 3Q 2023

There were far fewer $100M+ transactions 3Q 2023.  In the second quarter of 2023 there were 16 transactions in the Internet & Digital Media sector with transaction values greater than $100 million.  In the third quarter, that amount slowed to less than half:  just 7 transactions exceeded $100 million in purchase price.  The Information Services sector accounted for the two largest transactions in the quarter, followed by Digital Content deals, in particular gaming deals.  The list of M&A transactions that exceeded $100 million are shown in the chart below.

We believe the M&A market has slowed as corporations get accustomed to the prospect of higher rates for longer.  One key driver of future M&A could come from distressed M&A dealmaking.  Finally, another area of increased activity could come from U.S. corporations acquiring European companies where relatively weaker European currencies are making the valuations of European companies look more attractive.   

TRADITIONAL MEDIA COMMENTARY

The following is an excerpt from a recent note by Noble’s Media Equity Research Analyst Michael Kupinski

Overview – The Case for Small Caps

Small cap investors have gone through a rough period.  For the past several years, investors have anticipated an economic downturn.  With these concerns, investors turned toward “safe haven,” large cap stocks, which typically have the ability to weather the economic headwinds and have enough trading volume should investors need to exit the position.  Since 2018, small cap stocks have underperformed the general stock market, with annualized returns of just 3.7% as measured by the S&P 600 Small Cap Index versus the general market of 10.2% as measured by the S&P 500 Index.  Another small cap index, the Russell 2000, increased a more modest 2.9% annually over the comparable period.  The S&P 500 is larger cap, with the minimum market cap of $14.6 billion.  The S&P 600 is smaller cap, a range of $850 million to $3.7 billion, with the Russell 2000 median market cap $950 million.  Some of the even smaller cap stocks, those between $100 million to $850 million, have significantly underperformed the S&P 600.  This is the first time that small caps underperformed a bullish period for all stocks since the 1940s.  Notably, there is a sizable valuation disparity between the two classes, large and small cap, one of the largest in over 20 years.

Some of the small cap stocks we follow trade at a modest 2x Enterprise Value to EBITDA, compared with large cap valuations as high as 13x to 15x.  By another measure, small cap stocks may be the only class trading below historic 25 year average to the median Enterprise Value to EBIT.  Why the large valuation disparity?  We believe that there is higher risk in the small cap stocks, especially given that some companies may not be cash flow positive, have capital needs, or have limited share float.  But investors seem to have thrown the baby out with the bathwater.  While those small cap stocks are on the more speculative end of the scale, many small cap stocks are growing revenues and cash flow, have capable balance sheets, and/or are cash flow positive.  For attractive emerging growth companies, the trading activity will resolve itself over time.  Some market strategists suggest that small cap stocks trade at the most undervalued in the market, as much as a 30% to 40% discount to fair value. 

STOCK MARKET PERFORMANCE: TRADITIONAL MEDIA

Are we on the cusp of a small cap cycle? Some fund managers think so. Such a cycle could last 10 years or longer. In this report, we highlight a few of our small cap favorites in the Media sector, those include companies that have attractive growth characteristics, some with or without an improving economy, capable balance sheets, and limited capital needs. Our current favorites based on growth opportunity and stock valuation include: Direct Digital (DRCT), Entravision (EVC), E.W. Scripps (SSP), Gray Television (GTN), and Townsquare Media (TSQ). 

Traditional Media Stock Price Performance

Virtually all traditional media stocks underperformed the general market in the past quarter and trailing 12 months, except for the Publishing group, as shown in the chart at the bottom of the previous page.  In the latest quarter, Publishing stocks outperformed the general market, up 3% versus down 4% for the general market as measured by the S&P 500 Index.  The average Publishing stock is up 7% over the past 12 months, with some of the larger cap publishing stocks up significantly more, over 20%.  More details on the Publishing performance is in the Publishing section of this report. In the last quarter, the Radio stocks were the worst performing group, down on average 10%. In addition, the Radio stocks were the worst performing group in the third quarter as well, down an average of 13% for the quarter.  

Broadcast Television

Have TV Stocks Been Discounted Too Much? 

We believe that the economic headwinds of rising interest rates and inflation have begun to hit local advertising.  Local advertising had been relatively stable, favorably influenced by a resurgence of auto advertising.  Notably, local advertising fared much better than national advertising, which was down in the absence of political advertising.  As we look toward the third quarter, local advertising appears to be weakening, but notably, national advertising appears to be doing much better, driven by an early influx of political advertising.  While it was assumed that political would increase in the fourth quarter due to the run-off of the Republican presidential candidates, especially in early primary States, we believe that President Biden has recently stepped-up advertising, particularly to the Hispanic community. We have noticed Biden advertising even in Florida! So, what does this mean for media fundamentals?

It is difficult to predict where political dollars will be spent and not all political dollars will be spent evenly, geographically or by stations in a particular market.  Furthermore, political dollars may be pulled back in a market should a particular candidate pull ahead in the polls.  Political dollars were anticipated to be spent in early primary States, specifically for the Republican candidates. But the Biden money is a surprise. Biden appears to be spending early and in areas to solidify a key voting block, Hispanics. Of course, the Biden campaign may broaden its spending to other voting blocks as well. In our view, 2024 will be a banner year for political advertising given the large amount of political fundraising by the candidates and by Political Action Committees. 

The prospect of weak local advertising, however, may cast a pall over the current expected strong revenue growth in 2024.  Many analysts, including myself, expected that economic prospects would improve in 2024, which would have provided a favorable tailwind for a significant improvement in total TV advertising in 2024. Certainly, it is likely that the Fed may lower interest rates in 2024, potentially providing a boost to local advertising prospects, but that improvement may come late in the year. Overall, in spite of the weakening Local advertising environment, given the improving National advertising trends, overall TV advertising appears to have stabilized. 

For now, we are cautiously optimistic about 2024, with the caveat that revenue growth may be somewhat tempered given the current weak local advertising trends.  Nonetheless, we believe that we are nearing the trough for this economic cycle.  Some companies, like E.W. Scripps, are in a favorable cycle for retransmission renewals. Retransmission revenues now account for a hefty 50% of Scripps’ total broadcast revenue.  In Scripps’ case, 75% of its subscribers are under renewal, which it recently announced was completed.  As such, the company reaffirmed guidance that retransmission revenue will increase 15% in 2024 and lead to a substantial increase in net retransmission revenue. We remain constructive on TV stocks, as high margin political advertising should boost balance sheets and improve stock valuations.

In the latest quarter, TV stocks underperformed the general market. The Noble TV Index decreased 13%, underperforming the 4% decline in the general market as measured by the S&P 500.  The poor performance of the latest quarter adversely affected the trailing 12 month performance, bringing the Noble TV Index to a 18% decline for the trailing 12 months. Individual stocks performed more poorly, with only the shares of Fox Corporation registering a modest gain for the trailing 12 months of 3%. The Noble TV Index is market cap weighted, and, as such, Fox with a $15 billion market cap, carried the index. Outside of the relatively strong performance of this large cap stock, all of the TV stocks were down and down big, between 18% to 59% over the past 12 months. 

We believe that investors have shied away from cyclicals, smaller cap stocks, and from companies with higher debt levels. This accounts for the poor performance of Gray Television (GTN) and E.W. Scripps (SSP), both of which have elevated debt leverage given recent acquisitions. Both were among the poorest performers for the latest quarter and for the trailing 12 months. GTN shares were down 12% in the third quarter and 38% for the last 12 months; the SSP shares down 40% and 58%, respectively.

We believe that the sell-off has been overdone, especially as the industry is expected to cycle toward an improved fundamental environment in 2024. As shown in the comp sheet on page 20, Broadcast TV stocks trade at a modest 5.3x Enterprise Value to our 2024 adj. EBITDA estimates, well below historic 20-year average trading multiples of 8x to 12x. We believe that the depressed valuations largely discount the prospect of an economic downturn and do not reflect the revenue and cash flow upside as we cycle into a political year.  Given the steep valuation discount to historic levels, we believe that the stocks are 15% to 20% below levels where the stocks normally would be given a favorable political cycle. Our favorites in the TV space include: Entravision (EVC), one of the beneficiaries of the influx of political advertising to Hispanics; E.W. Scripps (SSP), a play on political, with the favorable fundamental tailwind of strong retransmission revenue growth; and, Gray Television (GTN), one of the leading political advertising plays.

Broadcast Radio

Shoring Up Balance Sheets

The Radio industry has struggled in the first half as National advertising weakened throughout the year. On average National advertising was down roughly 20% or more for many Radio broadcasters. Local held up relatively well, although down in the range of 3% to 5%. Fortunately, for many broadcasters, a push into digital, which grew in the first half, helped to stabilize total company revenues.  As we look to the third and fourth quarters, we believe that Local advertising is weakening, expected to be down in the range of 5% to 7%, or more in some of the larger markets.  For some, National advertising is improving, driven by political advertising. However,  political is not evenly spread, so  we anticipate that there will be a cautious outlook for many in the industry for the second half of the year. 

For some in the industry, the challenged revenue environment has put a strain on managing cash flows to maintain hefty debt loads.  We believe that debt leverage is among the top concerns for investors.  Many of the poorest performing stocks in the quarter and for the trailing 12 months carry some of the highest debt leverage in the industry. The Noble Radio Index decreased a significant 14% in the latest quarter compared with a 4% decline for the general market. A look at the individual stock performance tells a more disappointing story.  Shares of Salem Media declined 38% in the latest quarter, bringing 12-month performance to a 44% decline.  Shares of iHeart Media declined 49% for the year. 

Notably, Salem Media assuaged much of its liquidity concerns with recent asset sales.  Such sales will bring in roughly $30 million, allowing it to fully pay off its $22 million revolver and have some flexibility with remaining cash on its balance sheet.  We do not believe that investors have fully credited the significance of the recent asset sales. 

One bright spot in the group was the shares of Townsquare Media (TSQ). While TSQ shares gave back a significant 27% in the third quarter, the shares are still up 20% over the past 12 months, among one of the best performing in the industry. We believe that the company’s initiation of a substantial dividend resonated with investors. 

While the industry faces fundamental headwinds given the current economic challenges, we believe that most companies have made a shift toward faster growth, digital business models.  In addition, we believe that Radio will see a lift from political advertising in 2024, although not to the extent that the TV industry will see.  Nonetheless, we look for an improving advertising scenario in 2024, and as a result,  we are constructive on the industry.  One of our current favorites leads the industry in its Digital transition, Townsquare Media. As shown in the comp sheet on page 21, TSQ shares are among the cheapest in the industry, trading at 5.1x EV to our 2024 adj. EBITDA estimate, well below the average of 7.1x for the industry. 

Publishing

Further Cost Cutting Will Cut Deep 

Publishers are not likely to be spared from the weakening local advertising business, but publishers have a playbook on areas to cut expenses to manage cash flows.  We believe that its Digital businesses should help offset some of the anticipated revenue declines on its print legacy business.  We believe that the next round will cut deep into its legacy business, through the elimination of print days.  Such a move likely will indicate further pressure on print revenues but would not proportionately decrease cash flow. Some print days have very little advertising and/or advertisers may shift some spending to other print days.

While many publishers would like to have a long runway for its cash flowing print business, such possible moves would accelerate the digital transition.  Notably, with just some stabilization of revenues on the print side, many publishers have the potential to show total company revenue growth given benefit from digital revenue. With the prospect of strategies that may cut print days, we believe that total revenue growth may be pushed out to 2025. 

Many of the Publishing stocks were written off long ago, but surprisingly, the Publishing stocks have been among the best stock performers in the latest quarter and for the trailing 12 months. The Noble Publishing Index increased a solid 36% in the trailing 12 months, outperforming the general market (as measured by the S&P 500) of 19% in the comparable time frame.

In the third quarter, Publishing stocks increased 4%, outperforming the S&P 500, which declined 4%.  All of the publishers increased, with the exception of Lee Enterprises (LEE).  Lee shares increased substantially a year earlier on takeover rumors.  Since then, the shares have come back down to earth, while the rest of the industry moved higher.  The stronger performers in the industry, however, were the larger cap companies, such as News Corp (NWSA) and The New York Times (NYT). In the latest quarter, the shares of The New York Times increased roughly 5% and the shares are up 27% for the trailing 12 months. The shares of Gannett increased a solid 9% in the latest quarter, as well. 

As the Newspaper comp sheet on page 22 illustrates, there is a disparity among some of the larger, more diversified companies, like The New York Times and News Corporation.  NYT shares trade at a hefty 15.7x EV to 2024 adj. EBITDA estimates, well above much of the pack currently trading in the 5x multiple range. We believe that this valuation gap should narrow, especially as many of the companies, like Lee and Gannett, have a burgeoning Digital business.  While the industry faces secular challenges of its print business and there are economic headwinds in the very near term, we believe that companies like Lee Enterprises have the ability to manage cash flows and grow its digital businesses. Given the compelling stock valuation disparity, the shares of Lee Enterprises lead our list of favorites in the sector. 

DOWNLOAD THE FULL REPORT (PDF)

View the PDF version for segment analysis, M&A activity, and more…

Noble Capital Markets Media Newsletter Q3 2023

This newsletter was prepared and provided by Noble Capital Markets, Inc. For any questions and/or requests regarding this news letter, please contact Chris Ensley

DISCLAIMER

All statements or opinions contained herein that include the words “ we”,“ or “ are solely the responsibility of NOBLE Capital Markets, Inc and do not necessarily reflect statements or opinions expressed by any person or party affiliated with companies mentioned in this report Any opinions expressed herein are subject to change without notice All information provided herein is based on public and non public information believed to be accurate and reliable, but is not necessarily complete and cannot be guaranteed No judgment is hereby expressed or should be implied as to the suitability of any security described herein for any specific investor or any specific investment portfolio The decision to undertake any investment regarding the security mentioned herein should be made by each reader of this publication based on their own appraisal of the implications and risks of such decision This publication is intended for information purposes only and shall not constitute an offer to buy/ sell or the solicitation of an offer to buy/sell any security mentioned in this report, nor shall there be any sale of the security herein in any state or domicile in which said offer, solicitation or sale would be unlawful prior to registration or qualification under the securities laws of any such state or domicile This publication and all information, comments, statements or opinions contained or expressed herein are applicable only as of the date of this publication and subject to change without prior notice Past performance is not indicative of future results.

Please refer to the above PDF for a complete list of disclaimers pertaining to this newsletter.

Pfizer’s Earnings Forecast Drops Due to COVID Products Decline

Pharmaceutical giant Pfizer stunned investors on Friday by making drastic reductions to its 2023 earnings and revenue guidance, driven entirely by rapidly declining demand for its COVID-19 vaccine and treatment.

The company now expects full-year sales of $58-61 billion, far below its previous projection of $67-70 billion. Adjusted earnings per share were cut even more drastically, from an expected $3.25-3.45 down to just $1.45-1.65.

The huge forecast reduction was prompted by a projected $7 billion drop in sales of Pfizer’s COVID treatment Paxlovid and a $2 billion decline for its Comirnaty vaccine. This comes amidst clear signs of “COVID fatigue” as vaccination rates slow and cases become milder.

Pfizer’s update led to a sell-off of its stock on Friday. Rival vaccine maker Moderna’s shares also dropped on the news, reflecting similar downbeat trends for COVID products industrywide.

However, Pfizer regained some losses after executives held a call on Monday to outline plans for weathering the abrupt COVID revenue downturn. This includes a new cost-cutting program aiming to deliver $1 billion in savings this year and $2.5 billion by 2024.

The planned cuts will touch all business segments and regions, though details remain scarce. Pfizer says one-time costs to implement the reductions will be approximately $3 billion, including severance charges and other expenses.

This belt-tightening comes after Pfizer hinted in August it was prepared to trim expenses if COVID product sales continued to deteriorate. “We are in the middle of the COVID fatigue. Nobody wants to speak about COVID,” acknowledged CEO Albert Bourla.

Indeed, uptake for Pfizer’s updated Omicron booster has been lackluster since launching last month. Logistical hurdles and lack of awareness around eligibility have hampered rollout. Waning concern over infections has also lowered demand.

Paxlovid prescriptions have similarly collapsed as immunity from vaccines and prior disease leaves most cases mild. Bourla said this means the remaining demand is coming from the minority focused on prevention and protection.

Looking beyond COVID products, Pfizer still expects to complete its pending $12 billion acquisition of cancer detection leader Seagen on schedule. Executives said the belt-tightening and forecast revisions will not impact those plans.

Pfizer is not alone in adapting to new COVID realities. Moderna has delayed advancing new boosters and vaccines meant to target emerging variants. Merck has paused production of its Molnupiravir antiviral.

But Pfizer’s aggressive pandemic investments leave it most exposed to lasting changes in demand. The company marshaled its resources early on to supply over 3.5 billion vaccine doses worldwide, along with millions of Paxlovid courses.

Now, the record revenues these products delivered are evaporating almost overnight. And as the market leader, Pfizer’s woes signal a new chapter for the entire vaccine and antiviral space.

Of course, the pandemic is not over, and COVID will remain a threat demanding vaccines and treatments. But with most people vaccinated, reinfected, or both, demand and profits are inevitable casualties absent a dangerous new variant.

For pharmaceutical firms like Pfizer and Moderna, the cash windfall from COVID spending is clearly drawing to a close. With customers, cash flows and share prices dropping, a reckoning has arrived. Massive cost cuts offer one path forward, with layoffs and restructuring the vaccines’ unintended side effect.

Trick or Treat: Is Recent Uptick in Small Cap Biotech M&A Activity the Catalyst for an Industry Turnaround?  

With the recent rise in mergers and acquisitions in the biotech sector, some analysts believe that now is an opportune time for investors to start positioning themselves in small and microcap biotech stocks. Though these smaller companies have been out of favor with investors in the post-pandemic environment, the current conditions suggest their fortunes may soon change.

The biotech sector saw a surge of interest during the pandemic, as companies raced to develop vaccines, treatments and diagnostics for COVID-19. Many smaller biotechs saw their values skyrocket on the hope that they would come up with a breakthrough. However, once the initial rush of COVID-related products came to market, investors began rotating out of pandemic darlings and into recovery plays. This led to a dramatic decline in the valuations of micro and small cap biotechs.

Despite this negative sentiment, mergers and acquisitions in biotech have been increasing over the past year. Pharma giants have been scooping up smaller firms to replenish their drug pipelines. While the big deals have gotten all the headlines, analysts say more deal-making is starting to occur further down the market cap scale. This suggests that the fundamentals of select smaller biotechs remain strong, though valuations do not yet reflect it.

Take Eledon Pharmaceuticals (ELDN) for example. This clinical stage biotech has a market cap of only $35 million, which is about half its cash on their 6/30/23 balance sheet . Though its lead drug candidate is in Phase 2 trials for several indications, the company’s stock price has languished. However, with ample cash to support ongoing trials and an approved IND for another preclinical asset, Eledon seems significantly undervalued based on peers.

In fact, many small biotechs appear mispriced today based on the potential of their underlying technology and pipelines. These companies are developing innovative new platforms and drug candidates across therapeutic areas like oncology, rare diseases, neurology, and ophthalmology. While risks are high during the R&D process, achieving clinical milestones and a path to successful commercialization could drive exponential growth.

Consider the market opportunity for breakthrough platforms like CRISPR gene editing or cell therapy. Many smaller firms are advancing novel applications of these cutting-edge technologies. If proven successful in clinical studies, even niche indications could generate billions in peak annual sales.

Additionally, smaller firms tend to be more targeted in their R&D approach. Rather than spreading efforts across numerous indications, microcaps often concentrate on 1-2 assets with large treatment populations. This focused strategy allows them to achieve key milestones more economically. Partnerships with larger biopharma companies can also help offset expenses in later stage development.

The current biotech environment shares some similarities with pandemic euphoria. Today’s misery and fear echoes the extreme euphoria felt by investors three years ago. Just as sentiment eventually turned negative on pandemic darlings, the same could occur for today’s recovery favorites. Already, tech giants like Meta, Nvidia and Tesla have fallen substantially from their highs, suggesting a potential peak.

While rotating out of pandemic favorites made sense as reopening plays gained momentum, the economic backdrop is cloudier now. High inflation, rising rates, geopolitical tensions and recession fears have driven significant equity declines and increased market volatility this year. This has led some investors to question whether stocks still offer favorable risk-reward profiles.

With bonds and equity markets declining in tandem, some investors have turned to cash equivalents like money market funds. While these instruments can provide principal protection, their yields could still lag inflation, given its uncertain outlook. Accounting for taxes owed on interest earned further reduces the chances of a real return. Therefore, holding too much cash during periods of high inflation could erode purchasing power over time.

Rather than accept guaranteed, but potential negative real returns in cash, investors may want to revisit beaten-down assets with asymmetric upside, like small cap biotech stocks. Some of these companies offer innovative technologies that could drive explosive growth if their development and commercialization efforts prove successful, and investor sentiment in this sector turns around.

To identify promising opportunities in the space, investors need to educate themselves on individual companies, study various ideas and leverage resources like Channelchek. While risks for small biotech stocks are always high, those able to discern winners from losers can potentially generate substantial outsized gains.

After years of hype around pandemic favorites, optimism needs to be rekindled for forgotten pockets of the market like micro and small cap biotech stocks. For investors with the appropriate time horizon and risk tolerance, now could be the ideal time to start building positions. If M&A activity continues apace, it likely will not be long before positive fundamentals translate into rising valuations.

Release – Orion Group Holdings Announces Significant Design-Build Contract Award for Grand Bahama Shipyard Dry Dock and $121 Million in Additional Awards

Research News and Market Data on ORN

Oct 13, 2023

HOUSTON, Oct. 13, 2023 (GLOBE NEWSWIRE) — Orion Group Holdings, Inc. (NYSE: ORN) (“Orion” and “Company”), a leading specialty construction and engineering company today announced a significant contract award valued at over $100 million for its Marine and Engineering business. The contract was awarded by Grand Bahama Shipyard Limited (GBSL) for the turnkey design-build of the Grand Bahama Shipyard Dry Dock Replacement Project, situated in Grand Bahama, Bahamas. In addition, the Company was recently awarded new contracts in both its Concrete and Marine segments for a combined total of $121 million.

Orion Group Holdings won the Grand Bahama Shipyard Dry Dock award through a competitive bid/negotiation process based on demonstrating its multiple core skill competencies. The scope of work includes marine works and infrastructure construction, dredging, creating new mooring facilities, and providing enhancements to shore stability. In addition, Orion will modify and extend service piers for the installation of two cutting-edge floating dry docks, which are among the largest in the western hemisphere. The project is set to commence immediately and will conclude in late 2025. Orion will be working with Bahamian subcontractors on the project.

Travis Boone, President and Chief Executive Officer of Orion Group Holdings, said, “The scope of the Bahama project demonstrates the extensive capabilities and commitment to predictable excellence that our integrated Marine & Engineering teams can deliver to large-scale and complex projects. We are excited to embark on this project and look forward to contributing to the growth and success of the Grand Bahama Shipyard.”

“When completed, the Grand Bahama dry docks will be a milestone in the maritime industry. With this enormous undertaking, Grand Bahama Shipyard will have the first floating dry docks for the Atlantic region capable of lifting the largest cruise ships in the world. The installation of two state-of-the-art floating dry docks, categorized as XL and Mega XL, promises substantial efficiency and cost savings for GBSL’s customers.”

Boone added, “As part of our strategic plan, we have been focused on strengthening our business development efforts and I am very proud of the energy and impact our expanded team is having on our business. In addition to this project award in the Bahamas for Marine, we also recently received new awards totaling $121 million, comprised of $50.8 million in the Concrete segment and $68.5 million in our Marine segment.” For additional information, see our 8-k filed on September 28, 2023.

Orion Group Holdings, Inc. is a renowned name in specialty construction, known for its dedication to quality, innovation, and timely project execution. With these new contract awards, Orion continues to strengthen its position as an industry leader capable of tackling complex projects with unmatched expertise.

About Orion Group Holdings

Orion Group Holdings, Inc., a leading specialty construction company serving the infrastructure, industrial and building sectors, provides services both on and off the water in the continental United States, Alaska, Hawaii, Canada and the Caribbean Basin through its marine segment and its concrete segment. The Company’s marine segment provides construction and dredging services relating to marine transportation facility construction, marine pipeline construction, marine environmental structures, dredging of waterways, channels and ports, environmental dredging, design, and specialty services. Its concrete segment provides turnkey concrete construction services including place and finish, site prep, layout, forming, and rebar placement for large commercial, structural and other associated business areas. The Company is headquartered in Houston, Texas with regional offices throughout its operating areas. https://www.oriongroupholdingsinc.com.

Forward-Looking Statements

The matters discussed in this press release may constitute or include projections or other forward-looking statements within the meaning of the “safe harbor” provisions of Section 27A of the Securities Exchange Act of 1933, as amended, and Section 21E of the Securities Exchange Act of 1934, as amended, of which provisions the Company is availing itself. Certain forward-looking statements can be identified by the use of forward-looking terminology, such as ‘believes’, ‘expects’, ‘may’, ‘will’, ‘could’, ‘should’, ‘seeks’, ‘approximately’, ‘intends’, ‘plans’, ‘estimates’, or ‘anticipates’, or the negative thereof or other comparable terminology, or by discussions of strategy, plans, objectives, intentions, estimates, forecasts, outlook, assumptions, or goals. In particular, statements regarding future operations or results, including those set forth in this press release, and any other statement, express or implied, concerning future operating results or the future generation of or ability to generate revenues, income, net income, gross profit, EBITDA, Adjusted EBITDA, Adjusted EBITDA margin, or cash flow, including to service debt, and including any estimates, forecasts or assumptions regarding future revenues or revenue growth, are forward-looking statements. Forward-looking statements also include project award announcements, estimated project start dates, anticipated revenues, and contract options which may or may not be awarded in the future. Forward-looking statements involve risks, including those associated with the Company’s fixed price contracts that impacts profits, unforeseen productivity delays that may alter the final profitability of the contract, cancellation of the contract by the customer for unforeseen reasons, delays or decreases in funding by the customer, levels and predictability of government funding or other governmental budgetary constraints, and any potential contract options which may or may not be awarded in the future, and are at the sole discretion of award by the customer. Past performance is not necessarily an indicator of future results. In light of these and other uncertainties, the inclusion of forward-looking statements in this press release should not be regarded as a representation by the Company that the Company’s plans, estimates, forecasts, goals, intentions, or objectives will be achieved or realized. Readers are cautioned not to place undue reliance on these forward-looking statements, which speak only as of the date hereof. The Company assumes no obligation to update information contained in this press release whether as a result of new developments or otherwise, except as required by law.

Please refer to the Company’s 2022 Annual Report on Form 10-K, filed on March 16, 2023, which is available on its website at www.oriongroupholdingsinc.com or at the SEC’s website at www.sec.gov, for additional and more detailed discussion of risk factors that could cause actual results to differ materially from our current expectations, estimates or forecasts.

Contact:

Financial Profiles, Inc.
Margaret Boyce 310-622-8247
mboyce@finprofiles.com

Release – Eledon Pharmaceuticals to Present Data from Ongoing Phase 1b Trial of Tegoprubart in Patients Undergoing Kidney Transplantation at the American Society of Nephrology Kidney Week 2023 Annual Meeting

Research News and Market Data on ELDN

IRVINE, Calif., Oct. 13, 2023 (GLOBE NEWSWIRE) — Eledon Pharmaceuticals, Inc. (“Eledon”) (NASDAQ: ELDN) today announced that the Company will present a poster at the American Society of Nephrology’s upcoming Kidney Week 2023 Annual Meeting taking place in Philadelphia, PA from November 2-5, 2023. The poster will highlight new data from Eledon’s ongoing open-label Phase 1b trial evaluating tegoprubart for the prevention of rejection in kidney transplantation.

Details on the poster presentations are below:

Title: Tegoprubart for the prevention of rejection in kidney transplant: update of emerging data from an ongoing trial
Presenter: Steve Perrin, Ph.D., President and Chief Scientific Officer, Eledon Pharmaceuticals
Poster Number: TH-PO835
Session Title: Transplantation: Clinical – I [PO2102-1] 
Session Date and Time: November 2, 2023 from 10:00 AM to 12:00 PM EDT

Following the presentation, a copy of the poster can be found on the Investor section of the Company’s website at https://ir.eledon.com/events-and-presentations/presentations.

About Eledon Pharmaceuticals and Tegoprubart (formerly AT-1501)

Eledon Pharmaceuticals is a clinical stage biotechnology company with immunology expertise that is developing therapies to protect and prevent rejection of transplanted organs, as well as to treat amyotrophic lateral sclerosis (ALS). The Company’s lead compound in development is tegoprubart, an anti-CD40L antibody with high affinity for CD40 Ligand (also called “CD154”), a well-validated biological target with broad therapeutic potential. Eledon is headquartered in Irvine, California. For more information, please visit the company’s website at www.eledon.com.

Follow Eledon Pharmaceuticals on social media: LinkedInTwitter

Investor Contact:

Stephen Jasper
Gilmartin Group
(858) 525 2047
stephen@gilmartinir.com

Media Contact:

Jenna Urban
Berry & Company Public Relations
(212) 253 8881
jurban@berrypr.com

Source: Eledon Pharmaceuticals

Release – Alliance Resource Partners, L.P. Announces Third Quarter 2023 Earnings Conference Call

October 13, 2023

Download(opens in new window)

TULSA, Okla.–(BUSINESS WIRE)– Alliance Resource Partners, L.P. (NASDAQ: ARLP) will report its third quarter 2023 financial results before the market opens on Friday, October 27, 2023. Alliance management will discuss these results during a conference call beginning at 10:00 a.m. Eastern that same day.

To participate in the conference call, dial (877) 407-0784 and request to be connected to the Alliance Resource Partners, L.P. earnings conference call. International callers should dial (201) 689-8560 and request to be connected to the same call. Investors may also listen to the call via the “Investors” section of ARLP’s website at https://www.arlp.com/.

An audio replay of the conference call will be available for approximately one week. To access the audio replay, dial U.S. Toll Free (844) 512-2921; International Toll (412) 317-6671 and request to be connected to replay using access code 13741573.

About Alliance Resource Partners, L.P.

ARLP is a diversified energy company that is currently the largest coal producer in the eastern United States, supplying reliable, affordable energy domestically and internationally to major utilities, metallurgical and industrial users. ARLP also generates operating and royalty income from mineral interests it owns in strategic coal and oil & gas producing regions in the United States. In addition, ARLP is evolving and positioning itself as a reliable energy partner for the future by pursuing opportunities that support the advancement of energy and related infrastructure.

News, unit prices and additional information about ARLP, including filings with the Securities and Exchange Commission (“SEC”), are available at https://www.arlp.com/. For more information, contact the investor relations department of ARLP at (918) 295-7673 or via e-mail at investorrelations@arlp.com.

Investor Relations Contact
Cary P. Marshall
Senior Vice President and Chief Financial Officer
(918) 295-7673
investorrelations@arlp.com

Source: Alliance Resource Partners, L.P.

Onconova Therapeutics (ONTX) – Rigosertib Data Presented In Ultra-Rare Disease


Friday, October 13, 2023

Onconova Therapeutics is a clinical-stage biopharmaceutical company focused on discovering and developing novel products for patients with cancer. The Company has proprietary targeted anti-cancer agents designed to disrupt specific cellular pathways that are important for cancer cell proliferation. Onconova’s novel, proprietary multi-kinase inhibitor narazaciclib (formerly ON 123300) is being evaluated in a combination trial with estrogen blockade in advanced endometrial cancer. Based on preclinical and clinical studies of CDK 4/6 inhibitors, Onconova is also evaluating opportunities for combination studies with narazaciclib in additional indications. Onconova’s product candidate rigosertib is being studied in multiple investigator-sponsored studies. These studies include a dose-escalation and expansion Phase 1/2a study of oral rigosertib in combination with nivolumab in patients with KRAS+ non-small cell lung cancer, a Phase 2 program evaluating rigosertib monotherapy in advanced squamous cell carcinoma complicating recessive dystrophic epidermolysis bullosa (RDEB-associated SCC), and a Phase 2 trial evaluating rigosertib in combination with pembrolizumab in patients with metastatic melanoma.

Robert LeBoyer, Senior Vice President, Equity Research Analyst, Biotechnology, Noble Capital Markets, Inc.

Refer to the full report for the price target, fundamental analysis, and rating.

Rigosertib Data In RDEB-SCC Presented. Onconova presented data from an Investigator-initiated trial (IIT) testing rigosertib in RDEB-associated SCC (recessive dystrophic epidermolysis bullosa associated with squamous cell carcinoma), an ultra-rare but fatal disease with no effective treatment. The data was presented at the European Academy of Dermatology and Venereology (EADV) in Berlin. Results showed complete remission for 2 of the 4 patients tested for over 12 months with one patient still in treatment.

RDEB-SCC Is A Rare But Fatal Disease. RDEB-SCC is an ultra-orphan disease in which mutations in the genes for collagen VII result in structural abnormalities in the skin. This results in fragile skin with failure of the epidermal layer to anchor properly, causing severe blisters and a cycle of chronic injury. The development of squamous cell carcinoma (SCC) often causes death by age 45. Tumors in RDEB-SCC were found to be sensitive to inhibition of an enzyme involved in cell cycle regulation known as PKL-1 (polo-like kinase-1). Rigosertib is an inhibitor of  PLK-1 and was selected for the ITT trial.


Get the Full Report

Equity Research is available at no cost to Registered users of Channelchek. Not a Member? Click ‘Join’ to join the Channelchek Community. There is no cost to register, and we never collect credit card information.

This Company Sponsored Research is provided by Noble Capital Markets, Inc., a FINRA and S.E.C. registered broker-dealer (B/D).

*Analyst certification and important disclosures included in the full report. NOTE: investment decisions should not be based upon the content of this research summary. Proper due diligence is required before making any investment decision. 

Labrador Gold Corp. (NKOSF) – Drilling Yields Near-Surface Gold at DropKick and Extends the Zone to 360 Meters


Friday, October 13, 2023

Mark Reichman, Managing Director, Equity Research Analyst, Natural Resources, Noble Capital Markets, Inc.

Refer to the full report for the price target, fundamental analysis, and rating.

Recent drill results. Labrador Gold released results from recent drilling at its 100%-owned Kingsway gold project targeting the Appleton Fault Zone. The drilling is part of the company’s 100,000-meter diamond drilling program of which nearly 85,000 meters of drilling has been completed. Assays are pending for samples from approximately 6,100 meters of core.

DropKick target yields near surface gold. During the first phase of drilling at the DropKick target, Labrador discovered the presence of near surface gold over significant widths and increased the strike length of known mineralization to over 360 meters. Further drilling is planned to demonstrate the significant potential of this discovery.


Get the Full Report

Equity Research is available at no cost to Registered users of Channelchek. Not a Member? Click ‘Join’ to join the Channelchek Community. There is no cost to register, and we never collect credit card information.

This Company Sponsored Research is provided by Noble Capital Markets, Inc., a FINRA and S.E.C. registered broker-dealer (B/D).

*Analyst certification and important disclosures included in the full report. NOTE: investment decisions should not be based upon the content of this research summary. Proper due diligence is required before making any investment decision. 

Biden Administration Unveils $7 Billion Investment in Regional Hydrogen Hubs

The Biden administration is making a major push to develop a domestic hydrogen economy by funding 7 regional hydrogen hubs across the United States. The hubs will share up to $7 billion in federal funding aimed at spurring hydrogen production and use.

President Joe Biden and Energy Secretary Jennifer Granholm announced Friday the selection of hubs in Appalachia, California, the Gulf Coast, the Heartland, Mid-Atlantic, Midwest, and Pacific Northwest regions. The funds come from last year’s Bipartisan Infrastructure Law.

Accelerating the Hydrogen Economy

The goal is to accelerate the growth of a clean hydrogen industry in the U.S. Hydrogen is a versatile fuel seen as a critical tool for decarbonizing major sectors like heavy industry, transportation, and power generation.

When produced using low-carbon methods, hydrogen can provide emissions-free energy for hard-to-abate sectors. Expanding hydrogen is a key plank of the Biden administration’s strategy to cut greenhouse gas emissions and combat climate change.

The 16-state regional hubs model fosters clusters of hydrogen supply and demand, minimizing transportation needs. The administration expects the $7 billion federal injection to mobilize over $43 billion in private capital.

Leveraging Regional Strengths

Each hydrogen hub leverages unique geographic strengths ideal for clean hydrogen production. For example:

  • The Appalachia Hub will use the region’s abundant natural gas supply, applying carbon capture to lower emissions.
  • California and the Pacific Northwest have access to seaports critical for shipping hydrogen.
  • The Heartland can utilize wind resources to produce hydrogen via electrolysis.
  • The Midwest Hub will tap into nuclear power to make hydrogen.

In addition to production, the regional hubs focus on cultivating local hydrogen markets. Some will provide hydrogen for industrial uses while others may focus on fertilizer or fuel cell vehicle growth.

Building on Bipartisan Policy

The hydrogen hub funding originated from the bipartisan infrastructure package passed in 2021. The law included $8 billion for at least four regional hubs.

The Biden administration expanded the program to seven hubs to extend geographic impact. The policy builds on bipartisan support for advancing hydrogen in the U.S.

Last year’s Infrastructure Investment and Jobs Act also created a hydrogen production tax credit. The recently passed Inflation Reduction Act further boosted hydrogen incentives with an additional $3 per kg production credit.

The Energy Department will provide guidance on utilizing the tax credits later this year. The credits will aid long-term viability of the regional hubs.

Spurring Private Investment

The federal money is intended to galvanize substantial private capital investment in building out hydrogen infrastructure. Siting hydrogen hubs near key anchor facilities can spur economic growth.

For example, California’s hub grants will likely stimulate billions in private funding around port facilities. Financial incentives like the hydrogen tax credits create ideal conditions for private sector buy-in.

Over time, decreasing costs through scale and technology improvements could make hydrogen competitive with conventional fuels. The regional hubs represent a starting point designed to nurture both supply and demand.

Next Steps for Growth

The hydrogen hubs mark an important early phase of U.S. efforts to scale up the hydrogen economy. Biden administration officials noted work remains to develop connective infrastructure and further applications.

Ongoing policy support via research funding, incentives, and enabling regulation will help drive growth. Continued bipartisan cooperation around hydrogen could lead to additional catalytic investments.

With the right policy environment, hydrogen could become a major pillar of America’s clean energy economy. The regional hubs represent a down payment on the infrastructure needed to realize hydrogen’s vast decarbonization potential across the economy.

OptimizeRx to Acquire Medicx in $95 Million Deal, Expanding Omnichannel Platform

OptimizeRx Corp. announced Thursday it will acquire Scottsdale-based Medicx Health for $95 million, expanding its platform reach to healthcare consumers.

The deal combines OptimizeRx’s solutions focused on healthcare providers (HCPs) with Medicx’s consumer-centric technologies. Together, the companies can engage over 2 million HCPs and a majority of U.S. healthcare consumers.

“Our acquisition of Medicx is expected to be a major business accelerator for us,” said OptimizeRx CEO Will Febbo.

For OptimizeRx, the acquisition enhances its digital health platform that helps life sciences companies educate and engage HCPs and patients. Medicx brings new omnichannel marketing and analytics capabilities aimed at consumers.

Reaching Healthcare’s Key Stakeholders

OptimizeRx’s lead solution is a digital point-of-care network enabling pharma marketing and engagement integrated within EHR and e-prescribing workflows. This allows drug makers to reach HCPs through digital touchpoints at the point of care.

Medicx has developed a Micro-Neighborhood® Targeting Platform using advanced identity resolution to reach healthcare consumers. Combining both solutions offers an end-to-end way for pharma companies to connect with HCPs and patients—healthcare’s two most important stakeholders.

“Coupling consumer and HCP marketing strategies is a natural next step for many of our customers,” said OptimizeRx Chief Commercial Officer Steve Silvestro.

Profitable Addition to Fuel Growth

The acquisition is expected to significantly benefit OptimizeRx’s growth and profitability. Medicx is a highly profitable company that will immediately add to revenue, EBITDA, and earnings per share.

On a combined basis, the deal will bring OptimizeRx’s revenue run-rate close to $100 million. Medicx also opens substantial new opportunities for customer penetration and cross-selling.

“I’m extremely proud of the leading patient-focused omnichannel platform the Medicx team has built,” said Medicx CEO Michael Weintraub. “Integrating with a leading HCP-focused enterprise provides numerous efficiencies.”

Weintraub added the combined platforms can now inform and educate patients and HCPs in a cohesive way no single company has done before.

Funded for Growth

OptimizeRx will pay $95 million in total consideration to acquire Medicx. The deal will be funded through OptimizeRx’s cash on hand, short-term investments, and a new $40 million credit facility from Blue Torch Capital.

Certain members of Medicx’s management will invest approximately $10.5 million of their proceeds into OptimizeRx common stock.

The acquisition is expected to close in Q4 2023. Medicx will operate as a subsidiary under its current management team.

Strong Quarterly Performance

In tandem with the acquisition announcement, OptimizeRx preannounced strong third quarter 2023 results.

The company expects Q3 revenue between $15.2-$15.5 million, ahead of consensus estimates. Non-GAAP net income is projected at $0.6-$1 million.

OptimizeRx saw accelerated organic growth in messaging driven by its recently enhanced Dynamic Audience Activation Platform.

The deal marks OptimizeRx’s largest acquisition to date as it leverages M&A to expand its platform. Medicx’s addition is expected to be immediately accretive while funding future growth.

Release – 1-800-FLOWERS.COM, Inc. to Release its Fiscal 2024 First Quarter Results on Thursday, November 2, 2023

Research News and Market Data on FLWS

Oct 12, 2023

JERICHO, N.Y.–(BUSINESS WIRE)– 1-800-FLOWERS.COM, Inc. (NASDAQ: FLWS) (the “Company”),a leading provider of gifts designed to help inspire customers to give more, connect more, and build more and better relationships, today announced that the Company will release financial results for its fiscal 2024 first quarter on Thursday, November 2, 2023. The press release will be issued prior to market opening and will be followed by a conference call with members of senior management at 8:00 a.m. (ET).

The conference call will be available via live webcast from the Investors section of the Company’s website at 1800flowersinc.com. A recording of the call will be posted on the website within two hours of the call’s completion. A telephonic replay of the call can be accessed beginning at 2:00 p.m. (ET) on November 2, 2023, through November 9, 2023, at: (US) 1-877-344-7529; (Canada) 855-669-9658; (International) 1-412-317-0088; enter conference ID: #3621353.

Special Note Regarding Forward-Looking Statements:

Some of the statements contained in the Company’s scheduled Thursday, November 2, 2023, press release and conference call regarding its results for its fiscal 2024 first quarter, other than statements of historical fact, may be forward-looking within the meaning of the Private Securities Litigation Reform Act of 1995. These statements involve risks and uncertainties that could cause actual results to differ materially from those expressed or implied in the applicable statements. For a more detailed description of these and other risk factors, please refer to the Company’s SEC filings including its Annual Reports and Forms 10K and 10Q available at the Investor Relations section of the Company’s website at 1800flowersinc.com. The Company expressly disclaims any intent or obligation to update any of the forward-looking statements made in the scheduled conference call and any recordings thereof, or in any of its SEC filings, except as may be otherwise stated by the Company.

About 1-800-FLOWERS.COM, Inc.

1-800-FLOWERS.COM, Inc. is a leading provider of gifts designed to help inspire customers to give more, connect more, and build more and better relationships. The Company’s e-commerce business platform features an all-star family of brands, including: 1-800-Flowers.com®, 1-800-Baskets.com®, Cheryl’s Cookies®, Harry & David®, PersonalizationMall.com®, Shari’s Berries®, FruitBouquets.com®, Things Remembered®Moose Munch®, The Popcorn Factory®, Wolferman’s Bakery®, Vital Choice®, and Simply Chocolate®. Through the Celebrations Passport® loyalty program, which provides members with free standard shipping and no service charge across our portfolio of brands, 1-800-FLOWERS.COM, Inc. strives to deepen relationships with customers. The Company also operates BloomNet®, an international floral and gift industry service provider offering a broad-range of products and services designed to help members grow their businesses profitably; Napco℠, a resource for floral gifts and seasonal décor; DesignPac Gifts, LLC, a manufacturer of gift baskets and towers; and Alice’s Table®, a lifestyle business offering fully digital livestreaming and on demand floral, culinary and other experiences to guests across the country. 1-800-FLOWERS.COM, Inc. was recognized among the top 5 on the National Retail Federation’s 2021 Hot 25 Retailers list, which ranks the nation’s fastest-growing retail companies, and was named to the Fortune 1000 list in 2022. Shares in 1-800-FLOWERS.COM, Inc. are traded on the NASDAQ Global Select Market, ticker symbol: FLWS. For more information, visit 1800flowersinc.com or follow @1800FLOWERSInc on Twitter.

FLWS-COMP
FLWS-FN

Investor Contact:

Andy Milevoj

(516) 237-4617

amilevoj@1800flowers.com

Media Contact:

Cherie Gallarello

cgallarello@1800flowers.com

Source: 1-800-FLOWERS.COM, Inc.

Release – Direct Digital Holdings Selects HPE GreenLake To Deliver Edge-To-Cloud Solution In Multiyear Platform Deal

Research News and Market Data on DRCT

October 12, 2023 9:00am EDT Download as PDF

Green Tea Technology Instrumental in Forging Relationship with Hewlett Packard Enterprise and Ad-Tech Holding Group, Direct Digital Holdings

HOUSTON, Oct. 12, 2023 /PRNewswire/ — Direct Digital Holdings (Nasdaq: DRCT) (“Direct Digital Holdings” or the “Company”), a leading advertising and marketing technology platform operating through its companies Colossus Media, LLC (“Colossus SSP”), Huddled Masses LLC (“Huddled Masses”) and Orange142, LLC (“Orange142”), today announced it has selected the HPE GreenLake edge-to-cloud platform to build a highly reliable, scalable and secure production environment. Green Tea Technology, an authorized HPE partner, will provide installation and support services.

Colossus SSP will now incorporate the HPE GreenLake platform with its on-premises infrastructure and cloud services across its entire marketplace to support Direct Digital Holdings’ sell-side platform. The marketplace manages approximately 136,000 clients monthly, generating over 250 billion impressions per month across display, CTV, in-app video and other media channels.

“HPE GreenLake has enabled Direct Digital Holdings to deliver a modern cloud experience to customers with flexibility to meet their demands in real time,” said Alexia Clements, VP of worldwide go-to-market for HPE GreenLake Cloud Services, HPE. “We’re focused on delivering differentiated cloud solutions that allow our partners to serve as trusted advisors and help customers modernize their IT environments to improve their business outcomes.”

“Our relationship with HPE is strategic for our company, as we partner with HPE GreenLake for our digital infrastructure for our supply-side technology platform,” said Mark Walker, co-founder and CEO of Direct Digital Holdings. “Thanks to the flexibility provided by HPE GreenLake, we have the ability to continue our accelerated growth as we bring new technology products to our media partners. Green Tea Technology has been an excellent resource and partner in helping us leverage HPE for this strategic platform solution.”

Brad Davis, the owner and CTO of Green Tea Technology, stated that the HPE GreenLake platform is more than a year ahead of its competitors in terms of innovation and edge-to-cloud capabilities. Davis believes that the platform is an excellent solution for Direct Digital Holdings, considering their rapid growth and expansion underway.

About Direct Digital Holdings

Direct Digital Holdings (Nasdaq: DRCT), owner of operating companies Colossus SSP, Huddled Masses, and Orange 142, brings state-of-the-art sell- and buy-side advertising platforms together under one umbrella company. Direct Digital Holdings’ sell-side platform, Colossus SSP, offers advertisers of all sizes extensive reach within general market and multicultural media properties. The company’s subsidiaries Huddled Masses and Orange142 deliver significant ROI for middle market advertisers by providing data-optimized programmatic solutions at scale for businesses in sectors that range from energy to healthcare to travel to financial services. Direct Digital Holdings’ sell- and buy-side solutions manage approximately 136,000 clients monthly, generating over 250 billion impressions per month across display, CTV, in-app and other media channels.

About Green Tea Technology

Green Tea Technology is a leading IT solutions provider headquartered in Austin, Texas. As an accredited HPE Certified GreenLake integration partner , the company is at the forefront of delivering cutting-edge Hybrid cloud solutions tailored to meet the unique needs of businesses, both large and small. With a commitment to innovation and sustainability, Green Tea Technology is dedicated to architecting robust, scalable, and environmentally-friendly IT infrastructures.

Forward Looking Statements

This press release may contain forward-looking statements within the meaning of federal securities laws and which are subject to certain risks, trends and uncertainties.

As used below, “we,” “us,” and “our” refer to the Company. We use words such as “could,” “would,” “may,” “might,” “will,” “expect,” “likely,” “believe,” “continue,” “anticipate,” “estimate,” “intend,” “plan,” “project” and other similar expressions to identify forward-looking statements, but not all forward-looking statements include these words. All statements contained in this press release that do not relate to matters of historical fact should be considered forward-looking statements.

All of our forward-looking statements involve estimates and uncertainties that could cause actual results to differ materially from those expressed in or implied by the forward-looking statements. Our forward-looking statements are based on assumptions that we have made in light of our industry experience and our perceptions of historical trends, current conditions, expected future developments and other factors we believe are appropriate under the circumstances. Although we believe that these forward-looking statements are based on reasonable assumptions, many factors could affect our actual operating and financial performance and cause our performance to differ materially from the performance expressed in or implied by the forward-looking statements, including, but not limited to: our dependence on the overall demand for advertising, which could be influenced by economic downturns; any slow-down or unanticipated development in the market for programmatic advertising campaigns; the effects of health epidemics; operational and performance issues with our platform, whether real or perceived, including a failure to respond to technological changes or to upgrade our technology systems; any significant inadvertent disclosure or breach of confidential and/or personal information we hold, or of the security of our or our customers’, suppliers’ or other partners’ computer systems; any unavailability or non-performance of the non-proprietary technology, software, products and services that we use; unfavorable publicity and negative public perception about our industry, particularly concerns regarding data privacy and security relating to our industry’s technology and practices, and any perceived failure to comply with laws and industry self-regulation; restrictions on the use of third-party “cookies,” mobile device IDs or other tracking technologies, which could diminish our platform’s effectiveness; any inability to compete in our intensely competitive market; any significant fluctuations caused by our high customer concentration; our limited operating history, which could result in our past results not being indicative of future operating performance; any violation of legal and regulatory requirements or any misconduct by our employees, subcontractors, agents or business partners; any strain on our resources, diversion of our management’s attention or impact on our ability to attract and retain qualified board members as a result of being a public company; our dependence, as a holding company, on receiving distributions from Direct Digital Holdings, LLC to pay our taxes, expenses and dividends; the satisfaction of the conditions to the Offer, including the minimum tender condition; and other factors and assumptions discussed in the “Risk Factors,” “Management’s Discussion and Analysis of Financial Conditions and Results of Operations” and other sections of our filings with the Securities and Exchange Commission that we make from time to time. Should one or more of these risks or uncertainties materialize or should any of these assumptions prove to be incorrect, our actual operating and financial performance may vary in material respects from the performance projected in these forward-looking statements. Further, any forward-looking statement speaks only as of the date on which it is made, and except as required by law, we undertake no obligation to update any forward-looking statement contained in this press release to reflect events or circumstances after the date on which it is made or to reflect the occurrence of anticipated or unanticipated events or circumstances, and we claim the protection of the safe harbor for forward-looking statements contained in the Private Securities Litigation Reform Act of 1995.

Contacts:

Investors:
Brett Milotte, ICR
Brett.Milotte@icrinc.com

View original content to download multimedia:https://www.prnewswire.com/news-releases/direct-digital-holdings-selects-hpe-greenlake-to-deliver-edge-to-cloud-solution-in-multiyear-platform-deal-301954588.html

SOURCE Direct Digital Holdings

Released October 12, 2023

Release – Labrador Gold Intersects 1.81g/t Au Over 20.15 Metres at Dropkick, Extends Zone to 360 Metres

Research News and Market Data on NKOSF

OCTOBER 12, 2023

TORONTO, Oct. 12, 2023 (GLOBE NEWSWIRE) — Labrador Gold Corp. (TSX.V:LAB | OTCQX:NKOSF | FNR: 2N6) (“LabGold” or the “Company”) is pleased to announce results from recent drilling targeting the highly prospective Appleton Fault Zone. The drilling is part of the Company’s ongoing 100,000 metre diamond drilling program at its 100% owned Kingsway Project.

Final results from first stage drilling at DropKick include significant near surface gold mineralization of 20.15 metres grading 1.81g/t Au from 50 metres, including 4.14g/t Au over 4.5 metres in Hole K-23-248. Several near surface intervals were also intersected in Hole K-23-245 including 1.77g/t Au over 5.15 metres from 31.85 metres downhole. Holes K-23-245 and -248 represent a 67 metre step out to the northeast. Hole K-23-254, a 136 metre step out to the southwest, intersected 2.45g/t Au over 4.1 metres from 108.9 metres, including an interval of 16.68g/t Au over 0.3 metres that contained visible gold. These latest intersections extend the known mineralization at Dropkick to over 360 metres strike length and it remains open in both directions. Twelve of the 15 holes drilled at Dropkick intersected gold mineralization with four holes containing visible gold.

“During the first phase of drilling at DropKick we demonstrated the presence of near surface gold over significant widths while increasing the strike length of known mineralization which remains open along strike in both directions. Further drilling is required to demonstrate the true potential of this discovery,” said Roger Moss, President and CEO of LabGold. ”Planning is currently underway for drilling in The Gap, between Big Vein and Pristine, and to the south of Big Vein towards the recent Knobby discovery. Drilling of targets in these areas is expected to begin before the end of the month. We are excited to start filling in the gaps between the four discoveries made along a 7 kilometre section of the Appleton Fault Zone at Kingsway.”

Follow up drilling at Pristine included an intersection of 1.05g/t Au over 11 metres from 90 metres in Hole K-23-276 and 1.28g/t Au over 6.18 metres from 66.47 metres in Hole K-23-272. Mineralization drilled to date at Pristine mostly occurs above 86 metres vertical depth and extends over a strike length of approximately 160 metres.

Ongoing drilling at Big Vein intersected 2.76g/t Au over 8.97 metres from 233.56 metres, including 7.04g/t over 3.09 metres in Hole K-23-278.

Hole IDFrom (m)To (m)Interval (m)Au (g/t)Zone
K-23-278233.56242.538.972.76Big Vein
including236.00239.093.097.04
K-23-27690.00101.0011.001.05Pristine
including92.9597.804.851.82
K-23-27266.4772.656.181.28Pristine
including68.0070.802.802.33
K-23-260156.57160.003.431.06Pristine
K-23-25967.5068.350.851.22Pristine
K-23-254108.90113.004.102.45DropKick
including108.90110.801.904.56
including109.40109.700.3016.68
K-23-253nsvBig Vein
K-23-25253.0091.0038.000.55Big Vein
including60.0064.004.001.28
and73.0074.001.001.11
K-23-249nsvBig Vein
K-23-24850.0070.1520.151.81DropKick
including55.0070.1515.152.32
including58.0070.1512.152.72
including59.9064.404.504.14
K-23-247126.70128.001.301.32Big Vein
198.00198.950.951.20
K-23-24510.0012.652.651.16Dropkick
31.8537.005.151.77
including35.0036.351.353.17
44.8045.600.801.34
53.0054.501.501.04
89.00103.0014.000.60
including91.9594.002.051.42
192.00193.151.151.90
250.25251.150.901.32
K-23-24429.0033.004.001.10Big Vein
K-23-243nsvDropKick
K-23-242224.43225.160.731.88Big Vein
K-23-241nsvBig Vein

Table 1. Summary of assay results. All intersections are downhole length
as there is insufficient Information to calculate true width.

Almost 85,000 metres have been drilled to date out of the planned 100,000 metre program. Assays are pending for samples from approximately 6,100 metres of core.

The Company has approximately $10 million in cash and is well funded to carry out the remaining 15,000 metres of the planned drill program as well as further exploration to add to the current pipeline of drill targets on the property.

Figure 1. Plan map of Dropkick drill holes showing highlights of latest results.

Figure 2. Plan map of occurrences with selected drill intersections along the Appleton Fault Zone.

Hole IDEastingNorthingElevationAzimuthInclinationTotal Depth
K-23-27866173654353923713065420
K-23-27666192754360725627565200
K-23-27266193354360695931565278
K-23-260661750543587258090209
K-23-25966184554360015330045191
K-23-25466315954381265514045160.55
K-23-2536615545435459452045160
K-23-25266145054353125412570349
K-23-24966127254350936214565379
K-23-24866340854383815214065173
K-23-24766155354354585012550233
K-23-24566340954383805314045259
K-23-24366335354382735814065131
K-23-24466158954354304914045228
K-23-24266132154351115214555307
K-23-24166145054353125312550250

Table 2. Drill hole collar details

QA/QC

True widths of the reported intersections have yet to be calculated. Assays are uncut. Samples of HQ split core are securely stored prior to shipping to Eastern Analytical Laboratory in Springdale, Newfoundland for assay. Eastern Analytical is an ISO/IEC17025 accredited laboratory. Samples are routinely analyzed for gold by standard 30g fire assay with atomic absorption finish as well as by ICP-OES for an additional 34 elements. Samples containing visible gold are assayed by metallic screen/fire assay, as are any samples with fire assay results greater than 1g/t Au. The company submits blanks and certified reference standards at a rate of approximately 5% of the total samples in each batch. Approximately 5% of sample pulps are submitted to Bureau Veritas, an ISO 17025 accredited Laboratory in Vancouver, BC for check assays.

Qualified Person

Roger Moss, PhD., P.Geo., President and CEO of LabGold, a Qualified Person in accordance with Canadian regulatory requirements as set out in NI 43-101, has read and approved the scientific and technical information that forms the basis for the disclosure contained in this release.

About Labrador Gold
Labrador Gold is a Canadian based mineral exploration company focused on the acquisition and exploration of prospective gold projects in Eastern Canada.

Labrador Gold’s flagship property is the 100% owned Kingsway project in the Gander area of Newfoundland. The three licenses comprising the Kingsway project cover approximately 12km of the Appleton Fault Zone which is associated with numerous gold occurrences in the region. Infrastructure in the area is excellent located just 18km from the town of Gander with road access to the project, nearby electricity and abundant local water. LabGold is drilling a projected 100,000 metres targeting high-grade epizonal gold mineralization along the Appleton Fault Zone with encouraging results. The Company has approximately $10 million in working capital and is well funded to carry out the planned program.

The Hopedale property covers much of the Florence Lake greenstone belt that stretches over 60 km. The belt is typical of greenstone belts around the world but has been underexplored by comparison. Work to date by Labrador Gold show gold anomalies in rocks, soils and lake sediments over a 3 kilometre section of the northern portion of the Florence Lake greenstone belt in the vicinity of the known Thurber Dog gold showing where grab samples assayed up to 7.8g/t gold. In addition, anomalous gold in soil and lake sediment samples occur over approximately 40 km along the southern section of the greenstone belt (see news release dated January 25 th 2018 for more details). Labrador Gold now controls approximately 40km strike length of the Florence Lake Greenstone Belt.

The Company has 170,009,979 common shares issued and outstanding and trades on the TSX Venture Exchange under the symbol LAB.

For more information please contact:

Roger Moss, President and CEO Tel: 416-704-8291

Or visit our website at: www.labradorgold.com

@LabGoldCorp

Neither TSX Venture Exchange nor its Regulation Services Provider (as that term is defined in policies of the TSX Venture Exchange) accepts responsibility for the adequacy or accuracy of this release .

Forward-Looking Statements: This news release contains forward-looking statements that involve risks and uncertainties, which may cause actual results to differ materially from the statements made. When used in this document, the words “may”, “would”, “could”, “will”, “intend”, “plan”, “anticipate”, “believe”, “estimate”, “expect” and similar expressions are intended to identify forward-looking statements. Such statements reflect our current views with respect to future events and are subject to risks and uncertainties. Many factors could cause our actual results to differ materially from the statements made, including those factors discussed in filings made by us with the Canadian securities regulatory authorities. Should one or more of these risks and uncertainties, such as actual results of current exploration programs, the general risks associated with the mining industry, the price of gold and other metals, currency and interest rate fluctuations, increased competition and general economic and market factors, occur or should assumptions underlying the forward looking statements prove incorrect, actual results may vary materially from those described herein as intended, planned, anticipated, or expected. We do not intend and do not assume any obligation to update these forward-looking statements, except as required by law. Shareholders are cautioned not to put undue reliance on such forward-looking statements.

Photos accompanying this announcement are available at

https://www.globenewswire.com/NewsRoom/AttachmentNg/8ada2b49-2cf3-4482-ba32-69dcfdfdee84

https://www.globenewswire.com/NewsRoom/AttachmentNg/37ca58a1-438d-41be-9aa5-01115a320d9a