MALVERN, Pa., Sept. 06, 2022 (GLOBE NEWSWIRE) — Ocugen, Inc. (“Ocugen” or the “Company”) (NASDAQ: OCGN), a biotechnology company focused on discovering, developing, and commercializing novel gene and cell therapies and vaccines, announced that Dr. Shankar Musunuri, Chairman, Chief Executive Officer and Co-Founder of Ocugen, will participate in an in-person fireside chat at the H.C. Wainwright 24th Annual Global Investment Conference being held September 12-14, 2022 in New York, NY.
Details regarding Dr. Musunuri’s fireside chat are as follows:
Event:
H.C. Wainwright 24th Annual Global Investment Conference
A live video webcast beginning at 3:30 p.m. ET on the day of the presentation will be available on the events page of the Ocugen investor site. The webcast replay will be archived for 90 days following the event.
About Ocugen, Inc. Ocugen, Inc. is a biotechnology company focused on discovering, developing, and commercializing novel gene and cell therapies and vaccines that improve health and offer hope for patients across the globe. We are making an impact on patient’s lives through courageous innovation—forging new scientific paths that harness our unique intellectual and human capital. Our breakthrough modifier gene therapy platform has the potential to treat multiple retinal diseases with a single product, and we are advancing research in infectious diseases to support public health and orthopedic diseases to address unmet medical needs. Discover more at www.ocugen.com and follow us on Twitter and LinkedIn.
Cautionary Note on Forward-Looking Statements This press release contains forward-looking statements within the meaning of The Private Securities Litigation Reform Act of 1995, which are subject to risks and uncertainties. We may, in some cases, use terms such as “predicts,” “believes,” “potential,” “proposed,” “continue,” “estimates,” “anticipates,” “expects,” “plans,” “intends,” “may,” “could,” “might,” “will,” “should,” or other words that convey uncertainty of future events or outcomes to identify these forward-looking statements. Such statements are subject to numerous important factors, risks, and uncertainties that may cause actual events or results to differ materially from our current expectations. These and other risks and uncertainties are more fully described in our periodic filings with the Securities and Exchange Commission (SEC), including the risk factors described in the section entitled “Risk Factors” in the quarterly and annual reports that we file with the SEC. Any forward-looking statements that we make in this press release speak only as of the date of this press release. Except as required by law, we assume no obligation to update forward-looking statements contained in this press release whether as a result of new information, future events, or otherwise, after the date of this press release.
Contact: Tiffany Hamilton Head of Communications IR@ocugen.com
CHATHAM, N.J., Sept. 06, 2022 (GLOBE NEWSWIRE) — Tonix Pharmaceuticals Holding Corp. (Nasdaq: TNXP) (Tonix or the Company), a clinical-stage biopharmaceutical company, today announced three oral presentations by academic collaborators at the 29th International Congress of The Transplantation Society (TTS 2022) being held September 10-14, 2022 in Buenos Aires, Argentina, and virtually. Copies of the presentations will be available under the Scientific Presentations tab of the Tonix website at www.tonixpharma.com following the conference.
Oral Presentation Details
Title:
Long-term rejection free renal allograft survival with Fc-modified anti-CD154 antibody monotherapy in nonhuman primates
Date:
Monday, September 12, 2022
Time:
4:35 p.m. EDT (17:35 ART)
Session:
Campfire Session: Models, mechanisms & therapies
Presenter
Grace Lassiter, M.D., Research Fellow of the Kawai Lab
Title:
Monotherapy with TNX-1500, a Fc-modified anti-CD154mAb, prolongs cardiac allograft survival in cynomolgus monkeys
Date:
Tuesday, September 13, 2022
Time:
3:25 p.m. EDT (16:25 ART)
Session:
Mini-Oral Abstracts Session: Snap-shots of thoracic transplantation
Presenter
Kohei Kinoshita, M.D., Research Fellow of the Pierson Lab
Title:
Long-term (>1 year) rejection/TMA free survival of kidney xenografts with triple xenoantigen knockout and multiple human transgenes in nonhuman primates
Date:
Wednesday, September 14, 2022
Time:
10:00 a.m EDT (11:00 ART)
Session:
Mini-Oral Abstracts Session: Xenotransplantation
Presenter
Grace Lassiter, M.D., Research Fellow of the Kawai Lab
Tonix Pharmaceuticals Holding Corp.*
Tonix is a clinical-stage biopharmaceutical company focused on discovering, licensing, acquiring and developing therapeutics to treat and prevent human disease and alleviate suffering. Tonix’s portfolio is composed of central nervous system (CNS), rare disease, immunology and infectious disease product candidates. Tonix’s CNS portfolio includes both small molecules and biologics to treat pain, neurologic, psychiatric and addiction conditions. Tonix’s lead CNS candidate, TNX-102 SL (cyclobenzaprine HCl sublingual tablet), is in mid-Phase 3 development for the management of fibromyalgia with a new Phase 3 study launched in the second quarter of 2022 and interim data expected in the second quarter of 2023. TNX-102 SL is also being developed to treat Long COVID, a chronic post-acute COVID-19 condition. Tonix initiated a Phase 2 study in Long COVID in the third quarter of 2022 and expects interim data in the first half of 2023. TNX-1300 (cocaine esterase) is a biologic designed to treat cocaine intoxication and has been granted Breakthrough Therapy designation by the FDA. A Phase 2 study of TNX-1300 is expected to be initiated in the first quarter of 2023. TNX-1900 (intranasal potentiated oxytocin), a small molecule in development for chronic migraine, is expected to enter the clinic with a Phase 2 study in the fourth quarter of 2022. Tonix’s rare disease portfolio includes TNX-2900 (intranasal potentiated oxytocin) for the treatment of Prader-Willi syndrome. TNX-2900 has been granted Orphan Drug designation by the FDA. Tonix’s immunology portfolio includes biologics to address organ transplant rejection, autoimmunity and cancer, including TNX-1500, which is a humanized monoclonal antibody targeting CD40-ligand (CD40L or CD154) being developed for the prevention of allograft and xenograft rejection and for the treatment of autoimmune diseases. A Phase 1 study of TNX-1500 is expected to be initiated in the first half of 2023. Tonix’s infectious disease pipeline consists of a vaccine in development to prevent smallpox and monkeypox, next-generation vaccines to prevent COVID-19, and a platform to make fully human monoclonal antibodies to treat COVID-19. TNX-801, Tonix’s vaccine in development to prevent smallpox and monkeypox, also serves as the live virus vaccine platform or recombinant pox vaccine (RPV) platform for other infectious diseases. A Phase 1 study of TNX-801 is expected to be initiated in Kenya in the first half of 2023. Tonix’s lead vaccine candidate for COVID-19 is TNX-1850, a live virus vaccines based on Tonix’s recombinant pox live virus vector vaccine platform. A Phase 1 study of the COVID-19 vaccine is expected to be initiated in the second half of 2023.
*All of Tonix’s product candidates are investigational new drugs or biologics and have not been approved for any indication.
This press release and further information about Tonix can be found at www.tonixpharma.com.
Forward Looking Statements
Certain statements in this press release are forward-looking within the meaning of the Private Securities Litigation Reform Act of 1995. These statements may be identified by the use of forward-looking words such as “anticipate,” “believe,” “forecast,” “estimate,” “expect,” and “intend,” among others. These forward-looking statements are based on Tonix’s current expectations and actual results could differ materially. There are a number of factors that could cause actual events to differ materially from those indicated by such forward-looking statements. These factors include, but are not limited to, risks related to the failure to obtain FDA clearances or approvals and noncompliance with FDA regulations; delays and uncertainties caused by the global COVID-19 pandemic; risks related to the timing and progress of clinical development of our product candidates; our need for additional financing; uncertainties of patent protection and litigation; uncertainties of government or third party payor reimbursement; limited research and development efforts and dependence upon third parties; and substantial competition. As with any pharmaceutical under development, there are significant risks in the development, regulatory approval and commercialization of new products. Tonix does not undertake an obligation to update or revise any forward-looking statement. Investors should read the risk factors set forth in the Annual Report on Form 10-K for the year ended December 31, 2021, as filed with the Securities and Exchange Commission (the “SEC”) on March 14, 2022, and periodic reports filed with the SEC on or after the date thereof. All of Tonix’s forward-looking statements are expressly qualified by all such risk factors and other cautionary statements. The information set forth herein speaks only as of the date thereof.
How Long Can the Imbalance of Energy Production and Demand Continue?
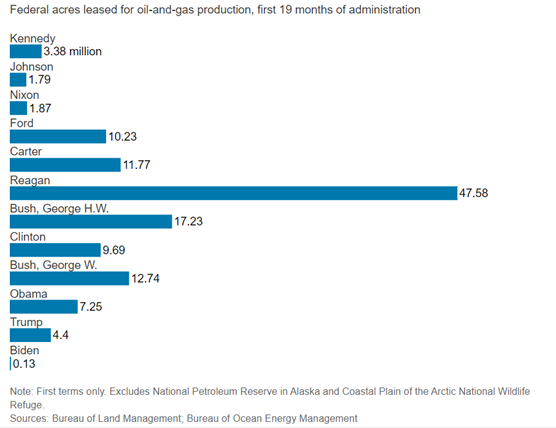
During the first 19 months after taking office, the Biden administration has leased fewer acres for oil and gas drilling than any president’s first 19 months since Harry Truman (1945-46). Not long ago, Candidate Biden promised to stop drilling on federal lands to help force a transition to cleaner energy. This promise has mostly been kept. But it is getting more difficult for the 46th POTUS. Demand pressures and reduced output caused oil prices to already be off its pandemic lows when Russia’s invasion of Ukraine gave way to a semi-embargo on Russian goods, which included oil and gas.
President Biden’s Interior Department leased 126,228 acres for drilling through Aug. 20, during his first 19 months in office. Analysts at the Wall Street Journal uncovered that no president since Nixon in 1969-70 leased out fewer than 4.4 million acres at this stage in their occupation of the White House.
Truman was the most recent to lease out fewer acres, 65,658. This was just after WWII at a time when offshore drilling was just beginning and the federal government didn’t yet control the deep-water leases that are the largest portion of the federal oil-and-gas program today.
The leasing program had tapered during the past decade as fracking shale became preferable to drilling offshore or on federal land. Biden’s use of land and deep-sea leases represents a decline of 97% as compared to the same time period of Trump’s stewardship which had declined 39% compared to his predecessor.
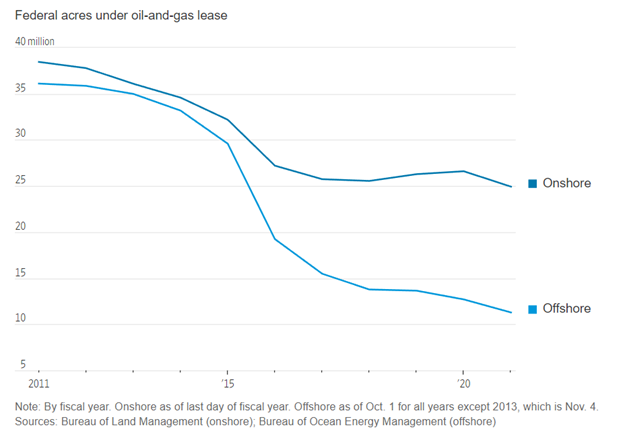
A record high number of drilling permits for existing leases were filed last year, according to The Interior Department . Department spokeswoman Melissa Schwartz told the Wall Street Journal that industry trends have driven most U.S. production to private and state-owned lands, and that of the roughly 35 million acres now leased from the federal government, about 60% aren’t actively producing.
As for offshore leases, the Biden administration has yet to complete a sale. It did hold one, on Nov. 17, offering 80 million acres in the Gulf of Mexico in a sale originally proposed by the Trump administration that would have been the largest offshore sale in U.S. history. It sold 1.7 million acres, but a federal judge invalidated the sale in January, ruling that the administration failed to do a proper environmental analysis.
One can either appreciate the resolve of the current administration in its effort to foster fewer emmited pollutants, or fault him for his role in curbing energy production and its contribution to higher prices and less energy independence. If the measurement had been made as of the first 17 months of his presidency, the acreage number would be zero, there were no onshore lease sales. The government then held five June 29-30.
Leases for oil and natural gas drilling is the beginning of the petroleum product supply chain. But, while there is no shortage of federal land, an escalation of lease sales now, or under any successor’s policies, would take years to build and deliver its first barrel.
The increase in gasoline and oil prices has caused the president to take steps to boost oil supplies. In late March the President said he’d be releasing as much as 180 million gallons from the strategic oil reserves over the following 180 days. This was unprecedented in its magnitude and a response to the doubling and tripling of gasoline prices.
Energy independence has been the goal of many of Biden’s predecessors. We live at a time when the call has been to prioritize policy that encourages transitioning to non-fossil fuel. This naturally has caused investors in resources like lithium and uranium to see price increases. Large oil price increases have also come from lower growth of petroleum supplies. Part of the relief valve the administration used, is tapping into the finite supply of strategic oil reserves. The current pace of using this resource is unsustainable.
This could indicate that energy investors, in fossil fuels and alternatives may see strong markets with demand outstripping supply going forward for some time.
The Differences Investors Should Know Between Biotech Companies and Pharmaceutical Manufacturers
In mid-June of this year, the stock market seemed to have changed. The oil sector that had been up for most of the year began trending down, and most other industries that had been hard hit began moving up in a mid-year “V” shape. The new leader replacing oil was biotech, which had been one of the hardest hit at the beginning of the year. It makes sense that biotech trades with its own cycles – it’s a very different sector. There is reason to believe that fundamentals favor the biotech sector now, below we discuss the nuances of these very interesting companies, and explain how they are different than other drug companies..
With biotech stocks, regulators, financiers, the highly educated, geniuses, technology, and investors all come together to help people in the most important way – life and health. For investors, it provides its own set of challenges, and at least two possible rewards. If an investor uncovers the stock that has the right mix of science, money and regulatory approval, they may not only cash in like few other sectors, but also be part of improving the health of generations to come.
Above, I did use the word “possible”. This is true of all stocks in all sectors, but the volatility in the biotech sector is a demonstration of the adage that for bigger potential rewards, one would have to increase their risk. Companies in this industry, often startups with great patents, burn through millions of dollars, often with zero earnings, and with any potential for earnings years off and contingent on being right about their science and the products it can provide. This means stock selection in biotech requires a deeper understanding of the company and potential for its work than in other sectors.
What’s included in the Biotechnology Sector?
Biotechnology focuses on novel drug development and clinical research aimed at treating diseases and medical conditions.
They are almost always unprofitable, and many have no revenue at all. In fact, some stock analysts would suggest that the main distinction between a biotech and a pharmaceutical company lies in profitability. Biotechnology is often characterized as being more research and development than manufacturing. They serve as incubators for the ideas that lead to the next “miracle” cures. But, drug development has a long development timeline. A successful candidate can take a decade or more to go from idea to available medicine. That’s if it is among the roughly 10% of prospective candidates that reaches approval for use.
Why would anyone invest in a company that is developing a pipeline of potential products that each have about a 10% chance of approval? Because breakthrough drugs, and the potential for breakthroughs, each step forward on the path toward approval often provides a huge upward move in the stock price. Even if not eventually approved. Conversely failure to move forward often comes with a rapid decline from disappointment.
Differences Between Biotech and Pharmaceuticals
There is a lot of overlap and a gray area between what is biotech and what is pharmaceutical. Here are some guidelines of where the differences often lay.
Biotechnology ventures tend to be more entrepreneurial pursuits with a lot on the line for the success of an idea, while pharmaceutical companies have an ongoing business and can better gauge and manage business risk. One reason is pharmaceutical companies often have a large diversified portfolio of approved drugs they market. They may also have drugs in various stages of research and development, but these costs are usually investments in future products using current revenue.
A biotechnology firm is often based on “new” science and driven to develop a useful and profitable application for the science. An example of a growing segment of biotech is biopharma which develops drugs originating living organisms.
Large pharmaceutical companies often pay stable dividends to shareholders, this is rare in companies that fall under the biotech umbrella, if there are earnings it may be reinvested in moving forward the study of drugs in development. Many biotechs’ strength is to explore and develop, not to market the successful result. Large pharmaceutical companies, like Johnson and Johnson (JNJ)or Eli Lilly (LLY) are marketing machines, they look to smaller biotech to be an incubator to keep their portfolio of products fresh.
The two industries also stand apart when it comes to valuation and business evaluation. Models and valuation derived from cash flow are quite relevant in assessing pharmaceutical stocks. While many analysts gamely attempt to construct discounted cash flow models for early-stage biotechs, the reality is that success is often thumbs-up or thumbs-down (“drug works” or “drug doesn’t work”).
The FDA Has Final Say
As the regulatory body that approves new drugs for the U.S. market, as well as issues permits for human clinical trials, the Food and Drug Administration (FDA) is the gatekeeper for every biotech firm. Investors should have some understanding of the FDA process and requirements or follow an analyst covering the sector that does. In order to get FDA approval, biotechs must establish a sufficient body of information that the drug is safe and effective. This is generally done through a series of at least three clinical trials.
If the trials meet the goals for safety and efficacy, the company files a request for approval called a New Drug Application (NDA). If the NDA is approved, the FDA sets the date a decision will be made by on the application.
Product Pipeline
A biotech’s pipeline is the future of the company. Investors focus a great deal on the number of entrants in the pipeline, the stages of study they are at, and the overall science, and competing products (if any). It’s critical to establish valuation forecasts.
Different biotech companies tend to operate in different stages of a product’s development. The stages are, most commonly, preclinical testing, enabling studies, clinical trials, and biologics licensing. A company that is focused on the early stage of research and development will conduct preliminary research to determine whether an idea may successfully be used against a disease or ailment. It attempts to answer, “can this technology become a product?”. This step requires translating the technology into a product. Preclinical testing is the phase of product development when a company must show that its proposed product is safe. They must also determine what the pharmacokinetics (PK) pharmacodynamics (PD) are. PK shows what happens to a drug once it enters the body, ie: how quickly its absorbed, distributed, metabolized, and excreted. Studies done for the express purpose of convincing the FDA to approve the start of clinical trials in humans are called Investigational New Drug (IND)-enabling.
Once a startup has received approval from the FDA to begin clinical trials for their product, they progress through a series of phases depending on how their product fares. These phases are:
Phase 1 This first trial’s main purpose is to determine that the product is safe for use in humans. The number of participants is kept as small as possible, and may be limited to patients who are farther along in a disease state or who have exhausted other options for treatment.
Phase 2 The second phase continues to confirm that the product is safe, but increases the number of participants and tries to determine the optimum dose and regimen.
Phase 3 Typically the last clinical trial phase and is designed to determine whether the treatment is truly effective, and is expanded to include enough people so the potential side effects are more likely to be captured in the data.
The biologics license application (BLA) is the process by which a biologic that has successfully completed clinical trials applies to the FDA to be sold to the public. A new drug application (NDA) is the same process, but for pharmaceuticals.
Take Away
Biotech investing can be very rewarding. Investors need to understand the company and the risks, and also the stage in the pipeline and the success of recent trials. Failed attempts by companies in this sector at devising the next wonder drug outnumber successes. One success may easily make up for some failures for investors. With research into the company and even reliance on trusted analysts that specialize in biotechs, an investor can increase their chances of uncovering oversized profits. We encourage you, if you are not signed up for Channelchek and the research by Noble Capital Markets equity analysts delivered to your inbox each morning, to take the time and register with us now.
Joe Gomes, Senior Research Analyst, Noble Capital Markets, Inc.
Joshua Zoepfel, Research Associate, Noble Capital Markets, Inc.
Refer to the full report for the price target, fundamental analysis, and rating.
10b5-1 Plan. On August 31, 2022, Michael P. Connors, Chairman and Chief Executive Officer of Information Services Group, Inc. entered into a written stock selling plan in accordance with Rule 10b5-1 under the Securities Exchange Act of 1934, to sell a limited number of shares of the Company’s common stock. Rule 10b5-1 provides guidelines for officers, directors and other insiders to prearrange sales of securities in a manner that avoids concerns about initiating stock transactions while in possession of material nonpublic information.
Details. The Plan allows for the sale of a maximum of 1,200,000 shares of the Company’s common stock, commencing on October 3, 2022 and continuing until all such shares are sold or March 15, 2023, whichever occurs first. According to the 8-k filing, Mr. Connors is currently the Company’s second largest shareholder, beneficially owning approximately 10.9% of the Company’s total outstanding common stock as of August 31, 2022. A Form 4 filed August 3rd, indicates Mr. Connors held nearly 5.7 million III shares.
This Company Sponsored Research is provided by Noble Capital Markets, Inc., a FINRA and S.E.C. registered broker-dealer (B/D).
*Analyst certification and important disclosures included in the full report. NOTE: investment decisions should not be based upon the content of this research summary. Proper due diligence is required before making any investment decision.
This article was republished with permission from The Conversation, a news site dedicated to sharing ideas from academic experts. It represents the research-based findings and thoughts of Joseph Scalia, Associate Professor of Civil and Environmental Engineering, Colorado State University
Sandcastle Engineering – A Geotechnical Engineer Explains How Water, Air and Sand Create Solid Structures
If you want to understand why some sandcastles are tall and have intricate structures while others are nearly shapeless lumps of sand, it helps to have a background in geotechnical engineering.
As a geotechnical engineering educator myself, I use sandcastles in the classroom to explain how interactions of soil, water and air make it possible to rebuild landscapes after mining metals critical to the energy transition.
Building a sandcastle comes down to the right mix of those three ingredients. Sand provides the structure, but it’s water between the sand grains that provides the force – in this case, suction – that holds the sand together. And without the right amount of air the water would just push the sand grains apart.
Not Just Any Sand
Sand grains, according to the standards body ASTM International’s Unified Soil Classification System, are soil particles having a diameter of 0.003 inches (0.075 mm) to 0.187 inches (4.75 mm). Sands, by definition, have at least half their particles in that range. Silt or clay is soil with particles smaller than sand size. And soil with particles larger than sand size is gravel.
The size of particles, or grains, also determines the way sand looks and feels. The smallest sand grains have a texture almost like powdered sugar. The largest grains are more like the size of small dry lentils.
Most sand will work for building a sandcastle, but the best sand has two characteristics: grains of sand in several different sizes and grains with angular or rough edges. Variation in grain size allows smaller sand grains to fill the pockets, or pores, between the larger sand grains. The result is increased sand strength.
Sand grains that are more angular, with sharp corners on them, lock together better, making the sandcastle stronger. It’s the same reason a pile of angular wooden blocks will stay in a pile, but a pile of marbles will go everywhere.
This is also why, surprisingly, the best sand for sandcastles is not typically found on an island or a coastal beach. More angular grains of sand are usually found closer to mountains, their geologic source. These sand grains have not yet had their edges rounded off by wind and water. Professional sandcastle builders will go so far as to import river sand for their creations.
Finally, the closer together the sand grains are, the stronger the sand will be. Pressing wet sand together tightly, by compaction or tamping, squeezes sand grains together, decreasing the size of pores and increasing the effect water can have. Compaction also increases grain interlocking and, consequently, sand strength.
Suction is one of the forces holding this sand sculpture together (El Coleccionista de Instantes – Flickr)
Just Enough Water
The quantity of water in the sand controls the size and strength of the water bridges. Too little water equals little bridges between the sand grains. More water, and the size and number of bridges grows, increasing the suction holding the sand grains together. The result is perfect sandcastle sand.
Too much water, though, and the suction is too weak to hold the sand together.
A general rule of thumb for building great sandcastles is one part water for every eight parts dry sand. Under ideal conditions in a laboratory, though, with dense sand and zero evaporation, one part water for every one hundred parts dry sand can produce wonders. At a beach, sand with the right moisture level is near the high tide line when the tide is low.
Incidentally, salt from seawater can also be a boon for sandcastle stability. Capillary forces hold sand grains together initially, but capillary water will eventually evaporate, particularly on a windy day. When sea water dries up, salt is left behind. Since the seawater was forming bridges between the grains, the salt crystallizes at these points of contact. In this way, salt can keep a sandcastle standing long after the sand has dried. But be careful not to disturb the salt-bonded sand; it’s brittle and collapsible.
To build a strong sandcastle, compact sand and a little water as tightly as you can. I prefer to create a dense mound and then scoop and carve away to reveal the art within. You can also compact the sand into buckets, cups or other molds, and build from the ground up. Just be sure to get the sand dense, and place the mold on a compacted foundation. Hands make for both a great compaction and carving tool, but a shovel or a seashell will allow for more precision. Have fun, and don’t be afraid to get sandy!
Mark Reichman, Senior Research Analyst, Natural Resources, Noble Capital Markets, Inc.
Refer to the full report for the price target, fundamental analysis, and rating.
Prospecting and mapping yield results. The work by the company’s prospecting and mapping team is quickly identifying new VMS targets at Scarlet Ridge and Scarlet Valley which has advanced them from areas of interest into drilled targets that are now delivering significant sulfide-bearing mineralized intercepts. Mineralization and hydrothermal alteration are intense and widespread throughout areas drilled to date.
Maiden drilling commences at Scarlet Valley. Maiden drilling is underway at Scarlet Valley targeting extensive surface exposures of a VMS feeder zone including replacement-style sulfide mineralization. Hole SV22-1 was drilled to a depth of 618 meters to enable three-dimensional geologic modeling of favorable horizons for replacement-style mineralization along strike. A second drill has been deployed to help define the extent of this highly prospective area before the onset of winter weather. Management expects to drill nine holes at Scarlet Valley.
This Company Sponsored Research is provided by Noble Capital Markets, Inc., a FINRA and S.E.C. registered broker-dealer (B/D).
*Analyst certification and important disclosures included in the full report. NOTE: investment decisions should not be based upon the content of this research summary. Proper due diligence is required before making any investment decision.
Codere Online refers, collectively, to Codere Online Luxembourg, S.A. and its subsidiaries. Codere Online launched in 2014 as part of the renowned casino operator Codere Group. Codere Online offers online sports betting and online casino through its state-of-the art website and mobile application. Codere currently operates in its core markets of Spain, Italy, Mexico, Colombia, Panama and the City of Buenos Aires (Argentina). Codere Online’s online business is complemented by Codere Group’s physical presence throughout Latin America, forming the foundation of the leading omnichannel gaming and casino presence in the region.
Michael Kupinski, Director of Research, Noble Capital Markets, Inc.
Patrick McCann, Research Associate, Noble Capital Markets, Inc.
Refer to the full report for the price target, fundamental analysis, and rating.
Q2 results. The company reported Q2 net gaming revenue of €29.2 million, representing 41% year-over-year growth, which was an acceleration from the 24% year-over-year growth in Q1. Growth in Mexico continued to be strong, at 85%, while revenue in Spain also grew over the prior year period by 12%.
Planning expansion in Argentina. In August, the company completed its application for an online gaming license in the Argentine province of Cordoba. Management noted that a decision on the application is expected in the next month. Licenses are expected to be issued before year-end for approved operators…
This Company Sponsored Research is provided by Noble Capital Markets, Inc., a FINRA and S.E.C. registered broker-dealer (B/D).
*Analyst certification and important disclosures included in the full report. NOTE: investment decisions should not be based upon the content of this research summary. Proper due diligence is required before making any investment decision.
Allegiant owns 100% of 10 highly-prospective gold projects in the United States, seven of which are located in the mining-friendly jurisdiction of Nevada. Three of Allegiant’s projects are farmed-out, providing for cost reductions and cash-flow. Allegiant’s flagship, district-scale Eastside project hosts a large and expanding gold resource and is located in an area of excellent infrastructure. Preliminary metallurgical testing indicates that both oxide and sulphide gold mineralization at Eastside is amenable to heap leaching.
Mark Reichman, Senior Research Analyst, Natural Resources, Noble Capital Markets, Inc.
Refer to the full report for the price target, fundamental analysis, and rating.
Core diamond drill program. In June, Allegiant Gold commenced a diamond core drilling program at Eastside in the high-grade zone discovered during the 2021 drill program within the original pit zone. The company is on the fifth hole which have averaged 530 meters to 550 meters depth. We think the company could complete up to 9 holes by the end of the year. Recall that in May 2021, results from Allegiant’s nine-hole drill program returned strong gold intercepts for Holes 239, 243, 244, and 245.
RC drilling results expected soon. Allegiant completed a 32-hole, 6,703-meter reverse circulation drill program in June to test new exploration targets at Eastside, including 21 holes drilled in the East Pediment and 11 holes drilled at the West Anomaly. The targets are to the east and west of the original pit zone and we expect the company to begin releasing available drill results from this program soon. We believe Allegiant may resume reverse circulation drilling in October to continue drilling additional targets based on assays….
This Company Sponsored Research is provided by Noble Capital Markets, Inc., a FINRA and S.E.C. registered broker-dealer (B/D).
*Analyst certification and important disclosures included in the full report. NOTE: investment decisions should not be based upon the content of this research summary. Proper due diligence is required before making any investment decision.
1·800·Flowers.com (FLWS) – Is The Vase Half Empty?
For more than 45 years, 1-800-Flowers.com has offered truly original floral arrangements, plants and unique gifts to celebrate birthdays, anniversaries, everyday occasions, and seasonal holidays, and to deliver comfort during times of grief. Backed by a caring team obsessed with service, 1-800-Flowers.com provides customers thoughtful ways to express themselves and connect with the most important people in their lives. 1-800-Flowers.com is part of the 1-800-FLOWERS.COM, Inc. family of brands. Shares in 1-800-FLOWERS.COM, Inc. are traded on the NASDAQ Global Select Market, ticker symbol: FLWS.
Michael Kupinski, Director of Research, Noble Capital Markets, Inc.
Refer to the full report for the price target, fundamental analysis, and rating.
Fiscal Q4 disappoints. The company reported a disappointing fiscal Q4. While revenues were largely in line with expectations, costs increased substantially. The company reported an adj. EBITDA loss of $16.8 million versus our $4.0 million estimate.
Gross margins tumble. Gross margins tumbled 700 basis points to 33.7%, lower than our 34% estimate. The company was adversely affected by higher wage, transportation, and ocean freight costs, as well as a write down of perishable inventory due to weakened consumer demand. …
This Company Sponsored Research is provided by Noble Capital Markets, Inc., a FINRA and S.E.C. registered broker-dealer (B/D).
*Analyst certification and important disclosures included in the full report. NOTE: investment decisions should not be based upon the content of this research summary. Proper due diligence is required before making any investment decision.
MALVERN, Pa., Sept. 01, 2022 (GLOBE NEWSWIRE) — Baudax Bio, Inc. (the “Company” or “Baudax Bio”) (NASDAQ: BXRX), a pharmaceutical company focused on therapeutics for acute care settings, today announced the closing of its previously announced public offering of an aggregate of 11,819,172 shares of its common stock (or pre-funded warrants in lieu thereof), together with accompanying common stock purchase warrants, at a public offering price of $0.525 per share (or pre-funded warrant) and accompanying warrants. Each share of common stock (or pre-funded warrant) was sold in the offering together with a Series A-1 warrant to purchase one share of common stock at an exercise price of $0.525 per share and a Series A-2 warrant to purchase one share of common stock at an exercise price of $0.525 per share. The Series A-1 warrants are exercisable immediately and will expire five years from the date of issuance, and the Series A-2 warrants are exercisable immediately and will expire thirteen months from the date of issuance.
H.C. Wainwright & Co. acted as the exclusive placement agent for the offering.
The gross proceeds from the offering, before deducting the placement agent’s fees and other offering expenses, were approximately $6.2 million. The Company intends to use the net proceeds from this offering for pipeline development activities and general corporate purposes.
The securities described above were offered pursuant to a registration statement on Form S-1 (File No. 333-266499), which was declared effective by the Securities and Exchange Commission (the “SEC”) on August 29, 2022. The offering was made only by means of a prospectus which is a part of the effective registration statement. A final prospectus relating to the offering has been filed with the SEC. Electronic copies of the final prospectus may be obtained on the SEC’s website at http://www.sec.gov and may also be obtained by contacting H.C. Wainwright & Co., LLC at 430 Park Avenue, 3rd Floor, New York, NY 10022, by phone at (212) 856-5711 or e-mail at placements@hcwco.com.
This press release shall not constitute an offer to sell or a solicitation of an offer to buy any of the securities described herein, nor shall there be any sale of these securities in any state or other jurisdiction in which such offer, solicitation or sale would be unlawful prior to the registration or qualification under the securities laws of any such state or other jurisdiction.
About Baudax Bio
Baudax Bio is a pharmaceutical company focused on innovative products for acute care settings. Baudax Bio markets ANJESO®, the first and only 24-hour, non-opioid, intravenous (IV) COX-2 preferential non-steroidal anti-inflammatory (NSAID) for the management of moderate to severe pain. In addition to ANJESO®, the Company has a pipeline of other innovative pharmaceutical assets including two clinical-stage, novel neuromuscular blocking (NMBs) agents and a proprietary chemical reversal agent specific to these NMBs.
Forward Looking
Statements
This press release contains forward-looking statements that involve risks and uncertainties. Such forward-looking statements reflect Baudax Bio’s expectations about its future performance and opportunities that involve substantial risks and uncertainties. When used herein, the words “anticipate,” “believe,” “estimate,” “may,” “upcoming,” “plan,” “target,” “goal,” “intend” and “expect” and similar expressions, as they relate to Baudax Bio or its management, are intended to identify such forward-looking statements. Forward-looking statements may include, without limitation, statements regarding market conditions and the use of net proceeds from the offering. These forward-looking statements are based on information available to Baudax Bio as of the date of publication on this internet site and are subject to a number of risks, uncertainties, and other factors that could cause Baudax Bio’s performance to differ materially from those expressed in, or implied by, these forward-looking statements. These risks and uncertainties include, among other things, risks related to market and other conditions, the ongoing economic and social consequences of the COVID-19 pandemic, Baudax Bio’s ability to advance its current product candidate pipeline through pre-clinical studies and clinical trials, Baudax Bio’s ability to raise future financing for continued development of its product candidates such as BX1000, BX2000 and BX3000, Baudax Bio’s ability to pay its debt and satisfy conditions necessary to access future tranches of debt, Baudax Bio’s ability to comply with the financial and other covenants under its credit facility, Baudax Bio’s ability to manage costs and execute on its operational and budget plans, Baudax Bio’s ability to achieve its financial goals; and Baudax Bio’s ability to obtain, maintain and successfully enforce adequate patent and other intellectual property protection. These forward-looking statements should be considered together with the risks and uncertainties that may affect Baudax Bio’s business and future results included in Baudax Bio’s filings with the Securities and Exchange Commission at www.sec.gov. These forward-looking statements are based on information currently available to Baudax Bio, and Baudax Bio assumes no obligation to update any forward-looking statements except as required by applicable law.
Investor Relations
Contact: Argot Partners Sam Martin / Kaela Ilami (212) 600-1902 baudaxbio@argotpartners.com
TORONTO, ON / ACCESSWIRE
/ September 1, 2022 / Eskay Mining Corp. (“Eskay” or the
“Company”) (TSXV:ESK)(OTCQX:ESKYF)(Frankfurt:KN7) (WKN:A0YDPM) is pleased to announce maiden drilling at Scarlet Valley, a newly identified volcanogenic massive sulfide (“VMS”) center near Scarlet Ridge, part of its 100% controlled Consolidated Eskay project, British Columbia. As of this news release, the Company has completed 22,272 m of diamond core drilling, approximately 74% of the 30,000m planned to be completed in 2022. Drill production is currently on target to reach this aggressive goal with four drills fully operational. Currently two drills are conducting step-out drilling of the Upper Stockwork Zone at TV, and two drills are beginning to define the extent of the intensely mineralized Scarlet Valley target. Preparations are underway to drill the Tarn Lake target immediately following completion of drilling at Scarlet Valley.
“Our prospecting and mapping team’s work is rapidly identifying and characterizing new VMS targets at Scarlet Ridge and Scarlet Valley, key to quickly advancing these from areas of interest into drilled targets that are now delivering significant sulfide-bearing mineralized intercepts,” commented Dr. John DeDecker, Eskay Mining’s VP of Exploration. “Mineralization and hydrothermal alteration are extremely intense and widespread throughout areas drilled to date. Much more visible sulfide mineralization awaits us at Scarlet Knob and Tarn Lake. Demonstrating we hold a VMS district by making new discoveries is our goal this season. We are fortunate to have a top-notch team in place to execute a very aggressive, flexible exploration program. So far, we are meeting our objectives set for the 2022 program on schedule.”
Maiden drilling at Scarlet Valley is underway with drill hole SV22-1 intercepting 95 m of intense sulfide mineralization and hydrothermal alteration. Recent drilling at Scarlet Ridge has intercepted a zone of intense hydrothermal alteration and replacement-style sulfide mineralization. Drilling at Scarlet Ridge and Scarlet Valley as well as recent field investigations at Scarlet Knob-Tarn Lake (Figure 1) confirms the presence of replacement-style and stockwork VMS mineralization at all locations. Generally, sulfide mineralization is most intense proximal to east-west trending and vertically oriented basalt dikes suggesting that hydrothermal fluids exploited the same syn-volcanic structures as these dikes during their ascent to the seafloor/sub-seafloor environment.
A more detailed BLEG, clay-fraction stream sediment survey utilizing LiDAR topographic data collected in 2020 has been completed over the northeastern part of the Property, including Scarlet Valley, Scarlet Knob-Tarn Lake, Scarlet Ridge, and the northern flanks of the McTagg anticlinorium. These areas all have very strong BLEG anomalies identified during the 2020 program (Figure 1). This refined BLEG survey will allow further vectoring towards promising targets in this prolifically mineralized area. A similar detailed BLEG survey has also been completed over the 6 km trend of very strong BLEG anomalies in the vicinity of C10 and Vermillion to further refine targeting in that area.
Highlights from Scarlet
Valley
Maiden drilling is underway at Scarlet Valley (Figure 2) targeting extensive surface exposures of a VMS feeder zone (Figure 3) including replacement-style sulfide mineralization. Mineralization is hosted within rocks proximal to the contact between basalt dikes and surrounding andesite and volcaniclastic debris flows strongly suggesting the presence of syn-volcanic feeder structures. To date, 618 m have been drilled at Scarlet Valley. A second drill has recently been brought to Scarlet Valley to help define the extent of this highly prospective area before winter weather forces retreat to lower elevations.
Intercepts from drill hole SV22-1 display intense mineralization and hydrothermal alteration interpreted as stockwork zone as well as sub-seafloor replacement-style mineralization within volcaniclastic debris flow breccia (Figures 4-6). Sulfide mineralization is intense between downhole depths of 1.0-80.0 m, and 100.0-113.0 m.
Handheld XRF analyses of sulfide minerals in outcrop and drill core show consistently high concentrations of the Au pathfinder elements including Ag, As, Sb, Hg, and Zn. Handheld XRF cannot reliably measure Au concentrations.
Prospecting and mapping teams have identified mineralized rock similar to that intercepted in SV22-1, extending at least 300 m eastward from the collar of this hole (Figures 2 and 3). Additional drilling will test eastward and uphill continuations of this mineralization.
Geological mapping and drone imagery suggests the presence of laterally extensive horizons of replacement-style mineralization extending along strike from interpreted feeder zones. Preliminary investigations of drill core suggest that coarse-grained debris flows with a sandy matrix (Figure 6 bottom image) serve as preferential hosts for sub-seafloor replacement-style mineralization over debris flows muddy matrix material. These observations suggest that greater porosity of coarser-grained matrix material enhances permeability of this host rock thus making it more favorably hydrothermally altered and mineralized. Identification and definition of these coarse-matrix horizons is a key component of current mapping efforts at Scarlet Valley.
Hole SV22-1 was drilled to a depth of 618 m, under the valley floor, in order to enable three-dimensional geologic modeling of favorable horizons for replacement-style mineralization along strike. Sporadic mineralized intervals, up to 10% sulfide content, occur throughout SV22-1, suggesting favorable horizons for replacement-style mineralization continue to the vicinity of the valley floor to the west.
Highlights from Scarlet
Ridge
Maiden drilling at Scarlet Ridge has been completed consisting of five drill holes targeting a zone of sulfide stockwork mineralization and hydrothermal alteration exposed at the surface (Figure 7).
Drill holes SR22-1, -2, -3, and -4 intercepted a zone of intense hydrothermal alteration and pyrite mineralization hosted by autoclastic andesite breccias displaying perlitic texture (Figures 8 and 9). Perlite is a type of volcanic glass that forms by hydration of lava after cooling, and is characterized by concentric circular fractures in the rock. These fractures appear to have served as conduits for hydrothermal fluids, producing a distinct style of mineralization and hydrothermal alteration at Scarlet Ridge.
Handheld XRF indicates that sulfide mineralization in drill core is associated with elevated values of the Au pathfinder element As. Handheld XRF cannot reliably measure Au concentrations.
Two stages of sulfide mineralization are evident at Scarlet Ridge. An early-stage is VMS-related and is associated with clay and chlorite alteration followed by pervasive silicification and stockwork sulfide mineralization in perlitic andesite. This mineralization is associated with intense hydrothermal alteration and sulfide replacement of andesite and volcaniclastic debris flow breccias. Late-stage sulfide mineralization is associated with quartz-carbonate-pyrite veins crosscutting early-stage mineralization and is believed to be associated with late deformation and mountain-building events.
Highlights from Scarlet
Knob-Tarn Lake
Recent field investigations of an area north of Tarn Lake have confirmed the presence of VMS feeder-style mineralization hosted along the contacts between flow-banded rhyolite and cross-cutting east-west trending basalt dikes. Weathering of sulfide mineralization has generated intensely gossanous rock (Figure 10). It is interpreted that this mineralization connects with that found at nearby Scarlet Knob (Figure 11) situated due east on the other side of Bruce Glacier.
Semi-massive to massive sulfide occurs at surface (Figure 12). Handheld XRF analyses of sulfide mineralization shows high concentrations of the Au pathfinder elements Ag, As, and Sb. Handheld XRF cannot reliably measure Au concentrations.
Ag-sulfosalt minerals freibergite and pyrargyrite (Figure 13) are disseminated throughout massive sulfide shown in Figure 12 thus explaining elevated pathfinder element concentrations as determined by XRF.
Preparations are underway to drill at Tarn Lake during the 2022 season.
To date, Eskay Mining has completed approximately 22,272m of diamond core drilling, approximately 74% of the 30,000m planned for 2022. Thus far, drilling has occurred at Jeff North, Scarlet Ridge, TV and Scarlet Valley. At present, four drills are fully operational and drill production is on track to reach Eskay’s aggressive goal of 30,000 m.
Dr. Quinton Hennigh, P. Geo., a Director of the Company and its technical adviser, a qualified person as defined by National Instrument 43-101, has reviewed and approved the technical contents of this news release.
About Eskay Mining Corp:
Eskay Mining Corp (TSX-V:ESK) is a TSX Venture Exchange listed company, headquartered in Toronto, Ontario. Eskay is an exploration company focused on the exploration and development of precious and base metals along the Eskay rift in a highly prolific region of northwest British Columbia known as the “Golden Triangle,” 70km northwest of Stewart, BC. The Company currently holds mineral tenures in this area comprised of 177 claims (52,600 hectares).
Neither the TSX
Venture Exchange nor its Regulation Services Provider (as that term is defined
in the policies of the TSX Venture Exchange) accepts responsibility for the
adequacy or accuracy of this release.
Forward-Looking
Statements: This Press Release
contains forward-looking statements that involve risks and uncertainties, which
may cause actual results to differ materially from the statements made. When
used in this document, the words “may”, “would”,
“could”, “will”, “intend”, “plan”,
“anticipate”, “believe”, “estimate”,
“expect” and similar expressions are intended to identify
forward-looking statements. Such statements reflect our current views with
respect to future events and are subject to risks and uncertainties. Many
factors could cause our actual results to differ materially from the statements
made, including those factors discussed in filings made by us with the Canadian
securities regulatory authorities. Should one or more of these risks and
uncertainties, such as actual results of current exploration programs, the
general risks associated with the mining industry, the price of gold and other
metals, currency and interest rate fluctuations, increased competition and
general economic and market factors, occur or should assumptions underlying the
forward looking statements prove incorrect, actual results may vary materially
from those described herein as intended, planned, anticipated, or expected. We
do not intend and do not assume any obligation to update these forward-looking
statements, except as required by law. Shareholders are cautioned not to put
undue reliance on such forward-looking statements.
Reno, Nevada /September 1, 2022 – Allegiant Gold Ltd.
(“Allegiant” or the “Company”) (AUAU: TSX-V) (AUXXF: OTCQX) is pleased to
announce the appointment of Alan Roberts, MSc, CPG, as Vice President of
Exploration effective on September 10, 2022.
Mr. Roberts has over 30 years of experience working as a
geologist and geophysicist in the Americas (North, Central and South). He has
spent the past eight years working and consulting on numerous epithermal
gold-silver projects in North America, and more specifically in Nevada,
including technical consulting, generative exploration, drill program planning and
supervision as well as overall program management and permitting. Mr. Roberts
holds a Master of Science degree from the Royal School of Mines and a Bachelor
of Science Degree in Geology from the University of London. He is a member of
the American Institute of Professional Geologists.
Peter Gianulis, CEO of Allegiant Gold, commented: “We are
ecstatic to have an individual of Alan’s caliber as part of the Allegiant team
as we look to further expand, and advance, our 1.4-million-ounce gold Eastside
project. Alan’s experience and leadership, particularly in developing
epithermal gold systems, is complementary to our strategic development plans at
Eastside as we look to significantly expand the resource over the next two
years to deliver an updated mineral resource estimate and PEA.”
ABOUT ALLEGIANT
Allegiant owns 100% of 10 highly-prospective gold projects in
the United States, seven of which are located in the mining-friendly
jurisdiction of Nevada. Three of Allegiant’s projects are farmed-out, providing
for cost reductions and cash-flow. Allegiant’s flagship Eastside Project is
district-scale and is host to a large and expanding gold resource, as well as
being located in an area with excellent infrastructure. Preliminary
metallurgical testing indicates that both oxide and sulphide gold mineralization
at Eastside is amenable to heap leaching.
Neither TSX Venture Exchange nor its Regulation Services Provider (as that term is defined in policies of the TSX Venture Exchange) accepts responsibility for the adequacy or accuracy of this release.
Certain statements and information contained in this press release constitute “forward-looking statements” within the meaning of applicable U.S. securities laws and “forward-looking information” within the meaning of applicable Canadian securities laws, which are referred to collectively as “forward-looking statements”. The United States Private Securities Litigation Reform Act of 1995 provides a “safe harbor” for certain forward-looking statements. Allegiant Gold Ltd.’s (“Allegiant”) exploration plans for its gold exploration properties, the drill program at Allegiant’s Eastside project, the preparation and publication of an updated resource estimate in respect of the Original Zone at the Eastside project, Allegiant’s future exploration and development plans, including anticipated costs and timing thereof; Allegiant’s plans for growth through exploration activities, acquisitions or otherwise; and expectations regarding future maintenance and capital expenditures, and working capital requirements. Forward-looking statements are statements and information regarding possible events, conditions or results of operations that are based upon assumptions about future economic conditions and courses of action. All statements and information other than statements of historical fact may be forward-looking statements. In some cases, forward-looking statements can be identified by the use of words such as “seek”, “expect”, “anticipate”, “budget”, “plan”, “estimate”, “continue”, “forecast”, “intend”, “believe”, “predict”, “potential”, “target”, “may”, “could”, “would”, “might”, “will” and similar words or phrases (including negative variations) suggesting future outcomes or statements regarding an outlook. Such forward-looking statements are based on a number of material factors and assumptions and involve known and unknown risks, uncertainties and other factors which may cause actual results, performance or achievements, or industry results, to differ materially from those anticipated in such forward-looking information. You are cautioned not to place undue reliance on forward-looking statements contained in this press release. Some of the known risks and other factors which could cause actual results to differ materially from those expressed in the forward-looking statements are described in the sections entitled “Risk Factors” in Allegiant’s Listing Application, dated January 24, 2018, as filed with the TSX Venture Exchange and available on SEDAR under Allegiant’s profile at www.sedar.com. Actual results and future events could differ materially from those anticipated in such statements. Allegiant undertakes no obligation to update or revise any forward-looking statements included in this press release if these beliefs, estimates and opinions or other circumstances should change, except as otherwise required by applicable law.