Release – Direct Digital Holdings Reports Third Quarter 2023 Financial Results

Research News and Market Data on DRCT

November 09, 2023 4:01pm EST

Third Quarter 2023 Revenue Up 129% Year-Over-Year to $59.5 Million

Company Raises Full-Year 2023 Revenue Guidance to $170 Million – $190 Million

HOUSTON, Nov. 9, 2023 /PRNewswire/ — Direct Digital Holdings, Inc. (Nasdaq: DRCT) (“Direct Digital Holdings” or the “Company”), a leading advertising and marketing technology platform operating through its companies Colossus Media, LLC (“Colossus SSP”), Huddled Masses LLC (“Huddled Masses”) and Orange142, LLC (“Orange142”), today announced financial results for the third quarter ended September 30, 2023.

Mark D. Walker, Chairman and Chief Executive Officer, commented, “In recent quarters, we have made significant investments in our technology stack, advertising platform and operational structure. We initially expected to see the impact of these investments in 2024, however, we are pleased to report that these benefits have arrived much earlier in 2023. Our strong technology partnerships and our overarching business strategy have enabled us to meet a growing number of customers’ demands and further the capabilities of our sell-side technology platform. On both the sell-side and the buy-side, increased spend from our buying partners has resulted in an associated increase in our impression count and organic growth profile with a direct positive impact on net income and adjusted EBITDA(1).”  

Keith Smith, President, added, “The growth seen in this quarter, as well as the past year, has been fueled by a combination of our strategic investments and partnerships, our differentiated approach to advertising solutions, as well as a set of market dynamics which have been highly beneficial to our position in the industry. We have capitalized on the shift in ad spend towards digital media on both the sell- and buy-side and will continue to grow our presence in the space through our recent partnerships and advancements of our technology stack. We remain committed to executing on the same growth and investment initiatives that led us to the strong third quarter results we are reporting today.”

Third Quarter 2023 Business Highlights 

  • For the third quarter ended September 30, 2023, Direct Digital Holdings processed over 400 billion monthly impressions through its sell-side advertising segment, an increase of 220% over the same period of 2022.
  • In addition, the Company’s sell-side advertising platforms received over 34 billion monthly bid responses in the third quarter of 2023, an increase of over 210% over the same period in 2022. Sell-side revenue per advertiser for the third quarter of 2023 increased 241% compared to the same period of 2022.
  • The Company’s buy-side advertising segment served approximately 228 customers in the third quarter of 2023 and buy-side revenue per customer increased 14% compared to the same period of 2022.

Third Quarter 2023 Financial Highlights:

  • Revenue was $59.5 million in the third quarter of 2023, an increase of $33.5 million, or 129% over the $26.0 million in the same period of 2022.


    • Sell-side advertising segment revenue grew to $51.6 million and contributed $32.8 million of the increase, or 174% growth over the $18.9 million of sell-side revenue in the same period of 2022.
    • Buy-side advertising segment revenue grew to $7.9 million and contributed $0.7 million of the increase, or 10% growth over the $7.1 million of buy-side revenue in the same period of 2022.
  • Consolidated operating income in the third quarter of 2023 was $4.5 million compared to consolidated operating income of $1.8 million in the same period of 2022, an increase of 144% year-over-year.
  • Net income was $3.4 million in the third quarter of 2023, compared to net income of $0.8 million in the same period of 2022, an increase of 313% year-over-year.
  • Adjusted EBITDA(1) was $5.4 million in the third quarter of 2023, compared to $2.4 million in the same period of 2022, an increase of 123% year-over-year.

Financial Outlook

Assuming the U.S. economy does not experience any major economic conditions that deteriorate or otherwise significantly reduce advertiser demand, we are increasing our previously issued estimate as disclosed in our second quarter 2023 update:

  • For fiscal year 2023, we expect revenue to be in the range of $170 million to $190 million, or 101% year-over-year growth at the mid-point.

“We are thrilled to announce the raising of our fiscal year 2023 revenue guidance to $180 million at the midpoint, a 101% increase over full-year 2022 results. This increase reflects our belief in our ability to execute on our various growth strategies, demonstrates the strength of our operating leverage and highlights the favorable market trends that we expect to continue for the remainder of this year,” commented Diana Diaz, Chief Financial Officer.  

Conference Call and Webcast Details

Direct Digital will host a conference call on Thursday, November 9, 2023 at 5:00 p.m. Eastern Time to discuss the Company’s third quarter 2023 financial results. The live webcast and replay can be accessed at https://ir.directdigitalholdings.com/. Please access the website at least fifteen minutes prior to the call to register, download and install any necessary audio software. For those who cannot access the webcast, a replay will be available at https://ir.directdigitalholdings.com/ for a period of twelve months.

Footnotes

(1) “Adjusted EBITDA” is a non-GAAP financial measure. The section titled “Non-GAAP Financial Measures” below describes our usage of non-GAAP financial measures and provides reconciliations between historical GAAP and non-GAAP information contained in this press release.

Forward Looking Statements

This press release may contain forward-looking statements within the meaning of federal securities laws, including the Private Securities Litigation Reform Act of 1995, Section 27A of the Securities Act of 1933, as amended, and Section 21E of the Securities Exchange Act of 1934, as amended, and which are subject to certain risks, trends and uncertainties.

As used below, “we,” “us,” and “our” refer to the Company. We use words such as “could,” “would,” “may,” “might,” “will,” “expect,” “likely,” “believe,” “continue,” “anticipate,” “estimate,” “intend,” “plan,” “project” and other similar expressions to identify forward-looking statements, but not all forward-looking statements include these words. All statements contained in this press release that do not relate to matters of historical fact should be considered forward-looking statements.

All of our forward-looking statements involve estimates and uncertainties that could cause actual results to differ materially from those expressed in or implied by the forward-looking statements. Our forward-looking statements are based on assumptions that we have made in light of our industry experience and our perceptions of historical trends, current conditions, expected future developments and other factors we believe are appropriate under the circumstances. Although we believe that these forward-looking statements are based on reasonable assumptions, many factors could affect our actual operating and financial performance and cause our performance to differ materially from the performance expressed in or implied by the forward-looking statements, including, but not limited to: our dependence on the overall demand for advertising, which could be influenced by economic downturns; any slow-down or unanticipated development in the market for programmatic advertising campaigns; the effects of health epidemics; operational and performance issues with our platform, whether real or perceived, including a failure to respond to technological changes or to upgrade our technology systems; any significant inadvertent disclosure or breach of confidential and/or personal information we hold, or of the security of our or our customers’, suppliers’ or other partners’ computer systems; any unavailability or non-performance of the non-proprietary technology, software, products and services that we use; unfavorable publicity and negative public perception about our industry, particularly concerns regarding data privacy and security relating to our industry’s technology and practices, and any perceived failure to comply with laws and industry self-regulation; restrictions on the use of third-party “cookies,” mobile device IDs or other tracking technologies, which could diminish our platform’s effectiveness; any inability to compete in our intensely competitive market; any significant fluctuations caused by our high customer concentration; our limited operating history, which could result in our past results not being indicative of future operating performance; any violation of legal and regulatory requirements or any misconduct by our employees, subcontractors, agents or business partners; any strain on our resources, diversion of our management’s attention or impact on our ability to attract and retain qualified board members as a result of being a public company; our dependence, as a holding company, on receiving distributions from Direct Digital Holdings, LLC to pay our taxes, expenses and dividends; and other factors and assumptions discussed in the “Risk Factors,” “Management’s Discussion and Analysis of Financial Conditions and Results of Operations” and other sections of our filings with the Securities and Exchange Commission that we make from time to time. Should one or more of these risks or uncertainties materialize or should any of these assumptions prove to be incorrect, our actual operating and financial performance may vary in material respects from the performance projected in these forward-looking statements. Further, any forward-looking statement speaks only as of the date on which it is made, and except as required by law, we undertake no obligation to update any forward-looking statement contained in this press release to reflect events or circumstances after the date on which it is made or to reflect the occurrence of anticipated or unanticipated events or circumstances, and we claim the protection of the safe harbor for forward-looking statements contained in the Private Securities Litigation Reform Act of 1995.

About Direct Digital Holdings

Direct Digital Holdings (Nasdaq: DRCT), owner of operating companies Colossus SSP, Huddled Masses, and Orange 142, brings state-of-the-art sell- and buy-side advertising platforms together under one umbrella company. Direct Digital Holdings’ sell-side platform, Colossus SSP, offers advertisers of all sizes extensive reach within general market and multicultural media properties. The Company’s subsidiaries Huddled Masses and Orange142 deliver significant ROI for middle market advertisers by providing data-optimized programmatic solutions at scale for businesses in sectors that range from energy to healthcare to travel to financial services. Direct Digital Holdings’ sell- and buy-side solutions manage on average over 125,000 clients monthly, generating over 300 billion impressions per month across display, CTV, in-app and other media channels. 

CONSOLIDATED BALANCE SHEETS
(unaudited)
September 30, 2023December 31, 2022
ASSETS
CURRENT ASSETS
Cash and cash equivalents$5,481,949$4,047,453
Accounts receivable, net54,637,63426,354,114
Prepaid expenses and other current assets1,426,925883,322
Total current assets61,546,50831,284,889
Property, equipment and software, net of accumulated depreciation and amortization of $219,386
and $34,218, respectively
625,028673,218
Goodwill6,519,6366,519,636
Intangible assets, net12,172,39613,637,759
Deferred tax asset, net5,082,4245,164,776
Operating lease right-of-use assets674,846798,774
Other long-term assets127,49246,987
Total assets$86,748,330$58,126,039
LIABILITIES AND STOCKHOLDERS’ EQUITY
CURRENT LIABILITIES
Accounts payable$45,021,034$17,695,404
Accrued liabilities4,071,1284,777,764
Liability related to tax receivable agreement, current portion41,141182,571
Notes payable, current portion1,146,250655,000
Deferred revenues1,044,069546,710
Operating lease liabilities, current portion49,97791,989
Income taxes payable113,355174,438
Related party payables1,428,0931,448,333
Total current liabilities52,915,04725,572,209
Notes payable, net of short-term portion and deferred financing cost of $1,722,716 and
$2,115,161, respectively
22,323,53422,913,589
Economic Injury Disaster Loan150,000150,000
Liability related to tax receivable agreement, net of current portion4,245,2344,149,619
Operating lease liabilities, net of current portion717,632745,340
Total liabilities80,351,44753,530,757
COMMITMENTS AND CONTINGENCIES (Note 9)
STOCKHOLDERS’ EQUITY
Class A common stock, $0.001 par value per share, 160,000,000 shares authorized, 2,991,792 and
2,900,000 shares issued and outstanding, respectively
2,9922,900
Class B common stock, $0.001 par value per share, 20,000,000 shares authorized, 11,278,000
shares issued and outstanding
11,27811,278
Additional paid-in capital8,782,0928,224,365
Accumulated deficit(2,399,479)(3,643,261)
Total stockholders’ equity6,396,8834,595,282
Total liabilities and stockholders’ equity$86,748,330$58,126,039
CONSOLIDATED STATEMENTS OF OPERATIONS
(unaudited)

For the Three Months EndedFor the Nine Months Ended
September 30, September 30, 
2023202220232022
Revenues
Buy-side advertising$7,850,058$7,130,736$27,092,816$22,283,044
Sell-side advertising51,622,06618,854,63989,006,01836,333,976
Total revenues59,472,12425,985,375116,098,83458,617,020
Cost of revenues
Buy-side advertising3,113,4912,471,17010,650,5417,694,987
Sell-side advertising44,605,81516,053,46177,189,78730,344,670
Total cost of revenues47,719,30618,524,63187,840,32838,039,657
Gross profit11,752,8187,460,74428,258,50620,577,363
Operating expenses
Compensation, taxes and benefits4,747,0813,845,91812,934,4069,895,646
General and administrative2,512,3301,770,0028,717,5845,187,875
Total operating expenses7,259,4115,615,92021,651,99015,083,521
Income from operations4,493,4071,844,8246,606,5165,493,842
Other income (expense)
Other income83,331175,47247,982
Forgiveness of Paycheck Protection Program loan287,143
Loss on redemption of non-participating preferred units(590,689)
Contingent loss on early termination of line of credit(299,770)
Interest expense(1,059,890)(905,605)(3,104,684)(2,269,643)
Total other expense(976,559)(905,605)(3,228,982)(2,525,207)
Income before taxes3,516,848939,2193,377,5342,968,635
Tax expense165,994128,436165,658215,112
Net income$3,350,854$810,783$3,211,876$2,753,523
Net income per common share:
Basic$0.23$0.06$0.23$0.23
Diluted$0.23$0.06$0.22$0.23
Weighted-average number of shares of common stock outstanding:
Basic14,268,16814,178,00014,216,21111,846,601
Diluted14,827,16514,545,24114,817,77011,996,969
CONSOLIDATED STATEMENTS OF CASH FLOWS
(unaudited)

For the Nine Months Ended September 30, 
20232022
Cash Flows Provided By Operating Activities:
Net income$3,211,876$2,753,523
Adjustments to reconcile net income to net cash provided by operating activities:
Amortization of deferred financing costs434,847463,008
Amortization of intangible assets1,465,3631,465,364
Amortization of right-of-use assets123,92894,974
Amortization of capitalized software159,057
Depreciation of property and equipment26,112
Stock-based compensation545,50485,437
Forgiveness of Paycheck Protection Program loan(287,143)
Deferred income taxes82,352(40,591)
Payment on tax receivable agreement(45,815)
Loss on redemption of non-participating preferred units590,689
Contingent loss on early termination of line of credit299,770
Bad debt expense97,7402,717
Changes in operating assets and liabilities:
Accounts receivable(28,381,260)(13,520,067)
Prepaid expenses and other assets(524,098)482,190
Accounts payable27,325,62910,008,327
Accrued liabilities(513,138)1,555,037
Income taxes payable(61,083)94,440
Deferred revenues497,359(201,907)
Operating lease liability(69,720)(75,396)
Related party payable(70,801)
Net cash provided by operating activities4,674,4233,399,801
Cash Flows Used In Investing Activities:
Cash paid for capitalized software and property and equipment(136,978)
Net cash used in investing activities(136,978)
Cash Flows Used In Financing Activities:
Proceeds from note payable4,260,000
Payments on term loan(491,250)(412,500)
Payments of litigation settlement(193,500)
Payments on lines of credit(400,000)
Payment of deferred financing costs(442,181)(525,295)
Proceeds from Issuance of Class A common stock, net of transaction costs11,167,043
Redemption of common units(7,200,000)
Redemption of non-participating preferred units(7,046,251)
Proceeds from options exercised215
Proceeds from warrants exercised12,100
Distributions to members(1,988,333)(916,433)
Net cash used in financing activities(3,102,949)(1,073,436)
Net increase in cash and cash equivalents1,434,4962,326,365
Cash and cash equivalents, beginning of the period4,047,4534,684,431
Cash and cash equivalents, end of the period$5,481,949$7,010,796
Supplemental Disclosure of Cash Flow Information:
Cash paid for taxes$348,862$133,401
Cash paid for interest$2,667,283$1,744,365
Non-cash Financing Activities:
Transaction costs related to issuances of Class A shares included in accrued liabilities$$1,000,000
Outside basis difference in partnership$$3,234,000
Tax receivable agreement payable to Direct Digital Management, LLC$$278,900
Tax benefit on tax receivable agreement$$485,100
Issuance related to vesting of restricted stock units, net of tax withholdings$90$

NON-GAAP FINANCIAL MEASURES

In addition to our results determined in accordance with U.S. generally accepted accounting principles (“GAAP”), including, in particular operating income, net cash provided by operating activities, and net income, we believe that earnings before interest, taxes, depreciation and amortization (“EBITDA”), as adjusted for stock compensation expense, loss on early termination of line of credit, and loss on early extinguishment of debt, and loss on early redemption of non-participating preferred units (“Adjusted EBITDA”), a non-GAAP financial measure, is useful in evaluating our operating performance. The most directly comparable GAAP measure to Adjusted EBITDA is net income (loss).

In addition to operating income and net income, we use Adjusted EBITDA as a measure of operational efficiency. We believe that this non-GAAP financial measure is useful to investors for period-to-period comparisons of our business and in understanding and evaluating our operating results for the following reasons:

  • Adjusted EBITDA is widely used by investors and securities analysts to measure a company’s operating performance without regard to items such as depreciation and amortization, interest expense, provision for income taxes, and certain one-time items such as acquisition transaction costs and gains from settlements or loan forgiveness that can vary substantially from company to company depending upon their financing, capital structures and the method by which assets were acquired;
  • Our management uses Adjusted EBITDA in conjunction with GAAP financial measures for planning purposes, including the preparation of our annual operating budget, as a measure of operating performance and the effectiveness of our business strategies and in communications with our board of directors concerning our financial performance; and
  • Adjusted EBITDA provides consistency and comparability with our past financial performance, facilitates period-to-period comparisons of operations, and also facilitates comparisons with other peer companies, many of which use similar non-GAAP financial measures to supplement their GAAP results.

Our use of this non-GAAP financial measure has limitations as an analytical tool, and you should not consider it in isolation or as a substitute for analysis of our financial results as reported under GAAP. The following table presents a reconciliation of Adjusted EBITDA to net income (loss) for each of the periods presented:

NON-GAAP FINANCIAL METRICS
(unaudited)

For the Three Months Ended September 30, For the Nine Months Ended September 30, 
2023202220232022
Net income$3,350,854$810,783$3,211,876$2,753,523
Add back (deduct):
Interest expense1,059,890905,6053,104,6842,269,643
Amortization of intangible
assets
488,455488,4551,465,3641,465,364
Stock-based compensation241,49170,030545,50485,438
Depreciation and amortization
of capitalized software,
property and equipment
63,689185,169
Contingent loss on early
termination of line of credit
299,770
Tax expense165,994128,436165,658215,112
Forgiveness of PPP loan(287,163)
Loss on early redemption of
non-participating preferred
units
590,689
Adjusted EBITDA$5,370,373$2,403,309$8,978,025$7,092,606

Contacts: 

Investors:
Brett Milotte, ICR
Brett.Milotte@icrinc.com

View original content to download multimedia:https://www.prnewswire.com/news-releases/direct-digital-holdings-reports-third-quarter-2023-financial-results-301983927.html

SOURCE Direct Digital Holdings

Released November 9, 2023

Release – Eledon Pharmaceuticals Reports Third Quarter 2023 Operating and Financial Results

Research News and Market Data on ELDN

November 9, 2023

Reported updated data from ongoing Phase 1b trial further supporting the potential of tegoprubart as a novel kidney transplant immunosuppressive therapy to prevent rejection and better preserve organ function

First participant dosed in Phase 2 BESTOW trial evaluating tegoprubart for the prevention of rejection in kidney transplantation

IRVINE, Calif., Nov. 09, 2023 (GLOBE NEWSWIRE) — Eledon Pharmaceuticals, Inc. (“Eledon”) (NASDAQ: ELDN) today reported its third quarter operating and financial results and reviewed recent business highlights.

“We were thrilled recently to report updated results from our ongoing Phase 1b study that continue to validate tegoprubart’s potential as an immunosuppressive agent that can prevent the rejection of transplanted kidneys,” said David-Alexandre C. Gros, M.D., Chief Executive Officer. “Tegoprubart demonstrated not only the potential to preserve, but also to improve graft function in comparison to the current standard of care treatment. Additionally, during the quarter we initiated our Phase 2 BESTOW trial and had the historic opportunity to support the second ever transplant of a genetically modified heart from a pig to a human. We continue to make significant progress toward our mission of bringing a much-needed, new treatment option to the growing number of patients undergoing kidney transplantation,” Dr. Gros continued.

Recent Corporate Developments

  • Reported data from the ongoing Phase 1b open-label trial evaluating tegoprubart for the prevention of rejection in patients undergoing kidney transplantation at the American Society of Nephrology Kidney Week 2023 Annual Meeting that took place in Philadelphia, PA from November 2-5, 2023. Data from 11 participants demonstrated that tegoprubart successfully prevented kidney transplant rejection and was generally safe and well-tolerated. Aggregate mean eGFR was above 70 mL/min/1.73m2 at all reported time points after day 90 supporting tegoprubart’s potential to protect organ function in patients undergoing kidney transplantation.
  • Announced that tegoprubart was used as a cornerstone component of the chronic immunosuppressive regimen administered following the second-ever transplant of a genetically modified heart from a pig to a human. The procedure was completed on September 20th at University of Maryland Medical Center on a 58-year-old male suffering from heart failure.
  • Dosed the first participant in the Phase 2 BESTOW trial evaluating tegoprubart for the prevention of organ rejection in patients receiving a kidney transplant.
  • Enrolled the first participant in the Phase 2 open-label extension (OLE) study which will evaluate the long-term safety, pharmacokinetics, and efficacy of tegoprubart in participants who have completed one year of treatment in the ongoing Phase 1b study, or the Phase 2 BESTOW study.
  • Announced the publication of results from a study evaluating tegoprubart as an immunomodulatory monotherapy in nonhuman primate kidney and islet allotransplants in Science Translational Medicine. Results from the study showed that treatment with tegoprubart as a monotherapy promoted long-term kidney and islet allograft survival and function in nonhuman primates, indicating its potential as an immunomodulatory agent for organ transplantation.
  • Strengthened leadership team with appointment of Eliezer Katz, M.D., FACS as Chief Medical Officer.
  • Appointed industry veteran James Robinson and renowned transplant surgeon Allan Kirk, M.D., Ph.D., to its Board of Directors.

Upcoming Anticipated 2024 Milestones

  • First Half 2024: Report updated interim clinical data from the ongoing Phase 1b trial of tegoprubart in kidney transplantation.
  • End of 2024: Complete enrollment in the Phase 2 BESTOW trial of tegoprubart in kidney transplantation.

Third Quarter Financial Results

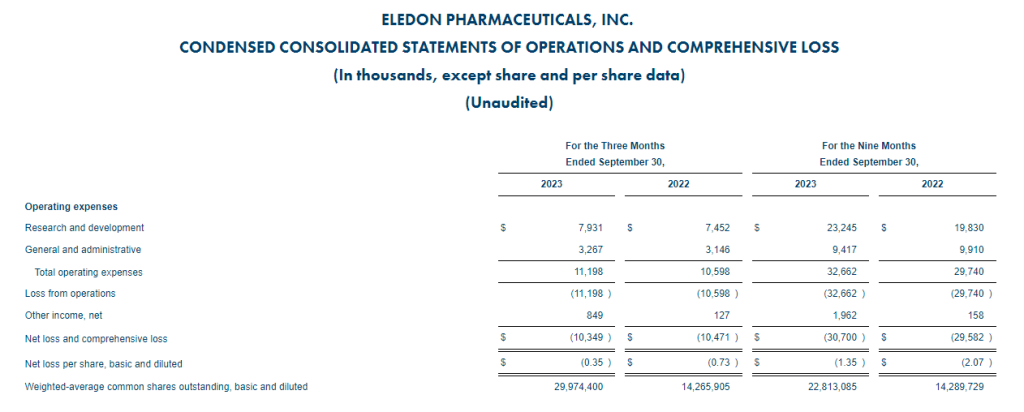
The company reported a net loss of $10.3 million, or $0.35 per share, for the three months ended September 30, 2023, compared to a net loss of $10.5 million, or $0.73 per share, for the same period in 2022.

Research and development expenses were $7.9 million for the three months ended September 30, 2023, compared to $7.5 million for the comparable period in 2022, an increase of $0.4 million. The increase in research and development expenses was primarily driven by an increase in expenses related to the production of clinical trial materials of $0.8 million. The increase was partially offset by a decrease in employee compensation and benefits primarily driven by lower non-cash stock-based compensation expenses and a decrease in clinical development expenses with external contract research organizations.

General and administrative expenses were $3.3 million for the three months ended September 30, 2023, compared to $3.1 million for the comparable period in 2022, a decrease of $0.2 million. The increase in general and administrative expenses was primarily driven by an increase in employee compensation and benefits primarily driven by higher non-cash stock-based compensation expenses.

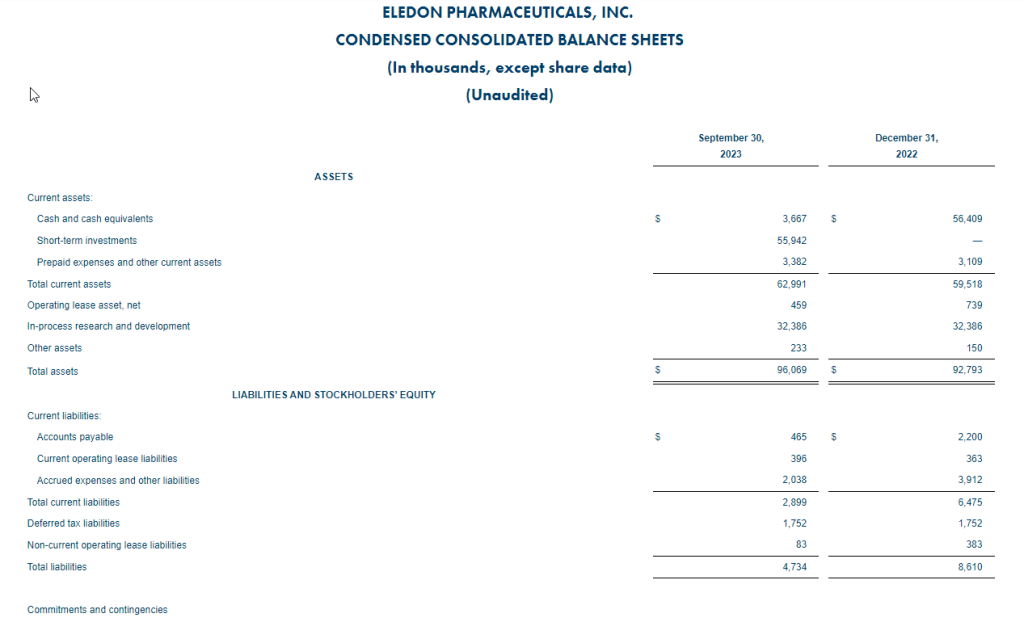
The company had approximately $59.6 million in cash and cash equivalents and short-term investments as of September 30, 2023, compared to $56.4 million in cash and cash equivalents as of December 31, 2022.

About Eledon Pharmaceuticals and tegoprubart

Eledon Pharmaceuticals, Inc. is a clinical stage biotechnology company that is developing immune-modulating therapies for the management and treatment of life-threatening conditions. The Company’s lead investigational product is tegoprubart, an anti-CD40L antibody with high affinity for CD40 Ligand, a well-validated biological target within the costimulatory CD40/CD40L cellular pathway. The central role of CD40L signaling in both adaptive and innate immune cell activation and function positions it as an attractive target for non-lymphocyte depleting, immunomodulatory therapeutic intervention. The Company is building upon a deep historical knowledge of anti-CD40 Ligand biology to conduct preclinical and clinical studies in kidney allograft transplantation, xenotransplantation, and amyotrophic lateral sclerosis (ALS). Eledon is headquartered in Irvine, California. For more information, please visit the Company’s website at www.eledon.com.

Follow Eledon Pharmaceuticals on social media: LinkedInTwitter

Forward-Looking Statements

This press release contains forward-looking statements that involve substantial risks and uncertainties. Any statements about the company’s future expectations, plans and prospects, including statements about planned clinical trials, the development of product candidates, expected timing for initiation of future clinical trials, expected timing for receipt of data from clinical trials, the company’s capital resources and ability to finance planned clinical trials, as well as other statements containing the words “believes,” “anticipates,” “plans,” “expects,” “estimates,” “intends,” “predicts,” “projects,” “targets,” “looks forward,” “could,” “may,” and similar expressions, constitute forward-looking statements within the meaning of the Private Securities Litigation Reform Act of 1995. Forward-looking statements are inherently uncertain and are subject to numerous risks and uncertainties, including: risks relating to the safety and efficacy of our drug candidates; risks relating to clinical development timelines, including interactions with regulators and clinical sides, as well as patient enrollment; risks relating to costs of clinical trials and the sufficiency of the company’s capital resources to fund planned clinical trials; and risks associated with the impact of the ongoing coronavirus pandemic. Actual results may differ materially from those indicated by such forward-looking statements as a result of various factors. These risks and uncertainties, as well as other risks and uncertainties that could cause the company’s actual results to differ significantly from the forward-looking statements contained herein, are discussed in our quarterly 10-Q, annual 10-K, and other filings with the U.S. Securities and Exchange Commission, which can be found at www.sec.gov. Any forward-looking statements contained in this press release speak only as of the date hereof and not of any future date, and the company expressly disclaims any intent to update any forward-looking statements, whether as a result of new information, future events or otherwise.

Investor Contact:

Stephen Jasper
Gilmartin Group
(858) 525 2047
stephen@gilmartinir.com

Media Contact:

Jenna Urban
Berry & Company Public Relations
(212) 253 8881
jurban@berrypr.com

Source: Eledon Pharmaceuticals

Source: Eledon Pharmaceuticals, Inc.

What is Equity Research? Tips for Making Informed Investment Decisions

No matter if you are just starting your investing journey or a seasoned professional, making a sound investment decision is always complex. However, one crucial aspect that can separate successful investors from the rest is equity research.

But, what exactly is equity research, and why is it so vital in the world of investing?

Today, we are going to dive deep into this topic to help you understand how equity research can be leveraged to make more informed investment decisions. By shedding light on this intricate process and providing valuable insights from free equity research reports, you can arm yourself with actionable tips and tools to become a smarter investor.

Understanding Equity Research

Equity research is the detailed analysis and evaluation of companies and their equity securities like common and preferred stocks. The core goal is to develop an informed, unbiased opinion on the financial valuation and future prospects of a public company along with its shares. Equity researchers, often referred to as equity analysts, conduct rigorous financial modeling, ratio analysis and due diligence research to provide actionable investment recommendations and targets.

These comprehensive equity research reports become invaluable resources that help all classes of investors make prudent decisions on which stocks to buy, hold or sell. The reports provide a holistic perspective of a company’s financial health, operations, industry dynamics, and management team. By reviewing equity research reports, investors can better assess the inherent risks and growth opportunities of a potential investment.

For example, research reports incorporate detailed financial projections, valuation models, and investment theses that indicate whether a stock may be undervalued or overpriced. Having access to high-quality equity research from Wall Street analysts can provide individual investors with a distinct edge when selecting stocks to build their portfolios.

What are the different types of equities?

Common Stock – This represents ownership in a company. Common stockholders typically get voting rights and a claim on dividends and corporate earnings after other stakeholders are paid.

Preferred Stock – This represents partial ownership in a company. Preferred shareholders have priority over common stockholders when it comes to claims on assets and earnings. They typically receive regular dividend payments before common shareholders. However, preferred stock usually does not come with voting rights.

Blue Chip Stocks – These are stocks of large, reputable companies with a long history of sound financials and steady dividends. Blue chip stocks are generally considered lower risk. Examples include companies like Johnson & Johnson, Procter & Gamble, and Coca-Cola.

Growth Stocks – These are stocks of companies expected to grow at an above-average rate compared to the broader market. Typical growth stocks trade at higher valuations and reinvest profits into expansion rather than pay dividends. Examples include tech companies like Alphabet, Facebook, and Netflix.

Income Stocks – These stocks regularly pay out higher than average dividends to shareholders. They are ideal for investors seeking regular income. Traditional income stocks include utilities, real estate stocks, and consumer staples companies.

Penny Stocks These are inexpensive stocks that trade for under $5 per share. Penny stocks are generally more volatile and risky since they belong to smaller companies.

Now you may be wondering, who actually conducts all this intensive equity research that gets distilled into reports? Equity research is primarily conducted by financial analysts employed by investment banks, wealth management firms, hedge funds, pension funds, and other institutional investors. These analysts possess deep financial acumen and industry expertise that allows them to build complex financial models and derive reliable stock valuations for public companies.

Top firms like Goldman Sachs, Morgan Stanley and Noble Capital Markets have entire teams of equity analysts covering different sectors, industries, and regions. The lead analyst generally focuses on and specializes in a specific industry they have experience in. For instance, some analysts may focus on just healthcare stocks or technology companies. These specialists leverage their knowledge to provide invaluable insights and analysis.

Why is Equity Research Essential?

Now that we’ve covered the basics of what equity research encompasses, let’s discuss why it is such an indispensable tool for investors:

Identifying Promising Investment Opportunities 

One of the biggest benefits of equity research is it can uncover promising investment opportunities that may be flying under the radar. The due diligence conducted by analysts digs much deeper into a company’s fundamentals to determine if its stock is potentially undervalued relative to its growth prospects. This allows analysts to identify stocks poised for upside that the broader market may be mispricing.

Assessing Downside Risks

While finding hidden gems is great, equity research also evaluates potential downside risks and red flags that may not be apparent to an average investor. This cautionary perspective helps mitigate losses from investments that seem enticing but have underlying issues.

Making Informed Investment Decisions 

Equity research provides a holistic 360-degree perspective of a company that individual investors typically lack. Investors can leverage these comprehensive insights to prudently decide where to deploy their capital and build conviction around investment choices.

Gaining Expert Industry Knowledge

Seasoned equity analysts also provide key insights into industry trends, competitive dynamics, economic cycles and sector outlooks that most retail investors do not possess. Their expertise helps investors make bets in promising high-growth industries primed for secular tailwinds.

Considering these myriad benefits, equity research can aid all types of investors ranging from novice individuals to large institutions. Even professional fund managers at marquee hedge funds and investment banks routinely utilize equity research to inform multi-million dollar investment decisions. Leveraging expert third-party research analysis levels the playing field.

The Equity Research Process

Now that we’ve covered why equity research is so invaluable, let’s explore how analysts actually conduct this complex and meticulous process:

Step 1 – Data Gathering & Financial Analysis

The first step of equity research involves gathering all available data and information on the target company. Analysts will thoroughly study annual reports, SEC filings, earnings calls, conference presentations, industry publications, news articles, economic data, and management commentary to ensure nothing is overlooked.

Next, they dive into analyzing the company’s financial statements and operating metrics using various techniques:

– Building detailed financial models based on historical financials

– Projecting future income statements, balance sheets, and cash flows

– Calculating financial ratios like P/E, EV/EBITDA, PEG, current and quick ratios

– Benchmarking metrics and multiples against peers through comparable company analysis

This rigorous financial analysis focuses on developing an objective understanding of the company’s financial health and performance.

Step 2 – Industry and Competitive Analysis 

Analysts will also conduct in-depth research on the company’s industry, end-markets, competitive landscape and business model. This includes identifying market size, growth trends, industry drivers, pricing dynamics, competitive threats, opportunities, and regulatory issues.

They’ll assess the company’s positioning and advantages versus rivals. The goal is to develop specialized industry expertise and perspective.

Step 3 – Technical Analysis

Equity researchers will analyze the stock’s price patterns, trends, volatility, trading volume and momentum indicators over time to identify optimal entry and exit points. This technical analysis complements the fundamental financial analysis.

Step 4 – Valuation Analysis

Armed with the financial data and industry insights, analysts derive price targets and fair valuation ranges for the stock. Common valuation methodologies include:

– Discounted cash flow (DCF) analysis

– Applying P/E multiples based on industry averages

– Leveraging valuation multiples from past M&A transactions

Each methodology makes certain assumptions that are tested through sensitivity analysis. The end valuations consider both quantitative data and qualitative assessments.

Step 5 – Final Recommendation

Finally, the analyst sums up their buy/sell recommendation and 12-month price target in an equity research report. This final call is based on the upside potential versus downside risks assessed through their rigorous analysis. Top analysts revisit and update their models regularly as new data becomes available.

Tools and Resources for Equity Research

For those looking to leverage equity research, many free resources are available:

Access Free Equity Research Reports

Channelchek is a resource that provide clients with free equity research reports on companies and stocks they cover. New  and seasoned investors should take full advantage of these free resources.  When reviewing equity research, look for reports that exhibit quality and objectivity. Some hallmarks to seek out: impartial analysis not motivated by investment banking relationships, the right balance of quantitative and qualitative insights, data/assumptions from credible sources, and serious financial modeling.

Additonally, resources like Capital IQ allow you to practice modeling, while reading analyst reports from top firms can provide templates to learn from. Investor education sites like Investopedia also have introductory content to develop core competencies.

Register with an account with Channelchek today to get free access to our Equity Research Reports.

Equity research is the fuel that powers informed investing. By properly leveraging analyst insights, both novice and seasoned investors alike can make smarter stock picking decisions. As you embark on your investing journey, be sure to educate yourself on the equity research process and analysis techniques. With quality research in hand, you can invest with conviction and confidence. Check out our free equity research reports to accelerate your investing education today!

Direct Digital Holdings (DRCT) – Demostrates Scaleable Growth


Friday, November 10, 2023

Michael Kupinski, Director of Research, Equity Research Analyst, Digital, Media & Technology , Noble Capital Markets, Inc.

Patrick McCann, CFA, Research Analyst, Noble Capital Markets, Inc.

Refer to the full report for the price target, fundamental analysis, and rating.

Impressive results. The company posted revenue of $59.5 million and adj. EBITDA of $5.4 million, both well above our expectations. Revenues accelerated sequentially, up 125.5% in the latest quarter, up from 66.5% in Q2. Notably, Sell-side revenue grew a whopping 174% over the prior year period.

Investments paying off. In our view, the especially strong quarter indicates that the company’s growth investments and tech platform are paying off sooner than expected. Importantly, the Sell-side segment processed 400 billion monthly impressions, due to increased capacity.


Get the Full Report

Equity Research is available at no cost to Registered users of Channelchek. Not a Member? Click ‘Join’ to join the Channelchek Community. There is no cost to register, and we never collect credit card information.

This Company Sponsored Research is provided by Noble Capital Markets, Inc., a FINRA and S.E.C. registered broker-dealer (B/D).

*Analyst certification and important disclosures included in the full report. NOTE: investment decisions should not be based upon the content of this research summary. Proper due diligence is required before making any investment decision. 

Townsquare Media (TSQ) – Sum Of The Parts Support Significant Upside Potential


Friday, November 10, 2023

Townsquare is a community-focused digital media and digital marketing solutions company with market leading local radio stations, principally focused outside the top 50 markets in the U.S. Our assets include a subscription digital marketing services business, Townsquare Interactive, providing website design, creation and hosting, search engine optimization, social media and online reputation management as well as other digital monthly services for approximately 26,800 SMBs; a robust digital advertising division, Townsquare IGNITE, a powerful combination of a) an owned and operated portfolio of more than 330 local news and entertainment websites and mobile apps along with a network of leading national music and entertainment brands, collecting valuable first party data, and b) a proprietary digital programmatic advertising technology stack with an in-house demand and data management platform; and a portfolio of 321 local terrestrial radio stations in 67 U.S. markets strategically situated outside the Top 50 markets in the United States. Our portfolio includes local media brands such as WYRK.com, WJON.com, and NJ101.5.com and premier national music brands such as XXLmag.com, TasteofCountry.com, UltimateClassicRock.com and Loudwire.com.

Michael Kupinski, Director of Research, Equity Research Analyst, Digital, Media & Technology , Noble Capital Markets, Inc.

Jacob Mutchler, Research Associate, Noble Capital Markets, Inc.

Refer to the full report for the price target, fundamental analysis, and rating.

In line quarter.  The company reported Q3 revenue of $115.1 million and adj. EBITDA of $27.2 million, both of which were in line with our estimates. Notably, digital advertising revenue grew a solid 5.5% from the prior year period, in spite of net revenue decreasing 3.8% over the same period. Digital revenues accounted for 52% of total revenue in Q3, a development we view favorably.

Q4 outlook on target. We are modestly lowering our Q4 revenue forecast in light of softer than expected Q4 pacings. Q4 total revenue is lowered from $116.3 million to $111.3 million. Notably, our Q4 and full year 2023 adj. EBITDA forecasts of approximately $24.9 million and $100.1 million, respectively, are largely unchanged due to direct operating expense reductions.


Get the Full Report

Equity Research is available at no cost to Registered users of Channelchek. Not a Member? Click ‘Join’ to join the Channelchek Community. There is no cost to register, and we never collect credit card information.

This Company Sponsored Research is provided by Noble Capital Markets, Inc., a FINRA and S.E.C. registered broker-dealer (B/D).

*Analyst certification and important disclosures included in the full report. NOTE: investment decisions should not be based upon the content of this research summary. Proper due diligence is required before making any investment decision. 

The ODP Corporation (ODP) – Third Quarter 2023 – Solid Operating Results


Friday, November 10, 2023

Office Depot, Inc., together with its subsidiaries, supplies a range of office products and services. It offers merchandise, such as general office supplies, computer supplies, business machines and related supplies, and office furniture through its chain of office supply stores under the Office Depot, Foray, Ativa, Break Escapes, Worklife, and Christopher Lowell brand names. The company also provides graphic design, printing, reproduction, mailing, shipping, and other services through design, print, and ship centers. It has operations throughout North America, Europe, Asia, and Central America. The company also sells its products and services through direct mail catalogs, contract sales force, Internet sites, and retail stores, through a mix of company-owned operations, joint ventures, licensing and franchise agreements, alliances, and other arrangements. As of December 31, 2008, Office Depot operated 1,267 North American retail division office supply stores and 162 international division retail stores, as well as participated under licensing and merchandise arrangements in 98 stores. The company was founded in 1986 and is based in Boca Raton, Florida.

Joe Gomes, Managing Director, Equity Research Analyst, Generalist , Noble Capital Markets, Inc.

Joshua Zoepfel, Research Associate, Noble Capital Markets, Inc.

Refer to the full report for the price target, fundamental analysis, and rating.

3Q23 Results. Revenue came in at $2.009 billion, down from $2.172 billion in 3Q22, driven by store closures, lower comparable sales, and a challenging economic environment. Adjusted net income was flat at $73 million, while adjusted EPS rose to $1.88 from $1.48 as a result of the reduction in outstanding shares. Adjusted EBITDA was $125 million, compared to $131 million last year.

Strategy Is Working. ODP delivered solid operating results in spite of the challenging economic environment, with strong adjusted EPS and adjusted free cash flow. Adjusted FCF in the quarter was $89 million. The Company’s low cost operating model continues to deliver.


Get the Full Report

Equity Research is available at no cost to Registered users of Channelchek. Not a Member? Click ‘Join’ to join the Channelchek Community. There is no cost to register, and we never collect credit card information.

This Company Sponsored Research is provided by Noble Capital Markets, Inc., a FINRA and S.E.C. registered broker-dealer (B/D).

*Analyst certification and important disclosures included in the full report. NOTE: investment decisions should not be based upon the content of this research summary. Proper due diligence is required before making any investment decision. 

PDS Biotechnology Corp. (PDSB) – Triple Therapy Data Shows Benefits That Far Exceed Published Studies


Friday, November 10, 2023

PDS Biotech is a clinical-stage immunotherapy company developing a growing pipeline of molecularly targeted cancer and infectious disease immunotherapies based on the Company’s proprietary Versamune® and Infectimune™ T-cell activating technology platforms. Our Versamune®-based products have demonstrated the potential to overcome the limitations of current immunotherapy by inducing in vivo, large quantities of high-quality, highly potent polyfunctional tumor specific CD4+ helper and CD8+ killer T-cells. PDS Biotech has developed multiple therapies, based on combinations of Versamune® and disease-specific antigens, designed to train the immune system to better recognize diseased cells and effectively attack and destroy them. The Company’s pipeline products address various cancers including HPV16-associated cancers (anal, cervical, head and neck, penile, vaginal, vulvar) and breast, colon, lung, prostate and ovarian cancers.

Robert LeBoyer, Senior Vice President, Equity Research Analyst, Biotechnology, Noble Capital Markets, Inc.

Refer to the full report for the price target, fundamental analysis, and rating.

Triple Therapy Trial Results Show Much Longer Survival In HPV-Positive Cancer. PDS announced data from the Triple Therapy Combination conducted by the NCI (National Cancer Institute of the National Institutes of Health). This trial tested the combination of PDS0101, the tumor-targeted IL-12 derivative PDS0301, and a checkpoint inhibitor to give three mechanisms of action against HPV-positive cancers. While the patient sample is small, these results far exceed survival seen in published studies.

Results Shows Significant Improvements Over Expectations. Final survival data from the patients that had no previous therapy with immune checkpoint inhibitors (ICI naïve patients) showed 6 out of 8 (75%) of the patients alive at 36 months, compared with published studies with about 30% to 50% alive at 12 months and less than 30% alive at 24 months. Median overall survival for the ICI naïve patients has not been reached. 


Get the Full Report

Equity Research is available at no cost to Registered users of Channelchek. Not a Member? Click ‘Join’ to join the Channelchek Community. There is no cost to register, and we never collect credit card information.

This Company Sponsored Research is provided by Noble Capital Markets, Inc., a FINRA and S.E.C. registered broker-dealer (B/D).

*Analyst certification and important disclosures included in the full report. NOTE: investment decisions should not be based upon the content of this research summary. Proper due diligence is required before making any investment decision. 

Ocugen (OCGN) – 3Q23 Reported With Several Products On Schedule To Reach Clinical Milestones In 2024


Friday, November 10, 2023

Ocugen, Inc. is a biotechnology company focused on developing and commercializing novel gene therapies, biologicals, and vaccines. The lead product in its gene therapy program, OCU400, is in Phase 1/2 clinical trials for retinitis pigmentosa.

Robert LeBoyer, Senior Vice President, Equity Research Analyst, Biotechnology, Noble Capital Markets, Inc.

Refer to the full report for the price target, fundamental analysis, and rating.

Pipeline Is Set For 2024. Ocugen reported 3Q23 loss of $14.2 million or $(0.06) per share, compared with our estimated loss of $18.2 million or $(0.07) per share. Cash balance at the end of the quarter was $53.5 million. During 3Q23, data was presented for OCU400, INDs were approved for OCU410 and OCU410ST, and OCU500 was selected by the NIAID-NIH (National Allergy and Infectious Disease Institute of the National Institutes of Health) to begin clinical testing. NeoCart is also expected to begin a Phase 3 trial in 2H24. We see these pipeline events as important milestones for the company. 

OCU400 is on schedule to finalize the Phase 3 trial design. The Phase 1/2 trial has completed dosing of the RP patients and three LCA patients. The treatment protocols for the Phase 3 trial are expected to be finalized by year-end. Following FDA acceptance, the Phase 3 trial is expected to begin in early 2024 as expected. The final LCA patient data could allow FDA approval to include LCA patients in 2H24.


Get the Full Report

Equity Research is available at no cost to Registered users of Channelchek. Not a Member? Click ‘Join’ to join the Channelchek Community. There is no cost to register, and we never collect credit card information.

This Company Sponsored Research is provided by Noble Capital Markets, Inc., a FINRA and S.E.C. registered broker-dealer (B/D).

*Analyst certification and important disclosures included in the full report. NOTE: investment decisions should not be based upon the content of this research summary. Proper due diligence is required before making any investment decision. 

InPlay Oil (IPOOF) – September-quarter results


Friday, November 10, 2023

InPlay Oil is a junior oil and gas exploration and production company with operations in Alberta focused on light oil production. The company operates long-lived, low-decline properties with drilling development and enhanced oil recovery potential as well as undeveloped lands with exploration possibilities. The common shares of InPlay trade on the Toronto Stock Exchange under the symbol IPO and the OTCQX Exchange under the symbol IPOOF.

Michael Heim, Senior Vice President, Equity Research Analyst, Energy & Transportation, Noble Capital Markets, Inc.

Refer to the full report for the price target, fundamental analysis, and rating.

Production increased 6% quarter over quarter despite continued curtailments and unplanned downtime. Curtailments and well pressure issues have hampered production for InPlay and other Canadian producers in recent quarters. InPlay invested $27.5 million during the quarter to drill and make infrastructure improvements. This represents more than half of the year’s capital expenditure budget. During the quarter, the company completed six wells and upgraded a natural gas facility to process 66% more gas.

InPlay reported strong results in the 2023-3Q and 2023-4Q should be better. Management indicated that its investments should lead to the fourth quarter being the highest production quarter of the year. Management did not make any changes to its guidance for 2023, 2024, and 2025 production and fund flow generation. With a drop in capital expenditures in the upcoming quarter, management should  have ample cash flow to pay dividends (7% yield), strategically repurchase shares, and explore small add-on acquisitions.


Get the Full Report

Equity Research is available at no cost to Registered users of Channelchek. Not a Member? Click ‘Join’ to join the Channelchek Community. There is no cost to register, and we never collect credit card information.

This Company Sponsored Research is provided by Noble Capital Markets, Inc., a FINRA and S.E.C. registered broker-dealer (B/D).

*Analyst certification and important disclosures included in the full report. NOTE: investment decisions should not be based upon the content of this research summary. Proper due diligence is required before making any investment decision. 

Haynes International (HAYN) – Refining 2023 Estimates


Friday, November 10, 2023

Haynes International, Inc. is a leading developer, manufacturer and marketer of technologically advanced, nickel and cobalt-based high-performance alloys, primarily for use in the aerospace, industrial gas turbine and chemical processing industries.

Mark Reichman, Managing Director, Equity Research Analyst, Natural Resources, Noble Capital Markets, Inc.

Refer to the full report for the price target, fundamental analysis, and rating.

Updating estimates. We have trimmed our fiscal year 2023 EBITDA and EPS estimates to $80.6 million and $3.22 from $81.2 million and $3.25 per share. Our estimates reflect lower gross margins during the September quarter due to the negative impact of raw material fluctuations. Our September EBITDA and EPS estimates were lowered to $23.2 million and $0.97 from $23.7 million and $1.00. We are making no changes to our 2024 estimates and expect Haynes to provide guidance for fiscal 2024 when it reports results for fiscal year 2023. We still expect the September quarter will be Haynes’ strongest of the fiscal year in terms of volumes shipped, net revenues, and earnings.

Strong order backlog. Orders during the June quarter resulted in a record backlog of $468.1 million and represented a 4.8% increase compared to the prior quarter and a 38.4% increase on a year-over-year basis. Backlog pounds increased 3.2% during the third quarter to approximately 14.6 million pounds and increased 20.7% compared to the prior year period driven by strong demand in the aerospace and industrial gas turbine markets. In our view, the strong order book is indicative of the company’s strong competitive position and favorable outlook.


Get the Full Report

Equity Research is available at no cost to Registered users of Channelchek. Not a Member? Click ‘Join’ to join the Channelchek Community. There is no cost to register, and we never collect credit card information.

This Company Sponsored Research is provided by Noble Capital Markets, Inc., a FINRA and S.E.C. registered broker-dealer (B/D).

*Analyst certification and important disclosures included in the full report. NOTE: investment decisions should not be based upon the content of this research summary. Proper due diligence is required before making any investment decision. 

Harte Hanks (HHS) – Building Blocks For Enhanced Growth


Friday, November 10, 2023

Harte Hanks (NASDAQ: HHS) is a leading global customer experience company whose mission is to partner with clients to provide them with CX strategy, data-driven analytics and actionable insights combined with seamless program execution to better understand, attract, and engage their customers. Using its unparalleled resources and award-winning talent in the areas of Customer Care, Fulfillment and Logistics, and Marketing Services, Harte Hanks has a proven track record of driving results for some of the world’s premier brands including Bank of America, GlaxoSmithKline, Unilever, Pfizer, HBOMax, Volvo, Ford, FedEx, Midea, Sony, and IBM among others. Headquartered in Chelmsford, Massachusetts , Harte Hanks has over 2,500 employees in offices across the Americas, Europe and Asia Pacific .

Michael Kupinski, Director of Research, Equity Research Analyst, Digital, Media & Technology , Noble Capital Markets, Inc.

Jacob Mutchler, Research Associate, Noble Capital Markets, Inc.

Refer to the full report for the price target, fundamental analysis, and rating.

Q3 results largely in line. Total company revenue weas $47.1 million, in line with our $47.5 million estimate. Total company revenues were essentially flat with Q2 revenue of $47.8 million, which the company views as its baseline quarter. Q3 adj. EBITDA was $4.2 million, a few hundred thousand shy of our $4.8 million adj. EBITDA estimate.

Investing to accelerate growth. We believe that management is putting the pieces together to enhance the company’s long term revenue and adj. EBITDA growth. It has embarked on a strategy to add sales staff and drive efficiencies company wide. We believe that this strategy will pay dividends beginning in the second half 2024, but notably in 2025 as revenues ramp and margins improve. 


Get the Full Report

Equity Research is available at no cost to Registered users of Channelchek. Not a Member? Click ‘Join’ to join the Channelchek Community. There is no cost to register, and we never collect credit card information.

This Company Sponsored Research is provided by Noble Capital Markets, Inc., a FINRA and S.E.C. registered broker-dealer (B/D).

*Analyst certification and important disclosures included in the full report. NOTE: investment decisions should not be based upon the content of this research summary. Proper due diligence is required before making any investment decision. 

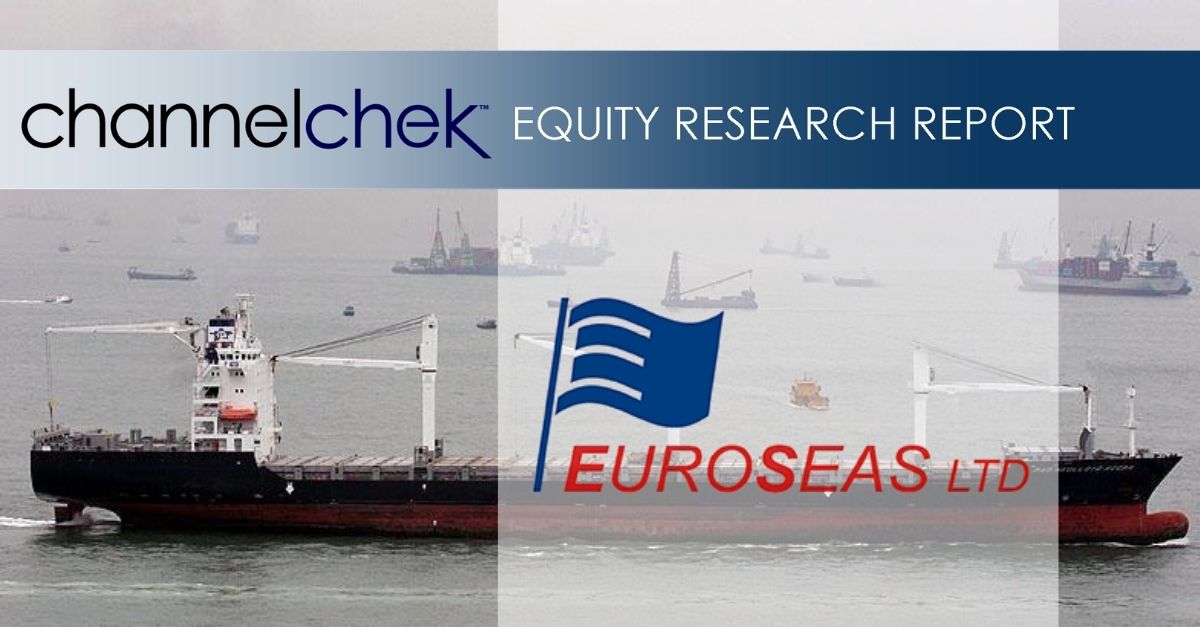
Euroseas (ESEA) – Euroseas reports strong earnings bucking a trend in the shipping industry


Friday, November 10, 2023

Euroseas Ltd. was formed on May 5, 2005 under the laws of the Republic of the Marshall Islands to consolidate the ship owning interests of the Pittas family of Athens, Greece, which has been in the shipping business over the past 140 years. Euroseas trades on the NASDAQ Capital Market under the ticker ESEA. Euroseas operates in the container shipping market. Euroseas’ operations are managed by Eurobulk Ltd., an ISO 9001:2008 and ISO 14001:2004 certified affiliated ship management company, which is responsible for the day-to-day commercial and technical management and operations of the vessels. Euroseas employs its vessels on spot and period charters and through pool arrangements.

Michael Heim, Senior Vice President, Equity Research Analyst, Energy & Transportation, Noble Capital Markets, Inc.

Refer to the full report for the price target, fundamental analysis, and rating.

Euroseas reported strong 2023-3Q results due to fleet expansion and better-than-expected shipping rates. Euroseas’ average TCE rate of $30,074 was similar to last year and last quarter. Euroseas’ strategy of locking in rates for the next 12-24 months has allowed it to escape the decline in shipping rates that is hurting other shipping companies. Euroseas continues to command a premium shipping rate due to the modernization of its fleet and size of ships. 

Costs inched higher due to fleet expansion. One exception is drydocking expense, which decreased with no ships in drydock during the quarter as compared to two ships in drydock at this time last year. Note that this quarter includes a $14 million impairment charge and a $16 million gain on the termination of a charter. Absent these two non-recurring items, operating costs would have been near expectations.


Get the Full Report

Equity Research is available at no cost to Registered users of Channelchek. Not a Member? Click ‘Join’ to join the Channelchek Community. There is no cost to register, and we never collect credit card information.

This Research is provided by Noble Capital Markets, Inc., a FINRA and S.E.C. registered broker-dealer (B/D).

*Analyst certification and important disclosures included in the full report. NOTE: investment decisions should not be based upon the content of this research summary. Proper due diligence is required before making any investment decision. 

Eledon Pharmaceuticals (ELDN) – 3Q23 Reported With Review Of Clinical Progress


Friday, November 10, 2023

Robert LeBoyer, Senior Vice President, Equity Research Analyst, Biotechnology, Noble Capital Markets, Inc.

Refer to the full report for the price target, fundamental analysis, and rating.

3Q23 Loss Was Less Than Projected. Eledon reported 3Q23 loss of $10.3 million or ($0.35) per share, compared with our estimate of a loss of $14.5 million or $(0.57) per share. The difference was mostly due to R&D expense of $7.9 million compared with our estimate of $11.9 million. Cash and equivalents at the end of the quarter were $59.6 million.

Phase 1b Data Shows Protection and Strong Function. As discussed in our Research Note on November 3, data from the Phase 1b trial testing tegoprubart in prevention of renal transplant rejection was presented at the American Society of Nephrology Kidney Week. The data from 11 patients showed tegoprubart was safe, well-tolerated, and had no rejection. Importantly, all of the patients that were evaluated at least 90 days after transplantation had eGFR (estimated glomerular filtration rate) above 70 ml/min/1.72 m2. This is above 50th percentile of 50 ml/min/1.72 m2 average in published studies, and is a strong predicator of graft survival. One patient who completed the 1-year treatment period had a eGFR of 91 ml/min/1.72 m2 and went into the open-label extension study.


Get the Full Report

Equity Research is available at no cost to Registered users of Channelchek. Not a Member? Click ‘Join’ to join the Channelchek Community. There is no cost to register, and we never collect credit card information.

This Company Sponsored Research is provided by Noble Capital Markets, Inc., a FINRA and S.E.C. registered broker-dealer (B/D).

*Analyst certification and important disclosures included in the full report. NOTE: investment decisions should not be based upon the content of this research summary. Proper due diligence is required before making any investment decision.