DALLAS, Oct. 18, 2022 (GLOBE NEWSWIRE) — Permex Petroleum Corporation (CSE: OIL) (OTCQB: OILCF) (FSE: 75P) (“Permex” or the “Company“), a junior oil and gas company, will be participating in The ThinkEquity Conference, which will take place on October 26, 2022 at The Mandarin Oriental Hotel in New York.
Mehran Ehsan, President and CEO, will be presenting at 12:00 PM ET on October 26th. Interested parties can register to attend here. Members of the Permex Petroleum Corporation management will also be holding one-on-one investor meetings throughout the day.
About Permex Petroleum Corporation
Permex Petroleum is a uniquely positioned junior Oil & Gas company with assets and operations across the Permian Basin of West Texas and the Delaware Sub-Basin of New Mexico. The company focuses on combining its low-cost development of Held by Production assets (“HBP”) for sustainable growth with its current and future Blue-Sky projects for scale growth. The company through its wholly owned subsidiary Permex Petroleum US Corporation is a licensed operator in both states; and owns and operates on Private, State and Federal land.
About The ThinkEquity Conference
The ThinkEquity Conference will gather industry insiders, investors and leading executives from around the world on October 26th in New York. Attendees can expect a full day of company presentations, panel discussions, one-on-one investor meetings and more.
Featured sectors include AI/Big data technology, Biotechnology, EV/EV Infrastructure, Metals & Mining and Oil & Gas.
To register to attend The ThinkEquity Conference, please follow this link.
CONTACT INFORMATION Permex Petroleum Corporation Mehran Ehsan President, Chief Executive Officer & Director 469-804-1306
Greg Montgomery CFO, Corporate Secretary & Director 469-804-1306
Or for Investor Relations, please contact: Dave Gentry RedChip Companies Inc. +1-800-RED-CHIP (733-2447) Or +1 407-491-4498 OILCF@redchip.com
CAUTIONARY DISCLAIMER STATEMENT:
The Canadian Securities Exchange has neither approved nor disapproved the contents of this press release.
Forward-Looking Statements
This news release includes certain statements and information that may constitute forward-looking information within the meaning of applicable Canadian securities laws. Forward-looking statements relate to future events or future performance and reflect the expectations or beliefs of management of the Company regarding future events. Generally, forward-looking statements and information can be identified by the use of forward-looking terminology such as “intends”, “expects” or “anticipates”, or variations of such words and phrases or statements that certain actions, events or results “may”, “could”, “should”, “would” or will “potentially” or “likely” occur. This information and these statements, referred to herein as “forward‐looking statements”, are not historical facts, are made as of the date of this news release and include without limitation, statements regarding Permex’s expectations of entering into a growth phase in relation to its business and drilling programs; the market opportunity in the oil and gas industry; Permex’s future plans to bring additional shut-in wells online, and the deployment of the Company’s capital.
In addition, forward-looking statements or information are based on a number of material factors, expectations or assumptions of Permex which have been used to develop such statements and information but which may prove to be incorrect. Although Permex believes that the expectations reflected in such forward-looking statements or information are reasonable, undue reliance should not be placed on forward-looking statements because Permex can give no assurance that such expectations will prove to be correct. In addition to other factors and assumptions which may be identified herein, assumptions have been made regarding, among other things: that Permex will continue to conduct its operations in a manner consistent with past operations; continued performance from existing wells; the continued and timely development of infrastructure in areas of new production; the accuracy of the estimates of Permex’s reserve volumes; certain commodity price and other cost assumptions; continued availability of debt and equity financing and cash flow to fund Permex’s current and future plans and expenditures; the impact of increasing competition; the general stability of the economic and political environment in which Permex operates; the general continuance of current industry conditions; the timely receipt of any required regulatory approvals; the ability of Permex to obtain qualified staff, equipment and services in a timely and cost efficient manner; the ability of Permex to obtain financing on acceptable terms; field production rates and decline rates; the ability to replace and expand oil and natural gas reserves through acquisition, development and exploration; future commodity prices; currency, exchange and interest rates; regulatory framework regarding royalties, taxes and environmental matters in the jurisdictions in which Permex operates; and the ability of Permex to successfully market its oil and natural gas products.
Although management of the Company has attempted to identify important factors that could cause actual results to differ materially from those contained in forward-looking statements or forward-looking information, there may be other factors that cause results not to be as anticipated, estimated or intended. There can be no assurance that such statements will prove to be accurate, as actual results and future events could differ materially from those anticipated in such statements. Accordingly, readers should not place undue reliance on forward-looking statements and information. Readers are cautioned that reliance on such information may not be appropriate for other purposes. The Company does not undertake to update any forward-looking statement, forward-looking information or financial outlook that are incorporated by reference herein, except in accordance with applicable securities laws. We seek safe harbor.
TORONTO–(BUSINESS WIRE)– Sierra Metals Inc. (TSX: SMT) (NYSE American: SMTS) (BVL or Bolsa de Valores de Lima: SMT) (“Sierra Metals” or the “Company”) announced today that a special committee comprised of its independent directors (the “Special Committee”) has initiated a process to evaluate and consider the Company’s current financial and liquidity position, operational challenges and possible financing and restructuring alternatives that may be available to the Company.
Financial and Operational Matters
The Company faces liquidity challenges as a result of the recent previously announced suspension of operations at the Yauricocha Mine and operating losses and negative cash flows that have accumulated, primarily from the Bolivar and Cusi operations.
While mining operations have re-commenced at areas of the Yauricocha Mine, a majority of the operation remains suspended at this time. A precise timeline for achieving full plant throughput has not yet been established.
Absent additional support and increased funding, the Company’s ability to continue operations in the ordinary course may be impacted. The Company is monitoring and actively managing its capital to preserve liquidity to support operations and will continue to consult with its financial and other stakeholders.
The Company reiterates that the safety and wellbeing of its employees and contractors remains of utmost importance.
Special Committee
The Special Committee includes all non-management members of the board of directors of the Company. The mandate of the Special Committee includes exploring, reviewing and considering options to optimize the operations of the Company and financing, restructuring and strategic options in the best interests of the Company. The Special Committee has a particular focus on liquidity, near term financing and cash conservation options.
Financial and legal advisors with particular expertise in turnaround and restructuring matters have been engaged to advise on this process.
It is the Company’s current intention to not disclose developments with respect to the Special Committee process unless and until the board of directors of Sierra Metals has approved a specific transaction or material steps or otherwise determines that disclosure is necessary.
The Company cautions that there are no assurances or guarantees of the results of the Special Committee review process, management’s efforts to improve the current situation or the impact that the process and such efforts will have on the Company’s financial and liquidity position or its operations. The Company has not set a definitive schedule to complete the evaluation.
About Sierra Metals
Sierra Metals is a diversified Canadian mining company with Green Metal exposure including copper production and base metal production with precious metals byproduct credits, focused on the production and development of its Yauricocha Mine in Peru, and Bolivar and Cusi Mines in Mexico. The Company is focused on increasing production volume and growing mineral resources. The Company has large land packages at all three mines with several prospective regional targets providing longer- term exploration upside and mineral resource growth potential.
The Company’s common shares trade on the Bolsa de Valores de Lima and on the Toronto Stock Exchange under the symbol “SMT” and on the NYSE American Exchange under the symbol “SMTS”.
For further information regarding Sierra Metals, please visit www.sierrametals.com.
This press release contains forward-looking information within the meaning of Canadian and United States securities legislation, including statements with respect to the ability of the Company to continue operations in the ordinary course. Forward-looking information relates to future events or the anticipated performance of Sierra Metals and reflect management’s expectations or beliefs regarding such future events and anticipated performance based on an assumed set of economic conditions and courses of action. In certain cases, statements that contain forward-looking information can be identified by the use of words such as “plans”, “expects”, “is expected”, “budget”, “scheduled”, “estimates”, “forecasts”, “intends”, “anticipates”, “believes” or variations of such words and phrases or statements that certain actions, events or results “may”, “could”, “would”, “might”, or “will be taken”, “occur” or “be achieved” or the negative of these words or comparable terminology. The Company has made certain assumptions regarding, among other things: the strategic alternatives that may be available to it. By its very nature forward-looking information involves known and unknown risks, uncertainties and other factors that may cause actual performance of Sierra Metals to be materially different from any anticipated performance expressed or implied by such forward-looking information. Forward-looking information is subject to a variety of risks and uncertainties, which could cause actual events or results to differ from those reflected in the forward-looking information, including, without limitation, the risks described under the heading “Risk Factors” in the Company’s annual information form dated March 16, 2022 for its fiscal year ended December 31, 2021 and other risks identified in the Company’s filings with Canadian securities regulators and the United States Securities and Exchange Commission, which filings are available at www.sedar.com and www.sec.gov, respectively. The risk factors referred to above are not an exhaustive list of the factors that may affect any of the Company’s forward-looking information. Forward-looking information includes statements about the future and is inherently uncertain, and the Company’s actual achievements or other future events or conditions may differ materially from those reflected in the forward-looking information due to a variety of risks, uncertainties and other factors. The Company’s statements containing forward-looking information are based on the beliefs, expectations, and opinions of management on the date the statements are made, and the Company does not assume any obligation to update such forward-looking information if circumstances or management’s beliefs, expectations or opinions should change, other than as required by applicable law. For the reasons set forth above, one should not place undue reliance on forward-looking information.
Blackboxstocks, Inc. is a financial technology and social media hybrid platform offering real-time proprietary analytics and news for stock and options traders of all levels. Our web-based software employs “predictive technology” enhanced by artificial intelligence to find volatility and unusual market activity that may result in the rapid change in the price of a stock or option. Blackbox continuously scans the NASDAQ, New York Stock Exchange, CBOE, and all other options markets, analyzing over 10,000 stocks and up to 1,500,000 options contracts multiple times per second. We provide our users with a fully interactive social media platform that is integrated into our dashboard, enabling our users to exchange information and ideas quickly and efficiently through a common network. We recently introduced a live audio/video feature that allows our members to broadcast on their own channels to share trade strategies and market insight within the Blackbox community. Blackbox is a SaaS company with a growing base of users that spans 42 countries; current subscription fees are $99.97 per month or $959.00 annually. For more information, go to: www.blackboxstocks.com .
Joe Gomes, Senior Research Analyst, Noble Capital Markets, Inc.
Joshua Zoepfel, Research Associate, Noble Capital Markets, Inc.
Refer to the full report for the price target, fundamental analysis, and rating.
3Q22 Revenue Guidance. Late last week Blackboxstocks management announced that revenue for the third quarter, ended September 30, 2022, will be between $1.15 million and $1.25 million, which is below the $1.4 million of revenue reported in the second quarter of 2022 and would be the lowest level of reported revenue in over seven quarters.
Poor Stock Market Performance. The poor performance of the overall stock market over an extended period has impacted new customer acquisition as retail traders have become increasingly hesitant to enter the markets. However, with the new products scheduled to be released in 2023 in Stock Nanny and the Pro version of the Company’s product, we believe the products will expand on the Company’s TAM while also regaining its lost subscriber momentum.
This Company Sponsored Research is provided by Noble Capital Markets, Inc., a FINRA and S.E.C. registered broker-dealer (B/D).
*Analyst certification and important disclosures included in the full report. NOTE: investment decisions should not be based upon the content of this research summary. Proper due diligence is required before making any investment decision.
Mark Reichman, Senior Research Analyst, Natural Resources, Noble Capital Markets, Inc.
Refer to the full report for the price target, fundamental analysis, and rating.
Exploration potential may be greater than previously thought. Relogging of drill core, along with the integration of geophysics and geochemistry from the Tiria-Shimpia target, revealed the presence of three structural grabens in the middle of Aurania’s concession block in Ecuador. Grabens are bordered by parallel faults. The identification of grabens is significant given that their faults are often conduits for hydrothermal fluids and have significant potential to host mineralization.
Long and wide. The north graben is 10 kilometers long and 3.5 kilometers wide, while the central graben is 26 kilometers long and 3 kilometers wide. The south graben is 18 kilometers long and 5 kilometers wide.
This Company Sponsored Research is provided by Noble Capital Markets, Inc., a FINRA and S.E.C. registered broker-dealer (B/D).
*Analyst certification and important disclosures included in the full report. NOTE: investment decisions should not be based upon the content of this research summary. Proper due diligence is required before making any investment decision.
Defense Metals Corp. is a mineral exploration and development company focused on the acquisition, exploration and development of mineral deposits containing metals and elements commonly used in the electric power market, defense industry, national security sector and in the production of green energy technologies, such as, rare earths magnets used in wind turbines and in permanent magnet motors for electric vehicles. Defense Metals owns 100% of the Wicheeda Rare Earth Element Property located near Prince George, British Columbia, Canada. Defense Metals Corp. trades in Canada under the symbol “DEFN” on the TSX Venture Exchange, in the United States, under “DFMTF” on the OTCQB and in Germany on the Frankfurt Exchange under “35D”.
Mark Reichman, Senior Research Analyst, Natural Resources, Noble Capital Markets, Inc.
Refer to the full report for the price target, fundamental analysis, and rating.
Flotation tests across a range of lithologies. The Wicheeda deposit is to be developed as an open pit mining operation. Once mined, rare earth oxides (REO) will be milled and processed in a flotation plant to produce a REO concentrate. The company is currently performing flotation tests on samples of differing lithologies. The Wicheeda deposit is characterized by three main rare earths bearing lithologies, including dolomite carbonatite which is the dominant lithology, xenolithic carbonatite, and syenite. Limestone is the major waste rock.
Conventional flotation yields high grade concentrate. Approximately 70 flotation tests have been performed. Results have confirmed that conventional flotation from a range of lithologies and grades can produce high grade rare earths mineral concentrate at high recovery rates.
This Company Sponsored Research is provided by Noble Capital Markets, Inc., a FINRA and S.E.C. registered broker-dealer (B/D).
*Analyst certification and important disclosures included in the full report. NOTE: investment decisions should not be based upon the content of this research summary. Proper due diligence is required before making any investment decision.
Tailwinds Causing Investors to Love the Small Cap Sector
Investors have been reeling in U.S. small-cap stocks, and many have experienced the market rewarding them. As the U.S. dollar has been unrelentingly strong in 2022, the cost of products in any other currency has increased, this makes sales more difficult for multinational companies. The lower sales, of course, have the impact of weighing on the profits of U.S. companies that derive a large part of their earnings from overseas trade. This puts the smaller stocks at an advantage.
U.S. Dollar Tailwind
Goods valued in dollars, for example, using The WSJ Dollar Index which measures a basket of 16 currencies against the U.S. currency, are now up 16% on the year. This represents the minimum increase of the cost of products sold after the foreign exchange transaction, before inflation.
This has little impact on small U.S.-based companies that don’t transact as much or at all outside the U.S. borders. This is because companies in the small-cap S&P 600 generate only 20% of their revenue outside the U.S., compared with large-cap S&P 500 stocks that generate 40% of sales internationally, according to FactSet.
This by itself gives small-cap stocks, in the aggregate, an edge over large-cap indexes like the S&P 500. However, small-caps haven’t been unscathed by the overall negative market sentiment this year. But, in recent months, value investors have been putting more upward pressure on the smaller, more U.S.-centric companies than on companies in the Nasdaq 100 or S&P 500. In fact, the small-cap Russell index is the only one of the three indexes showing green over the past three months. It has also been outperforming in shorter periods like one month, 10 days, and 5 days.
Value Tailwind
Wall Street often uses the ratio of a company’s share price to its earnings (P/E ratio) as a gauge for whether a stock appears cheap or overpriced. The small-cap universe, by this measure, is very attractive relative to themselves in recent years and certainly relative to large-cap valuations now.
The S&P 600 is trading at 10.8 times expected earnings over the next 12 months, according to FactSet as of Friday. That is below its 20-year average of 15.5 and well below the S&P 500’s forward price/earnings ratio of 15.3.
The Russell Small-Cap 2000 is up .36% versus the S&P 500, down 3.85%, and Nasdaq 100, down 7.70%. Not shown on the graph below, the S&P 600 small cap index is flat on the period.
According to Royce Investment’s Third Quarter Chartbook, when comparing the stock market segments, four observations stand out. According to their Market Overview, these are:
1) Small-Cap Value, Small-Cap Core, and Small-Cap Growth are the cheapest segments of U.S. equities, 2) These segments are the only ones that are below their 25-year average valuation,
3) While all three value segments (Small-Cap, Mid-Cap, and Large-Cap) have nearly identical 25-year average valuations, their current valuations are vastly different, and
4) Mid-Cap Growth and Large-Cap valuations still have a long way to fall to reach their 25-year average valuations.
The presumption is with the segments all having the same 25-year average valuations and small-cap being below its average, while mid-cap and large-cap has to go down to reach its mean, that not only is small-cheap, but the other segments are still expensive.
Individually, some of the largest companies in the U.S. have shared their individual risks brought on by fluctuations in the currency market. Nike Inc., Fastenal Co., Domino’s Pizza Inc. and some others have pointed to negative foreign-exchange impacts during recent earnings calls. Microsoft warned of these pressures back in June.
Small-Cap Examples
Some standouts, not necessarily in either the S&P 600 or Russell 2000, small-cap indices, but found on Channelchek are, Bowlero (BOWL), with a market cap of 2.4 billion and performance of up 26.6% over the same three-month period shown in the chart above. For the same period, Comtech Telecommunications (CMTL), with a market cap of 281.5 million, and some international business, is up 12.6%. And RCI Hospitality Holdings (RICK), with a market cap of $705.9 million, has a three-month return of 45.7%. These examples can be found on Channelchek with complete, up-to-date research, alongside many other actionable opportunities.
Take Away
If yesterday’s trade isn’t working because of factors working against it, perhaps what wasn’t working yesterday is now coming into favor. The tailwind for smaller companies is coming from a few different places; they include having a higher percentage of domestic customers and also the law of reversion to the mean. The continued headwinds for larger companies include being much more likely to have problems that include foreign customer FX, and valuations that are still sitting above the 25-year average.
Is Meta the Wrong Path for Facebook, or is it Just Ahead of its Time?
Not all ideas are good ideas, even when they come from billionaire tech start-up founders like Mark Zuckerberg.
Michael Burry, the legendary investor of “Big Short” fame, has been criticizing the social media giant’s metaverse strategy. Burry joins others in questioning why Zuck would change the Facebook formula and spend billions embracing something that is far from real. Many of Zuckerberg’s critics are other successful billionaires like Elon Musk and Mark Cuban. Other critics are investors that have endured Meta share’s 62.3% ($570 billion) decline since January.
Burry founded and manages the hedge fund Scion Asset Management. Burry tweeted a message that seems to say Meta management blew it – and suggests they have blown it by historic proportions by taking a deep dive into something that may or may not have legs – the metaverse.
Image: @BurryDeleted (Twitter)
You don’t have to have been alive in the mid-1980s to know what Burry was saying when he posted, “Seems Meta has a New Coke problem.” Any business school textbook lists Coca-Cola’s changing the formula of its best-selling product as the #1 lesson in corporate blunders. It was an expensive change that failed miserably and caused the company to revert back to its original product or risk losing a lot more ground against rivals.
A Sweet Refresher
New Coke was a much sweeter version of the Coca-Cola people had become accustomed to using to wash down their pizza slices, or a burger and fries. It was introduced by Coca-Cola in April 1985 during the cola war Pepsi was waging.
At the time Coca Cola was perhaps one of the most recognized brands in the world. But, Pepsi stole customers after it ran a few Michael Jackson commercials suggesting its sugar water was the “choice of a new generation,” and also backed it up with ads showing blind taste test preferences. Between the taste test science and everyone wanting to be more like Michael Jackson, Coke lost market share. Coke reacted by reformulating its product and did its own blind side-by-side tests that indicated that consumers seemed to prefer the new sweeter taste, similar to Pepsi. The company then decided to market the reformulated recipe – New Coke was born.
Max Headroom was the spokesman for New Coke, Like the Grand Canyon (Flickr)
New Coke was introduced in April 1985, and within weeks they were receiving 5,000 angry calls a day. The number grew from there. Seventy-nine days after their initial announcement, Coca-Cola held a press conference in July 1985 to offer a mea culpa and announce the return of the original Coca-Cola “classic” formula.
Will Zuckerberg Relent?
So far, Facebook, I mean Meta, still wants to identify as a metaverse company, despite there being very few metaverse customers. The company is making sure users have accessories available and just unveiled a new virtual reality headset selling for $1,500 called the Meta Quest Pro. Zuckerberg says lower priced, presumably not “pro,” will follow ($300-$500 zone).
When one has built a business from a college dorm, a garage, or their mother’s basement, and it attains the kind of growth that Facebook, Apple, Amazon, or others have, it’s hard to keep growing at the pace investors and other onlookers have become accustomed to. This leads to a scenario where investors are exposed to a risk best described as the bigger they are, the farther they have to fall.
And Facebook has fallen, not just in dollar value, but in ranking among its peers. Does this mean Zuckerberg is not right? The game isn’t over, and there aren’t many of us that can say, with honesty, that we are more forward-looking or have more luck than Zuck.
Is Michael Burry Right?
There is a whole universe of stocks beyond metaverse investments. Huge successful companies like Facebook or even Coca-Cola have ample resources to build and grow but lose nimbleness and growth potential, unlike the potential smaller companies enjoy. Huge companies are also more likely to have a “say yes to the boss, and you’ll be rewarded” culture, rather than a small company culture which is more “show the boss you can make them money, and you’ll be rewarded” culture.
Zuckerberg and Meta may very well be moving forward with a mistake that could be enshrined in textbooks years from now. However, like Coke, they may find that if it’s a lemon, they can make lemonade. Coca-Cola emerged from the brief departure from their main product strengthened as consumers discovered what life was like without their favorite soft drink.
Take Away
Michael Burry is worth paying attention to. He thinks differently and has been correct enough to always listen. The metaverse is new; does this mean it won’t grow and become something only a visionary like Mark Zuckerberg can imagine? It has been an expensive and slow start. I suspect Facebook was much less expensive to get off the ground, and adoption also required ancillary products to be useable by the masses.
A lesson investors should remember from this is how difficult it is for large companies to grow from their current offerings and huge corporate base.
Channelchek is a platform created to help investors uncover the next Apple, the next Moderna, or the next Facebook. It’s a resource to dig deeper into these less celebrated fledgling opportunities and to leave investors with enough understanding to decide whether they should take their own action by buying stock and becoming an owner of something with greater than average potential.
VANCOUVER, BC, Oct. 17, 2022 /CNW/ – Defense Metals Corp. (“Defense Metals” or the “Company“; (TSXV: DEFN) (OTCQB: DFMTF) (FSE: 35D) announces the initial flotation results from variability samples.
Craig Taylor, CEO, and Director of Defense Metals stated: “Flotation results from the on-going program of testwork at SGS Lakefield confirm the basis of the Preliminary Economic Assessment (PEA)1 and show that the Wicheeda deposit can produce a high-grade rare earths mineral concentrate at high recovery rates with conventional flotation from a range of lithologies and grades. These are some of the best flotation results among rare earths development projects. We are encouraged with the exploration and metallurgy results to date, and confident that the pre-feasibility study, which we anticipate will commence shortly, will show that Wicheeda is well positioned to become one of the next rare earths producers in North America.”
The Company is currently performing flotation tests on samples of different lithologies. The Wicheeda deposit is characterized by three main rare earths bearing lithologies, dolomite carbonatite (DC) which is the dominant lithology, xenolithic carbonatite (XE), and syenite (SYN). Limestone is the major waste rock lithology. The predominant rare earths minerals are, synchysite/parisite, bastnäsite, and monazite.
The results to date indicate that high grade mineral concentrate containing more than 40% total rare earths oxides (TREO) at a recovery rate exceeding 80% has been produced from all fully tested DC samples and a Master Composite (MC) containing all lithologies, from material with a head grade of >2% TREO.
The XE material, representing about 24% of the deposit and encountered late in the mine life, can deliver a 38% TREO concentrate at ~70% recovery rate at feed grades ~1.4%TREO.
SYN material, which represents about 3% of the deposit and is only encountered late in the mine life, has the lowest grade but shows ~14x upgrade ratio (from 1.1% to 14.6%TREO) at recovery rates ~79%.
Approximately 70 flotation tests have been performed. Several assay results are pending, and additional tests are continuing on variability samples of DC, XE, SYN, and mixed samples.
Table 1. Selected Wicheeda Flotation Results
Composite samples
Variability samples
MC
DC
XE
SYN
DC-02
DC-04
Test ID
F37
F46
F47
F20
F61
F53
Head, TREO%
2.49
3.38
1.44
1.08
2.02
3.14
Mass Pull, %
4.2
6.3
2.8
3.3
3.2
6.2
Concentrate, TREO%
45.6
44.6
38.0
14.6
47.1
45.6
Recovery, %
81.3
82.7
70.3
78.5
74.3
88.9
Upgrade
18.3x
13.2x
26.4x
13.6x
23.3x
14.5x
Table 1, shows selected flotation results on samples from different lithologies. The Composite samples contain a mixture of intervals from different drill cores taken from different areas of the deposit and different depths and represent the different lithologies. The master composite sample (MC in Table 1) includes the three lithologies (DC (73.4%), XE (22.5%), SYN (3.8%)). The variability samples in Table 1 are just two of the seventeen such samples being tested.
The DC lithology accounts for more than 70% of PEA mill feed (Figure 1), and in the first 8 years of the expected mine life, over 90% of the flotation plant feed will be DC material, with higher rare earths grade, with the later years being mostly DC and XE material at relatively lower grades.
Fig. 1 : Wicheeda Percentage of Lithologies During Expected Mine Life
Methods
Samples were obtained from drill cores and separated into different lithologies. They were crushed and ground to 80% passing ~80µm and subjected to flotation tests. Several flotation parameters were investigated, including the collector types and dosage, depressant types and dosage, the addition of activator, pulp temperature, pulp density, pulp pH, and flotation feed size. All tests were performed at SGS Minerals Lakefield, Ontario.
Head grade, and concentrate products for cerium, lanthanum, neodymium and praseodymium oxides were determined via lithium-borate fusion of a 0.5-gram sample analyzed via wavelength dispersion X-ray fluorescence (WD-XRF).
The SGS analysis included a quality assurance / quality control (QA/QC) program including the insertion of rare earth element standard and blank samples. Defense Metals detected no significant QA/QC issues during review of the data. Defense Metals is not aware of any sampling, recovery or other factors that could materially affect the accuracy or reliability of the data referred to herein. SGS Minerals Lakefield is an ISO/IEC 17025 and ISO9001:2015 accredited laboratory. SGS is independent of Defense Metals Corp.
Qualified Person
The scientific and technical information contained in this news release, as it relates to the Wicheeda Rare-Earth Project, has been reviewed and approved by John Goode, P. Eng., Chief Metallurgist of the Company, who is a Qualified Person as defined by National Instrument 43-101 and has provided the technical information relating to metallurgy in this news release. Kristopher J. Raffle, P.Geo. (BC), a director of the Company, is the Qualified Person as defined in National Instrument 43-101 for the information relating to resources in this news release.
About the Wicheeda Rare Earth Property
The 100% owned 4,244-hectare Wicheeda Rare Earths Property, located approximately 80 km northeast of the city of Prince George, British Columbia, is readily accessible by all-weather gravel roads and is near infrastructure, including power transmission lines, the CN railway, and major highways.
The Wicheeda Rare Earths Project yielded a robust 2021 preliminary economic assessment technical report (PEA) that demonstrated an after-tax net present value (NPV@8%) of $517 million, and 18% IRR2. A unique advantage of the Wicheeda Rare Earths Project is the production of a saleable high-grade flotation concentrate. The PEA contemplates a 1.8 Mtpa (million tonnes per year) mill feed from an open pit mining operation with 1.75:1 (waste:mill feed) strip ratio over a 19 year mine (project) life producing an average of 25,423 tonnes REO annually. A Phase 1 initial pit strip ratio of 0.63:1 (waste:mill feed) would yield rapid access to higher grade surface mineralization in year 1 and payback of $440 million initial capital within 5 years.
About Defense Metals Corp.
Defense Metals Corp. is a mineral exploration and development company focused on the acquisition, exploration and development of mineral deposits containing metals and elements commonly used in the electric power markets, defense industry, national security sector and in the production of green energy technologies, such as, rare earths magnets used in wind turbines and in permanent magnet motors for electric vehicles. Defense Metals owns 100% of the Wicheeda Rare Earth Element Deposit located near Prince George, British Columbia, Canada. Defense Metals Corp. trades in Canada under the symbol “DEFN” on the TSX Venture Exchange, in the United States, under “DFMTF” on the OTCQB and in Germany on the Frankfurt Exchange under “35D”.
Neither the TSX Venture Exchange nor its Regulation Services Provider (as that term is defined in the policies of the TSX Venture Exchange) accepts responsibility for the adequacy or accuracy of this news release.
Cautionary Statement Regarding “Forward-Looking” Information
This news release contains “forward‐looking information or statements” within the meaning of applicable securities laws, which may include, without limitation, statements relating to advancing the Wicheeda REE Project, receipt of additional flotation results and the expected outcomes, the Company’s plans for its Wicheeda REE Project, the commencement of the pre-feasibility study and the anticipated outcomes, the expected mine life estimates, the technical, financial and business prospects of the Company, its project and other matters. All statements in this news release, other than statements of historical facts, that address events or developments that the Company expects to occur, are forward-looking statements. Although the Company believes the expectations expressed in such forward-looking statements are based on reasonable assumptions, such statements are not guarantees of future performance and actual results may differ materially from those in the forward-looking statements. Such statements and information are based on numerous assumptions regarding present and future business strategies and the environment in which the Company will operate in the future, including the price of rare earth elements, the anticipated costs and expenditures, the ability to achieve its goals, that general business and economic conditions will not change in a material adverse manner, that financing will be available if and when needed and on reasonable terms. Such forward-looking information reflects the Company’s views with respect to future events and is subject to risks, uncertainties and assumptions, including the risks and uncertainties relating to the interpretation of exploration and metallurgy results, risks related to the inherent uncertainty of exploration and cost estimates, the potential for unexpected costs and expenses and those other risks filed under the Company’s profile on SEDAR at www.sedar.com. While such estimates and assumptions are considered reasonable by the management of the Company, they are inherently subject to significant business, economic, competitive and regulatory uncertainties and risks. Factors that could cause actual results to differ materially from those in forward looking statements include, but are not limited to, continued availability of capital and financing and general economic, market or business conditions, adverse weather and climate conditions, failure to maintain or obtain all necessary government permits, approvals and authorizations, failure to maintain community acceptance (including First Nations), risks relating to unanticipated operational difficulties (including failure of equipment or processes to operate in accordance with specifications or expectations, cost escalation, unavailability of personnel, materials and equipment, government action or delays in the receipt of government approvals, industrial disturbances or other job action, and unanticipated events related to health, safety and environmental matters), risks relating to inaccurate geological, metallurgical and engineering assumptions, decrease in the price of rare earth elements, the impact of Covid-19 or other viruses and diseases on the Company’s ability to operate, an inability to predict and counteract the effects of COVID-19 on the business of the Company, including but not limited to, the effects of COVID-19 on the price of commodities, capital market conditions, restriction on labour and international travel and supply chains, loss of key employees, consultants, or directors, increase in costs, delayed assay results, litigation, and failure of counterparties to perform their contractual obligations. The Company does not undertake to update forward‐looking statements or forward‐looking information, except as required by law.
SOURCE Defense Metals Corp.
______________________________
1 Independent Preliminary Economic Assessment for the Wicheeda Rare Earth Element Project, British Columbia, Canada, dated January 6, 2022, with an effective date of November 7, 2021, and prepared by SRK Consulting (Canada) Inc. is filed under Defense Metals Corp.’s Issuer Profile on SEDAR (www.sedar.com).
______________________________
2 Independent Preliminary Economic Assessment for the Wicheeda Rare Earth Element Project, British Columbia, Canada, dated January 6, 2022, with an effective date of November 7, 2021, and prepared by SRK Consulting (Canada) Inc. is filed under Defense Metals Corp.’s Issuer Profile on SEDAR (www.sedar.com).
Abstract highlights foundational research in the development of PDS0102 and PDS0103
FLORHAM PARK, N.J., Oct. 17, 2022 (GLOBE NEWSWIRE) — PDS Biotechnology Corporation (Nasdaq: PDSB), a clinical-stage immunotherapy company developing a growing pipeline of targeted immunotherapies for cancer and infectious disease, today announced that an abstract reporting on preclinical studies of two the company’s oncology pipeline products targeting multiple types of cancer has been accepted for presentation at the American Association of Cancer Research (AACR) Special Conference on Tumor Immunology and Immunotherapy 2022. The AACR Tumor Immunology and Immunotherapy Conference is being held October 21-24, 2022, in Boston.
Versamune® is PDS Biotech’s novel investigational T cell activating platform designed to stimulate a precise immune system response to cancer-specific proteins. The abstract accepted for presentation at the AACR Tumor Immunology and Immunotherapy Conference highlights the development of Versamune® based drug formulations containing multi-epitope peptide antigen sequences of the tumor-associated protein TARP (T cell receptor gamma chain Alternate Reading frame Protein) and modified sequences of novel Mucin 1 oncoprotein (MUC1). This research provided the foundation for the development of PDS0102 as a potential treatment for TARP-associated acute myeloid leukemia (AML), prostate, and breast cancers, and PDS0103 as a potential treatment for MUC1-associated breast, colon, lung, ovarian, and other cancers.
“Our Versamune® platform provides an opportunity to address a myriad of cancers by combining the technology with unique proteins or peptides that are specific to the cancer. The research accepted for presentation at the AACR Tumor Immunology and Immunotherapy Conference highlights this important versatility of the platform and, specifically, the rationale for our PDS0102 and PDS0103 programs,” commented Dr. Frank Bedu-Addo, President and Chief Executive Officer of PDS Biotech. “We welcome the opportunity to present at such a highly influential conference. Based on recently reported clinical results from our ongoing studies of PDS0101 in HPV-positive cancers such as anal, cervical, head and neck, penile, vaginal, and vulvar cancers, we continue to expand our Versamune® based programs into TARP-associated AML, prostate and breast cancers, and MUC1-associated breast, colon, lung, ovarian and other cancers.”
Poster Number: B24 Abstract Title: Development of targeted T cell cancer immunotherapies based on a novel enantiomeric cationic lipid that promotes antigen cross-presentation and upregulation of type I interferons Authors: Siva K. Gandhapudi, Karuna Sundarapandiyan, Martin Ward, Afsheen Fatima, Mania Dorrani, Mary Banoub, Joe Dervan, Lauren Wood, Greg Conn, and Jerold G. Woodward Session Date and Time: Sunday, October 23 at 6:00-8:30 pm ET
About PDS Biotechnology
PDS Biotech is a clinical-stage immunotherapy company developing a growing pipeline of targeted cancer and infectious disease immunotherapies based on our proprietary Versamune® and Infectimune™ T cell-activating technology platforms. We believe our targeted Versamune® based candidates have the potential to overcome the limitations of current immunotherapy by inducing large quantities of high-quality, potent polyfunctional tumor specific CD4+ helper and CD8+ killer T cells. To date, our lead Versamune® clinical candidate, PDS0101, has demonstrated the potential to reduce tumors and stabilize disease in combination with approved and investigational therapeutics in patients with a broad range of HPV-positive cancers in multiple Phase 2 clinical trials. Our Infectimune™ based vaccines have also demonstrated the potential to induce not only robust and durable neutralizing antibody responses, but also powerful T cell responses, including long-lasting memory T cell responses in pre-clinical studies to date. To learn more, please visit www.pdsbiotech.com or follow us on Twitter at @PDSBiotech.
Forward Looking Statements
This communication contains forward-looking statements (including within the meaning of Section 21E of the United States Securities Exchange Act of 1934, as amended, and Section 27A of the United States Securities Act of 1933, as amended) concerning PDS Biotechnology Corporation (the “Company”) and other matters. These statements may discuss goals, intentions and expectations as to future plans, trends, events, results of operations or financial condition, or otherwise, based on current beliefs of the Company’s management, as well as assumptions made by, and information currently available to, management. Forward-looking statements generally include statements that are predictive in nature and depend upon or refer to future events or conditions, and include words such as “may,” “will,” “should,” “would,” “expect,” “anticipate,” “plan,” “likely,” “believe,” “estimate,” “project,” “intend,” “forecast,” “guidance”, “outlook” and other similar expressions among others. Forward-looking statements are based on current beliefs and assumptions that are subject to risks and uncertainties and are not guarantees of future performance. Actual results could differ materially from those contained in any forward-looking statement as a result of various factors, including, without limitation: the Company’s ability to protect its intellectual property rights; the Company’s anticipated capital requirements, including the Company’s anticipated cash runway and the Company’s current expectations regarding its plans for future equity financings; the Company’s dependence on additional financing to fund its operations and complete the development and commercialization of its product candidates, and the risks that raising such additional capital may restrict the Company’s operations or require the Company to relinquish rights to the Company’s technologies or product candidates; the Company’s limited operating history in the Company’s current line of business, which makes it difficult to evaluate the Company’s prospects, the Company’s business plan or the likelihood of the Company’s successful implementation of such business plan; the timing for the Company or its partners to initiate the planned clinical trials for PDS0101, PDS0203 and other Versamune® and Infectimune™ based product candidates; the future success of such trials; the successful implementation of the Company’s research and development programs and collaborations, including any collaboration studies concerning PDS0101, PDS0203 and other Versamune® and Infectimune™ based product candidates and the Company’s interpretation of the results and findings of such programs and collaborations and whether such results are sufficient to support the future success of the Company’s product candidates; the success, timing and cost of the Company’s ongoing clinical trials and anticipated clinical trials for the Company’s current product candidates, including statements regarding the timing of initiation, pace of enrollment and completion of the trials (including the Company’s ability to fully fund its disclosed clinical trials, which assumes no material changes to our currently projected expenses), futility analyses, presentations at conferences and data reported in an abstract, and receipt of interim or preliminary results (including, without limitation, any preclinical results or data), which are not necessarily indicative of the final results of the Company’s ongoing clinical trials; any Company statements about its understanding of product candidates mechanisms of action and interpretation of preclinical and early clinical results from its clinical development programs and any collaboration studies; and other factors, including legislative, regulatory, political and economic developments not within the Company’s control, including unforeseen circumstances or other disruptions to normal business operations arising from or related to COVID-19. The foregoing review of important factors that could cause actual events to differ from expectations should not be construed as exhaustive and should be read in conjunction with statements that are included herein and elsewhere, including the risk factors included in the Company’s annual and periodic reports filed with the SEC. The forward-looking statements are made only as of the date of this press release and, except as required by applicable law, the Company undertakes no obligation to revise or update any forward-looking statement, or to make any other forward-looking statements, whether as a result of new information, future events or otherwise.
Versamune® is a registered trademark and Infectimune™ is a trademark of PDS Biotechnology.
Aurania Resources Ltd. (TSXV: ARU) (OTCQB: AUIAF) (FSE: 20Q) (“Aurania” or the “Company”) is pleased to announce that positive findings of careful relogging of drill core together with the integration of geophysics and geochemistry from its Tiria-Shimpia target in Aurania’s Lost Cities-Cutucu project in southeastern Ecuador (the “Project”), has revealed the presence of a chain of three structural grabens occupying the middle of the concession block. Grabens are extremely important in mineral exploration because their bounding faults are often through-going conduits for hydrothermal fluids, and they have very high potential to be mineralized. This underlying work is integral to advancing ongoing joint venture discussions while the Company begins preparations for a drill program at its Tatasham and Awacha porphyry targets expected to commence later in 2022. Both programs remain in line with Aurania’s corporate strategy discussed in February 2022.
Professor Gregor Borg, a recognized international expert on sediment-hosted copper deposits commented on the review/reinterpretation of Aurania’s geological data, “The reassembly and reinterpretation of available data makes a totally new and very exciting story!”
The north graben is 10 kilometres long and 3.5 kilometres wide, the central graben is 26 kilometres long and 3 kilometres wide; and the south graben is 18 kilometres long and 5 kilometres wide.
Structural grabens, also known as pull-aparts or drop-downs, are areas where younger rocks have been faulted downwards vertically, between older rocks by opposing horizontal forces. It can be thought of as if the rocks have been stretched horizontally in opposite directions to breaking point, and then have subsided downward along vertical bounding cracks (faults). Grabens can be recognized in the field when the rocks abruptly appear out of age sequence. Lundin Gold’s Fruta del Norte gold deposit, approximately 100 kilometres south of the Project, lies in a structural graben as does Aurania board member Thomas Ullrich’s recent high-grade copper discovery at the Storm deposit of Aston Bay in northern Canada. A number of mineralizing patterns have now come into focus, which will be explained below, and Management considers that the prospectivity of its sediment-hosted targets within the Project has been very considerably enhanced. The process of review by Aurania’s technical team and consultants is ongoing.
Dr. Cristian Vallejo, Aurania’s Consultant Geological Expert on the Cutucu area, has relogged the Tiria-Shimpia and Tsenken drillcore, placing it in the correct geological context. It was found that a contracted paleontologist had incorrectly dated several index fossils and that Tiria-Shimpia sits in rocks that are 90 million years younger than previously believed. Dr. Vallejo convincingly correlated the drilling with oil well DRA-29 outside the Project, and also dissolved representative pieces of Tiria-Shimpia core in acid for palynology (dating of fossil pollen). The results definitively place the four Tiria-Shimpia holes in the Hollin and Napo Formations, which are understood to the primary reservoir rocks for oil in Ecuador. In fact, impregnations of petroleum were found at depths of 345.8 metres (“m”) to 357 m in Hole #2 in Shimpia. While Management of Aurania does not consider there to be any potential for economic petroleum in the concessions, the importance of this finding in the context of sediment-hosted base metal deposits cannot be overemphasized. Crude petroleum, bitumen and natural gas have all been implicated as precipitation agents in the formation of sediment-hosted copper deposits, and lead-zinc-silver deposits. The two styles of mineralization are sometimes found in proximity but are separated horizontally or vertically due to precipitation kinetics.
Over the last several years, Aurania has located numerous high-grade copper/silver showings across the Project (see press releases dated August 6, 2020, July 30, 2020, April 9, 2019, April 2, 2019, and October 4, 2018), but the proper understanding of the ore-deposits framework still eluded us to some extent. We now know that the lower part of much of the concession area is occupied by Jurassic-aged Chapiza redbed sediments that contain salt and that are over a kilometre in thickness. To date, salt has been intersected in three drill holes in Tsenken and anhydrite evaporites were found in two other holes. The copper/silver mineralization sits within laterally impersistent and thin beds of carbonaceous trash in the upper Chapiza, stratigraphically above the salt beds, where plant debris and other organics have acted as chemical reductants, precipitating copper and silver from circulating saline brine. The scenario is not unlike the Kupferschiefer of eastern Germany and Poland, but by themselves our thin beds are volumetrically too minor to represent orebodies and are not exploration targets.
One exploration target however does leap out as exceptional and will be discussed presently. The Chapiza redbeds would equate with the Rotliegendes (in German, the “underlying red”) directly beneath the Kupferschiefer, an organic-rich “copper shale” which hosts the economic orebodies in Poland. We believed formerly that our carbonaceous beds were a direct analogue to the Kupferschiefer unit, and indeed in some ways they are, but a much better exploration target is proffered by the Hollin Formation higher in stratigraphy, which is both thick and bituminous with good porosity. These rocks were formerly not thought to be in the central graben, but the recent study made by Cristian Vallejo has identified the Upper Hollin formation (“Fm”) in hole #1 and #2 below the Napo Fm. Hollin also subcrops within the southern graben, in an area where there is a large MobileMT (“MMT”) conductive anomaly that was heretofore considered to be spurious.
The geological model for sediment-hosted copper deposits is predicated on a source accumulation of oxidized sediments in a basin that has occasionally evaporated to dryness, leaving behind salt beds. The theory is that minute amounts of copper in oxidized minerals become labile and can be stripped and then mobilized in brine as copper chloride. Heated brine would typically travel upwards through the rock column along faults and where it encountered organics, pyrite, or some other precipitation agent would drop the copper out of solution to form copper sulphides such as chalcocite. Professor Borg has previously commented that the presence of coeval porphyry copper deposits in the Chapiza means that the basin is “Turbocharged” with a “Double whammy”, or twice as much fertile copper potential as a normal scenario. Watch the video with Prof. Borg here: http://www.aurania.com/the-opportunity-a-copper-experts-opinion. The same model components are present in the Kupferschiefer and Aston Bay’s new Storm deposit but without copper porphyry.
Figure 1: From Vallejo et al. 2021. The central panel pertains to the Cutucu and provides stratigraphic context to this press release. The host rocks to Zn-Pb-Ag at Tiria-Shimpia are in the middle Napo Shale of the central panel. Previously they were believed to be in the Santiago Fm, at the very bottom of the stratigraphic column in the lower Jurassic. The copper source rocks and salt are in the Late Jurassic Chapiza Fm.
Figure 2: Interpreted geology. The sense of throw on the faults is still to be entirely defined. Most of the field of view is occupied by the NNW Central Graben containing Napo and Hollin Fm. The Southern Graben contains Napo, Hollin and Chapiza in a synclinal structure.
Figure 4: The distribution of copper and zinc in soils, within surveyed and sampled areas. Note that the distribution of Zn in the Central Graben mimics the distribution of Ag in outcrop from Figure 3. Cu has a wider distribution and is concentrated in Tsenken in the Southern Graben where it occurs close to copper-in-sediment occurrences but is also anomalous in other areas. These other areas are flows and subvolcanic intrusives of basalt to andesite within the Chapiza Fm. Drilling has shown them to be partially to completely oxidized, and coeval with the redbed sediments. They have high intrinsic backgrounds in Cu and Co and are considered an excellent protolith for mobilization into stratigraphically higher sediments.
Figures 5 and 6 are blow ups of the South Graben area. Figure 5 has the distribution of uranium in soils superimposed and 6, chromium in soils superimposed. The folded calc-alkaline basalt and andesite flow is outlined by Cr contents in Figure 6 (due to mafic character) and is clearly seen in Figure 5, which is free of anomalous U values over the flow. The saddle-shaped folding of the flow is clearly duplicated up-section by anomalous uranium, highly suggesting there is a stratiform accumulation of uranium in sediments. The picture for copper in Figure 4 is less clear but potentially covariant with uranium. Copper and uranium are often found together in sediment-hosted deposits e.g., Zambia Copperbelt. There is no MMT conductor in this area and potentially the sediments are shallow enough that sulphide has been weathered to carbonates and oxides. This is considered a very good drill target for the future.
Figure 7: MMT image over the Tsenken target area (South Graben). The hot colours are the conductors. Note that the salt occurrences along the graben boundary faults are extremely strong conductors. Salt itself is an insulator but with addition of water becomes strongly conductive. The brine springs used by the Shuar to produce salt are in the same area The circa 3 x 5 km conductivity anomaly on the west side of Tsenken remains unexplained and undrilled. Because it has depth extent it is thought to be a porphyry body which is buried within the Chapiza. It is a high priority target. The labelled conductor “copper target” mimics the saddle shape of the syncline lower in stratigraphy, and is composed of lower Hollin Fm. This is a 3.5 x 3 km target and appears to be stratiform and potentially stratabound. It is considered the highest priority copper-in-sediment target in this new interpretation.
Figure 8: A stratigraphic column modified from Vallejo, 2022. It shows diagrammatically the presence of organic carbon plotted against the stratigraphy of the rocks in the Cutucu. As can be seen, the layers with carbon in the Chapiza Fm are quite thin. Near the bottom of the Hollin Fm the carbon level picks up dramatically. As a working hypothesis we believe that some mobilized copper is deposited by fluids when they encounter carbonaceous layers in the Chapiza Fm, and we see abundant evidence of that in outcrop. We believe though that the majority of the copper will continue to migrate up-section until it comes in contact with the major carbon bearing units of the lower Hollin Fm. These units do not outcrop and Tiria-Shimpia hole #2 was too shallow to test this hypothesis. After dumping the copper, the fluids continued to move up-section into the Napo Fm where they deposited the zinc-lead-silver. MMT coverage over the Tiria-Shimpia area is limited, but deep conductors along the boundary faults and below the zinc-lead-silver if found, would reinforce this hypothesis.
Unusually, there is enough potassium (potash) component in the salt to both make it deep orange in colour, and mildly radioactive. Fault traces where salt is present are both radiometric K-channel anomalies and strong conductors. The zinc-lead-silver mineralization at Tiria-Shimpia also shows up as K-channel radiometric anomalies, and this is potentially due to the presence of large amounts of celestite, a strontium mineral that can contain moderate amounts of potassium. There are a large number of these radiometric targets along boundary faults that do not outcrop and have yet to be drilled. The integration of radiometric, magnetometer and magneto-telluric surveys is not fully completed and will with high probability yield more targets.
Qualified Person
The geological information contained in this news release has been verified and approved by Jean-Paul Pallier, MSc, VP Exploration. Mr. Pallier is a designated EurGeol by the European Federation of Geologists and a Qualified Person as defined by National Instrument 43-101, Standards of Disclosure for Mineral Projects of the Canadian Securities Administrators.
About Aurania Aurania is a mineral exploration company engaged in the identification, evaluation, acquisition and exploration of mineral property interests, with a focus on precious metals and copper in South America. Its flagship asset, The Lost Cities – Cutucu Project, is located in the Jurassic Metallogenic Belt in the eastern foothills of the Andes mountain range of southeastern Ecuador.
Neither the TSX Venture Exchange nor its Regulation Services Provider (as that term is defined in the policies of the TSX Venture Exchange) accepts responsibility for the adequacy or accuracy of this release.
Forward-Looking Statements This news release may contain forward-looking information that involves substantial known and unknown risks and uncertainties, most of which are beyond the control of Aurania. Forward-looking statements include estimates and statements that describe Aurania’s future plans, objectives or goals, including words to the effect that Aurania or its management expects a stated condition or result to occur. Forward-looking statements may be identified by such terms as “believes”, “anticipates”, “expects”, “estimates”, “may”, “could”, “would”, “will”, or “plan”. Since forward-looking statements are based on assumptions and address future events and conditions, by their very nature they involve inherent risks and uncertainties. Although these statements are based on information currently available to Aurania, Aurania provides no assurance that actual results will meet management’s expectations. Risks, uncertainties and other factors involved with forward-looking information could cause actual events, results, performance, prospects and opportunities to differ materially from those expressed or implied by such forward-looking information. Forward looking information in this news release includes, but is not limited to Aurania’s objectives, goals or future plans, statements, exploration results, potential mineralization, the corporation’s portfolio, treasury, management team and enhanced capital markets profile, the estimation of mineral resources, exploration, timing of the commencement of operations and estimates of market conditions. Factors that could cause actual results to differ materially from such forward-looking information include, but are not limited to, failure to identify mineral resources, failure to convert estimated mineral resources to reserves, the inability to complete a feasibility study which recommends a production decision, the preliminary nature of metallurgical test results, delays in obtaining or failures to obtain required governmental, regulatory, environmental or other project approvals, political risks, inability to fulfill the duty to accommodate indigenous peoples, uncertainties relating to the availability and costs of financing needed in the future, changes in equity markets, inflation, changes in exchange rates, fluctuations in commodity prices, delays in the development of projects, capital and operating costs varying significantly from estimates and the other risks involved in the mineral exploration and development industry, the effects of COVID-19 on the business of the Company including but not limited to the effects of COVID-19 on the price of commodities, capital market conditions, restrictions on labour and international travel and supply chains, and those risks set out in Aurania’s public documents filed on SEDAR. Although Aurania believes that the assumptions and factors used in preparing the forward-looking information in this news release are reasonable, undue reliance should not be placed on such information, which only applies as of the date of this news release, and no assurance can be given that such events will occur in the disclosed time frames or at all. Aurania disclaims any intention or obligation to update or revise any forward-looking information, whether as a result of new information, future events or otherwise, other than as required by law.
CHATHAM, N.J., Oct. 17, 2022 (GLOBE NEWSWIRE) — Tonix Pharmaceuticals Holding Corp. (Nasdaq: TNXP), a clinical-stage biopharmaceutical company, announced today that Seth Lederman, M.D., Chief Executive Officer of Tonix Pharmaceuticals, will participate in one-on-one meetings at the 2022 BIO-Europe Conference being held in Leipzig, Germany, October 24-26, 2022. The Company’s presentation will be available to registered participants through the conference partnering site.
To schedule a meeting with the Company’s management at the conference, please submit a meeting request through the BIO-Europe partneringONE™ system.
Tonix Pharmaceuticals Holding Corp.*
Tonix is a clinical-stage biopharmaceutical company focused on discovering, licensing, acquiring and developing therapeutics to treat and prevent human disease and alleviate suffering. Tonix’s portfolio is composed of central nervous system (CNS), rare disease, immunology and infectious disease product candidates. Tonix’s CNS portfolio includes both small molecules and biologics to treat pain, neurologic, psychiatric and addiction conditions. Tonix’s lead CNS candidate, TNX-102 SL (cyclobenzaprine HCl sublingual tablet), is in mid-Phase 3 development for the management of fibromyalgia with a new Phase 3 study launched in the second quarter of 2022 and interim data expected in the second quarter of 2023. TNX-102 SL is also being developed to treat Long COVID, a chronic post-acute COVID-19 condition. Tonix initiated a Phase 2 study in Long COVID in the third quarter of 2022 and expects interim data in the first half of 2023. TNX-1300 (cocaine esterase) is a biologic designed to treat cocaine intoxication and has been granted Breakthrough Therapy designation by the FDA. A Phase 2 study of TNX-1300 is expected to be initiated in the first quarter of 2023. TNX-1900 (intranasal potentiated oxytocin), a small molecule in development for chronic migraine, is expected to enter the clinic with a Phase 2 study in the fourth quarter of 2022. TNX-601 ER (tianeptine hemioxalate extended-release tablets) is a once-daily formulation of tianeptine being developed as a potential treatment for major depressive disorder (MDD) with a Phase 2 study expected to be initiated in the first quarter of 2023. Tonix’s rare disease portfolio includes TNX-2900 (intranasal potentiated oxytocin) for the treatment of Prader-Willi syndrome. TNX-2900 has been granted Orphan Drug designation by the FDA. Tonix’s immunology portfolio includes biologics to address organ transplant rejection, autoimmunity and cancer, including TNX-1500, which is a humanized monoclonal antibody targeting CD40-ligand (CD40L or CD154) being developed for the prevention of allograft and xenograft rejection and for the treatment of autoimmune diseases. A Phase 1 study of TNX-1500 is expected to be initiated in the first half of 2023. Tonix’s infectious disease pipeline consists of a vaccine in development to prevent smallpox and monkeypox, next-generation vaccines to prevent COVID-19, and a platform to make fully human monoclonal antibodies to treat COVID-19. TNX-801, Tonix’s vaccine in development to prevent smallpox and monkeypox, also serves as the live virus vaccine platform or recombinant pox vaccine (RPV) platform for other infectious diseases. A Phase 1 study of TNX-801 is expected to be initiated in Kenya in the first half of 2023. Tonix’s lead vaccine candidate for COVID-19 is TNX-1850, a live virus vaccines based on Tonix’s recombinant pox live virus vector vaccine platform.
*All of Tonix’s product candidates are investigational new drugs or biologics and have not been approved for any indication.
This press release and further information about Tonix can be found at www.tonixpharma.com.
Forward Looking Statements
Certain statements in this press release are forward-looking within the meaning of the Private Securities Litigation Reform Act of 1995. These statements may be identified by the use of forward-looking words such as “anticipate,” “believe,” “forecast,” “estimate,” “expect,” and “intend,” among others. These forward-looking statements are based on Tonix’s current expectations and actual results could differ materially. There are a number of factors that could cause actual events to differ materially from those indicated by such forward-looking statements. These factors include, but are not limited to, risks related to the failure to obtain FDA clearances or approvals and noncompliance with FDA regulations; delays and uncertainties caused by the global COVID-19 pandemic; risks related to the timing and progress of clinical development of our product candidates; our need for additional financing; uncertainties of patent protection and litigation; uncertainties of government or third party payor reimbursement; limited research and development efforts and dependence upon third parties; and substantial competition. As with any pharmaceutical under development, there are significant risks in the development, regulatory approval and commercialization of new products. Tonix does not undertake an obligation to update or revise any forward-looking statement. Investors should read the risk factors set forth in the Annual Report on Form 10-K for the year ended December 31, 2021, as filed with the Securities and Exchange Commission (the “SEC”) on March 14, 2022, and periodic reports filed with the SEC on or after the date thereof. All of Tonix’s forward-looking statements are expressly qualified by all such risk factors and other cautionary statements. The information set forth herein speaks only as of the date thereof.
TULSA, Okla.–(BUSINESS WIRE)– Alliance Resource Partners, L.P. (NASDAQ: ARLP) will report its third quarter 2022 financial results before the market opens on Monday, October 31, 2022. Alliance management will discuss these results during a conference call beginning at 10:00 a.m. Eastern that same day.
To participate in the conference call, dial (877) 407-0784 and request to be connected to the Alliance Resource Partners, L.P. earnings conference call. International callers should dial (201) 689-8560 and request to be connected to the same call. Investors may also listen to the call via the “investor information” section of ARLP’s website at http://www.arlp.com.
An audio replay of the conference call will be available for approximately one week. To access the audio replay, dial U.S. Toll Free (844) 512-2921; International Toll (412) 317-6671 and request to be connected to replay using access code 13733069.
About Alliance Resource Partners, L.P.
ARLP is a diversified energy company that is currently the largest coal producer in the Eastern United States. ARLP also generates operating and royalty income from mineral interests it owns in strategic coal and oil & gas producing regions in the United States. In addition, ARLP is positioning itself as an energy provider for the future by leveraging its core technology and operating competencies to make strategic investments in the fast-growing energy and infrastructure transition.
News, unit prices and additional information about ARLP, including filings with the Securities and Exchange Commission (“SEC”), are available at http://www.arlp.com. For more information, contact the investor relations department of ARLP at (918) 295-7674 or via e-mail at investorrelations@arlp.com.
Brian L. Cantrell Alliance Resource Partners, L.P. (918) 295-7673
Michael Kupinski, Director of Research, Noble Capital Markets, Inc.
Patrick McCann, Research Associate, Noble Capital Markets, Inc.
Jacob Mutchler, Research Associate, Noble Capital Markets, Inc.
Refer to the bottom of the report for important disclosures
Overview. Develop a shopping list.This report focuses on the looming economic recession and how investors should position portfolios for the prospect of an economic recovery. But, a more important theme of this report is for investors not to look for the past leaders in the industry as the best way to play a rebound. In this report, we look beyond a rebound play and focus on our favorite growth plays.
Digital Media: The smaller beat the goliaths.Two of our current favorites in the AdTech and MarTech industries performed better than most of its respective peers in the quarter. Can the momentum continue?
Television Broadcasting: Will political carry the quarter? With signs of weakening National advertising, broadcasters are looking forward toward Q4 Political as an offset. Political advertising, however, is not usually evenly spent across all markets. There may be winners and some losers.
Radio Broadcasting: Polishing its tarnished image.One of the epic fails of the radio industry has been Audacy, once one of the leadership companies of the industry. The AUD shares are down a staggering 95% from highs in March 2021. New industry leaders are emerging and they are not focused on radio. We highlight a few of our current favorites.
Publishing: Once a leader, now a loser.It is hard to believe that Gannett was once a $90 stock and held a record for one of the longest strings of quarterly earnings gains in the S&P 500 Index. The shares are down 80% from year earlier highs to near $1.37. We believe that investors should take a look at a company that has developed into an impressive Digital Media publisher.
Overview
Develop A Shopping List
The best time to buy stocks is typically in the midst of an economic recession. Investors begin to look beyond the economic weakness and begin positioning portfolios for an economic rebound. The hard part is determining when the economy is in the middle of the downturn. It appears by all standard definitions of an economic downturn that the U.S. is in an economic recession. But, how long will a downturn last? Should investors try to be cute to predict the midpoint of the downturn?
Many economic pundits paint the current state of the economy against the canvas of the 1970s, a period of high inflation and low economic growth. There are many similarities. The Federal Reserve in the early 70s was willing to provide cheap money to fuel the economy, without much concern about inflation. In the second half of the 70s, the economy was rocked by fuel supply shortages and high inflation. During the Covid pandemic, both fiscal and monetary policy was designed to provide liquidity and to make sure that people were able to pay their bills during the economic lockdowns. This had the affect of increasing personal income, even though GDP declined 31.4% in 2020. As the economy reopened, there was significant demand for goods and services, some of which were in short supply because of the previous and recurring economic lock downs. Simplistically, this fueled inflation, high demand with a consumer that had disposable income and limited supply.
As Figure #1 Early 1970s chart illustrates, the US economy grew 9.8%, as measured by real GDP, from January 1972 to September 1975. Notably, the stock market, as measured by the S&P 500 Index, declined a significant 18.6%. This was a period marked by rising inflation due to government spending. The inflation rate, as measured by the US Bureau of Labor Statistics, was a reasonable 3.3% in 1972, but increased to 11.1% in 1974 and then moderated slightly to 9.1% in 1975. The inflation rate remained above 5% for the following 3 years.
Figure #1 Early 1970s
Source: US Bureau of Economic Analysis and Yahoo Finance.
Given the current state of rising energy prices, many pundits paint the current US economic plight similar to the period of fuel shortages of the late 1970s. As Figure #2 Late 1970s illustrates, the US economy, as measured by real GDP, grew 13.5% from January 1977 to October 1981, an average of slightly more than 3% per year. Notably, inflation increased significantly, from 6.5% in 1977 to 11.3% in 1979, followed by 13.5% in 1980, and 10.3% in 1981. The stock market, as measured by the S&P 500 Index, did not react well, up 9.3% from January 1977 to October 1981, an average of 2.3% growth.
Figure #2 Late 1970s
Source: US Bureau of Economic Analysis and Yahoo Finance.
So, where are we now? In the present, the Covid induced government spending and stimulus related fiscal policy, large spending on the Ukraine war, and a Fed unwilling to rein in early signs of inflation has put the US in a dire economic position. Certainly, supply chain shortages contributed to the current rise in inflation, as well. The Fed now appears to have religion on inflation and is aggressively raising interest rates. The Fed indicated that it is willing to create economic pain to arrest inflationary pressures. Most certainly this will cause additional economic weakness. The stock market in the near to intermediate term will need to digest the likelihood of weakening corporate profits, as well. Furthermore, as it relates to the equity markets, other investment classes, such as bonds, may become more appealing, taking demand from the stock market.
We believe that arresting inflation would set a favorable trajectory for the stock market, as investors position for the prospect of an economic recovery. To some degree, the 24.4% drop in the stock market, as measured by the S&P 500 index, from January 2022 to near current levels, anticipate some of the headwinds for investors described earlier in this report, including weakening corporate profits, the prospect of a further weakened US, and, even global economy, a move toward other investment classes, and stubborn inflation. What is different this time is that the Fed now appears to be aggressively tackling inflation. As such, the 47% drop in the stock market from highs in 1973 to the low in 1974 may not be a prelude to the current environment. It was a different Fed and it took different actions.
We encourage a different approach than trying to time the market. Our advice is for investors to develop a shopping list and begin accumulating. But, be selective.
We believe that the leadership companies of the past economic downturns are not likely to be the best positioned for the looming economic downturn or the recovery. Many of the larger cap names in each sector have fallen on hard times. This is discussed more fully in the following sector reports. Those that appear to be well positioned are companies that have diversified revenue streams, transitioned to faster growth digital businesses, and pared down debt. We encourage investors to focus on these companies given the prospect of faster revenue and cash flow growth coming out of the possible recession. Some of our current favorites include Entravision, Townsquare Media, Salem Media, Harte Hanks, Direct Digital, and Lee Enterprises. These companies are discussed in the following sector summaries.
Internet & Digital Media
Internet and Digital Media stocks declined for the fourth consecutive quarter in a row, as Figure #3 Internet & Digital Media Stock Performance illustrates. It wasn’t all bad, as Noble’s Ad Tech Index outperformed the general market, as measured by the S&P 500 Index, up +7%. Comparatively, the S&P 500 Index decreased by 5%. Figure #4 Internet & Digital Media Q3 Performance reflects the outperformance of the AdTech sector. AdTech also materially outperformed Noble’s other Internet & Digital Media subsectors, including Noble’s Digital Media Index (-10%); Social Media Index (-15%) and MarTech Index (-16%). Notably, some of our closely followed companies significantly outperformed the respective peer group and outperformed the general market, discussed later in this report.
Figure #3 Internet & Digital Media LTM Stock Performance
Source: Capital IQ
Figure #4 Internet & Digital Media Q3 Stock Performance
Source: Capital IQ
Marketing Technology
Harte Hanks shines in MarTech
The worst performing sector was the MarTech sector, which is also the least profitable sector. This likely explains the sector’s underperformance. Only 4 of the 24 companies we monitor in this sector generate positive EBITDA, and investors migrated away from unprofitable growth stocks towards more profitable companies or defensive sectors that might withstand a recession better. Investors would clearly like to see companies in this sector accelerate their path to profitability, and most companies in the sector are responding accordingly. To be fair, some of the companies that aren’t EBITDA positive do generate positive cash flow from operations, which is a quirk of SaaS software accounting. Of the two dozen companies in this sector, the only stock that was up during the quarter was Harte-Hanks (HHS), whose shares increased by 68%. HHS continues to generate improved operating results while lowering its debt and pension obligations.
MarTech stocks have also been victims of their own success. Earlier this year the group traded at average revenue and EBITDA multiples of 8.5x and 70.8x, respectively. Today the same group trades at average revenue and EBITDA multiples of 4.5x and 30.1x, respectively. Stocks like Shopify (SHOP), and Hubspot (HUBS) entered the year trading at 22.2x and 14.7x 2022E revenues, respectively, and now trade at 5.3x, and 7.7x, respectively. Some of this appears to be a Covid-related hangover: when Covid hit, retail companies needed to emphasize their online channels, and companies like Shopify benefited. As consumers return to stores, growth has moderated. Shopify aside, the broader message investors seem to be sending is that recurring revenues are great, but not if they are paired with EBITDA losses at a time when economy appears to be heading into a potential recession.
As Figure #5 Marketing Tech Comparables illustrate, the shares of Harte Hanks is among the cheapest in the sector, currently trading at 5.1 times Enterprise Value to our 2023 adj. EBITDA estimate. We believe that the modest stock valuation relative to peers, currently trading on average at 12.9 times, illustrates the head room for the stock in spite of the 68% move in the latest quarter. The shares of HHS continue to be among our favorites in the sector.
Figure #5 Marketing Tech Comparables
Source: Eikon, Company filings and Nobles estimates
Advertising Technology
Direct Digital exceeds peers
Noble’s AdTech Index was the worst performing Index of the group in the second quarter when it was down 39%. As such, it was nice to see a better performance in the third quarter. In addition, Noble Indices are market cap weighted, and we attribute the relative strength of the Ad Tech Index to the performance of The Trade Desk (TTD), the Ad Tech sectors largest market cap company, whose shares were up 42% during the quarter. Other notable performers were Digital Media Solutions (DMS; +73%) which announced a deal to be taken private, and Zeta Global (ZETA; +46%), whose 2Q results significantly exceeded guidance. Despite the relative strength of the sector, returns were not broad-based: only 9 of the 23 stocks in the Ad Tech sector were up during the quarter.
One of our closely followed companies, Direct Digital (DRCT) had a strong performance, up 75% in the quarter. The company’s second quarter exceeded expectations and the company raised full year 2022 revenue and cash flow guidance by a significant 40%. The company appears to be bucking the downward trend in National advertising, which is reflected in its peer group quarterly performance.
As Figure #6 Advertising Tech Comparables illustrate, Direct Digital Holdings is trading near the averages in terms of Enterprise Value to the 2023 adj. EBITDA estimate. We would note that this valuation is low considering that the company is outperforming its peers. As such, we believe that there is a valuation gap and we continue to view DRCT shares as among our favorites.
Figure #6 Advertising Tech Comparables
Source: Eikon, Company filings and Nobles estimates
Traditional Media
Downward trends, but some bright spots
The Traditional Media stocks have had tough sledding this year. As Figure #7 Traditional Media LTM Stock Performance illustrates, all of Noble’s Traditional Media Indices have declined over the past 12 months and each have underperformed the general market. The downward spiral seemed to have moderated somewhat in the third quarter.
Notably, during the third quarter, many of the stocks had a very nice bounce before resuming a downward trend, as Figure #8 Traditional Media Q3 Stock Performance illustrates. At one point in the latest quarter, stocks were up as high as 30% from the second quarter end. It is important to note that only the Publishing stocks outperformed the general market in the latest quarter. A description of the traditional media sectors follow with our favorite picks for the upcoming quarter and year.
Figure #7 Traditional Media LTM Stock Performance
Source: Capital IQ
Figure #8 Traditional Media Q3 Stock Performance
Source: Capital IQ
Television Broadcasting
Noble’s TV Index dropped 10.1% in the third quarter, underperforming the broader market (-5.3%), illustrated in Figure #8 Traditional Media Q3 Stock Performance. As we indicated in our previous quarterly report, we believe that there would be a trading opportunity in the media stocks. The latest quarter stock performance indicated that. Many of the TV stocks had a strong performance from the end of the second quarter (June 30) to highs achieved in August. Many of the TV stocks increased a strong 25% on average. It is instructive to know that E.W. Scripps had the largest advance from June 30 lows, up 31% to highs achieved August 16. When the industry is in favor, the shares of E.W. Scripps tends to outperform its industry peers. The shares of Entravision (EVC) were the next best performing within the quarter, up 30%, before trading lower and ending down 12%.
The TV stocks were challenged by macro economic pressures such as inflation, rising cost of borrowing, and a Fed determined to curb inflation by slowing the economy. In the end, interest rate increases by the Fed curbed enthusiasm for TV stocks and the Noble TV Index ended the third quarter down.
As Figure #9 Q2 YOY Revenue Growth illustrates, the average television company reported 11.1% revenue growth in the latest quarter. Most broadcasters were very optimistic about Political advertising, with some raising forecasts to be near the levels of the Presidential election, a highwater mark. We would note that Entravision had the highest revenue performance in the quarter, up 24%, as the company continues to benefit from its transition toward faster growth Digital, which now accounts for over 80% of its total company revenues.
Industry adj. EBITDA margins were healthy, as Figure #10 Q2 EBITDA margins illustrate, with the average margin for the industry at 25.5%. It is notable to mention that Entravision margins appear to be significantly below that of the industry at 10.1%. Its Digital business is a rep business, and, as such, the company reports revenues on a net basis and not gross revenues. While a rep business tends to be a lower margin business, the reporting of rep revenues gives the appearance of very low margins. The company is in a strong cash flow and free cash flow position.
Most companies will be reporting third quarter financial results in the first two weeks in November. We believe that the third quarter will reflect an influx of Political advertising, even though the lion’s share of the Political advertising likely will fall in the fourth quarter. Consequently, we believe that the third quarter revenue growth will be better than the second quarter, showing some acceleration. With signs of weakening National advertising, and a likely weakening Local advertising environment in some larger markets, broadcasters are looking forward toward Q4 Political as an offset. Many broadcasters indicated that Political advertising may be at record levels in 2022, even higher than the Presidential election year of 2020. Political advertising, however, is not usually evenly spent across all markets. As such, there may be winners and some disappointment.
Investors are not encouraged to buy a Television broadcaster on the basis of the upcoming fourth quarter Political advertising influx. There are broader issues at play, like cord cutting, slowing Retransmission revenue growth, and the prospect for a weakening economy. We believe broadcasters with minimal emphasis on National advertising, a larger focus on small to medium size markets and local advertising, are best positioned to weather an economic downturn. We also like companies that do not have high debt leverage. In addition, we like diversified companies that can benefit from cord cutting, like E.W. Scripps, or have diversified revenue streams and large fast growing digital businesses, like Entravision. As Figure #11 TV Industry Comparables illustrate, the shares of Entravision are among the cheapest in the industry and the EVC shares leads our favorites in the industry.
Figure #9 TV Industry Q2 YoY Revenue Growth
Source: Eikon and Company filings
Figure #10 TV Industry Q2 EBITDA Margins
Source: Eikon and Company filings
Figure #11 TV Industry Comparables
Source: Eikon, Company filings and Nobles estimates
Radio Broadcasting
Polishing its tarnished image
One of the epic fails of the radio industry has been Audacy, once one of the leadership companies in the industry. The AUD shares are down a staggering 95% from highs in March 2021. The poor stock performance reflects the poor revenue and cash flow performance and high debt levels at the company. Recently, the company announced that it plans to sell some of its prized assets, including its podcasting business, Cadence 13, in an effort to more aggressively pare down debt. While Audacy struggles, there are emerging leaders in the industry, many that are not focused on its radio business, discussed later in this report.
As Figure #12 Radio Industry Q2 YoY Revenue Growth chart illustrates, the average radio revenue grew 8.9%. Companies that were at the top of the list of revenue growth had diversified revenue streams. Townsquare Media was the best performer, with Q2 revenue growth of 13.6%. We believe that Townsquare also benefits from significantly lower National advertising and concentration on less cyclical larger markets. Other diversified companies that performed better than the lower growth companies in the group were Salem Media and Beasley Broadcasting. Salem Media has diversified into content creation and digital media and Beasley recently accelerated its push into Digital Media. Separately, Beasley recently announced a station swap with Audacy, which will enhance its position with its four existing stations in Las Vegas.
On the margin front, Townsquare Media also was among the leaders in the industry. Notably, Townsquare Media’s digital business carries margins similar to its Radio businesses, near 30%. As such, its investments in Digital Media are not depressing its total company margins. As Figure #13 Q2 Radio Industry EBITDA Margins illustrate, Townsquare’s Q2 adj. EBITDA margins were 26.6%, well above that of the larger industry peers like iHeart (24.9%), Cumulus Media (19.2%), and Audacy (12.0%).
In looking forward toward the upcoming third quarter results, which will be released in coming weeks, we believe that the effects of rising inflation and weakening economy will start to show. Many of the larger broadcasters which focus on larger markets, have national network business, may disappoint. In addition, we believe that there will be spotty Political advertising performances. In our view, the resulting potential weakness in the stocks may create an opportunity to more aggressively accumulate or establish positions.
Radio stocks largely mirrored the performance of the TV industry, falling 9% in the third quarter, illustrated above, in Figure #8 Traditional Media Q3 Stock Performance. Last quarter we pointed out that large industry players such as Audacy and iHeart had an outsized negative impact on the market cap-weighted index. This was due to the stocks being downgraded by a Wal Street firm on the basis of high leverage in a time of recession.
However, there are several broadcasters in the Radio industry with improving leverage profiles. Furthermore, we believe that in a time when traditional radio companies are making a transition to more digitally based revenue sources, investors would do well to differentiate among them on that basis as well. In our view, certain companies are ahead of peers in the digital transformation and are better shielded from certain fundamental headwinds that have traditionally plagued radio broadcasters in prior recessions. We encourage investors to focus on Townsquare Media (TSQ), Salem Media (SALM), and Beasley Broadcasting (BBGI). As Figure #14 Radio Industry Comparables highlights, Townsquare Media, Cumulus Media, and Salem Media are among the cheapest in the group.
Figure #12 Radio Industry Q2 YoY Revenue Growth
Source: Eikon and Company filings
Figure #13 Q2 Radio Industry EBITDA Margins
Source: Eikon and Company filings
Figure #14 Radio Industry Comparables
Source: Eikon, Company filings and Nobles estimates
Publishing
Once a leader, now a loser
It is hard to believe that Gannett was once a $90 stock and held a record for one of the longest strings of quarterly earnings gains in the S&P 500 Index. The shares are down 80% from year earlier highs to near $1.37. For some anti newspaper investors, this is a “told you so” moment. But, this view missed notable exceptions, like the New York Times, which seemed to transition more quickly toward Digital revenues. There are publishers that are set apart from the weak trends at Gannett and are on a favorable trajectory toward a Digital future. As such, we believe that investors should not throw the baby out with the bathwater or avoid the industry. There are gems here, which is discussed later in this report.
There were sizable differences in the financial performance of the companies in the publishing group. As Figure #15 Publishing Industry Q2 YoY Revenue Performance chart illustrates, Q2 publishing revenue declined on average 1.5%. The notable exceptions to this performance was The New York Times, up 11.5%, News Corp, up 7.3%, and Lee Enterprises, down a modest 0.7%. The improved performance into the ranks of the leaders in the industry is quite notable. Lee’s digital subscriptions currently lead the industry. The company has exceeded all of its peers in terms of digital subscription growth in the past 11 consecutive quarters. Furthermore, over 50% of its advertising is derived from digital. Currently, roughly 30% of the company total revenues are derived from Digital, still short of the 55% at The New York Times, but closing the gap.
Not only is Lee performing well on the Digital revenue front, it has industry leading margins. As Figure #16 Q2 Publishing Industry EBITDA Margins illustrates, Lee’s Q2 EBITDA margins were 11.8%, in line with News Corp and second only to the New York Times at 17.4%. We believe that margins should improve over time as the company continues to migrate toward a higher digital margin business model.
Illustrated above in Figure #8 Traditional Media Q3 Stock Performance is Noble’s Publishing Index, which decreased a modest 2.4% in the quarter, outperforming the S&P (-5.3%). The relatively favorable performance of the index was primarily due to its largest constituents, News Corp. and The New York Times, which rebounded from -29.7% and -39.1%, respectively in Q2, to -3% and +3%, respectively, in Q3. The average percentage change of the stocks in the industry was -16.2%, more in line with Traditional Media as a whole. One of the poor performing stocks in the index for the quarter was Gannett (GCI) which declined 47%. It was recently reported that the company implemented austerity measures included unpaid leave and voluntary layoffs. In the case of Lee Enterprises, the shares were down a much more modest 7%, more in line with the general market. In our view, the company is expected to report favorable third quarter results and the shares are undervalued.
As Figure #17 Publishing Industry Comparables chart illustrates, the LEE shares trade at an average industry multiple of 5.8 times Enterprise Value to our 2023 adj. EBITDA estimate. Notably, the company is closing the gap with its Digital Media revenue contribution to that of New York Times, which is currently trading at an estimated 14.5 times EV to 2023 adj. EBITDA. We believe that the valuation gap with the New York Times should close as well. In recent Lee Enterprise news, a buyout specialist investor filed a 13D and indicated interest in taking the company private.While financial players continue to circle the wagons for Lee, we believe that investors should take note. In our view, the LEE shares are compelling and offer a favorable risk/reward relationship.
Figure #15 Publishing Industry Q2 YoY Revenue Growth
Source: Eikon and Company filings
Figure #16 Q2 Publishing Industry EBITDA Margins
Source: Eikon and Company filings
Figure #17 Publishing Industry Comparables
Source: Eikon, Company filings and Nobles estimates
Reports with important disclosure information of companies highlighted in this report may be found here:
All statements or opinions contained herein that include the words “we”, “us”, or “our” are solely the responsibility of Noble Capital Markets, Inc.(“Noble”) and do not necessarily reflect statements or opinions expressed by any person or party affiliated with the company mentioned in this report. Any opinions expressed herein are subject to change without notice. All information provided herein is based on public and non-public information believed to be accurate and reliable, but is not necessarily complete and cannot be guaranteed. No judgment is hereby expressed or should be implied as to the suitability of any security described herein for any specific investor or any specific investment portfolio. The decision to undertake any investment regarding the security mentioned herein should be made by each reader of this publication based on its own appraisal of the implications and risks of such decision.
This publication is intended for information purposes only and shall not constitute an offer to buy/sell or the solicitation of an offer to buy/sell any security mentioned in this report, nor shall there be any sale of the security herein in any state or domicile in which said offer, solicitation or sale would be unlawful prior to registration or qualification under the securities laws of any such state or domicile. This publication and all information, comments, statements or opinions contained or expressed herein are applicable only as of the date of this publication and subject to change without prior notice. Past performance is not indicative of future results. Noble accepts no liability for loss arising from the use of the material in this report, except that this exclusion of liability does not apply to the extent that such liability arises under specific statutes or regulations applicable to Noble. This report is not to be relied upon as a substitute for the exercising of independent judgement. Noble may have published, and may in the future publish, other research reports that are inconsistent with, and reach different conclusions from, the information provided in this report. Noble is under no obligation to bring to the attention of any recipient of this report, any past or future reports. Investors should only consider this report as single factor in making an investment decision.
IMPORTANT DISCLOSURES
This publication is confidential for the information of the addressee only and may not be reproduced in whole or in part, copies circulated, or discussed to another party, without the written consent of Noble Capital Markets, Inc. (“Noble”). Noble seeks to update its research as appropriate, but may be unable to do so based upon various regulatory constraints. Research reports are not published at regular intervals; publication times and dates are based upon the analyst’s judgement. Noble professionals including traders, salespeople and investment bankers may provide written or oral market commentary, or discuss trading strategies to Noble clients and the Noble proprietary trading desk that reflect opinions that are contrary to the opinions expressed in this research report. The majority of companies that Noble follows are emerging growth companies. Securities in these companies involve a higher degree of risk and more volatility than the securities of more established companies. The securities discussed in Noble research reports may not be suitable for some investors and as such, investors must take extra care and make their own determination of the appropriateness of an investment based upon risk tolerance, investment objectives and financial status.
Company Specific Disclosures
The following disclosures relate to relationships between Noble and the company (the “Company”) covered by the Noble Research Division and referred to in this research report. Noble is not a market maker in any of the companies mentioned in this report. Noble intends to seek compensation for investment banking services and non-investment banking services (securities and non-securities related) with any or all of the companies mentioned in this report within the next 3 months
ANALYST CREDENTIALS, PROFESSIONAL DESIGNATIONS, AND EXPERIENCE
Senior Equity Analyst focusing on Basic Materials & Mining. 20 years of experience in equity research. BA in Business Administration from Westminster College. MBA with a Finance concentration from the University of Missouri. MA in International Affairs from Washington University in St. Louis. Named WSJ ‘Best on the Street’ Analyst and Forbes/StarMine’s “Best Brokerage Analyst.” FINRA licenses 7, 24, 63, 87
WARNING
This report is intended to provide general securities advice, and does not purport to make any recommendation that any securities transaction is appropriate for any recipient particular investment objectives, financial situation or particular needs. Prior to making any investment decision, recipients should assess, or seek advice from their advisors, on whether any relevant part of this report is appropriate to their individual circumstances. If a recipient was referred to Noble Capital Markets, Inc. by an investment advisor, that advisor may receive a benefit in respect of transactions effected on the recipients behalf, details of which will be available on request in regard to a transaction that involves a personalized securities recommendation. Additional risks associated with the security mentioned in this report that might impede achievement of the target can be found in its initial report issued by Noble Capital Markets, Inc.. This report may not be reproduced, distributed or published for any purpose unless authorized by Noble Capital Markets, Inc..
RESEARCH ANALYST CERTIFICATION
Independence Of View All views expressed in this report accurately reflect my personal views about the subject securities or issuers.
Receipt of Compensation No part of my compensation was, is, or will be directly or indirectly related to any specific recommendations or views expressed in the public appearance and/or research report.
Ownership and Material Conflicts of Interest Neither I nor anybody in my household has a financial interest in the securities of the subject company or any other company mentioned in this report.


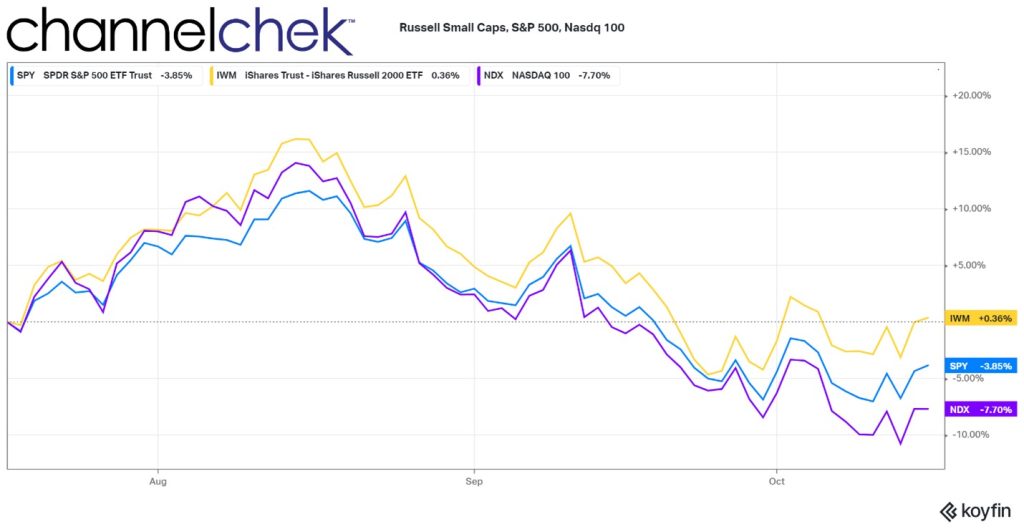


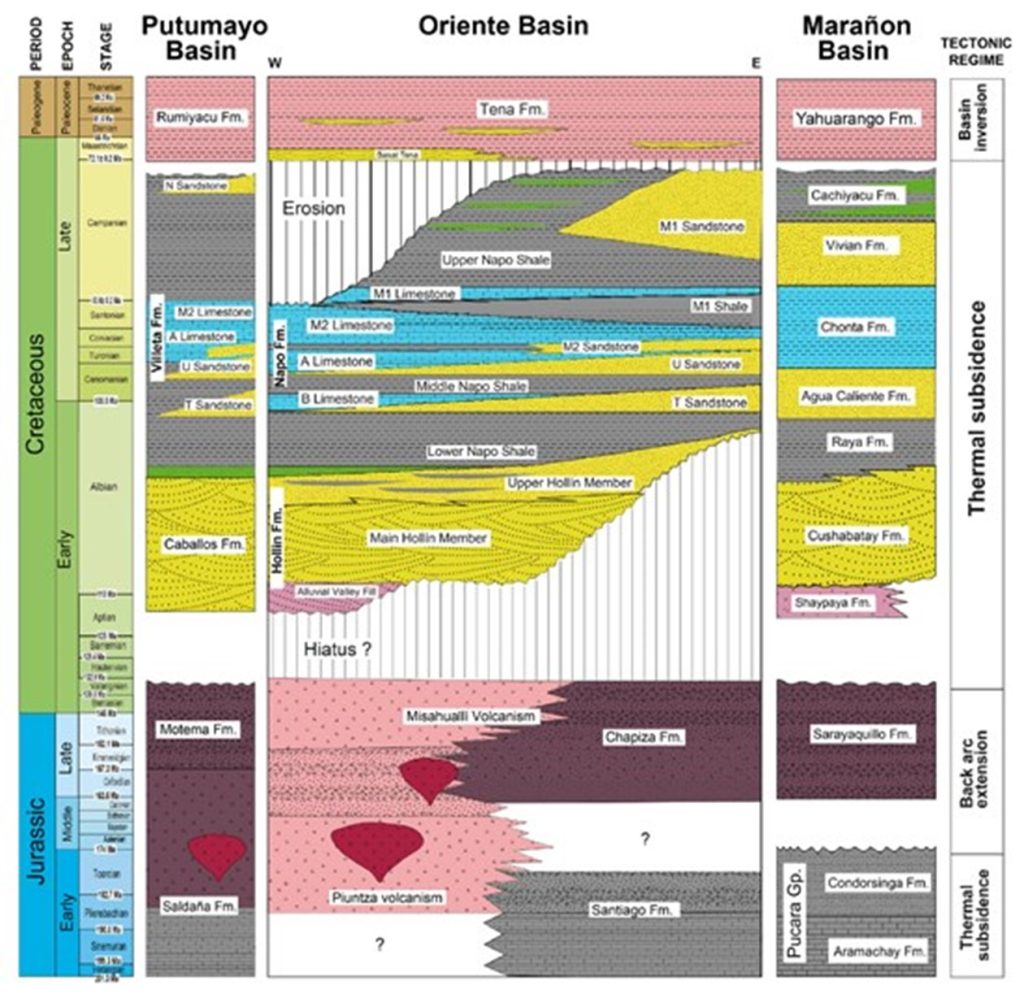
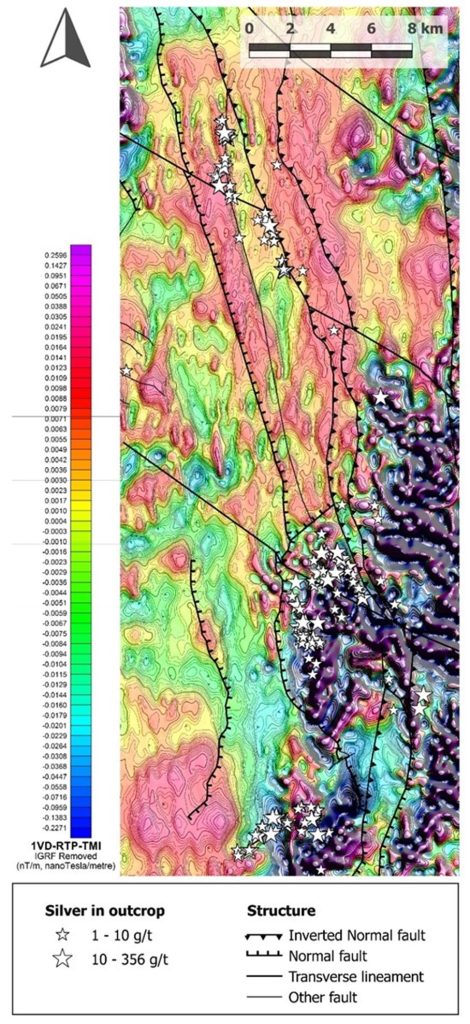

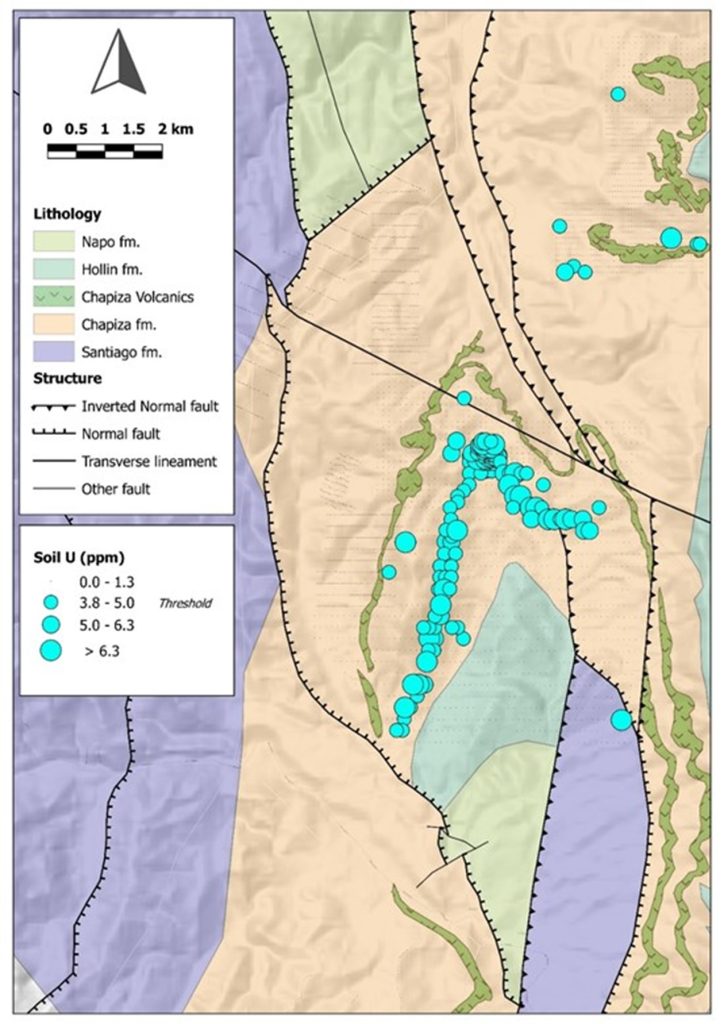
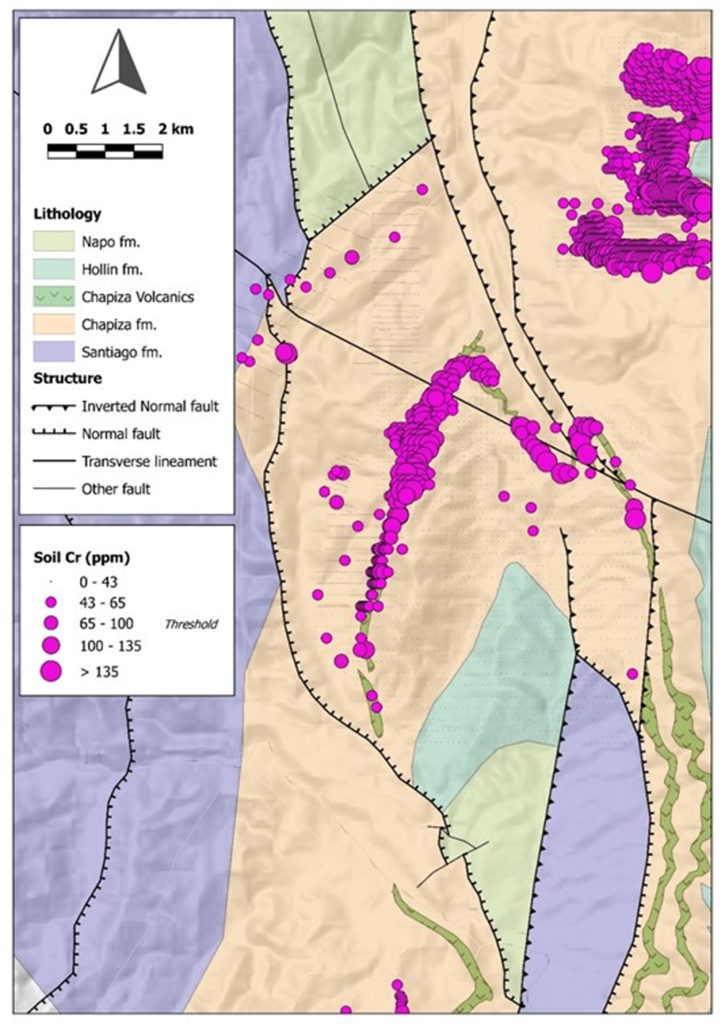
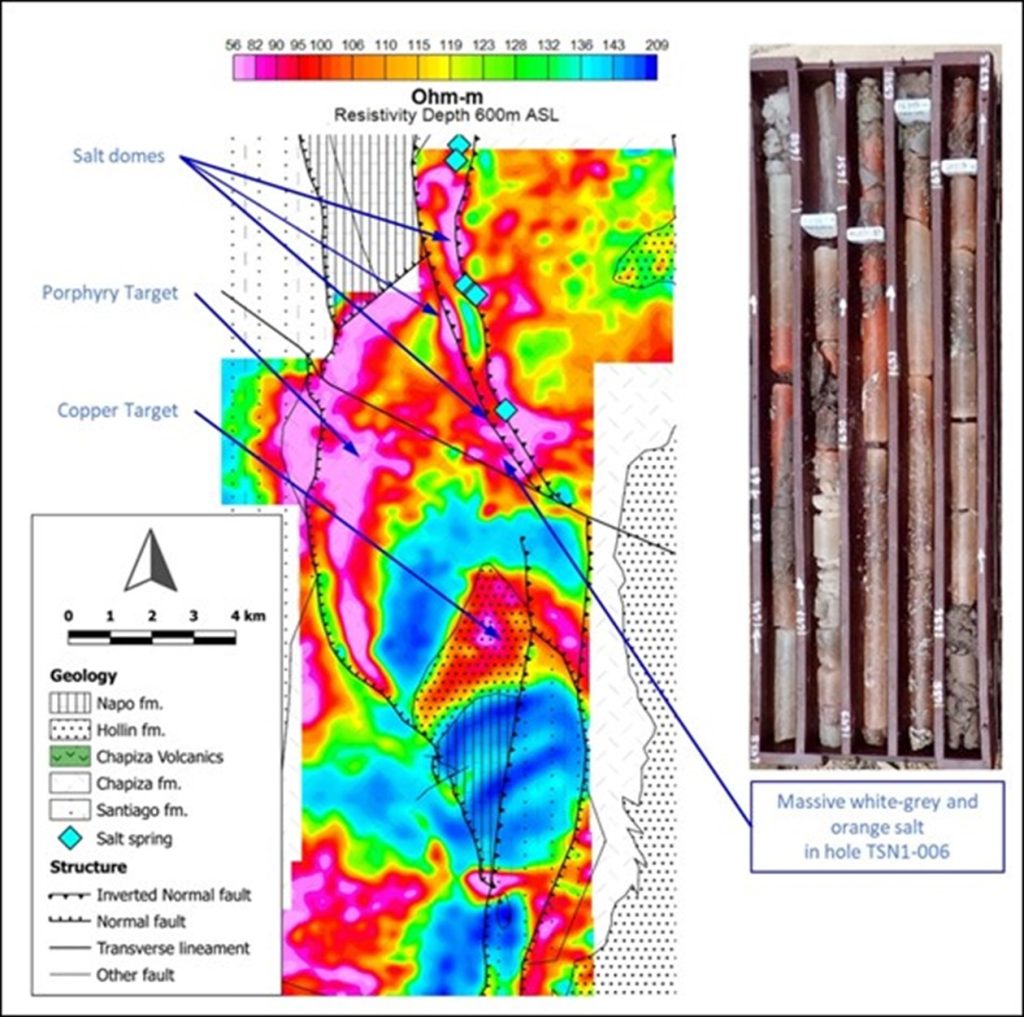
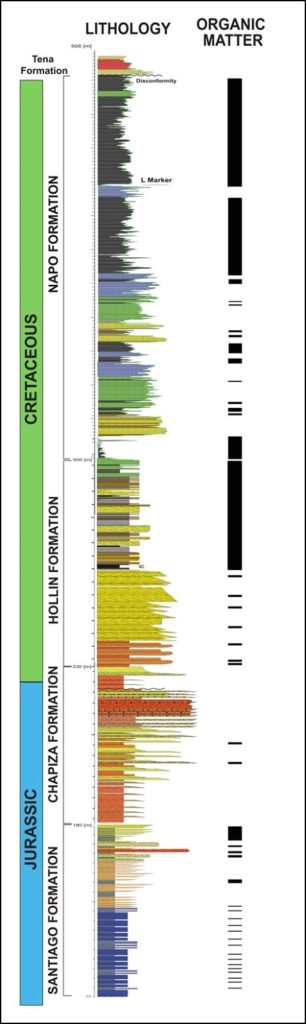


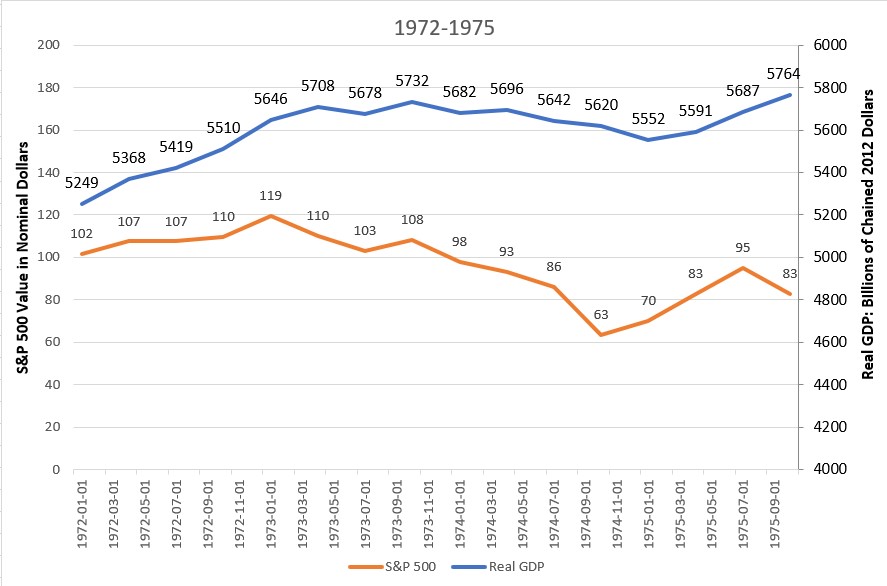
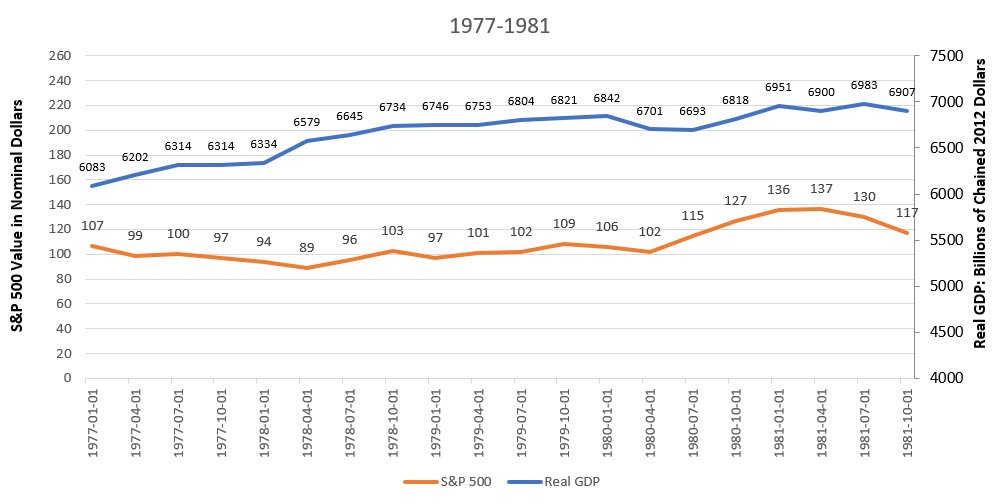
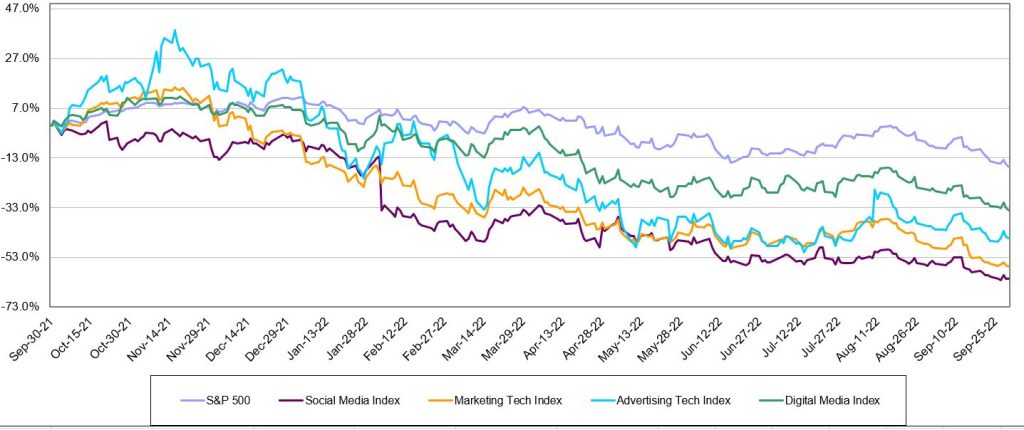
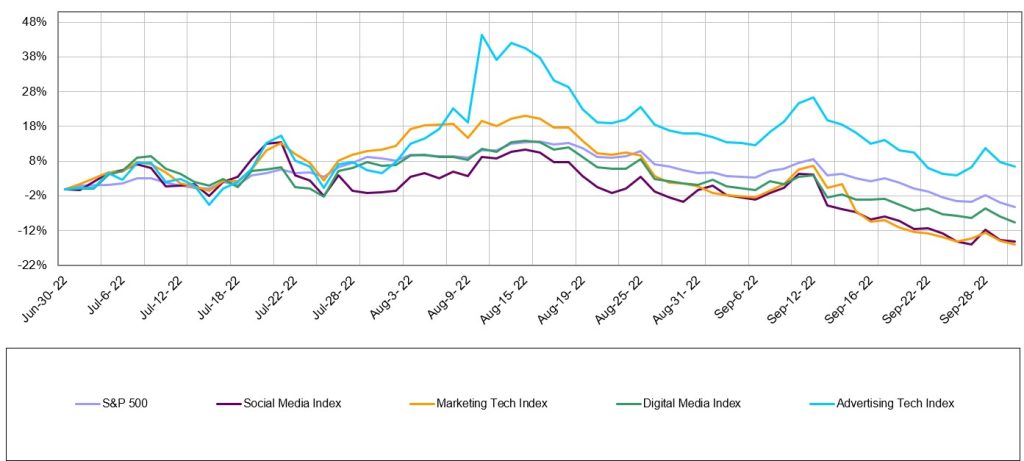
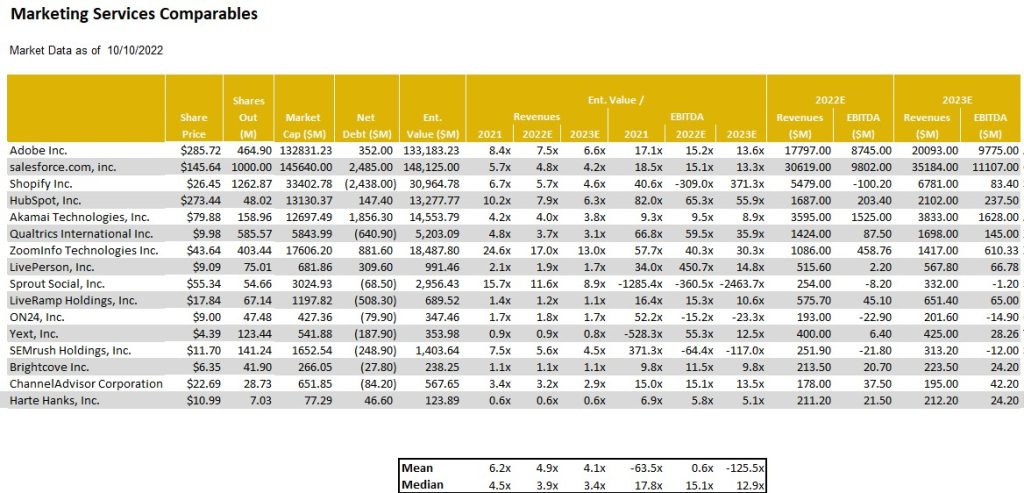
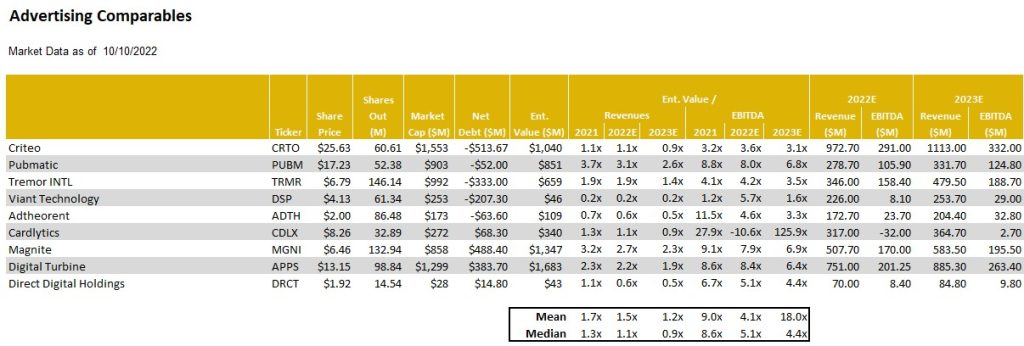
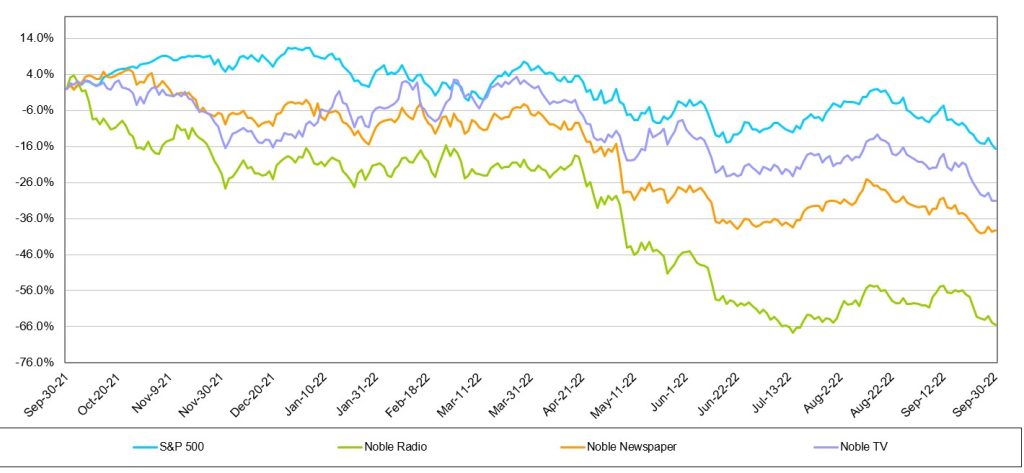
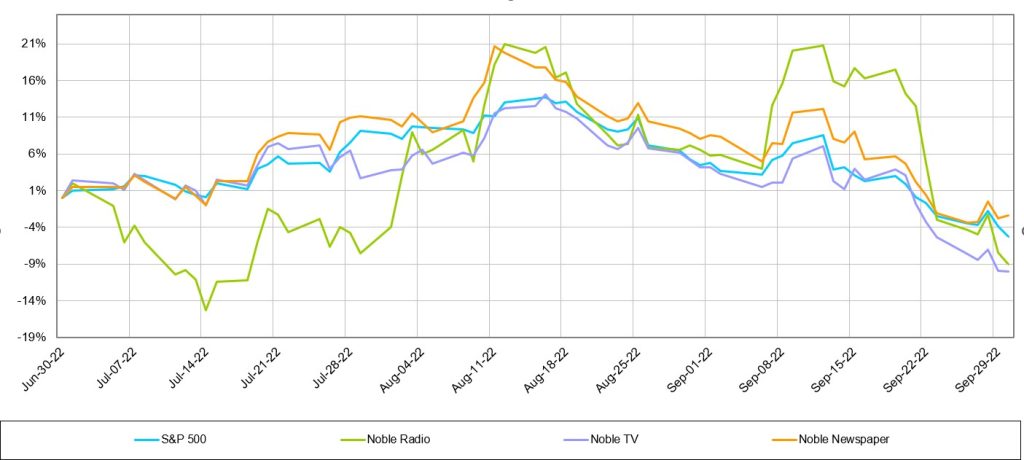
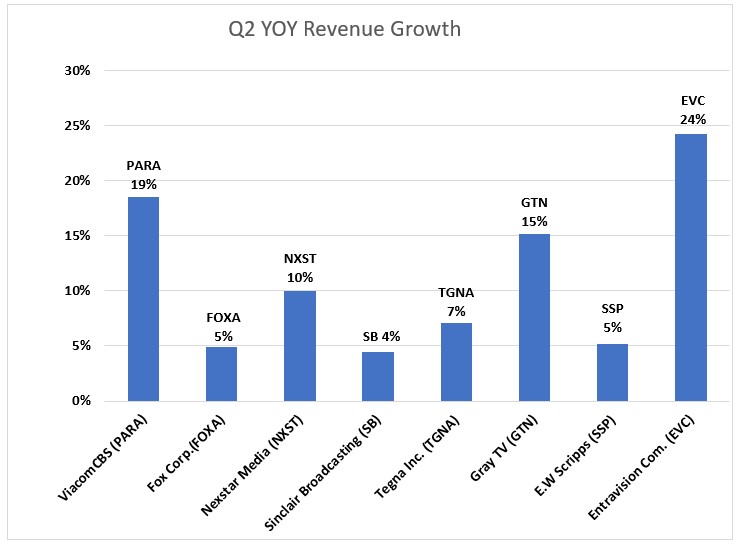
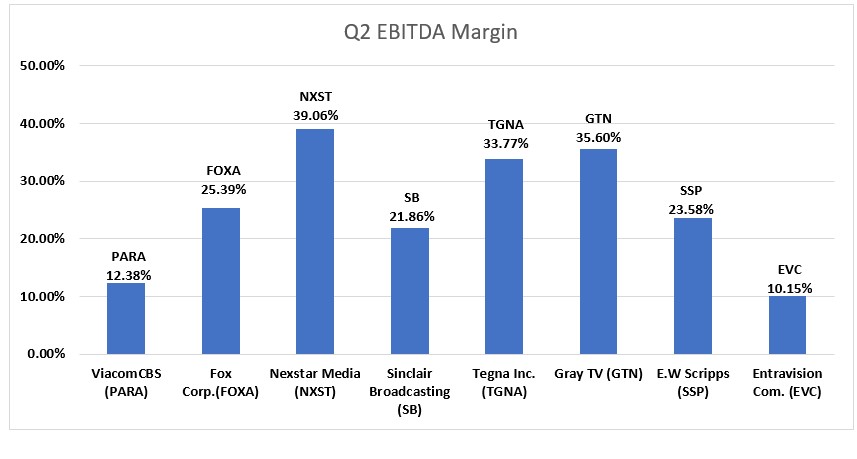
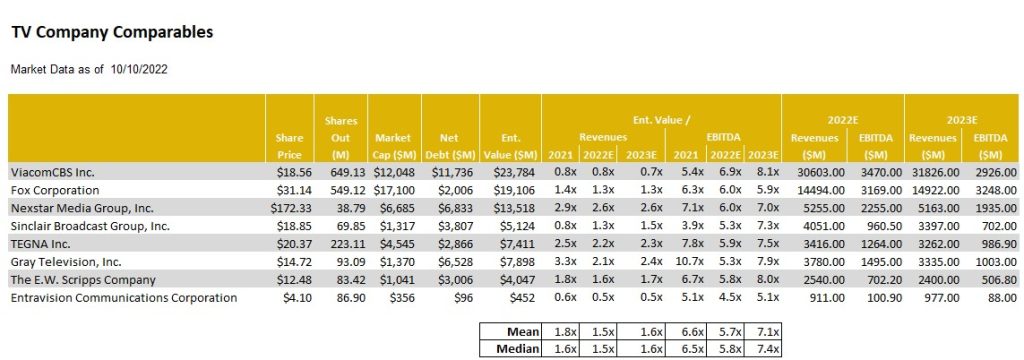
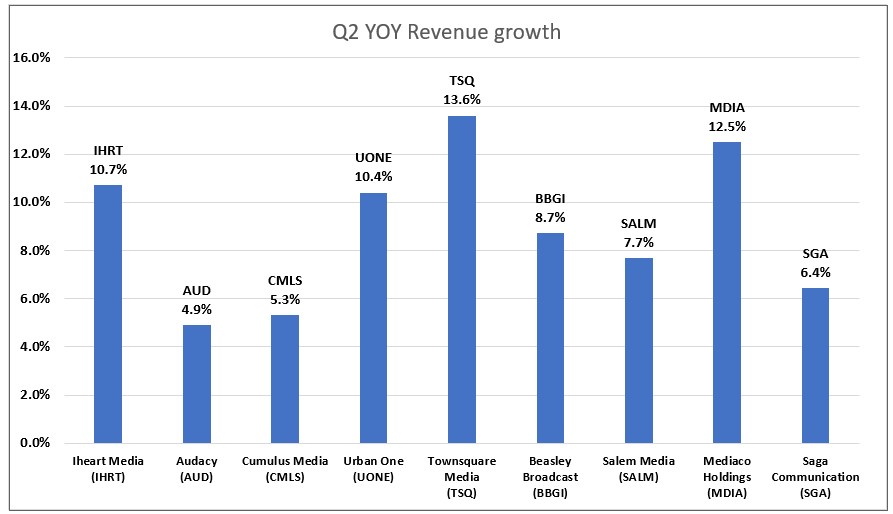
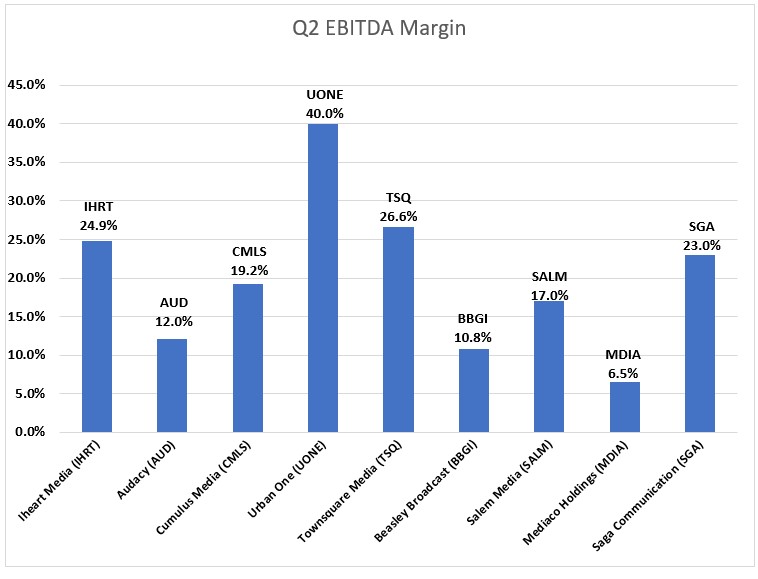
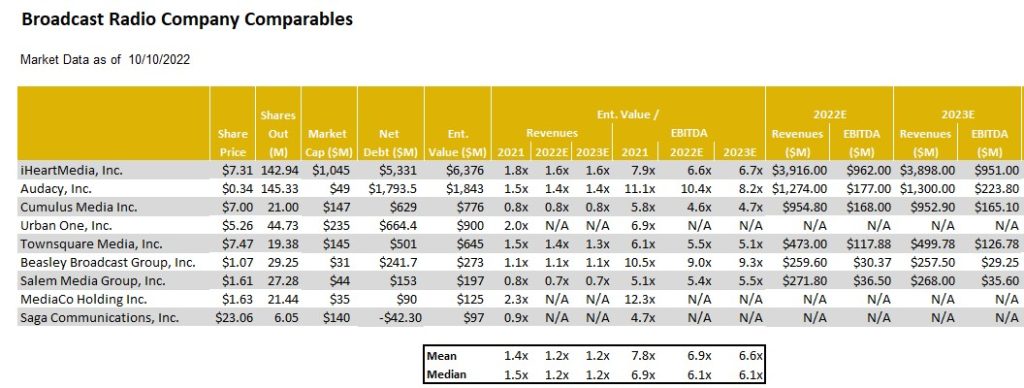
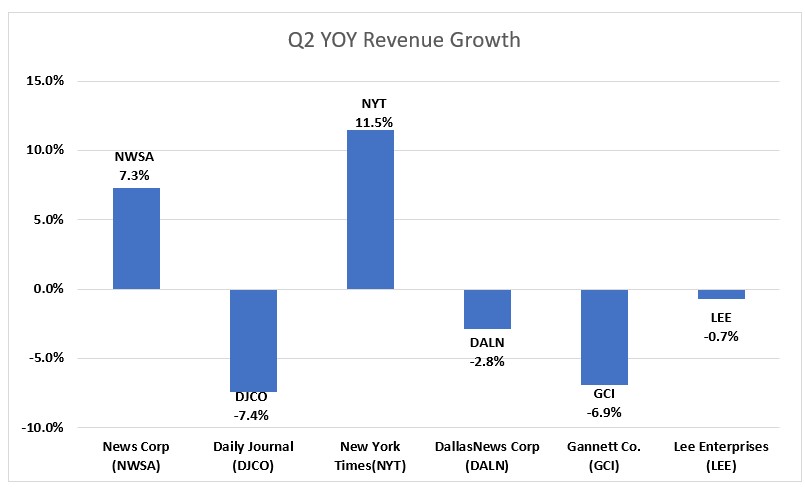
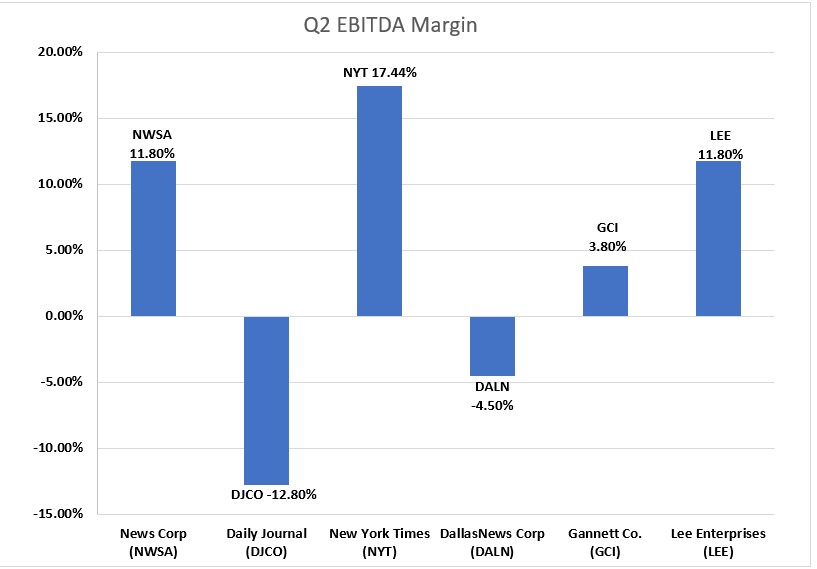
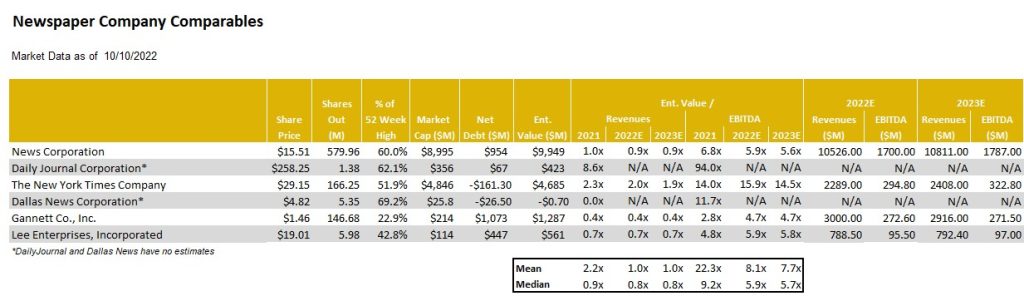
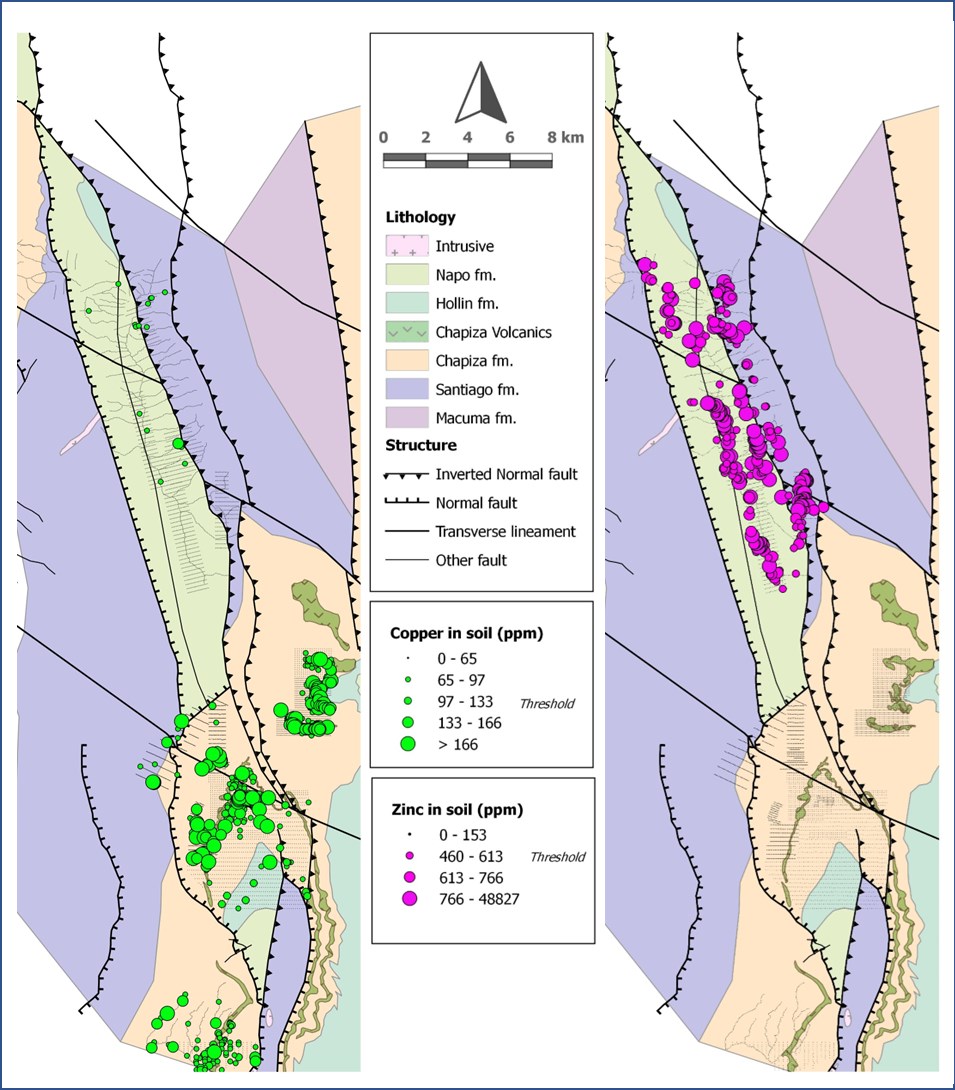