Los Angeles, CA, Nov. 07, 2022 (GLOBE NEWSWIRE) — FAT (Fresh. Authentic. Tasty) Brands Inc. (Nasdaq: FAT) today announced that it has withdrawn its previously announced proposed registered public offering of shares of its Class A Common Stock as a result of market conditions.
Andy Wiederhorn, the Company’s Chief Executive Officer, said, “This transaction was opportunistic in nature. While we appreciate the significant interest in the proposed offering, we have concluded that the current terms and conditions available in the market were not sufficiently attractive for us to move forward with a transaction at this time. We will continue to monitor market conditions and evaluate whether to pursue another offering in the future.”
This press release shall not constitute an offer to sell or the solicitation of an offer to buy, nor shall there be any sale of these securities in any state or jurisdiction in which such offer, solicitation or sale would be unlawful prior to registration or qualification under the securities laws of such state or jurisdiction.
About FAT (Fresh. Authentic. Tasty.) Brands
FAT Brands (NASDAQ: FAT) is a leading global franchising company that strategically acquires, markets, and develops fast casual, quick-service, casual dining, and polished casual dining concepts around the world. The Company currently owns 17 restaurant brands: Round Table Pizza, Fatburger, Marble Slab Creamery, Johnny Rockets, Fazoli’s, Twin Peaks, Great American Cookies, Hot Dog on a Stick, Buffalo’s Cafe & Express, Hurricane Grill & Wings, Pretzelmaker, Elevation Burger, Native Grill & Wings, Yalla Mediterranean and Ponderosa and Bonanza Steakhouses, and franchises and owns over 2,300 units worldwide. For more information on FAT Brands, please visit www.fatbrands.com.
Forward Looking Statements
This press release contains forward-looking statements within the meaning of the Private Securities Litigation Reform Act of 1995. Forward-looking statements are subject to significant business, economic and competitive risks, uncertainties and contingencies including, but not limited to, uncertainties surrounding the severity, duration and effects of the COVID-19 pandemic, many of which are difficult to predict and beyond our control, which could cause our actual results to differ materially from the results expressed or implied in such forward-looking statements. We refer you to the documents we file from time to time with the Securities and Exchange Commission, such as our reports on Form 10-K, Form 10-Q and Form 8-K, for a discussion of these and other risks, uncertainties and contingencies. We undertake no obligation to update any forward-looking statement to reflect events or circumstances occurring after the date of this press release.
Newrange is focused on district-scale exploration for precious metals in the prolific Red Lake District of northwestern Ontario. The past-producing high-grade Argosy Gold Mine is open to depth, while the adjacent North Birch Project offers additional blue-sky potential. Focused on developing shareholder value through exploration and development of key projects, the Company is committed to building sustainable value for all stakeholders. Further information can be found on our website at www.newrangegold.com .
Mark Reichman, Senior Research Analyst, Natural Resources, Noble Capital Markets, Inc.
Refer to the full report for the price target, fundamental analysis, and rating.
Creating a new silver-focused development and production company. Newrange recently signed a definitive agreement with Great Panther Mining Limited (NYSE American, GPL) to acquire a 100% interest in the past-producing Coricancha mine in central Peru. Coricancha is a high-grade, narrow-vein, gold-silver-copper-lead-zinc underground mine in the Central Polymetallic Belt of Peru and will take the stage as the company’s flagship project. It is ninety kilometers east of Lima and includes a 600-tonne per day processing plant, dry-stack tailings storage facility and requisite surface and underground infrastructure.
Acquisition terms. Newrange has agreed to make a single cash payment of US$750,000 to Great Panther upon closing. Because the transaction is on a cash basis, it does not require shareholder approval. Newrange is considering a “one new for six old” share consolidation and subsequent name change to be effective upon closing. Closing is subject to certain conditions, including financing by Newrange, and receipt of all necessary third-party approvals, including by the TSX Venture Exchange.
This Company Sponsored Research is provided by Noble Capital Markets, Inc., a FINRA and S.E.C. registered broker-dealer (B/D).
*Analyst certification and important disclosures included in the full report. NOTE: investment decisions should not be based upon the content of this research summary. Proper due diligence is required before making any investment decision.
ISG (Information Services Group) (Nasdaq: III) is a leading global technology research and advisory firm. A trusted business partner to more than 700 clients, including more than 75 of the world’s top 100 enterprises, ISG is committed to helping corporations, public sector organizations, and service and technology providers achieve operational excellence and faster growth. The firm specializes in digital transformation services, including automation, cloud and data analytics; sourcing advisory; managed governance and risk services; network carrier services; strategy and operations design; change management; market intelligence and technology research and analysis. Founded in 2006, and based in Stamford, Conn., ISG employs more than 1,300 digital-ready professionals operating in more than 20 countries—a global team known for its innovative thinking, market influence, deep industry and technology expertise, and world-class research and analytical capabilities based on the industry’s most comprehensive marketplace data. For additional information, visit www.ISG-One.com
Joe Gomes, Senior Research Analyst, Noble Capital Markets, Inc.
Joshua Zoepfel, Research Associate, Noble Capital Markets, Inc.
Refer to the full report for the price target, fundamental analysis, and rating.
Business Remains on Track. Information Services Group remains on track to post record revenue and adjusted EBITDA. According to management, demand remains strong for digital services, driving a strong profitable mix of products and services, while ISG continues to see an uptick in demand for its cost takeout services given the uncertain economic environment.
Priming the Pump for Additional Growth. ISG added 56 professionals during the quarter, an increase of 3.8%. The new hires are expected to focus on the higher growth digital and recurring revenue opportunities. During the quarter, ISG serviced 625 clients, including 65 new to ISG, both up from the prior year and quarter-over-quarter.
This Company Sponsored Research is provided by Noble Capital Markets, Inc., a FINRA and S.E.C. registered broker-dealer (B/D).
*Analyst certification and important disclosures included in the full report. NOTE: investment decisions should not be based upon the content of this research summary. Proper due diligence is required before making any investment decision.
Gray Television is a multimedia company headquartered in Atlanta, Georgia. We are the nation’s largest owner of top-rated local television stations and digital assets in the United States. Our television stations serve 113 television markets that collectively reach approximately 36 percent of US television households. This portfolio includes 80 markets with the top-rated television station and 100 markets with the first and/or second highest rated television station. We also own video program companies Raycom Sports, Tupelo Honey, PowerNation Studios and Third Rail Studios.
Michael Kupinski, Director of Research, Noble Capital Markets, Inc.
Patrick McCann, Research Associate, Noble Capital Markets, Inc.
Refer to the full report for the price target, fundamental analysis, and rating.
Q3 below expectations. The company reported Q3 revenue of $909 million, 4% below our estimate of $948 million. The revenue variance was due to lower than expected Political advertising. Adj. EBITDA of $336 million was 11% below our estimate of $377 million, surprisingly good given the absence of $50 million in high margin revenue.
Political below forecast. The quarterly miss was due primarily to lower-than-expected Political revenue, $144 million compared with our estimate of $194 million. Political advertising shifted toward some of the tight races in larger markets. Nonetheless, for the first nine months of the year, Political revenue was just 3.5% below the cyclical high Presidential election of 2020, on a combined historic basis.
This Research is provided by Noble Capital Markets, Inc., a FINRA and S.E.C. registered broker-dealer (B/D).
*Analyst certification and important disclosures included in the full report. NOTE: investment decisions should not be based upon the content of this research summary. Proper due diligence is required before making any investment decision.
Eagle Bulk Shipping Inc. (“Eagle”) is a US-based drybulk owner-operator focused on the Supramax/Ultramax mid-size asset class, which ranges from 50,000 and 65,000 deadweight tons in size; these vessels are equipped with onboard cranes allowing for the self-loading and unloading of cargoes, a feature which distinguishes them from the larger classes of drybulk vessels and provides for greatly enhanced flexibility and versatility- both with respect to cargo diversity and port accessibility. The Company transports a broad range of major and minor bulk cargoes around the world, including coal, grain, ore, pet coke, cement, and fertilizer. Eagle operates out of three offices, Stamford (headquarters), Singapore, and Hamburg, and performs all aspects of vessel management in-house including: commercial, operational, technical, and strategic.
Michael Heim, CFA, Senior Research Analyst, Noble Capital Markets, Inc.
Refer to the full report for the price target, fundamental analysis, and rating.
Eagle reported 2002-3Q Net Revenues of $185.3 million on TCE rates of $28,099. We had recently lowered our net revenue estimate to $158.9 million based on an assumed TCE rate to $25,000. Higher-than-expected revenues reflect a high level of charter-in days (1000 versus our 600 assumption) and an impressive utilization rate of 99.7%. The company has 70% of fourth-quarter available days covered at $25,040 which compares favorably with our models.
But costs were higher. Eagle reported 2002-3Q voyage expenses of $40.8 million versus $30.3 million last year and our estimate of $25.6 million. Voyage operating expenses were $33.1 million versus $28.1 million and our $27.5 million estimate. G&A expenses were $9.7 million versus $7.9 million and our $8.4 million estimate. Higher costs reflect industry trends but bear watching going forward.
What is Inflammation? Two Immunologists Explain How the Body Responds to Everything from Stings to Vaccination and Why it Sometimes Goes Wrong
When your body fights off an infection, you develop a fever. If you have arthritis, your joints will hurt. If a bee stings your hand, your hand will swell up and become stiff. These are all manifestations of inflammation occurring in the body.
We are two immunologists who study how the immune system reacts during infections, vaccination and autoimmune diseases where the body starts attacking itself.
This article was republished with permission from The Conversation, a news site dedicated to sharing ideas from academic experts. It represents the research-based findings and thoughts of Prakash Nagarkatti, Professor of Pathology, Microbiology and Immunology, University of South Carolina and Mitzi Nagarkatti Professor of Pathology, Microbiology and Immunology, University of South Carolina
While inflammation is commonly associated with the pain of an injury or the many diseases it can cause, it is an important part of the normal immune response. The problems arise when this normally helpful function overreacts or overstays its welcome.
What is Inflammation?
Generally speaking, the term inflammation refers to all activities of the immune system that occur where the body is trying to fight off potential or real infections, clear toxic molecules or recover from physical injury. There are five classic physical signs of acute inflammation: heat, pain, redness, swelling and loss of function. Low-grade inflammation might not even produce noticeable symptoms, but the underlying cellular process is the same.
Take a bee sting, for example. The immune system is like a military unit with a wide range of tools in its arsenal. After sensing the toxins, bacteria and physical damage from the sting, the immune system deploys various types of immune cells to the site of the sting. These include T cells, B cells, macrophages and neutrophils, among other cells.
The B cells produce antibodies. Those antibodies can kill any bacteria in the wound and neutralize toxins from the sting. Macrophages and neutrophils engulf bacteria and destroy them. T cells don’t produce antibodies, but kill any virus-infected cell to prevent viral spread.
Additionally, these immune cells produce hundreds of types of molecules called cytokines – otherwise known as mediators – that help fight threats and repair harm to the body. But just like in a military attack, inflammation comes with collateral damage.
The mediators that help kill bacteria also kill some healthy cells. Other similar mediating molecules cause blood vessels to leak, leading to accumulation of fluid and influx of more immune cells.
This collateral damage is the reason you develop swelling, redness and pain around a bee sting or after getting a flu shot. Once the immune system clears an infection or foreign invader – whether the toxin in a bee sting or a chemical from the environment – different parts of the inflammatory response take over and help repair the damaged tissue.
After a few days, your body will neutralize the poison from the sting, eliminate any bacteria that got inside and heal any tissue that was harmed.
Asthma is caused by inflammation that leads to swelling and a narrowing of airways in the lungs, as seen in the right cutaway in this image. BruceBlaus/Wikimedia Commons, CC BY-SA
Inflammation as a Cause of Disease
Inflammation is a double-edged sword. It is critical for fighting infections and repairing damaged tissue, but when inflammation occurs for the wrong reasons or becomes chronic, the damage it causes can be harmful.
Allergies, for example, develop when the immune system mistakenly recognizes innocuous substances – like peanuts or pollen – as dangerous. The harm can be minor, like itchy skin, or dangerous if someone’s throat closes up.
Chronic inflammation damages tissues over time and can lead to many noninfectious clinical disorders, including cardiovascular diseases, neurodegenerative disorders, obesity, diabetes and some types of cancers.
The immune system can sometimes mistake one’s own organs and tissues for invaders, leading to inflammation throughout the body or in specific areas. This self-targeted inflammation is what causes the symptoms of autoimmune diseases such as lupus and arthritis.
Another cause of chronic inflammation that researchers like us are currently studying is defects in the mechanisms that curtail inflammation after the body clears an infection.
While inflammation mostly plays out at a cellular level in the body, it is far from a simple mechanism that happens in isolation. Stress, diet and nutrition, as well as genetic and environmental factors, have all been shown to regulate inflammation in some way.
There is still a lot to be learned about what leads to harmful forms of inflammation, but a healthy diet and avoiding stress can go a long way toward helping maintain the delicate balance between a strong immune response and harmful chronic inflammation.
Why the Future Value of the Lottery’s Grand Prize is Significantly Higher than Last Year
There is a link between the current $1.9 billion Powerball prize money and Federal Reserve Chair Jerome Powell – and it is inflating the prize money.
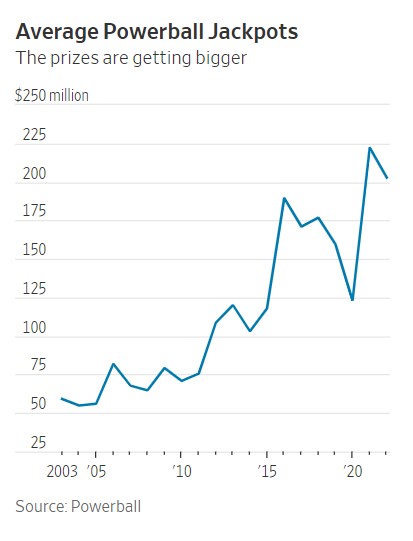
A new billionaire was not minted over the weekend, at least not because of winning the enormous Powerball jackpot prize. So the weekend prize money, plus a small fortune more, is up for grabs at 10:59 PM Monday, November 7. The headline prize money, in this case, $1.9 billion, is the future value of the cash award, which, according to Powerball.com, is $929.1 million. The larger, almost two billion amount, would not have been nearly as large last year. Its sum is much bigger because the Fed has been jacking up interest rates.
To drill down a bit more, the prize calculation uses the 30-year U.S. Treasury bond interest rate to determine the annuity paid to the winner based on the cash lump sum award. The present value of that number, even if on par with a cash award a year ago, would pay a substantially larger annuity. And it is the annuity that is the advertised prize, which draws more and more players as it grows. The more players, the higher the present value or cash prize.
A year ago (November 8, 2021), the 30-year US Treasury bond had a yield of 1.90%. This was used to calculate the headline prize amount. Today, the same term Treasury is yielding 4.27%. This yield impact is roughly reflected in the average prizes over the years.
The Numbers Boiled Down Further
Of all ticket sales, 34% of Powerball ticket sales fund the grand prize. Another 16% fund the lower-tier prizes. (The remaining 50% goes to various state programs, operating costs, and retailer commissions.) If a winner chooses the lump sum payout, they receive the 34%. If instead, the winner chooses the jackpot in annual payments over 30 years, the prize money is invested in a portfolio of bonds.
The last time a winner chose an annuity was in 2014.
Economists who have researched lotteries have learned that once jackpots near the $500 million mark, non-regular lottery players are more likely to take a chance. The $500 million or more mark is where the media begins to make “lottery fever” a news event worth reporting on. The added publicity then feeds more money into the pot.
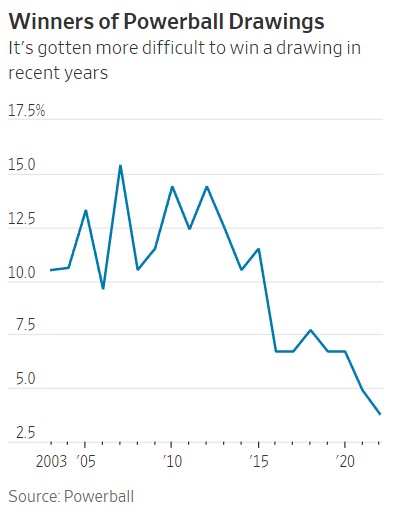
The prize pools are also growing because the games of chance have become statistically more difficult to take the top prize. In 2015, Powerball increased the cost of the ticket and altered the game to make it easier for players to win smaller prizes while reducing the odds of winning the headline prize.
Only 3.8% of drawings so far this year had had a winner, down from roughly 11% in 2014, the last full year before the change went into effect.
This is why the five times in the U.S. where $1 billion has been surpassed have all been recent. They include the biggest one, a $1.58 billion prize from Powerball in 2016, followed by a $1.53 billion Mega Millions jackpot in 2018 and this week’s $1.5 billion Powerball prize.
Lottery tickets also tend to become more popular during economic downturns and when people become more money conscious.
Even though the odds of winning Powerball are 1 in 292.2 million, players will take a shot and buy a ticket to have the fantasy. If the prize money continues to reach over $500 million on a regular basis, it may work against the program as those who don’t normally play won’t feel it is a special event.
Federal Reserve President Speeches With Elections and CPI to Shape the Week’s Trading
Yes, the stock markets are open on Veterans Day (Friday). But bond trading, which the stock market has been more keenly focused on this year, will be taking the day off along with other U.S. government services. Equity traders can get a sense of interest rate sentiment on Friday by turning to the Chicago Board of Options and viewing tickers ZF=F (5 yr. USTN), ZN=F (10 yr. USTN), ZB=F (30 yr. USTB).
All markets are open on Election Day, and the outcome, as measured by House seats and Senate seats distributed among the major political parties, has the potential to be market-moving.
It’s a quiet week for economic numbers, except for Thursday, when the CPI report is released. This has the potential of changing those calling for a 50 bp hike at the next meeting to up their expectations or those still forecasting 75bp to lower their call. Certainly, the Fed governors will be watching this and all measures of inflation up to the December 14-15 meeting. There are a number of Fed governors speaking this week; this could alter the tone; however, the next meeting is far out into the future.
Election Day.
Monday 11/7
3:00 PM ET the amount of consumer installment credit for September, including credit cards, auto loan, and student loans outstanding, indicate current consumer spending and borrowing patterns. The markets tend to ignore this number as we are already in November and this report measures September
3:40 PM ET, the Federal Reserve Bank Presidents Mester (Cleveland) and Collins (Boston), will be speaking. Both are considered fairly hawkish.
6:00 PM ET, the Federal Reserve Bank President Harkey (Philadelphia) will be speaking.
Tuesday 11/8
Election Day.
Meet the Management; Noble Capital Markets hosts Management of Entravision Communications (EVC) in West Palm Beach, FL. This is a no-cost-to-attend, in-person breakfast meeting with investors. If interested, click here.
Meet the Management, Noble Capital Markets hosts Management of Entravision Communications (EVC) in Boca Raton, FL. This is a no-cost-to-attend, in-person lunch meeting with investors. If interested, click here.
Wednesday 11/9
It can be expected that the newswires will be filled with Election Day outcomes and market-moving conjecture.
7:00 AM ET Mortgage Applications. The Mortgage Bankers Association (MBA) creates a statistic from several mortgage loan indexes. The Mortgage Applications index measures applications at mortgage lenders. It’s considered a leading indicator and is especially important for single-family home sales and housing construction. Both are considered foundational in a strong economy.
10 Year Treasury Note Auction is held in the middle of each month and settles on or around the 15th (depending on weekends). The yield is a benchmark for 30-year mortgages and has recently been noted by investment markets because it has been trading at a yield lower than shorter maturities. This inversion of the yield curve has some market players suggesting a recession is expected in the future. Any surprises at the auction will reverberate through the stock market.
10:30 AM ET, EIA Petroleum Status Report.
11:00 AM ET, Federal Reserve President Barkin (Philadelphia) speaks.
Meet the Management; Noble Capital Markets hosts Management of Entravision Communications (EVC) in Winter Park, FL. This is a no-cost-to-attend, in-person breakfast meeting with investors. If interested, click here.
Meet the Management; Noble Capital Markets hosts Management of Entravision Communications (EVC) in Orlando, FL. This is a no-cost-to-attend, in-person lunch meeting with investors. If interested, click here.
Thursday 11/10
8:30 AM ET, U.S. Consumer Price Index (CPI) is the inflation indicator most widely broadcast. With inflation being a primary focus, this will be the big number coming out this week. The number represents a basket of goods considered typical for an urban consumer and is taken as the change in the cost of that basket of goods. A percentage is derived from the change. CPI is also reported with food and energy removed as it is considered that other non-economic factors influence these prices. The September report indicated CPI rose 0.4% for the month and 8.2% YOY. Expectations are for an increase to 0.7% for October and a YOY rate of 8.0%.
8:30 AM ET U.S. Jobless Claims which represent the prior week’s employment are expected to have increased to 221,000 from 217,000. From jobless claims, investors can gain a sense of how tight or how loose the job market is. If wage inflation takes hold, interest rates will likely rise, and bond and stock prices will fall. Remember, the lower the number of unemployment claims, the stronger the job market, and vice versa.
10:30 AM ET, EIA Natural Gas Status Report.
Friday 11/11
Veterans Day, the stock market is one, the futures markets are open, and the bond market and other U.S. government-related offices are closed.
10 AM ET Consumer Sentiment, November (preliminary). This barometer, reported by the University of Michigan, questions households each month on their assessment of current conditions and expectations of future conditions. This “preliminary” release is for the month of November and is expected to have fallen to 59.6 versus 59.9 last month.
What Else
It is a light week for economic releases and Fed governor addresses, but the election outcome and CPI have the potential to whip markets around.
We’re entering the holiday shopping season when there will be a number of measures that investors focus on that will give a hint as to how strong the consumer is in the current economy.
US Sailors, Coastal Riverine Group, Restoring Command Anchor with Gold Paint, Credit: US Pacific Fleet (Flickr)
Can the Dollar Once Again Be Anchored by Gold? One Congressman Believes It Can
On October 7, 2022, US congressman Alex Mooney (a Republican from West Virginia) introduced a bill (the Gold Standard Restoration Act, H.R. 9157) that stipulates that the US dollar must be backed by physical gold owned by the US Treasury. The initiative clearly indicates that the increasingly inflationary US dollar is triggering efforts to get better money.
It should be noted that there have already been many legislative changes to make precious metals more attractive as a means of payment in recent years: in many US states, the value-added and capital gains taxes on gold and silver, but also on platinum and palladium, have been abolished. Mr. Mooney’s proposal is divided into three sections.
The first section of the bill establishes the need for a return to a gold-backed US dollar. For example, it is said that the US dollar—or more precisely, the bill refers to “Federal Reserve Notes”—that is, banknotes issued by the US Federal Reserve (Fed)—has lost its purchasing power on a massive scale in the past: Since 2000, it has dropped by 30 percent, and since 1913 by 97 percent. The bill also argues that with an inflation target of 2 percent, the Fed will not preserve the purchasing power of the US dollar but will have it halved after just thirty-five years. Moreover, the bill points out that it is in the interest of US citizens and firms to have a “stable US dollar.” The bill highlights that the inflationary US dollar has been eroding the industrial base of the US economy, enriching the owners of financial assets, while endangering workers’ jobs, wages, and savings.
The second section of the bill describes in more detail the technical process for re-anchoring the US dollar to the US official gold stock. It states that (1) the US secretary of the Treasury must define the US dollar banknotes using a fixed fine gold weight thirty days after the law goes into effect, based on the closing price of the gold on that day. The Fed must (2) ensure that the US banknotes are redeemable for physical gold at the designated rate at the Fed. (3) If the banks of the Fed system fail to comply with peoples’ exchange requests, the exchange must be made by the US Treasury, and in return, the Treasury takes the Fed’s bank assets as collateral.
The third section specifies how a “fair” gold price in US dollar can develop in an orderly manner within thirty days after the bill has taken effect. To this end, (1) the US Treasury and the Fed must publish all of their gold holdings, disclosing all purchases, sales, swaps, leases, and all other gold transactions that have taken place since the “temporary” suspension of the redeemability of the US dollar into gold on August 15, 1971, under the Bretton Woods Agreement of 1944. In addition, (2) the US Treasury and the Fed must publicly disclose all gold redemptions and transfers in the 10 years preceding the “temporary” suspension of the US dollar’s gold redemption obligation on August 15, 1971.
What to Make of This?
The bill’s core is the idea of re-anchoring the US dollar to physical gold based on a fair gold price freely determined in the market. (By the way, this is an idea put forward by the economist Ludwig von Mises (1881–1973) in the early 1950s.) In this context, the bill refers to US banknotes. However, banknotes only comprise a (fractional) part of the total US dollar money supply. But since US bank deposits can be redeemed (at least in principle) in US banknotes, not only US dollar cash (coins and notes) could be exchanged for gold, but also the money supply M1 or M2 as fixed and savings deposits could be exchanged for sight deposits, and sight deposits, in turn, could be withdrawn in cash by customers, and the banknotes could then be exchanged for gold at the Fed.
As of August 2022, the stock of US cash (“currency in circulation”) amounted to $2,276.3 billion. Assuming that the official physical gold holdings of the US Treasury amount to 261.5 million troy ounces, and the market expected US cash to be backed by the official US gold stock, a gold price of about $8,700 per troy ounce would result. This would correspond to a 418 percent increase compared to the current gold price of $1,680. If, however, the market were to expect the entire US money supply M2 to be covered by the official US gold stock, then the price of gold would move toward $83,000 per troy ounce—an increase of 4.840 percent compared to the current gold price. Needless to say, such an appreciation of gold has far-reaching consequences.
All goods prices in US dollars can be expected to rise (perhaps to the extent that the price of gold has risen). After all, the purchasing power of the owners of gold has increased significantly. Therefore, they can be expected to use their increased purchasing power to buy other goods (such as consumer goods, but also stocks, houses, etc.). If this happens, the prices of these goods in US dollar terms will be pushed up—and thus, the initial purchasing power gain that the gold dollar holders have enjoyed by being tied to the increased gold price will melt away again. Moreover, if US banks were willing to accept additional gold from the public in exchange for issuing new US dollar, reanchoring the US dollar in gold would increase the upward price effect.
A re-anchoring of the US dollar in the US official gold stock will result in a far-reaching redistribution of income and wealth. In fact, it would be fatal for the outstanding US dollar debt: US dollar goods prices would rise, caused by a rise in the US dollar gold price at which the US dollar is redeemable for physical gold, thereby eroding the US dollar’s purchasing power. In the foreign exchange markets, the US dollar would probably appreciate drastically against those currencies that are not backed by gold and against currencies which are backed by gold, not as fine compared to the fineness of the gold backing of the US dollar. The purchasing power of the US dollar abroad would increase sharply, while the US export economy would suffer. US goods would become correspondingly expensive abroad, while foreign companies gain high price competitiveness in the US market.
Once the US dollar is re-anchored in gold, today’s chronic inflation will end; monetary policy–induced boom-and-bust cycles will come to an end; the world will become more peaceful because financing a war in a gold-backed monetary system will be very expensive, and the general public will most likely not want to bear its costs. However, there is still room for improvement. A “Gold Standard Restoration Act” will deserve unconditional support if and when it paves the way toward a truly “free market for money.” A free market in money means that you and I have the freedom to choose the kind of money we believe serves our purposes best; and that people are free to offer their fellow human beings a good that they voluntarily choose to use as money.
In a truly free market, people will choose the good they want to use as money. Most importantly, in a truly free market in money, the state (as we know it today) loses its influence on money and money production altogether. In fact, the state (and the special interest groups that exploit the state) no longer determine which kind of gold (coins and bars, cast or minted) can be used as money; the state is no longer active in the minting business and cannot monopolize it anymore; there is no longer a state-controlled central bank to intervene in the credit and money markets and influence market interest rates. That said, let us hope that the Gold Standard Restoration Act proposed by Mr. Mooney will pave the way to reforming the US dollar currency system—and that it will eventually move us toward a truly free market in money.
About the Author
Dr. Thorsten Polleit is the Chief Economist of Degussa and an Honorary Professor at the University of Bayreuth. He also acts as an investment advisor.
LAKEWOOD, Colo., Nov. 4, 2022 /CNW/ – Energy Fuels Inc. (NYSE American: UUUU) (TSX: EFR) (“Energy Fuels” or the “Company”) today reported its financial results for the quarter ended September 30, 2022. The Company’s quarterly report on Form 10-Q has been filed with the U.S. Securities and Exchange Commission (“SEC“) and may be viewed on the Electronic Document Gathering and Retrieval System (“EDGAR“) at www.sec.gov/edgar.shtml, on the System for Electronic Document Analysis and Retrieval (“SEDAR“) at www.sedar.com, and on the Company’s website at www.energyfuels.com. Unless noted otherwise, all dollar amounts are in U.S. dollars.
Highlights:
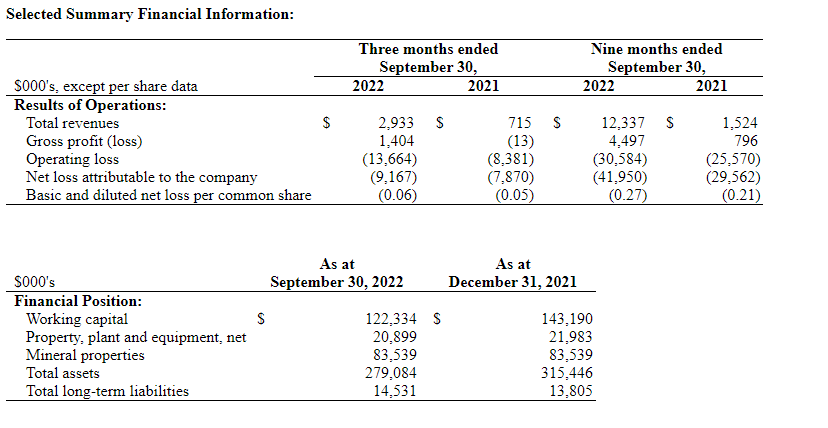
At September 30, 2022, the Company had a robust balance sheet with $122.3 million of working capital, including $77.1 million of cash and cash equivalents, $11.6 million of marketable securities, $27.3 million of inventory, and no short term (or long term) debt. At current commodity prices, the Company’s product inventory has a value of $44.1 million.
During the quarter ended September 30, 2022, the Company incurred a net loss of $9.3 million, which includes increases in development, permitting and land holding costs and selling, general and administration costs associated with the Company’s efforts to enhance its business processes and operational readiness for the current and future growth and activity in our uranium and rare earth element (“REE“) operations.
With recent uranium market strength and having secured three long-term uranium contracts with major U.S. utilities earlier this year, the Company has hired over 20 new employees and is beginning to perform the work needed to recommence production at one or more of our mines and ISR facilities, starting as soon as 2023. Until such time when the Company has ramped back up to commercial uranium production, we can rely on our significant uranium inventories to fulfill our new contract requirements.
In June 2022, the U.S. Department of Energy (“DOE“) issued a Request for Proposals (“RFP“) to purchase uranium (“U3O8“) for the new U.S. Uranium Reserve Program. The DOE states that they expect to purchase up to 1 million pounds of U3O8 inventory from up to four (4) qualified U.S. uranium producers with individual awards ranging from 100,000 pounds to 500,000 pounds. The uranium must be physically located at Honeywell’s Metropolis Works conversion facility (the “U.S. Converter“). Energy Fuels believes it meets all qualifications to supply the Reserve, and the Company currently holds about 610,000 pounds of U3O8 at the U.S. Converter. The Company has submitted a bid to sell U3O8 to the Reserve, taking into consideration our long-term contract commitments and current and expected market conditions. There are no guarantees the DOE will purchase uranium from the Company under this RFP. Assuming the bid review process is not extended by DOE, the Company expects the DOE to issue the awards by mid-November 2022, with deliveries expected to occur by the end of 2022 or early 2023.
During the first nine months of 2022, the Company produced approximately 205 tonnes of mixed partially separated carbonate (“RE Carbonate“), containing approximately 95 tonnes of total rare earth oxides (“TREO“). Energy Fuels’ partially separated RE Carbonate contains a higher concentration of valuable NdPr, roughly 32% – 34% NdPr, compared to our previously produced non-separated RE Concentrate which contained approximately 22% NdPr, and is the most advanced REE material being produced in the U.S. today. During Q4-2022, the Company expects to receive approximately 640 tonnes of monazite, which will be processed into partially separated RE Carbonate during Q4-2022 and Q1-2023.
In May 2022, the Company announced it had entered into agreements to acquire a 58 square mile rare earth land position in Brazil (the “Bahia Project“). The Bahia Project is a well-known heavy mineral sand (“HMS“) deposit that has the potential to feed the Company’s White Mesa Mill with REE and uranium-bearing monazite sand for decades. Due diligence on the Bahia Project was completed at the end of August, at which time the Company advised the sellers that it intended to proceed with the purchases and was ready to commence closing procedures. After completion of a number of administrative logistics required in both the U.S. and Brazil, the mineral transfers were initiated in mid-October, and closing is currently expected to occur in late 2022 or early 2023 upon approval of the Brazilian governmental authorities reviewing the pending transfers. Upon acquisition, the Company plans to conduct an extensive exploration program to better define the HMS and monazite resource, including comprehensive sonic drilling (for a total phase 1 program of 2,250 meters) and geophysical mapping, with the intent to undertake an Initial Assessment under SK-1300 (U.S.) and a Technical Report under NI 43-101 (Canada) during Q4-2023, to be completed in early Q1-2024.
The Company is currently in active discussions with several additional sources of natural monazite sands around the world to significantly increase the supply of feed for our growing REE initiative.
The Company continues to make excellent progress toward installing full REE separation capabilities at the Mill to produce both “light” and “heavy” separated REE oxides in the coming years. The Company plans to initially install a “light” REE separation circuit within the existing Mill facilities in the next 12-18 months with the expected ability to produce between 2,500 – 5,000 tonnes TREO (500 – 1,000 tonnes NdPr oxide or oxalates) per year. As this circuit would be constructed within existing Mill facilities, capital expenditures are expected to be low. The Company is also proceeding with the design, engineering and permitting of a separate crack and leach circuit and a second larger “light” and “heavy” separations circuit with capacity in the order of 10,000 – 15,000 tonnes TREO per year to provide additional REE processing capacity at the Mill in the coming years.
During the first nine months of 2022, the Company sold approximately 642,000 pounds of existing inventory of vanadium (“V2O5“) (as ferrovanadium, “FeV“), for an average weighted net price of $13.69 per pound of V2O5. Vanadium markets have dropped in recent months. Therefore, the Company has halted sales of its inventory which currently stands at approximately 987,000 pounds of V2O5. However, the Company expects to resume sales as markets may improve in the future. The Company is evaluating the potential to resume vanadium recovery at the Mill in the future as market conditions may warrant for future sale and to replace sold inventory, where its tailings pond solutions contain an estimated additional 1.0 to 3.0 million recoverable pounds of V2O5.
Mark S. Chalmers, Energy Fuels’ President and CEO, stated:
“Energy Fuels continues to strengthen our U.S. market leading position in uranium and rare earth elements, which are both critical to the clean energy transition. Energy Fuels has ‘one-of-a-kind’ competencies that are critical to uranium, rare earth elements, medical isotopes, and vanadium markets; namely our ability to process feedstocks that are naturally radioactive and recover critical materials needed for the clean energy transition. No other company in the U.S. can do the things Energy Fuels does. We are committed to advancing each of these initiatives in a disciplined manner, while working toward profitability and sustained cash flow.
“Uranium is the fuel for carbon-free nuclear energy, and nations around the world are embracing nuclear, as it provides reliable, carbon-free, baseload electricity. Governments in numerous countries, including the U.S., are supporting both existing and new nuclear to help solve national security, energy security, and carbon reduction challenges. We are saddened by the continuing atrocities being committed by Russian forces in Ukraine, and we stand by our partners in the U.S. nuclear industry and the U.S. government to shift away from Russian uranium and nuclear fuel imports as soon as practicable. As previously disclosed, Energy Fuels has signed new long-term uranium sales contracts with major U.S. nuclear utilities, with sales – and sales revenues – beginning in 2023. We are also excited to announce that we are making significant investments in a number of our existing mines and production facilities, including hiring people, with an eye toward resuming large-scale uranium production very soon. We have been the only U.S. company to continue to produce uranium over the past several years, while maintaining several of our projects on standby status, which provides an excellent foundation from which we can build our production in the coming years. We look forward to maintaining our position as the largest U.S. uranium producer and being a long-term supplier of secure and responsibly sourced U.S. uranium that is insulated from geopolitical, transport, and other supply chain issues. We are also pleased to have been able to submit a bid to sell uranium to the U.S. government under the new U.S. Uranium Reserve, a program that resulted from the Company’s 2018 Section 232 Petition, and we eagerly await the results of that bidding process.
“We also continue to make spectacular progress on rare earth elements. Indeed, we are pleased to announce that we plan to install a commercial-scale “light” rare earth separation circuit within the existing footprint of our White Mesa Mill in Utah that we expect to be operational in the next 12 – 18 months. We are already producing the most advanced rare earth product in the U.S. today, a high-purity, partially separated mixed rare earth carbonate. We expect to go one step further by producing up to 500 – 1,000 tonnes of NdPr oxide (or oxalates) per year by late-2023 or early-2024. If successful, we hope to be the ‘first to market’ in the U.S. for this high-value, advanced material. We anticipate selling our separated NdPr oxide (or oxalate) to major electric vehicle manufacturers in the U.S. and Europe, with a goal to significantly increase this capacity in coming years. This should position Energy Fuels as one of the ‘go to’ suppliers of advanced rare earth materials in the U.S. and one of the first companies that electric vehicle (EV) and other clean technology manufacturers look to for the raw materials they need. Ultimately, we plan to install the capacity to produce over 3,000 tonnes of NdPr oxide, plus 250 tonnes of dysprosium oxide and 100 tonnes of terbium oxide per year, in the next 3-4 years, subject to licensing, commissioning, financing, offtake, market conditions, and sufficient monazite feedstock.
“On the monazite feedstock front, we continue to make excellent progress. With regard to our Bahia Project in Brazil, we continue to move diligently toward closing. The mineral transfers were initiated in mid-October after a number of administrative logistics required for closing were completed in both the U.S. and Brazil. Closing is scheduled to occur as soon as the transfers have been approved by the Brazilian governmental authorities reviewing the pending transfers, which we expect by the end of 2022 or in early 2023. Upon acquisition, the Company plans to conduct an initial phase of exploration drilling on the properties, totaling 2,250 meters, in order to maintain expected production timelines. In addition, we continue discussions with a number of monazite suppliers from around the world interested in partnering with Energy Fuels, and we are confident in our ability to secure monazite supply deals that ensure a ‘win-win’ for both Energy Fuels and our partners.
“Finally, we continue to make progress on medical isotopes with major players in the space. If we can successfully recover radioactive isotopes needed for emerging cancer treatments from our existing process streams, we will have secured yet another opportunity to generate significant cash flows in the next 5 to 10 years. We also continue to track vanadium markets to determine when to resume sales of our existing inventories and when to resume production.”
Webcast at 4:00 pm ET on November 8, 2022:
Energy Fuels will be hosting a video webcast on November 8, 2022 at 4:00 pm ET (2:00 pm MT) to discuss its Q3-2022 financial results, the outlook for 2022, uranium, rare earths, vanadium, and medical isotopes. To join the webcast and access the presentation and viewer-controlled webcast slides, please click on the link below:
Webcast Link
If you would like to participate in the webcast and ask questions, please dial in to 1-888-664-6392 (toll free in the U.S. and Canada).
A link to a recorded version of the proceedings will be available on the Company’s website shortly after the webcast by calling 1-888-390-0541 (toll free in the U.S. and Canada) and by entering the code 619525#. The recording will be available until November 22, 2022.
Financial Discussion:
At September 30, 2022, the Company had $122.3 million of working capital, including $88.7 million of cash and cash equivalents and marketable securities and $27.3 million of inventory, including approximately 692,000 pounds of uranium and 987,000 pounds of high-purity vanadium, both in the form of immediately marketable product. The current spot price of U3O8, according to TradeTech, is $52.50 per pound, and the current mid-point spot price of V2O5, according to Metal Bulletin, is $7.80 per pound. Based on those spot prices, the Company’s uranium and vanadium inventories have a current market value of $36.3 million and $7.7 million, respectively, totaling $44.0 million. The Company also holds RE Carbonate inventory with a current value of $0.1 million, for total product inventory of $44.1 million at current commodity prices.
During the quarter ended September 30, 2022, the Company incurred a net loss of $9.3 million, compared to a net loss of $8.0 million for the third quarter of 2021, and a net loss of $42.0 million for the nine months ended September 30, 2022 compared to a net loss of $29.7 million during the first nine months of 2021. The increased net losses in 2022 are due primarily to a non-cash mark-to-market decrease in the value of investments accounted for at fair value of $13.7 million for the nine months ended September 30, 2022.
Operations Update and Outlook for 2022:
Overview
The Company continues to believe that uranium supply and demand fundamentals point to higher sustained uranium prices in the future. In addition, Russia’s recent invasion of Ukraine and the recent entry into the uranium market by financial entities purchasing uranium on the spot market to hold for the long-term has the potential to result in higher sustained spot and term prices and, perhaps, induce utilities to enter into more long-term contracts with non-Russian producers like Energy Fuels to ensure security of supply and more certain pricing. Having recently secured three long-term uranium contracts with major U.S. utilities, the Company is beginning to perform the work needed to recommence production at one or more of its mines and ISR facilities, starting as soon as 2023. Until such time when the Company has ramped back up to commercial uranium production, it can rely on its significant uranium inventories to fulfill its new contract requirements. To that end, the Company purchased an additional 68,552 pounds of U. S. origin U3O8 on the spot market in October 2022. The Company also continues to evaluate selling a portion of its inventories on the spot market in response to future upside price volatility, into the newly created U.S. Uranium Reserve Program, or for delivery into additional long-term supply contracts if procured. During the nine months ended September 30, 2022, the Company also sold a portion of its vanadium inventory into then strengthening markets.
The Company will also continue to seek new sources of revenue, including through its emerging REE business, as well as new sources of Alternate Feed Materials and new fee processing opportunities at the Mill that can be processed without reliance on current uranium sales prices. The Company is also seeking new sources of natural monazite sands (in addition to the pending acquisition of the Bahia Project) for its emerging REE business, is evaluating the potential to recover radioisotopes for use in the development of targeted alpha therapy medical isotopes for the treatment of cancer, and continues its support of U.S. governmental activities to assist the U.S. uranium mining industry, including the new U.S. Uranium Reserve Program and other efforts to restore domestic nuclear fuel capabilities.
Extraction and Recovery Activities Overview
During 2022, the Company plans to recover 130,000 to 140,000 pounds of uranium, which is an increase over our previous guidance of 100,000 to 120,000 pounds of uranium in 2022. This increased uranium production in 2022, combined with other factors, has resulted in a delayed start of our second REE processing campaign in 2022, which is now expected to commence in November 2022 and carry over into Q1 2023. As a result, the Company now expects to produce approximately 205 tonnes of partially separated RE Carbonate in 2022 containing approximately 95 tonnes of high-value partially separated TREO, with the remaining production from the second 2022 REE processing campaign of approximately 410 tonnes of partially separated RE Carbonate containing approximately 200 tonnes of high-value partially separated TREO being packaged in and attributable to Q1 2023. The total expected production from this second 2022 campaign plus production to date in 2022 is equivalent to approximately 831 tons of non-separated RE Carbonate containing approximately 400 tonnes of non-separated TREO, which falls within our 2022 guidance of 650-1,000 tons of non-separated RE Carbonate containing 300-650 tonnes of non-separated TREO, although a portion of that total expected production will carry over into 2023.
No vanadium production is currently planned during 2022, though the Company sold some of its existing vanadium inventory into recent strong markets and is evaluating the potential to recommence vanadium production in 2023 or later years as market conditions may warrant for future sale and to replace sold inventory.
The Company secured three new long-term sales contracts with U.S. nuclear utilities in May 2022 and is continuing to strategically pursue additional uranium sales commitments with pricing expected to have both fixed and market-related components. The Company believes that recent price increases, volatility and focus on security of supply in light of Russia’s ongoing invasion of Ukraine have increased the potential for the Company to make uranium sales and procure additional term sales contracts with utilities at pricing that sustains production and covers corporate overhead. Therefore, existing inventories may increase from 760,000 pounds of U3O8 (692,000 pounds as of September 30, 2022 plus 68,552 pounds acquired after quarter end) to 890,000 to 900,000 pounds of U3O8 at year-end 2022 or may increase to a lesser extent, or be reduced, in the event the Company sells a portion of its inventory on the spot market, to the U.S. Uranium Reserve Program, or pursuant to term contracts in 2022.
ISR Activities
The Company expects to produce insignificant quantities of U3O8 in the year ending December 31, 2022 from Nichols Ranch. Until such time when market conditions improve sufficiently, suitable term sales contracts can be procured, or the U.S. Uranium Reserve Program is expanded, the Company expects to maintain the Nichols Ranch Project on standby and defer development of further wellfields and header houses. The Company currently holds 34 fully permitted, undeveloped wellfields at Nichols Ranch, including four additional wellfields at the Nichols Ranch wellfields, 22 wellfields at the adjacent Jane Dough wellfields, and eight wellfields at the Hank Project, which is fully permitted to be constructed as a satellite facility to the Nichols Ranch Plant. The Company expects to continue to keep the Alta Mesa Project on standby until such time that market conditions improve sufficiently, suitable term sales contracts can be procured, or the U.S. Uranium Reserve Program is expanded.
Conventional Activities
Conventional Extraction and Recovery Activities
During the nine months ended September 30, 2022, the Mill did not package any material quantities of U3O8, focusing instead on developing its REE recovery business. During the nine months ended September 30, 2022, the Mill produced approximately 205 tonnes of partially separated RE Carbonate, containing approximately 95 tonnes of high value partially separated TREO. The Mill recovered small quantities of uranium during the Quarter, which were retained in circuit. During 2022, the Company expects to recover 130,000 to 140,000 pounds of uranium at the Mill as finished product. The Company expects to recover approximately 205 tonnes of partially separated RE Carbonate (equivalent to approximately 277 tonnes of non-separated RE Carbonate) containing approximately 95 tonnes of high value partially separated TREO (equivalent to approximately 128 tonnes of non-separated TREO) at the Mill during 2022. The Company expects to sell all or a portion of its mixed RE Carbonate to Neo Performance Materials (“Neo“) or other global separation facilities and/or to stockpile it for future production of separated REE oxides at the Mill or elsewhere. The Company is in advanced discussions with several sources of natural monazite sands (in addition to the Bahia Project) to secure additional supplies of monazite sands, which if successful, would be expected to allow the Company to increase RE Carbonate production.
In addition to its 760,000 pounds of finished uranium inventories currently located at North American conversion facilities and at the Mill (692,000 pounds as of September 30, 2022 plus 68,552 pounds acquired after quarter end) and the 130,000 to 140,000 pounds of U3O8 expected to be produced in 2022, the Company has approximately 170,000 pounds of U3O8 contained in stockpiled Alternate Feed Materials and other ore inventory at the Mill that can be recovered relatively quickly in the future, as general market conditions may warrant (totaling about 1,060,000 to 1,070,000 pounds of U3O8 of total uranium inventory). The Company is also seeking to acquire additional ore inventory from third party mine cleanup activities that can be recovered relatively quickly in the future.
The Company currently holds approximately 987,000 pounds of V2O5 in inventory, and there remains an estimated 1.0 to 3.0 million pounds of additional solubilized recoverable V2O5 remaining in tailings solutions awaiting future recovery, as market conditions may warrant.
Conventional Standby, Permitting and Evaluation Activities
During the nine months ended September 30, 2022, standby and environmental compliance activities continued at the fully permitted and substantially developed Pinyon Plain Project (uranium and, potentially, copper) and the fully permitted and developed La Sal Complex (uranium and vanadium). The Company increased its number of employees, and continued carrying out engineering, procurement and construction management activities, at its Pinyon Plain Project during the Quarter. The timing of the Company’s plans to extract and process mineralized materials from these projects will be based on sustained improvements in general market conditions, procurement of suitable sales contracts and/or the expansion of the U.S. Uranium Reserve Program.
The Company is selectively advancing certain permits at its other major conventional uranium projects, such as the Roca Honda Project, which is a large, high-grade conventional project in New Mexico. The Company is also continuing to maintain required permits at its conventional projects, including the Whirlwind Project, which is now in the process of recommencing mining operations, and the Sheep Mountain Project. In addition, the Company will continue to evaluate the Bullfrog Project. Expenditures for certain of these projects have been adjusted to coincide with expected dates of price recoveries based on the Company’s forecasts. All of these projects serve as important pipeline assets for the Company’s future conventional production capabilities, as market conditions may warrant.
Uranium Sales
During the three months ended September 30, 2022, the Company did not enter into any new uranium sales contracts, having just recently entered into three uranium sale and purchase agreements with major U.S. utilities in May 2022, constituting its first new long-term supply contracts since 2018. Having observed a marked uptick in interest from nuclear utilities seeking long-term uranium supply, the Company remains actively engaged in pursuing additional selective long-term uranium sales contracts. The Company submitted an offer to sell a portion of its inventories currently located at the ConverDyn conversion facility to the DOE’s newly created U.S. Uranium Reserve Program. If the offer is accepted, the Company may complete some sales of uranium during 2022.
Vanadium Sales
As a result of strengthening vanadium markets, during the nine months ended September 30, 2022, the Company sold approximately 642,000 pounds of the Company’s existing inventory of V2O5 (as FeV) at a net weighted average price of $13.69 per pound of V2O5. The Company expects to sell its remaining finished vanadium product when justified into the metallurgical industry, as well as other markets that demand a higher purity product, including the aerospace, chemical, and potentially the vanadium battery industries. The Company expects to sell to a diverse group of customers in order to maximize revenues and profits. The vanadium produced in the 2018/19 Pond Return campaign was a high-purity vanadium product of 99.6%-99.7% V2O5. The Company believes there may be opportunities to sell certain quantities of this high-purity material at a premium to reported spot prices. The Company may also retain vanadium product in inventory for future sale, depending on vanadium spot prices and general market conditions.
RE Carbonate Sales
The Company commenced its ramp-up to commercial production of a mixed RE Carbonate in March 2021 and has shipped all of its RE Carbonate produced to-date to Neo’s Silmet facility in Estonia, where it is currently being fed into their separation process. All RE Carbonate produced at the Mill in 2022 is expected to be sold to Neo for separation at Silmet. Until such time as the Company expects to permit and construct its own separation circuits at the Mill, production in future years is expected to be sold to Neo for separation at Silmet and, potentially, to other REE separation facilities outside of the U.S. To the extent not sold, the Company expects to stockpile mixed RE Carbonate at the Mill for future separation and other downstream REE processing at the Mill or elsewhere. During the quarter ended September 30, 2022, the Company sold approximately 89,000 kilograms of TREO at an average price of $25.03 per kilogram of TREO.
While the Company continues to ramp up its mixed RE Carbonate production and additional funds are spent on process enhancements, improving recoveries, product quality and other optimization, profits from this initiative are expected to be minimal until such time when monazite throughput rates are increased and optimized. However, even at the current throughput rates, the Company is recovering most of its direct costs of this growing initiative, with the other costs associated with ramping up production, process enhancements and evaluating future separation capabilities at the Mill being expensed as underutilized capacity production costs applicable to RE Carbonate and development expenditures. Throughout this process, the Company is gaining important knowledge, experience and technical information, all of which will be valuable for current and future mixed RE Carbonate production and expected future production of separated REE oxides and other advanced REE materials at the Mill. As discussed above, the Company is planning to install a “light” separation circuit within existing Mill facilities and is evaluating installing a separate crack and leach circuit and full separation circuit at the Mill to produce both “light” and “heavy” separated REE oxides in the coming years, subject to successful licensing, financing, and commissioning and continued strong market conditions.
About Energy Fuels: Energy Fuels is a leading U.S.-based uranium mining company, supplying U3O8 to major nuclear utilities. The Company also produces vanadium from certain of its projects, as market conditions warrant, and is ramping up to full commercial-scale production of RE Carbonate. Its corporate offices are in Lakewood, Colorado near Denver, and all its assets and employees are in the United States. Energy Fuels holds three of America’s key uranium production centers: the White Mesa Mill in Utah, the Nichols Ranch ISR Project in Wyoming, and the Alta Mesa ISR Project in Texas. The White Mesa Mill is the only conventional uranium mill operating in the U.S. today, has a licensed capacity of over 8 million pounds of U3O8 per year, and has the ability to produce vanadium when market conditions warrant, as well as RE Carbonate from various uranium-bearing ores. The Nichols Ranch ISR Project is currently on standby and has a licensed capacity of 2 million pounds of U3O8 per year. The Alta Mesa ISR Project is also currently on standby and has a licensed capacity of 1.5 million pounds of U3O8 per year. In addition to the above production facilities, Energy Fuels also has one of the largest S-K 1300 and NI 43-101 compliant uranium resource portfolios in the U.S. and several uranium and uranium/vanadium mining projects on standby and in various stages of permitting and development. The primary trading market for Energy Fuels’ common shares is the NYSE American under the trading symbol “UUUU,” and the Company’s common shares are also listed on the Toronto Stock Exchange under the trading symbol “EFR.” Energy Fuels’ website is www.energyfuels.com.
Cautionary Note Regarding Forward-Looking Statements: This news release contains certain “Forward Looking Information” and “Forward Looking Statements” within the meaning of applicable United States and Canadian securities legislation, which may include, but are not limited to, statements with respect to: production and sales forecasts; costs of production; any expectation that the Company will be awarded any sales under the U.S. Uranium Reserve; scalability, and the Company’s ability and readiness to re-start, expand or deploy any of its existing projects or capacity to respond to any improvements in uranium market conditions or in response to the Uranium Reserve; any expectation as to future uranium, vanadium, RE Carbonate or REE market fundamentals or sales; any expectation as to recommencement of production at any of the Company’s uranium mines or the timing thereof; any expectation regarding any remaining dissolved vanadium in the Mill’s tailings facility solutions or the ability of the Company to recover any such vanadium at acceptable costs or at all; any expectation as to the ability of the Company to secure any new sources of Alternate Feed Materials or other processing opportunities at the Mill; any expectation as to timelines for the permitting and development of projects; any expectation as to longer term fundamentals in the market and price projections; any expectation as to the implications of the current Russian invasion of Ukraine on uranium, vanadium or other commodity markets; any expectation that the Company will maintain its position as a leading uranium company in the United States; any expectation with respect to timelines to production; any expectation that the Mill will be successful in producing RE Carbonate on a full-scale commercial basis; any expectation that Neo will be successful in separating the Mill’s RE Carbonate on a commercial basis; any expectation that Energy Fuels will be successful in developing U.S. separation, or other value-added U.S. REE production capabilities at the Mill, or otherwise, including the timing of any such initiatives and the expected production capacity or capital and operating costs associated with any such production capabilities; any expectation that the Company will restore U.S. rare earth separation capabilities in the coming years; any expectation with respect to the future demand for REEs; any expectation with respect to the quantities of monazite sands to be acquired by Energy Fuels, the quantities of RE Carbonate to be produced by the Mill or the quantities of contained TREO in the Mill’s RE Carbonate; any expectation that any additional supplies of monazite sands will result in sufficient throughput at the Mill to reduce underutilized capacity production costs and allow the Company to realize its expected margins on a continuous basis; any expectation that the Company may sell its separated NdPr oxide (or oxalate) to major electric vehicle manufacturers in the U.S. and Europe or that the Company may position itself as one of the “go to” suppliers of advanced rare earth materials in the U.S.; any expectation that the Bahia Project has the potential to feed the Mill with REE and uranium-bearing monazite sand for decades; any expectation that the Company will complete comprehensive sonic drilling and geophysical mapping at the Bahia Project or complete an Initial Assessment under SK-1300 (U.S.) and a Technical Report Technical Report under NI 43-101 (Canada) during Q4-2023 or Q1-2024, or otherwise; any expectation that the Company’s evaluation of thorium and radium recovery at the Mill will be successful; any expectation that the potential recovery of medical isotopes from any thorium or radium recovered at the Mill will be feasible; any expectation that any thorium, radium or other isotopes can be recovered at the Mill and sold on a commercial basis; any expectation as to the quantities to be delivered under existing uranium sales contracts, or that such contracts may help underpin the Company’s uranium business for many years to come; any expectation that the Company will be successful in completing any additional contracts for the sale of uranium to U.S. utilities; any expectation that any existing or potential future uranium sales contracts will be at prices and quantities that provide an appropriate rate of return or sustain production and cover corporate overhead; any expectation that the value of the Company’s investments accounted for at fair value may improve in future periods; and any expectation that the Company will generate net income in future periods. Generally, these forward-looking statements can be identified by the use of forward-looking terminology such as “plans,” “expects,” “does not expect,” “is expected,” “is likely,” “budgets,” “scheduled,” “estimates,” “forecasts,” “intends,” “anticipates,” “does not anticipate,” or “believes,” or variations of such words and phrases, or state that certain actions, events or results “may,” “could,” “would,” “might” or “will be taken,” “occur,” “be achieved” or “have the potential to.” All statements, other than statements of historical fact, herein are considered to be forward-looking statements. Forward-looking statements involve known and unknown risks, uncertainties and other factors which may cause the actual results, performance or achievements of the Company to be materially different from any future results, performance or achievements express or implied by the forward-looking statements. Factors that could cause actual results to differ materially from those anticipated in these forward-looking statements include risks associated with: commodity prices and price fluctuations; processing and mining difficulties, upsets and delays; permitting and licensing requirements and delays; changes to regulatory requirements; legal challenges; the availability of sources of Alternate Feed Materials and other feed sources for the Mill; competition from other producers; public opinion; government and political actions; available supplies of monazite sands; the ability of the Mill to produce RE Carbonate to meet commercial specifications on a commercial scale at acceptable costs; the ability of Neo to separate the RE Carbonate produced by the Mill to meet commercial specifications on a commercial scale at acceptable costs; market factors, including future demand for REEs; the ability of the Mill to be able to separate radium or other radioisotopes at reasonable costs or at all; market prices and demand for medical isotopes; and the other factors described under the caption “Risk Factors” in the Company’s most recently filed Annual Report on Form 10-K, which is available for review on EDGAR at www.sec.gov/edgar.shtml, on SEDAR at www.sedar.com, and on the Company’s website at www.energyfuels.com. Forward-looking statements contained herein are made as of the date of this news release, and the Company disclaims, other than as required by law, any obligation to update any forward-looking statements whether as a result of new information, results, future events, circumstances, or if management’s estimates or opinions should change, or otherwise. There can be no assurance that forward-looking statements will prove to be accurate, as actual results and future events could differ materially from those anticipated in such statements. Accordingly, the reader is cautioned not to place undue reliance on forward-looking statements. The Company assumes no obligation to update the information in this communication, except as otherwise required by law.
SOURCE Energy Fuels Inc.
For further information: Investor Inquiries: Energy Fuels Inc., Curtis Moore, VP – Marketing and Corporate Development, (303) 974-2140 or Toll free: (888) 864-2125, investorinfo@energyfuels.com, www.energyfuels.com
Acquisition creates a global powerhouse in change management
STAMFORD, Conn., November 3, 2022 ― Information Services Group (ISG) (Nasdaq: III), a leading global technology research and advisory firm, today announced it has acquired Change 4 Growth, an award-winning company specializing in transformational change for enterprises.
Founded in 2017, Change 4 Growth offers market-leading change solutions and expertise to support large-scale business transformations involving people, process and technology. Last year it was named a top 10 change management company in the U.S. by Manage HR magazine.
“The combination of Change 4 Growth and our existing ISG Enterprise Change business creates a global powerhouse in change management at a time when demand for such services is expected to grow significantly,” said Michael P. Connors, chairman and CEO of ISG. “Enterprises are in a state of continuous transformation, as they adjust to new technologies, new competitors, and ever-changing market forces. To be successful, they need a highly adaptable, change-ready workforce.”
The combined business will go to market as ISG Enterprise Change with capabilities in organizational change management (OCM), communications, training development and delivery, leadership development, mentoring, Diversity, Equity and Inclusion (DEI) programs, executive coaching and culture change.
“Transformational change is a complex journey best undertaken with a strong and knowledgeable partner,” said Beth Thomas, CEO and founder of Change 4 Growth, who has been named partner and co-leader of ISG Enterprise Change. “Together, we will offer unrivalled expertise, methodologies and tools to help our clients build and sustain change-capable organizations. We could not be more excited to be joining ISG and expanding the reach of both firms’ industry-leading solutions.”
Among those solutions is ATLAS™, a transformational change platform developed by Change 4 Growth that provides access to OCM templates and tools for greater efficiency and gives clients real-time visibility via dashboards into the progress and health of their business transformations. ISG Enterprise Change intends to offer this new solution to its clients immediately.
Change 4 Growth and ISG Enterprise Change together have successfully conducted more than 1,000 change management engagements involving more than 5 million employees. The two businesses have served more than 300 clients in industries including retail, automotive, manufacturing, banking and financial services, insurance, utilities and healthcare.
For more information about ISG’s OCM services, visit the ISG website.
About ISG
ISG (Information Services Group) (Nasdaq: III) is a leading global technology research and advisory firm. A trusted business partner to more than 800 clients, including more than 75 of the world’s top 100 enterprises, ISG is committed to helping corporations, public sector organizations, and service and technology providers achieve operational excellence and faster growth. The firm specializes in digital transformation services, including automation, cloud and data analytics; sourcing advisory; managed governance and risk services; network carrier services; strategy and operations design; change management; market intelligence and technology research and analysis. Founded in 2006, and based in Stamford, Conn., ISG employs more than 1,300 digital-ready professionals operating in more than 20 countries—a global team known for its innovative thinking, market influence, deep industry and technology expertise, and world-class research and analytical capabilities based on the industry’s most comprehensive marketplace data. For more information, visit www.isg-one.com.
Reports third-quarter GAAP revenues of $69 million, reflecting negative FX impact of $4 million
Reports net income of $6 million, GAAP EPS of $0.11 and adjusted EPS of $0.14
Reports adjusted EBITDA of $11 million
Achieves record year-to-date results: GAAP revenues of $212 million, up 6% in constant currency; net income of $15 million, up 29%; adjusted EBITDA of $32 million, up 12%; GAAP EPS of $0.30, up 30%; adjusted EPS of $0.40, up 18%
Returns $7 million to shareholders in the form of share repurchases and dividends in Q3
Declares fourth-quarter dividend of $0.04 per share, payable December 19 to record holders as of December 5
Sets fourth-quarter guidance for achieving record full-year revenue and EBITDA performance: revenues between $70 million and $72 million and adjusted EBITDA between $10 million and $11 million
STAMFORD, Conn.–(BUSINESS WIRE)– Information Services Group (ISG) (Nasdaq: III), a leading global technology research and advisory firm, today announced financial results for the third quarter ended September 30, 2022.
“ISG remains on track to deliver record full-year revenue and profitability after another solid operating performance in Q3,” said Michael P. Connors, chairman and CEO. “Despite macroeconomic headwinds, in the third quarter we delivered double-digit growth in recurring revenues, as well as in Europe, on an operating basis. Our product mix of higher-margin digital advisory, research and platform services drove the expansion of our adjusted EBITDA margin to 16 percent, our highest-ever quarterly margin.”
Change 4 Growth Acquisition
ISG said today it has acquired Change 4 Growth, a business specializing in transformational change for enterprises. Founded in 2017, Change 4 Growth offers market-leading change solutions and expertise to support large-scale business transformations involving people, process and technology.
“The combination of Change 4 Growth and our existing ISG Enterprise Change business creates a global powerhouse in change management at a time when demand for such services is expected to grow significantly,” said Connors.
ISG estimates demand for organizational change management (OCM) services will grow at a compound annual rate of more than 15 percent over the next five years, as companies continuously adjust to new technologies, new competitors, and ever-changing market forces.
With the acquisition, Connors noted that ISG adds a new platform solution, ATLAS™, that provides access to OCM templates and tools for greater engagement efficiency and gives clients real-time visibility via dashboards into the progress and health of their business transformations.
Third-Quarter 2022 Results
Reported revenues for the third quarter were $68.8 million, down 3 percent from $71.1 million in the prior year, and up 2 percent in constant currency. Currency translation negatively impacted reported revenues by $4.0 million versus the prior year. Reported revenues were $42.2 million in the Americas, down 2 percent versus the prior year, impacted by the completion of a large Automation engagement; $19.3 million in Europe, down 4 percent versus the prior year on a reported basis and up 13 percent in constant currency, and $7.3 million in Asia Pacific, down 10 percent versus the prior year on a reported basis and down 3 percent in constant currency.
ISG reported third-quarter operating income of $7.4 million, up 2 percent from $7.3 million in the third quarter of 2021. Reported third-quarter net income was $5.6 million, up 26 percent, compared with net income of $4.4 million in the prior year. Fully diluted earnings per share was $0.11, compared with $0.09 per fully diluted share in the prior year. Net income margin (calculated by dividing net income by reported revenues) increased to 8.1 percent, from 6.2 percent in the third quarter of 2021.
Adjusted net income (a non-GAAP measure defined below under “Non-GAAP Financial Measures”) for the third quarter was $7.2 million, or $0.14 per share on a fully diluted basis, compared with adjusted net income of $5.9 million, or $0.12 per share on a fully diluted basis, in the prior year’s third quarter.
Third-quarter adjusted EBITDA (a non-GAAP measure defined below under “Non-GAAP Financial Measures”) was $10.7 million, up 5 percent from the third quarter last year. Adjusted EBITDA margin (a non-GAAP measure calculated by dividing adjusted EBITDA by reported revenues) was 16 percent, up 120 basis points from the prior year.
Nine-Month Year-to-Date Results
Reported revenues for the first nine months were a record $212.1 million, up 2 percent versus the prior-year period, and up 6 percent in constant currency. Currency translation negatively impacted reported revenues for the nine-month period by $9.5 million versus the prior year. Reported revenues were $123.1 million in the Americas, up 1 percent versus the prior year; $66.0 million in Europe, down 1 percent versus the prior year on a reported basis and up 11 percent in constant currency, and $23.0 million in Asia Pacific, up 13 percent versus the prior year on a reported basis and up 20 percent in constant currency.
ISG reported year-to-date operating income of $22.3 million, up 23 percent from $18.1 million in the first nine months of 2021. The firm also reported record year-to-date net income and fully diluted earnings per share of $15.4 million and $0.30, respectively, versus net income of $12.0 million and earnings per share of $0.23 in the prior year. Net income margin (calculated by dividing net income by reported revenues) increased to 7.3 percent, from 5.7 percent in the same period last year.
Adjusted net income (a non-GAAP measure defined below under “Non-GAAP Financial Measures”) for the first nine months was $20.4 million, or $0.40 per share on a fully diluted basis, compared with adjusted net income of $17.7 million, or $0.34 per share on a fully diluted basis, in the prior-year period.
Year-to-date adjusted EBITDA (a non-GAAP measure defined below under “Non-GAAP Financial Measures”) reached a record $32.1 million, up 12 percent from same period last year. Adjusted EBITDA margin (a non-GAAP measure calculated by dividing adjusted EBITDA by reported revenues) was 15 percent, up more than 140 basis points from the prior year.
Other Financial and Operating Highlights
The firm’s cash balance totaled $19.7 million at September 30, 2022, down from $31.5 million at June 30, 2022. During the third quarter, ISG repurchased $4.8 million of shares, paid dividends of $2.0 million, paid $1.0 million in a final earnout associated with the 2020 Neuralify acquisition, and paid down $1.1 million of debt. As of September 30, 2022, ISG had $71.3 million in debt outstanding, compared with $75.6 million at the end of the third quarter last year. At 1.7 times, the firm’s gross-debt-to-adjusted-EBITDA ratio (a non-GAAP measure calculated by dividing outstanding debt by adjusted EBITDA) was at a record low as of September 30, 2022.
2022 Fourth-Quarter Revenue and Adjusted EBITDA Guidance
“Based on achieving our fourth-quarter guidance, ISG will deliver record revenues and profitability for the full year,” said Connors. “For the fourth quarter, ISG is targeting revenues of between $70 million and $72 million and adjusted EBITDA of between $10 million and $11 million. We will continue to monitor the macroeconomic environment, including the impact of FX, inflation and other factors, and adjust our business plans accordingly.”
Quarterly Dividend
The ISG Board of Directors declared a fourth-quarter dividend of $0.04 per share, payable on December 19, 2022, to shareholders of record on December 5, 2022.
Conference Call
ISG has scheduled a call for 9 a.m., U.S. Eastern Time, Friday, November 4, 2022, to discuss the company’s third-quarter results. The call can be accessed by dialing 1-833-927-1758; or, for international callers, by dialing +1 929-526-1599. The access code is 121223. A recording of the conference call will be accessible on ISG’s website (www.isg-one.com) for approximately four weeks following the call.
Forward-Looking Statements
This communication contains “forward-looking statements” which represent the current expectations and beliefs of management of ISG concerning future events and their potential effects. Statements contained herein including words such as “anticipate,” “believe,” “contemplate,” “plan,” “estimate,” “target,” “expect,” “intend,” “will,” “continue,” “should,” “may,” and other similar expressions, are “forward-looking statements” under the Private Securities Litigation Reform Act of 1995. These forward-looking statements are not guarantees of future results and are subject to certain risks and uncertainties that could cause actual results to differ materially from those anticipated. Those risks relate to inherent business, economic and competitive uncertainties and contingencies relating to the businesses of ISG and its subsidiaries including without limitation: (1) failure to secure new engagements or loss of important clients; (2) ability to hire and retain enough qualified employees to support operations; (3) ability to maintain or increase billing and utilization rates; (4) management of growth; (5) success of expansion internationally; (6) competition; (7) ability to move the product mix into higher margin businesses; (8) general political and social conditions such as war, political unrest and terrorism; (9) healthcare and benefit cost management; (10) ability to protect ISG and its subsidiaries’ intellectual property or data and the intellectual property or data of others; (11) currency fluctuations and exchange rate adjustments; (12) ability to successfully consummate or integrate strategic acquisitions; (13) outbreaks of diseases, including coronavirus, or similar public health threats or fear of such an event; and (14) engagements may be terminated, delayed or reduced in scope by clients. Certain of these and other applicable risks, cautionary statements and factors that could cause actual results to differ from ISG’s forward-looking statements are included in ISG’s filings with the U.S. Securities and Exchange Commission. ISG undertakes no obligation to update or revise any forward-looking statements to reflect subsequent events or circumstances.
Non-GAAP Financial Measures
ISG reports all financial information required in accordance with U.S. generally accepted accounting principles (GAAP). In this release, ISG has presented both GAAP financial results as well as non-GAAP information for the three and nine months ended September 30, 2022, and September 30, 2021. ISG believes that evaluating its ongoing operating results will be enhanced if it discloses certain non-GAAP information. These non-GAAP financial measures exclude non-cash and certain other special charges that many investors believe may obscure the user’s overall understanding of ISG’s current financial performance and the Company’s prospects for the future. ISG believes that these non-GAAP measures provide useful information to investors because they improve the comparability of the financial results between periods and provide for greater transparency of key measures used to evaluate the Company’s performance.
ISG provides adjusted EBITDA (defined as net income plus interest, taxes, depreciation and amortization, foreign currency transaction gains/losses, non-cash stock compensation, interest accretion associated with contingent consideration, acquisition-related costs, and severance, integration and other expense), adjusted net income (defined as net income plus amortization of intangible assets, non-cash stock compensation, foreign currency transaction gains/losses, interest accretion associated with contingent consideration, acquisition-related costs, and severance, integration and other expense, on a tax-adjusted basis), adjusted net income per diluted share, adjusted EBITDA margin, gross-debt-to-adjusted-EBITDA ratio and selected financial data on a constant currency basis which are non-GAAP measures that the Company believes provide useful information to both management and investors by excluding certain expenses and financial implications of foreign currency translations, which management believes are not indicative of ISG’s core operations. These non-GAAP measures are used by ISG to evaluate the Company’s business strategies and management’s performance.
We evaluate our results of operations on both an as reported and a constant currency basis. The constant currency presentation, which is a non-GAAP financial measure, excludes the impact of year-over-year fluctuations in foreign currency exchange rates. We believe providing constant currency information provides valuable supplemental information regarding our results of operations, thereby facilitating period-to-period comparisons of our business performance and is consistent with how management evaluates the Company’s performance. We calculate constant currency percentages by converting our current and prior-periods local currency financial results using the same point in time exchange rates and then compare the adjusted current and prior period results. This calculation may differ from similarly titled measures used by others and, accordingly, the constant currency presentation is not meant to be a substitution for recorded amounts presented in conformity with GAAP, nor should such amounts be considered in isolation.
Management believes this information facilitates comparison of underlying results over time. Non-GAAP financial measures, when presented, are reconciled to the most closely applicable GAAP measure. Non-GAAP measures are provided as additional information and should not be considered in isolation or as a substitute for results prepared in accordance with GAAP. A reconciliation of the forward-looking non-GAAP estimates contained herein to the corresponding GAAP measures is not being provided, due to the unreasonable efforts required to prepare it.
About ISG
ISG (Information Services Group) (Nasdaq: III) is a leading global technology research and advisory firm. A trusted business partner to more than 800 clients, including 75 of the world’s top 100 enterprises, ISG is committed to helping corporations, public sector organizations, and service and technology providers achieve operational excellence and faster growth. The firm specializes in digital transformation services, including automation, cloud and data analytics; sourcing advisory; managed governance and risk services; network carrier services; strategy and operations design; change management; market intelligence and technology research and analysis. Founded in 2006, and based in Stamford, Conn., ISG employs more than 1,300 digital-ready professionals operating in more than 20 countries—a global team known for its innovative thinking, market influence, deep industry and technology expertise, and world-class research and analytical capabilities based on the industry’s most comprehensive marketplace data. For more information, visit www.isg-one.com.
Information Services Group, Inc.
Condensed Consolidated Statement of Income and Comprehensive Income
(unaudited)
(in thousands, except per share amounts)
Three Months Ended September 30,
Nine Months Ended September 30,
2022
2021
2022
2021
Revenues
$
68,836
$
71,095
$
212,100
$
208,263
Operating expenses
Direct costs and expenses for advisors
39,786
43,249
125,111
127,412
Selling, general and administrative
20,334
19,236
60,806
58,768
Depreciation and amortization
1,286
1,347
3,872
3,962
Operating income
7,430
7,263
22,311
18,121
Interest income
37
65
126
196
Interest expense
(824
)
(538
)
(1,997
)
(1,794
)
Foreign currency transaction gain (loss)
131
1
248
(2
)
Income before taxes
6,774
6,791
20,688
16,521
Income tax provision
1,218
2,370
5,245
4,570
Net income
$
5,556
$
4,421
$
15,443
$
11,951
Weighted average shares outstanding:
Basic
47,888
48,751
48,191
48,521
Diluted
49,844
51,510
50,637
51,713
Earnings per share:
Basic
$
0.12
$
0.09
$
0.32
$
0.25
Diluted
$
0.11
$
0.09
$
0.30
$
0.23
Information Services Group, Inc.
Reconciliation from GAAP to Non-GAAP
(unaudited)
(in thousands, except per share amounts)
Three Months Ended September 30,
Nine Months Ended September 30,
2022
2021
2022
2021
Net income
$
5,556
$
4,421
$
15,443
$
11,951
Plus:
Interest expense (net of interest income)
787
473
1,871
1,598
Income taxes
1,218
2,370
5,245
4,570
Depreciation and amortization
1,286
1,347
3,872
3,962
Interest accretion associated with contingent consideration
–
47
8
113
Acquisition-related costs (1)
25
18
41
(14
)
Severance, integration and other expense
8
41
458
1,341
Foreign currency transaction (gain) loss
(131
)
(1
)
(248
)
2
Non-cash stock compensation
1,987
1,499
5,432
5,075
Adjusted EBITDA
$
10,736
$
10,215
$
32,122
$
28,598
Net income
$
5,556
$
4,421
$
15,443
$
11,951
Plus:
Non-cash stock compensation
1,987
1,499
5,432
5,075
Intangible amortization
525
643
1,580
2,001
Interest accretion associated with contingent consideration
–
47
8
113
Acquisition-related costs (1)
25
18
41
(14
)
Severance, integration and other expense
8
41
458
1,341
Foreign currency transaction (gain) loss
(131
)
(1
)
(248
)
2
Tax effect (2)
(772
)
(719
)
(2,327
)
(2,726
)
Adjusted net income
$
7,198
$
5,949
$
20,387
$
17,743
Weighted average shares outstanding:
Basic
47,888
48,751
48,191
48,521
Diluted
49,844
51,510
50,637
51,713
Adjusted earnings per share:
Basic
$
0.15
$
0.12
$
0.42
$
0.37
Diluted
$
0.14
$
0.12
$
0.40
$
0.34
(1)
Consists of expenses from acquisition-related costs and non-cash fair value adjustments on pre-acquisition contract liabilities.
(2)
Marginal tax rate of 32%, reflecting U.S. federal income tax rate of 21% plus 11% attributable to U.S. states and foreign jurisdictions.
STAMFORD, Conn., Nov. 03, 2022 (GLOBE NEWSWIRE) — Eagle Bulk Shipping Inc. (NASDAQ: EGLE) (“Eagle Bulk,” “Eagle” or the “Company”), one of the world’s largest owner-operators within the midsize drybulk vessel segment, today reported financial results for the quarter ended September 30, 2022.
Quarter highlights:
Generated Revenues, net of $185.3 million
Achieved TCE(1) of $28,099/day basis and TCE Revenue(1) of $128.9 million
Realized net income of $77.2 million, or $5.94 per basic share
Adjusted net income(1) of $74.3 million, or $5.72 per adjusted basic share(1)
Generated EBITDA(1) of $96.0 million
Adjusted EBITDA(1) of $85.1 million
Repurchased $10.0 million in aggregate principal amount, or 9% of the Convertible Bond Debt
Reduced diluted share count by 296,990 shares
Executed an agreement to purchase a 2015-built scrubber-fitted Japanese Ultramax for $27.5 million
Declared a quarterly dividend of $1.80 per share for the third quarter of 2022
Dividend is payable on November 23, 2022 to shareholders of record at the close of business on November 15, 2022
Recent Developments:
Coverage position for the fourth quarter 2022 is as follows:
70% of available days fixed at an average TCE of $25,040
Eagle’s CEO Gary Vogel commented, “We posted another robust quarterly result, generating net income of $77.2 million as our team successfully navigated a volatile landscape. With our commercial platform and dynamic approach to trading ships, as well as our ability to capture significant value from fuel spreads as a result of our fleet scrubber position, we were able to achieve a TCE of $28,099, representing significant outperformance against the BSI of almost 46%.
Consistent with our stated capital allocation strategy and strong results, we declared our fifth consecutive quarterly dividend since adopting our policy late in 2021, representing 30% of earnings and bringing total shareholder distributions to $10.05 per share. Additionally, we opportunistically repurchased approximately 9% of our convertible bond debt in the open market at advantageous prices, resulting in both a decrease in debt outstanding and a reduction to our diluted share count.
On the strategic front, we capitalized on the illiquidity in the S&P markets in early September and executed our 51st transaction, acquiring a high-specification 2015-built Japanese scrubber-fitted Ultramax for $27.5 million. Based on our constructive view of supply side fundamentals, we are likely to add further tonnage on an opportunistic basis as we head into next year, consistent with our continued focus on strategically expanding the business and adding incremental value for our shareholders.”
1 These are non-GAAP financial measures. A reconciliation of GAAP to non-GAAP financial measures has been provided in the financial tables included in this press release. An explanation of these measures and how they are calculated are also included below under the heading “Supplemental Information – Non-GAAP Financial Measures.”
Fleet Operating Data
Three Months Ended
Nine Months Ended
September 30, 2022
September 30, 2021
September 30, 2022
September 30, 2021
Ownership Days
4,831
4,697
14,424
13,407
Chartered in Days
1,000
563
3,102
1,718
Available Days
5,588
4,931
16,701
14,403
Operating Days
5,574
4,908
16,662
14,308
Fleet Utilization (%)
99.7
%
99.5
%
99.8
%
99.3
%
Fleet Development
Vessel sold and delivered in the third quarter of 2022
Cardinal, a Supramax (55K DWT / 2004-built) for total consideration of $15.8 million
Vessel acquired and expected to be delivered in the fourth quarter of 2022
Tokyo Eagle, a Japanese-built, scrubber-fitted Ultramax (61K DWT / 2015-built) for total consideration of $27.5 million
Results of Operations for the three and nine months ended September 30, 2022 and 2021
For the three months ended September 30, 2022, the Company reported net income of $77.2 million, or basic and diluted income of $5.94 per share and $4.77 per share, respectively. In the comparable quarter of 2021, the Company reported net income of $78.3 million, or basic and diluted income of $6.12 per share and $4.92 per share, respectively.
For the three months ended September 30, 2022, the Company reported adjusted net income of $74.3 million, which excludes net unrealized gains on derivative instruments of $7.1 million and a loss on debt extinguishment of $4.2 million, or basic and diluted adjusted net income of $5.72 per share and $4.58 per share, respectively. In the comparable quarter of 2021, the Company reported adjusted net income of $72.1 million, which excludes net unrealized gains on derivative instruments of $6.3 million and a loss on debt extinguishment of $0.1 million, or basic and diluted adjusted net income of $5.63 per share and $4.52 per share, respectively.
For the nine months ended September 30, 2022, the Company reported net income of $224.7 million, or basic and diluted income of $17.31 per share and $13.86 per share, respectively. In the comparable period of 2021, the Company reported net income of $97.4 million, or basic and diluted income of $7.96 per share and $6.34 per share, respectively.
For the nine months ended September 30, 2022, the Company reported adjusted net income of $220.4 million, which excludes net unrealized gains on derivative instruments of $8.5 million and a loss on debt extinguishment of $4.2 million, or basic and diluted adjusted net income of $16.97 per share and $13.59 per share, respectively. In the comparable period of 2021, the Company reported adjusted net income of $121.7 million, which excludes net unrealized losses on derivative instruments of $24.2 million and a loss on debt extinguishment of $0.1 million, or basic and diluted adjusted net income of $9.95 per share and $7.93 per share, respectively.
Revenues, net
Revenues, net for the three months ended September 30, 2022 were $185.3 million compared to $183.4 million in the comparable quarter in 2021. Net time and voyage charter revenues increased $21.8 million due to an increase in available days driven by an increase in owned days and chartered-in days, partially offset by a decrease of $19.9 million due to lower charter rates.
Revenues, net for the nine months ended September 30, 2022 and 2021 were $568.4 million and $409.8 million, respectively. Net time and voyage charter revenues increased $80.4 million due to higher charter rates and increased $78.2 million due to an increase in available days driven by increases in owned days and chartered-in days.
Voyage expenses
Voyage expenses for the three months ended September 30, 2022 were $40.8 million compared to $30.3 million in the comparable quarter in 2021. Voyage expenses increased primarily due to an increase in bunker consumption expense of $10.1 million driven by an increase in bunker fuel prices.
Voyage expenses for the nine months ended September 30, 2022 were $120.7 million and $81.4 million in the comparable period in 2021. Voyage expenses increased primarily due to an increase in bunker consumption expense of $29.1 million driven by an increase in bunker fuel prices, an increase in port expenses of $8.5 million driven by an increase in fuel surcharges and cost inflation and an increase in broker commissions of $1.7 million driven by an increase in related revenues.
Vessel operating expenses
Vessel operating expenses for the three months ended September 30, 2022 were $33.1 million compared to $28.1 million in the comparable quarter in 2021. Vessel operating expenses increased primarily due to an increase in repair costs of $3.1 million driven by discretionary upgrades and certain unscheduled necessary repairs, and an increase in crewing costs of $2.1 million driven by crew changes and expenses related to COVID-19 and the war in Ukraine. The ownership days for the three months ended September 30, 2022 and 2021 were 4,831 and 4,697, respectively.
Average daily vessel operating expenses excluding one-time, non-recurring expenses related to vessel acquisitions, charges relating to a change in the crewing manager on some of our vessels and discretionary hull upgrades for the three months ended September 30, 2022 were $6,566 as compared to $5,401 for the three months ended September 30, 2021.
Vessel operating expenses for the nine months ended September 30, 2022 and 2021 were $88.2 million and $73.3 million, respectively. Vessel operating expenses increased primarily due to an increase in crewing costs of $7.8 million driven by crew changes and expenses related to COVID-19 and the war in Ukraine, an increase in the cost of lubes, stores and spares of $3.1 million driven by cost inflation and an increase in repair costs of $2.4 million driven by discretionary upgrades and certain unscheduled necessary repairs. The ownership days for the nine months ended September 30, 2022 and 2021 were 14,424 and 13,407, respectively.
Average daily vessel operating expenses excluding one-time, non-recurring expenses related to vessel acquisitions, charges relating to a change in the crewing manager on some of our vessels and discretionary hull upgrades for the nine months ended September 30, 2022 and 2021 were $5,991 and $5,114, respectively.
Charter hire expenses
Charter hire expenses for the three months ended September 30, 2022 were $19.8 million compared to $10.7 million in the comparable quarter in 2021. Charter hire expenses increased $8.3 million primarily due to an increase in chartered-in days and increased $0.7 million due to an increase in charter hire rates due to improvement in the charter hire market. The total chartered-in days for the three months ended September 30, 2022 were 1,000 compared to 563 for the comparable quarter in the prior year.
Charter hire expenses for the nine months ended September 30, 2022 were $63.8 million compared to $25.4 million in the comparable period in 2021. Charter hire expenses increased $20.4 million primarily due to an increase in chartered-in days and increased $18.0 million due to an increase in charter hire rates due to improvement in the charter hire market. The total chartered-in days for the nine months ended September 30, 2022 and 2021 were 3,102 and 1,718, respectively.
The Company currently charters in five Ultramax vessels on a long-term basis as of the charter-in commencement date, with an outstanding option to extend the charter period on one of those vessels.
Depreciation and amortization
Depreciation and amortization expense for the three months ended September 30, 2022 and 2021 was $15.4 million and $13.6 million, respectively. Total depreciation and amortization expense for the three months ended September 30, 2022 includes $11.9 million of vessel and other fixed asset depreciation and $3.5 million relating to the amortization of deferred drydocking costs. Comparable amounts for the three months ended September 30, 2021 were $11.4 million of vessel and other fixed asset depreciation and $2.2 million of amortization of deferred drydocking costs. Depreciation and amortization increased $1.3 million due to the impact of thirteen drydocks completed since the third quarter of 2021 and increased $0.5 million due to an increase in the cost base of our owned fleet due to the capitalization of BWTS on our vessels and the acquisition of three vessels in the second half of 2021, offset in part by the sale of one vessel in the third quarter of 2022.
Depreciation and amortization expense for the nine months ended September 30, 2022 and 2021 was $45.2 million and $39.2 million, respectively. Total depreciation and amortization expense for the nine months ended September 30, 2022 includes $35.5 million of vessel and other fixed asset depreciation and $9.7 million relating to the amortization of deferred drydocking costs. Comparable amounts for the nine months ended September 30, 2021 were $33.0 million of vessel and other fixed asset depreciation and $6.2 million of amortization of deferred drydocking costs. Depreciation and amortization increased $3.5 million due to the impact of 13 drydocks completed since the third quarter of 2021 and increased $2.6 million due to an increase in the cost base of our owned fleet due to the acquisition of nine vessels in 2021 and the capitalization of BWTS on our vessels, offset in part by the sale of one vessel in the third quarter of 2021 and the sale of one vessel in the third quarter of 2022.
General and administrative expenses
General and administrative expenses for the three months ended September 30, 2022 and 2021 were $9.7 million and $7.9 million, respectively. General and administrative expenses include stock-based compensation of $1.4 million and $0.8 million for the three months ended September 30, 2022 and 2021, respectively. General and administrative expenses increased $0.7 million due to higher stock-based compensation expense and increased $0.5 million due to an increase in compensation and benefits.
General and administrative expenses for the nine months ended September 30, 2022 and 2021 were $29.6 million and $23.6 million, respectively. General and administrative expenses include stock-based compensation of $4.5 million and $2.2 million for the nine months ended September 30, 2022 and 2021, respectively. General and administrative expenses increased $2.3 million due to higher stock-based compensation expense, increased $1.7 million due to an increase in compensation and benefits, and increased $1.0 million due to higher professional fees.
Other operating expense
Other operating expense for the three months ended September 30, 2022 and 2021 was $2.5 million and $0.8 million, respectively. Other operating expense for the three months ended September 30, 2022 was primarily comprised of costs associated with a corporate transaction that did not materialize. Other operating expense for the three months ended September 30, 2021 was primarily comprised of costs incurred relating to a 2021 U.S. government investigation into an allegation that one of our vessels may have improperly disposed of ballast water that entered the engine room bilges during a repair. The Company posted a surety bond as security for any fines and penalties. Other operating expense consists of expenses incurred relating to this incident, which include legal fees, surety bond expenses, vessel offhire, crew changes and travel costs.
Other operating expense for the nine months ended September 30, 2022 and 2021 was $2.6 million and $2.3 million, respectively. Other operating expense for the nine months ended September 30, 2022 was primarily comprised of costs associated with a corporate transaction that did not materialize. Other operating expense for the nine months ended September 30, 2021 was primarily comprised of costs incurred relating to a 2021 U.S. government investigation into an allegation that one of our vessels may have improperly disposed of ballast water that entered the engine room bilges during a repair. The Company posted a surety bond as security for any fines and penalties. Other operating expense consists of expenses incurred relating to this incident, which include legal fees, surety bond expenses, vessel offhire, crew changes and travel costs.
Interest expense
Interest expense for the three months ended September 30, 2022 and 2021 was $4.2 million and $8.5 million, respectively. Interest expense decreased $1.4 million due to lower effective interest rates and decreased $1.4 million due to lower outstanding principal balances, each as a result of the refinancing of the Company’s debt in the fourth quarter of 2021 and decreased $1.4 million due to lower amortization of debt discounts and deferred financing costs primarily as a result of the Company’s adoption of ASU 2020-06.
Interest expense for the nine months ended September 30, 2022 and 2021 was $13.0 million and $25.6 million, respectively. Interest expense decreased $4.6 million due to lower outstanding principal balances and decreased $4.4 million due to lower effective interest rates, each as a result of the refinancing of the Company’s debt in the fourth quarter of 2021 and decreased $3.8 million due to lower amortization of debt discounts and deferred financing costs primarily as a result of the Company’s adoption of ASU 2020-06.
The Company entered into interest rate swaps in October 2021 to fix the interest rate exposure on the Global Ultraco Debt Facility term loan. As a result of these swaps, which average 87 basis points, the Company’s interest rate exposure is fully fixed insulating the Company from the rising interest rate environment.
Realized and unrealized (gain)/loss on derivative instruments, net
Realized and unrealized gain on derivative instruments, net for the three months ended September 30, 2022 was $11.3 million compared to a realized and unrealized loss on derivative instruments, net of $9.0 million for the three months ended September 30, 2021. The $11.3 million gain is primarily related to $14.3 million in gains earned on our freight forward agreements as a result of the decrease in charter hire rates during the third quarter, offset by $3.0 million in bunker swap losses for the three months ended September 30, 2022. For the three months ended September 30, 2021, the Company had $9.4 million in losses on our freight forward agreements due to the sharp increase in charter hire rates during the third quarter of 2021, offset by $0.4 million in bunker swap gains.
Realized and unrealized gain on derivative instruments, net for the nine months ended September 30, 2022 was $13.3 million compared to a realized and unrealized loss on derivative instruments, net of $45.6 million for the nine months ended September 30, 2021. The $13.3 million gain is primarily attributable to $9.4 million in gains earned on our freight forward agreements as a result of the decrease in charter hire rates during 2022 and $3.9 million in bunker swap gains for the nine months ended September 30, 2022. For the comparable period in the prior year, the Company had $47.9 million in losses on our freight forward agreements due to the sharp increase in charter hire rates in 2021, offset by $2.3 million in bunker swap gains.
The non-cash unrealized gains on forward freight agreements (“FFA”) for the remaining three months of 2022 as of September 30, 2022 amounted to $9.4 million based on 675 net days and the non-cash unrealized losses on FFAs for the calendar year 2023 amounted to less than $0.1 million on 135 net days.
The following table shows our open positions on FFAs as of September 30, 2022:
FFA Period
Number of Days
Average FFA Contract Price
Quarter ending December 31, 2022 – Sell Positions
2,010
$
21,981
Quarter ending December 31, 2022 – Buy Positions
(1,335
)
$
16,461
Year ending December 31, 2023 – Sell Positions
720
$
14,525
Year ending December 31, 2023 – Buy Positions
(855
)
$
14,308
Liquidity and Capital Resources
Nine Months Ended
(In thousands)
September 30, 2022
September 30, 2021
Net cash provided by operating activities
$
242,491
$
120,915
Net cash provided by/(used in) investing activities
4,090
(106,767
)
Net cash (used in)/provided by financing activities
(135,198
)
22,648
Net increase in cash, cash equivalents and restricted cash
111,383
36,796
Cash, cash equivalents and restricted cash at beginning of period
86,222
88,849
Cash, cash equivalents and restricted cash at end of period
$
197,605
$
125,645
Net cash provided by operating activities for the nine months ended September 30, 2022 and 2021 was $242.5 million and $120.9 million, respectively. The increase in cash flows provided by operating activities resulted primarily from the increase in revenues due to higher charter hire rates.
Net cash provided by investing activities for the nine months ended September 30, 2022 was $4.1 million, compared to net cash used in investing activities of $106.8 million in the comparable period in 2021. During the nine months ended September 30, 2022, the Company received net proceeds of $14.9 million from the sale of a vessel and paid $5.7 million for the purchase of ballast water treatment systems (“BWTS”) on our fleet, $4.1 million as an advance for the purchase of a vessel to be delivered in the fourth quarter of 2022, $0.8 million for vessel improvements and $0.3 million for other fixed assets.
Net cash used in financing activities for the nine months ended September 30, 2022 was $135.2 million, compared to net cash provided by financing activities of $22.6 million in the comparable period in 2021. During the nine months ended September 30, 2022, the Company paid $81.6 million in dividends, repaid $37.4 million of the term loan under the Global Ultraco Debt Facility, paid $14.2 million to repurchase a portion of our Convertible Bond Debt and $2.4 million to settle net share equity awards.
As of September 30, 2022, our cash and cash equivalents including noncurrent restricted cash was $197.6 million compared to $86.2 million as of December 31, 2021.
In addition, as of September 30, 2022, we had $100.0 million in an undrawn revolver facility available under the Global Ultraco Debt Facility.
As of September 30, 2022, the Company’s outstanding debt of $354.3 million, which excludes debt discount and debt issuance costs, consisted of $250.2 million under the Global Ultraco Debt Facility and $104.1 million of Convertible Bond Debt.
During September 2022, the Company repurchased $10.0 million in aggregate principal amount of Convertible Bond Debt for $14.2 million in cash and cancelled the repurchased debt. The related amount of Convertible Bond Debt was not converted by the holders and no common shares were issued as a result of the repurchase transactions. The related amount of Convertible Bond Debt would have converted into 296,990 common shares (assuming the conversion occurred as of September 30, 2022). From time to time, the Company may, subject to market condition and other factors and to the extent permitted by law, opportunistically repurchase the Convertible Bond Debt in the open market or through privately negotiated transactions.
We continuously evaluate potential transactions that we believe will be accretive to earnings, enhance shareholder value or are in the best interests of the Company, including without limitation, business combinations, the acquisition of vessels or related businesses, repayment or refinancing of existing debt, the issuance of new securities, share and debt repurchases or other transactions.
Capital Expenditures and Drydocking
Our capital expenditures relate to the purchase of vessels and capital improvements to our vessels, which are expected to enhance the revenue earning capabilities and safety of the vessels.
In addition to acquisitions that we may undertake in future periods, the Company’s other major capital expenditures include funding the Company’s program of regularly scheduled drydocking necessary to comply with international shipping standards and environmental laws and regulations. Although the Company has some flexibility regarding the timing of its drydocking, the costs are relatively predictable. Management anticipates that vessels are to be drydocked every two and a half years for vessels older than 15 years and five years for vessels younger than 15 years. Funding of these requirements is anticipated to be met with cash from operations. We anticipate that this process of recertification will require us to reposition these vessels from a discharge port to shipyard facilities, which will reduce our available days and operating days during that period.
Drydocking costs incurred are deferred and amortized to expense on a straight-line basis over the period through the date of the next scheduled drydocking for those vessels. During the nine months ended September 30, 2022, eight of our vessels completed drydock and we incurred drydocking expenditures of $18.5 million. During the nine months ended September 30, 2021, six of our vessels completed drydock and we incurred drydocking expenditures of $10.7 million.
The following table represents certain information about the estimated costs for anticipated vessel drydockings, BWTS, and vessel upgrades in the next four quarters, along with the anticipated off-hire days:
Projected Costs (1) (in millions)
Quarter Ending
Off-hire Days(2)
BWTS
Drydocks
Vessel Upgrades(3)
December 31, 2022
177
$
0.3
$
1.5
$
—
March 31, 2023
233
0.1
5.4
0.4
June 30, 2023
186
0.7
3.8
0.4
September 30, 2023
193
0.7
4.0
0.4
(1) Actual costs will vary based on various factors, including where the drydockings are performed.
(2) Actual duration of off-hire days will vary based on the age and condition of the vessel, yard schedules and other factors.
(3) Vessel upgrades represents capex relating to items such as high-spec low friction hull paint which improves fuel efficiency and reduces fuel costs, NeoPanama Canal chock fittings enabling vessels to carry additional cargo through the new Panama Canal locks, as well as other retrofitted fuel-saving devices. Vessel upgrades are discretionary in nature and evaluated on a business case-by-case basis.
SUMMARY CONSOLIDATED FINANCIAL AND OTHER DATA
The following table summarizes the Company’s selected condensed consolidated financial and other data for the periods indicated below.
CONDENSED CONSOLIDATED STATEMENTS OF OPERATIONS (Unaudited) For the Three and Nine Months Ended September 30, 2022 and 2021 (In thousands, except share and per share data)
Three Months Ended
Nine Months Ended
September 30, 2022
September 30, 2021
September 30, 2022
September 30, 2021
Revenues, net
$
185,313
$
183,393
$
568,406
$
409,816
Voyage expenses
40,792
30,273
120,710
81,411
Vessel operating expenses
33,091
28,125
88,213
73,323
Charter hire expenses
19,772
10,724
63,768
25,374
Depreciation and amortization
15,407
13,570
45,241
39,187
General and administrative expenses
9,666
7,948
29,611
23,559
Other operating expense
2,469
792
2,643
2,312
Gain on sale of vessel
(9,336
)
(3,962
)
(9,336
)
(3,962
)
Total operating expenses
111,861
87,470
340,850
241,204
Operating income
73,452
95,923
227,556
168,612
Interest expense
4,236
8,511
13,021
25,561
Interest income
(881
)
(19
)
(1,100
)
(52
)
Realized and unrealized (gain)/loss on derivative instruments, net
(11,293
)
8,991
(13,281
)
45,588
Loss on debt extinguishment
4,173
99
4,173
99
Total other (income)/expense, net
(3,765
)
17,582
2,813
71,196
Net income
$
77,217
$
78,341
$
224,743
$
97,416
Weighted average shares outstanding:
Basic
12,993,450
12,802,401
12,985,329
12,237,288
Diluted
16,201,852
15,936,374
16,219,264
15,354,481
Per share amounts:
Basic net income
$
5.94
$
6.12
$
17.31
$
7.96
Diluted net income
$
4.77
$
4.92
$
13.86
$
6.34
CONDENSED CONSOLIDATED BALANCE SHEETS September 30, 2022 and December 31, 2021 (In thousands, except share data and par values)
September 30, 2022
December 31, 2021
(Unaudited)
ASSETS:
Current assets:
Cash and cash equivalents
$
195,030
$
86,147
Accounts receivable, net of a reserve of $2,192 and $1,818, respectively
33,554
28,456
Prepaid expenses
4,585
3,362
Inventories
26,274
17,651
Collateral on derivatives
1,200
15,081
Fair value of derivative assets – current
18,353
4,669
Other current assets
703
667
Total current assets
279,699
156,033
Noncurrent assets:
Vessels and vessel improvements, at cost, net of accumulated depreciation of $249,384 and $218,670, respectively
876,547
908,076
Advance for vessel purchase
4,125
—
Operating lease right-of-use assets
34,368
17,017
Other fixed assets, net of accumulated depreciation of $1,566 and $1,403, respectively
346
257
Restricted cash – noncurrent
2,575
75
Deferred drydock costs, net
45,881
37,093
Fair value of derivative assets – noncurrent
9,873
3,112
Advances for ballast water systems and other assets
2,577
4,995
Total noncurrent assets
976,292
970,625
Total assets
$
1,255,991
$
1,126,658
LIABILITIES & STOCKHOLDERS’ EQUITY:
Current liabilities:
Accounts payable
$
21,058
$
20,781
Accrued interest
1,635
2,957
Other accrued liabilities
17,012
17,994
Fair value of derivative liabilities – current
611
4,253
Current portion of operating lease liabilities
30,742
15,728
Unearned charter hire revenue
14,794
12,088
Current portion of long-term debt
49,800
49,800
Total current liabilities
135,652
123,601
Noncurrent liabilities:
Global Ultraco Debt Facility, net of debt issuance costs
193,202
229,290
Convertible Bond Debt, net of debt discount and debt issuance costs
103,425
100,954
Noncurrent portion of operating lease liabilities
3,626
1,282
Other noncurrent accrued liabilities
883
265
Total noncurrent liabilities
301,136
331,791
Total liabilities
436,788
455,392
Commitments and contingencies
Stockholders’ equity:
Preferred stock, $0.01 par value, 25,000,000 shares authorized, none issued as of September 30, 2022 and December 31, 2021
—
—
Common stock, $0.01 par value, 700,000,000 shares authorized, 13,003,516 and 12,917,027 shares issued and outstanding as of September 30, 2022 and December 31, 2021, respectively
130
129
Additional paid-in capital
964,494
982,746
Accumulated deficit
(162,712
)
(313,495
)
Accumulated other comprehensive income
17,291
1,886
Total stockholders’ equity
819,203
671,266
Total liabilities and stockholders’ equity
$
1,255,991
$
1,126,658
CONDENSED CONSOLIDATED STATEMENTS OF CASH FLOWS (Unaudited) For the Nine Months Ended September 30, 2022 and 2021 (In thousands)
Nine Months Ended
September 30, 2022
September 30, 2021
Cash flows from operating activities:
Net income
$
224,743
$
97,416
Adjustments to reconcile net income to net cash provided by operating activities:
Depreciation
35,513
32,951
Amortization of operating lease right-of-use assets
21,083
10,536
Amortization of deferred drydocking costs
9,728
6,236
Amortization of debt discount and debt issuance costs
1,627
5,443
Loss on debt extinguishment
4,173
99
Gain on sale of vessel
(9,336
)
(3,962
)
Net unrealized (gain)/loss on fair value of derivatives
(8,517
)
24,193
Stock-based compensation expense
4,542
2,235
Drydocking expenditures
(18,527
)
(10,737
)
Changes in operating assets and liabilities:
Accounts payable
650
4,639
Accounts receivable
(5,098
)
(10,645
)
Accrued interest
(1,241
)
2,385
Inventories
(8,622
)
(5,467
)
Operating lease liabilities current and noncurrent
(21,076
)
(11,304
)
Collateral on derivatives
13,881
(31,370
)
Fair value of derivatives, other current and noncurrent assets
(183
)
(1,150
)
Other accrued liabilities
(2,332
)
1,898
Prepaid expenses
(1,223
)
(1,455
)
Unearned charter hire revenue
2,706
8,974
Net cash provided by operating activities
242,491
120,915
Cash flows from investing activities:
Purchase of vessels and vessel improvements
(781
)
(109,385
)
Advances for vessel purchases
(4,125
)
(2,200
)
Purchase of scrubbers and ballast water systems
(5,695
)
(4,557
)
Proceeds from hull and machinery insurance claims
—
245
Proceeds from sale of vessel
14,944
9,159
Purchase of other fixed assets
(253
)
(29
)
Net cash provided by/(used in) investing activities
4,090
(106,767
)
Cash flows from financing activities:
Proceeds from New Ultraco Debt Facility
—
16,500
Repayment of Norwegian Bond Debt
—
(4,000
)
Repayment of term loan under New Ultraco Debt Facility
—
(24,258
)
Repayment of revolver loan under New Ultraco Debt Facility
—
(55,000
)
Repayment of revolver loan under Super Senior Facility
—
(15,000
)
Proceeds from revolver loan under New Ultraco Debt Facility
—
55,000
Proceeds from Holdco Revolving Credit Facility
—
24,000
Proceeds from issuance of shares under ATM Offering, net of commissions
—
27,242
Repayment of term loan under Global Ultraco Debt Facility
(37,350
)
—
Repurchase of Convertible Bond Debt
(14,188
)
—
Cash received from exercise of stock options
85
56
Cash used to settle net share equity awards
(2,351
)
(986
)
Equity offerings issuance costs
201
(292
)
Financing costs paid to lenders
(18
)
(614
)
Dividends paid
(81,577
)
—
Net cash (used in)/provided by financing activities
(135,198
)
22,648
Net increase in Cash, cash equivalents and restricted cash
111,383
36,796
Cash, cash equivalents and restricted cash at beginning of period
86,222
88,849
Cash, cash equivalents and restricted cash at end of period
$
197,605
$
125,645
SUPPLEMENTAL CASH FLOW INFORMATION
Cash paid during the period for interest
$
12,861
$
17,462
Operating lease right-of-use assets obtained in exchange for operating lease liabilities
$
38,956
$
22,499
Accruals for vessel purchases and vessel improvements included in Other accrued liabilities
$
—
$
500
Accruals for scrubbers and ballast water treatment systems included in Accounts payable and Other accrued liabilities
$
3,916
$
3,259
Accruals for dividends payable included in Other accrued liabilities and Other noncurrent accrued liabilities
$
1,551
$
—
Accrual for issuance costs for ATM Offering included in Other accrued liabilities
$
—
$
104
Accruals for debt issuance costs included in Accounts payable and Other accrued liabilities
$
—
$
509
Supplemental Information – Non-GAAP Financial Measures
This release includes various financial measures that are non-GAAP financial measures as defined under the rules of the Securities and Exchange Commission (“SEC”). We believe these measures provide important supplemental information to investors to use in evaluating ongoing operating results. We use these measures, together with accounting principles generally accepted in the United States (“GAAP” or “U.S. GAAP”) measures, for internal managerial purposes and as a means to evaluate period-to-period comparisons. However, we do not, and you should not, rely on non-GAAP financial measures alone as measures of our performance. We believe that non-GAAP financial measures reflect an additional way of viewing aspects of our operations, that when taken together with GAAP results and the reconciliations to corresponding GAAP financial measures that we also provide in our press releases, provide a more complete understanding of factors and trends affecting our business. We strongly encourage you to review all of our financial statements and publicly-filed reports in their entirety and to not rely on any single financial measure.
Because non-GAAP financial measures are not standardized, it may not be possible to compare these financial measures with other companies’ non-GAAP financial measures, even if they have similar names.
Non-GAAP Financial Measures
(1) Adjusted net income and Adjusted Basic and Diluted net income per share
We define Adjusted net income and Adjusted Basic and Diluted net income per share as Net income and Basic and Diluted net income per share, each under U.S. GAAP, respectively, adjusted to exclude non-cash unrealized losses/(gains) on derivatives and loss on debt extinguishment. The Company utilizes derivative instruments such as FFAs to partially hedge against its underlying long physical position in ships (as represented by owned and third-party chartered-in vessels). The Company does not apply hedge accounting, and, as such, the mark-to-market gains/(losses) on forward hedge positions impact current quarter results, causing timing mismatches in the Condensed Consolidated Statements of Operations. Additionally, we believe that loss on debt extinguishment is not representative of our normal business operations. We believe that Adjusted net income and Adjusted Basic and Diluted net income per share are more useful to analysts and investors in comparing the results of operations and operational trends between periods and relative to other peer companies in our industry. Our Adjusted net income should not be considered an alternative to net income, operating income, cash flows provided by operating activities or any other measure of financial performance or liquidity presented in accordance with U.S. GAAP. The Company’s calculation of Adjusted net income may not be comparable to those reported by other companies.
The following table presents the reconciliation of Net income, as recorded in the Condensed Consolidated Statements of Operations, to Adjusted net income:
Reconciliation of GAAP Net income to Adjusted net income For the Three and Nine Months Ended September 30, 2022 and 2021 (In thousands, except share and per share data)
Three Months Ended
Nine Months Ended
September 30, 2022
September 30, 2021
September 30, 2022
September 30, 2021
Net income
$
77,217
$
78,341
$
224,743
$
97,416
Adjustments to reconcile net income to Adjusted net income:
Unrealized (gain)/loss on derivative instruments
(7,124
)
(6,347
)
(8,517
)
24,193
Loss on debt extinguishment
4,173
99
4,173
99
Adjusted net income
$
74,266
$
72,093
$
220,399
$
121,708
Weighted average shares outstanding:
Basic
12,993,450
12,802,401
12,985,329
12,237,288
Diluted (1)
16,201,852
15,936,374
16,219,264
15,354,481
Per share amounts:
Basic adjusted net income
$
5.72
$
5.63
$
16.97
$
9.95
Diluted adjusted net income(1)
$
4.58
$
4.52
$
13.59
$
7.93
(1) The number of shares used in the calculation of Diluted net income per share and Diluted adjusted net income per share for the three and nine months ended September 30, 2022 and 2021 includes 3,092,230 and 2,906,035, respectively, in dilutive shares related to the Convertible Bond Debt based on the if-converted method in addition to the restricted stock awards, options, and restricted stock units based on the treasury stock method.
(2) EBITDA and Adjusted EBITDA
We define EBITDA as net income under U.S. GAAP adjusted for interest, income taxes, depreciation and amortization.
Adjusted EBITDA is a non-GAAP financial measure that is used as a supplemental financial measure by our management and by external users of our financial statements, such as investors, commercial banks and others, to assess our operating performance as compared to that of other companies in our industry, without regard to financing methods, capital structure or historical costs basis. Adjusted EBITDA should not be considered an alternative to net income, operating income, cash flows provided by operating activities or any other measure of financial performance or liquidity presented in accordance with U.S. GAAP. The Company’s calculation of Adjusted EBITDA may not be comparable to those reported by other companies. Adjusted EBITDA represents EBITDA adjusted to exclude the items which represent certain non-cash, one-time and other items such as vessel impairment, gain/(loss) on sale of vessels, impairment of operating lease right-of-use assets, unrealized (gain)/loss on derivatives, loss on debt extinguishment and stock-based compensation expenses that the Company believes are not indicative of the ongoing performance of its core operations.
The following table presents a reconciliation of Net income, as recorded in the Condensed Consolidated Statements of Operations, to EBITDA and Adjusted EBITDA:
Reconciliation of GAAP Net income to EBITDA and Adjusted EBITDA For the Three and Nine Months Ended September 30, 2022 and 2021 (In thousands)
Three Months Ended
Nine Months Ended
September 30, 2022
September 30, 2021
September 30, 2022
September 30, 2021
Net income
$
77,217
$
78,341
$
224,743
$
97,416
Adjustments to reconcile net income to EBITDA:
Interest expense
4,236
8,511
13,021
25,561
Interest income
(881
)
(19
)
(1,100
)
(52
)
Income taxes
—
—
—
—
EBIT
80,572
86,833
236,664
122,925
Depreciation and amortization
15,407
13,570
45,241
39,187
EBITDA
95,979
100,403
281,905
162,112
Non-cash, one-time and other adjustments to EBITDA(1)
(10,838
)
(9,433
)
(9,138
)
22,565
Adjusted EBITDA
$
85,141
$
90,970
$
272,767
$
184,677
(1) One-time and other adjustments to EBITDA for the three and nine months ended September 30, 2022 includes stock-based compensation, loss on debt extinguishment, gain on sale of vessel and net unrealized gains on derivative instruments. One-time and other adjustments to EBITDA for the three and nine months ended September 30, 2021 includes stock-based compensation, loss on debt extinguishment, gain on sale of vessel and net unrealized (gains)/losses on derivative instruments.
(3) TCE revenue and TCE
Time charter equivalent (“TCE”) is a non-GAAP financial measure that is commonly used in the shipping industry primarily to compare daily earnings generated by vessels on time charters with daily earnings generated by vessels on voyage charters, because charter hire rates for vessels on voyage charters are generally not expressed in per-day amounts while charter hire rates for vessels on time charters generally are expressed in such amounts. The Company defines TCE revenue as revenues, net less voyage expenses and charter hire expenses, adjusted for realized gains/(losses) on FFAs and bunker swaps and defines TCE as TCE revenue divided by the number of owned available days. Owned available days is the number of our ownership days less the aggregate number of days that our vessels are off-hire due to vessel familiarization upon acquisition, repairs, vessel upgrades or special surveys. The shipping industry uses available days to measure the number of days in a period during which vessels should be capable of generating revenues. TCE provides additional meaningful information in conjunction with shipping Revenues, net, the most directly comparable GAAP measure, because it assists Company management in making decisions regarding the deployment and use of its vessels and in evaluating their performance. The Company’s calculation of TCE may not be comparable to that reported by other companies. The Company calculates relative performance by comparing TCE against the Baltic Supramax Index (“BSI”) adjusted for commissions and fleet makeup.
The following table presents the reconciliation of Revenues, net, as recorded in the Condensed Consolidated Statements of Operations, to TCE:
Reconciliation of Revenues, net to TCE For the Three and Nine Months Ended September 30, 2022 and 2021 (In thousands, except owned available days and TCE)
Three Months Ended
Nine Months Ended
September 30, 2022
September 30, 2021
September 30, 2022
September 30, 2021
Revenues, net
$
185,313
$
183,393
$
568,406
$
409,816
Less:
Voyage expenses
(40,792
)
(30,273
)
(120,710
)
(81,411
)
Charter hire expenses
(19,772
)
(10,724
)
(63,768
)
(25,374
)
Reversal of one legacy time charter (1)
—
—
—
(854
)
Realized gain/(loss) on FFAs and bunker swaps
4,169
(15,338
)
4,764
(21,395
)
TCE revenue
$
128,918
$
127,058
$
388,692
$
280,782
Owned available days
4,588
4,368
13,599
12,685
TCE
$
28,099
$
29,088
$
28,582
$
22,135
(1) Represents revenues, net of voyage and charter-hire expenses associated with a 2014 charter-in vessel that is not representative of the Company’s current performance.
Glossary of Terms:
Ownership days: We define ownership days as the aggregate number of days in a period during which each vessel in our fleet has been owned by us. Ownership days are an indicator of the size of our fleet over a period and affect both the amount of revenues and the amount of expenses that we recorded during a period.
Chartered-in under operating lease days: We define chartered-in under operating lease days as the aggregate number of days in a period during which we chartered-in vessels. Periodically, the Company charters in vessels on a single trip basis.
Available days: We define available days as the number of our ownership days and chartered-in days less the aggregate number of days that our vessels are off-hire due to vessel familiarization upon acquisition, repairs, vessel upgrades or special surveys and other reasons which prevent the vessel from performing under the relevant charter party such as surveys, medical events, stowaway disembarkation, etc. The shipping industry uses available days to measure the number of days in a period during which vessels should be capable of generating revenues.
Operating days: We define operating days as the number of available days in a period less the aggregate number of days that our vessels are off-hire due to any reason, including unforeseen circumstances. The shipping industry uses operating days to measure the aggregate number of days in a period during which vessels actually generate revenues.
Fleet utilization: We calculate fleet utilization by dividing the number of our operating days during a period by the number of our available days during the period. The shipping industry uses fleet utilization to measure a company’s efficiency in finding suitable employment for its vessels and minimizing the amount of days that its vessels are off-hire for reasons other than scheduled repairs or repairs under guarantee, vessel upgrades, special surveys or vessel positioning. Our fleet continues to perform at high utilization rates.
ATM Offering: In March 2021, the Company entered into an at market issuance sales agreement with B. Riley Securities, Inc., BTIG, LLC and Fearnley Securities, Inc., as sales agents, to sell shares of common stock, par value $0.01 per share, of the Company with aggregate gross sales proceeds of up to $50.0 million, from time to time through an “at-the-market” offering program.
Definitions of capitalized terms related to our Indebtedness
Global Ultraco Debt Facility: Global Ultraco Debt Facility refers to the senior secured credit facility entered into by Eagle Bulk Ultraco LLC (“Eagle Ultraco”), a wholly-owned subsidiary of the Company, along with certain of its vessel-owning subsidiaries as guarantors, with the lenders party thereto (the “Lenders”), Credit Agricole Corporate and Investment Bank (“Credit Agricole”), Skandinaviska Enskilda Banken AB (PUBL), Danish Ship Finance A/S, Nordea Bank ABP, Filial I Norge, DNB Markets Inc., Deutsche Bank AG, and ING Bank N.V., London Branch. The Global Ultraco Debt Facility provides for an aggregate principal amount of $400.0 million, which consists of (i) a term loan facility in an aggregate principal amount of $300.0 million and (ii) a revolving credit facility in an aggregate principal amount of $100.0 million. The Global Ultraco Debt Facility is secured by 49 of the Company’s vessels. As of September 30, 2022, $100.0 million of the revolving credit facility remains undrawn.
Convertible Bond Debt: Convertible Bond Debt refers to 5.0% Convertible Senior Notes due 2024 issued by the Company on July 29, 2019 that will mature on August 1, 2024.
New Ultraco Debt Facility: New Ultraco Debt Facility refers to the senior secured credit facility for $208.4 million entered into by Ultraco Shipping LLC, a wholly-owned subsidiary of the Company, as the borrower (the “New Ultraco Debt Facility”), with the Company and certain of its indirectly vessel-owning subsidiaries, as guarantors (the “Guarantors”), the lenders party thereto, the swap banks party thereto, ABN AMRO Capital USA LLC (“ABN AMRO”), Credit Agricole, Skandinaviska Enskilda Banken AB (PUBL) and DNB Markets Inc., as mandated lead arrangers and bookrunners, and Credit Agricole Corporate and Investment Bank, as arranger, security trustee and facility agent. The New Ultraco Debt Facility was refinanced on October 1, 2021.
Norwegian Bond Debt: Norwegian Bond Debt refers to the Senior Secured Bonds issued by Eagle Bulk Shipco LLC, a wholly-owned subsidiary of the Company (“Shipco”), as borrower, certain wholly-owned vessel-owning subsidiaries of Shipco, as guarantors (“Shipco Vessels”), on November 28, 2017 for $200.0 million, pursuant to those certain Bond Terms, dated as of November 22, 2017, by and between Shipco, as issuer, and Nordic Trustee AS, a company existing under the laws of Norway (the “Bond Trustee”). The bonds outstanding under the Norwegian Bond Debt were repaid in full on October 18, 2021 after the expiry of the requisite notice period.
Super Senior Facility: Super Senior Facility refers to the credit facility for $15.0 million, by and among Shipco as borrower, and ABN AMRO, as original lender, mandated lead arranger and agent. During the third quarter of 2021, the Company cancelled the Super Senior Revolving Facility. There were no outstanding amounts under the facility.
Holdco Revolving Credit Facility: Holdco Revolving Credit Facility refers to the senior secured revolving credit facility for $35.0 million, by and among Eagle Bulk Holdco LLC (“Holdco”), a wholly-owned subsidiary of the Company, as borrower, the Company and certain wholly-owned vessel-owning subsidiaries of Holdco, as joint and several guarantors, the banks and financial institutions named therein as lenders and Credit Agricole, as lender, facility agent, security trustee and mandated lead arranger with Nordea Bank ABP, New York Branch. The Holdco Revolving Credit Facility was refinanced on October 1, 2021.
Conference Call Information
As previously announced, members of Eagle Bulk’s senior management team will host a teleconference and webcast at 8:00 a.m. ET on Friday, November 4, 2022, to discuss the third quarter results.
A live webcast of the call will be available on the Investor Relations page of the Company’s website at ir.eagleships.com. To access the call by phone, please register at https://register.vevent.com/register/BIcc27852061574d51b01e45b8dc164b47 and you will be provided with dial-in details. A replay of the webcast will be available on the Investor Relations page of the Company’s website.
About Eagle Bulk Shipping Inc.
Eagle Bulk Shipping Inc. (“Eagle” or the “Company”) is a U.S. based fully integrated, shipowner-operator providing global transportation solutions to a diverse group of customers including miners, producers, traders, and end users. Headquartered in Stamford, Connecticut, with offices in Singapore and Copenhagen, Denmark, Eagle focuses exclusively on the versatile mid-size drybulk vessel segment and owns one of the largest fleets of Supramax/Ultramax vessels in the world. The Company performs all management services in-house (including: strategic, commercial, operational, technical, and administrative) and employs an active management approach to fleet trading with the objective of optimizing revenue performance and maximizing earnings on a risk-managed basis. For further information, please visit our website: www.eagleships.com.
Website Information
We intend to use our website, www.eagleships.com, as a means of disclosing material non-public information and for complying with our disclosure obligations under Regulation FD. Such disclosures will be included in our website’s Investor Relations section. Accordingly, investors should monitor the Investor Relations portion of our website, in addition to following our press releases, filings with the SEC, public conference calls, and webcasts. To subscribe to our e-mail alert service, please click the “Investor Alerts” link in the Investor Relations section of our website and submit your email address. The information contained in, or that may be accessed through, our website is not incorporated by reference into or a part of this document or any other report or document we file with or furnish to the SEC, and any references to our website are intended to be inactive textual references only.
Disclaimer: Forward-Looking Statements
Matters discussed in this release may constitute forward-looking statements that may be deemed to be “forward-looking statements” within the meaning of Section 27A of the Securities Act of 1933, as amended, and Section 21E of the Securities Exchange Act of 1934, as amended. Forward-looking statements reflect current views with respect to future events and financial performance and may include statements concerning plans, objectives, goals, strategies, future events or performance, and underlying assumptions and other statements, which are other than statements of historical facts. These statements may include words such as “believe,” “estimate,” “project,” “intend,” “expect,” “plan,” “anticipate,” and similar expressions in connection with any discussion of the timing or nature of future operating or financial performance or other events.
The forward-looking statements in this release are based upon various assumptions, many of which are based, in turn, upon further assumptions, including without limitation, examination of historical operating trends, data contained in our records and other data available from third parties. Although Eagle Bulk Shipping Inc. believes that these assumptions were reasonable when made, because these assumptions are inherently subject to significant uncertainties and contingencies which are difficult or impossible to predict and are beyond our control, Eagle Bulk Shipping Inc. cannot assure you that it will achieve or accomplish these expectations, beliefs or projections.
Important factors that, in our view, could cause actual results to differ materially from those discussed in the forward-looking statements include the strength of world economies and currencies, general market conditions, including changes in charter hire rates and vessel values, changes as a result of COVID-19, including the availability and effectiveness of vaccines on a widespread basis and the impact of any mutations of the virus, changes in demand that may affect attitudes of time charterers to scheduled and unscheduled drydocking, changes in vessel operating expenses, including drydocking and insurance costs, or actions taken by regulatory authorities, ability of our counterparties to perform their obligations under sales agreements, charter contracts, and other agreements on a timely basis, potential liability from future litigation, domestic and international political conditions including the current conflict between Russia and Ukraine, which may impact our ability to retain and source crew, and in turn, could adversely affect our revenue, expenses and profitability, potential disruption of shipping routes due to accidents and political events or acts by terrorists.
Risks and uncertainties are further described in reports filed by Eagle Bulk Shipping Inc. with the SEC.
CONTACT
Company Contact: Frank De Costanzo Chief Financial Officer Eagle Bulk Shipping Inc. Tel. +1 203-276-8100 Email: investor@eagleships.com
Media: ICR, Inc. Tel. +1 203-682-8350 ——————————————————————————– Source: Eagle Bulk Shipping Inc.