With more than 60 units, RCI Hospitality Holdings, Inc., through its subsidiaries, is the country’s leading company in adult nightclubs and sports bars/restaurants. Clubs in New York City, Chicago, Dallas-Fort Worth, Houston, Miami, Minneapolis, Denver, St. Louis, Charlotte, Pittsburgh, Raleigh, Louisville, and other markets operate under brand names such as Rick’s Cabaret, XTC, Club Onyx, Vivid Cabaret, Jaguars Club, Tootsie’s Cabaret, Scarlett’s Cabaret, Diamond Cabaret, and PT’s Showclub. Sports bars/restaurants operate under the brand name Bombshells Restaurant & Bar.
Joe Gomes, Senior Research Analyst, Noble Capital Markets, Inc.
Joshua Zoepfel, Research Associate, Noble Capital Markets, Inc.
Refer to the full report for the price target, fundamental analysis, and rating.
Keeps Getting Clubs. RCI Hospitality announced last week the acquisition of Heartbreakers Adult Nightclub for $9 million. The 5-stage, 23,000 square foot Heartbreakers club is located at 3200 Gulf Freeway, Dickinson, TX, and the Company acquired the club using $4.0 million in cash and $5.0 million in a 15-year, 6% real estate seller financing note. The Company did not release any financials for the club but we would expect the price to be within RCI’s 3-5x adjusted EBITDA for the club.
Area Around the Club. Dickinson, Texas had a population of 20,870 in 2020 according to Data USA with a median household income of $70,468. The median household income is a positive for RICK in our view as it is higher than the median income in the United States ($67,521), which we believe provides the Company with higher spending customers as the population has higher disposable income. The location of the club is also a positive due to it being near a freeway, which provides visibility to potential customers. Established in 1986, Heartbreakers is the number one adult entertainment venue in the Galveston, Texas, area.
This Company Sponsored Research is provided by Noble Capital Markets, Inc., a FINRA and S.E.C. registered broker-dealer (B/D).
*Analyst certification and important disclosures included in the full report. NOTE: investment decisions should not be based upon the content of this research summary. Proper due diligence is required before making any investment decision.
Joe Gomes, Senior Research Analyst, Noble Capital Markets, Inc.
Joshua Zoepfel, Research Associate, Noble Capital Markets, Inc.
Refer to the full report for the price target, fundamental analysis, and rating.
Why ORN? We believe the new management team, with its relevant industry experience, sees the robust end markets and opportunities to build the business, both organically and inorganically. We believe Orion is uniquely positioned to capitalize on the extraordinary market potential, both in the Marine sector and the Concrete business.
Near-term: Picking Low Hanging Fruit. While the new management team sets a course for the business, they are taking advantage of low hanging fruit to improve near-term operational results, such as continued improvement in contracts and reducing overhead burden.
This Company Sponsored Research is provided by Noble Capital Markets, Inc., a FINRA and S.E.C. registered broker-dealer (B/D).
*Analyst certification and important disclosures included in the full report. NOTE: investment decisions should not be based upon the content of this research summary. Proper due diligence is required before making any investment decision.
Cumulus Media (NASDAQ: CMLS) is an audio-first media company delivering premium content to over a quarter billion people every month — wherever and whenever they want it. Cumulus Media engages listeners with high-quality local programming through 406 owned-and-operated radio stations across 86 markets; delivers nationally-syndicated sports, news, talk, and entertainment programming from iconic brands including the NFL, the NCAA, the Masters, CNN, the AP, the Academy of Country Music Awards, and many other world-class partners across more than 9,500 affiliated stations through Westwood One, the largest audio network in America; and inspires listeners through the Cumulus Podcast Network, its rapidly growing network of original podcasts that are smart, entertaining and thought-provoking. Cumulus Media provides advertisers with personal connections, local impact and national reach through broadcast and on-demand digital, mobile, social, and voice-activated platforms, as well as integrated digital marketing services, powerful influencers, full-service audio solutions, industry-leading research and insights, and live event experiences. Cumulus Media is the only audio media company to provide marketers with local and national advertising performance guarantees. For more information visit www.cumulusmedia.com.
Michael Kupinski, Director of Research, Noble Capital Markets, Inc.
Refer to the full report for the price target, fundamental analysis, and rating.
Favorable Q3 results. The company reported Q3 revenue of $233.5 million, just above our expectation of $230 million. Despite revenue decreasing 2% from the previous quarter Adj. EBITDA grew by 1.6% to $46.6 million beating our forecast of $41.7 million by 11.7%.
Lowers guidance. Q4 revenue is expected to decline low to mid single digits in spite of influx of Political advertising, which too appears softer than expected.Local advertising appears to have softened, which implies that local businesses are now feeling the affect of the economic headwinds. Management lowered Adj. EBITDA guidance from a range of $175 million to $200 million to a range of $160 million to $170 million.
This Research is provided by Noble Capital Markets, Inc., a FINRA and S.E.C. registered broker-dealer (B/D).
*Analyst certification and important disclosures included in the full report. NOTE: investment decisions should not be based upon the content of this research summary. Proper due diligence is required before making any investment decision.
A Blood Test that Screens for Multiple Cancers at Once Promises to Boost Early Detection
Detecting cancer early before it spreads throughout the body can be lifesaving. This is why doctors recommend regular screening for several common cancer types, using a variety of methods. Colonoscopies, for example, screen for colon cancer, while mammograms screen for breast cancer.
While important, getting all these tests done can be logistically challenging, expensive and sometimes uncomfortable for patients. But what if a single blood test could screen for most common cancer types all at once?
This is the promise of multicancer early detection tests, or MCEDs. This year, President Joe Biden identified developing MCED tests as a priority for the Cancer Moonshot, a US$1.8 billion federal effort to reduce the cancer death rate and improve the quality of life of cancer survivors and those living with cancer.
This article was republished with permission from The Conversation, a news site dedicated to sharing ideas from academic experts. It represents the research-based findings and thoughts of Colin Pritchard, Professor of Laboratory Medicine and Pathology, University of Washington.
As a laboratory medicine physician and researcher who develops molecular tests for cancer, I believe MCED tests are likely to transform cancer screening in the near future, particularly if they receive strong federal support to enable rapid innovation.
How MCED Tests Work
All cells in the body, including tumor cells, shed DNA into the bloodstream when they die. MCED tests look for the trace amounts of tumor DNA in the bloodstream. This circulating “cell-free” DNA contains information about what type of tissue it came from and whether it is normal or cancerous.
Testing to look for circulating tumor DNA in the blood is not new. These liquid biopsies – a fancy way of saying blood tests – are already widely used for patients with advanced-stage cancer. Doctors use these blood tests to look for mutations in the tumor DNA that help guide treatment. Because patients with late-stage cancer tend to have a large amount of tumor DNA circulating in the blood, it’s relatively easy to detect the presence of these genetic changes.
MCED tests are different from existing liquid biopsies because they are trying to detect early-stage cancer, when there aren’t that many tumor cells yet. Detecting these cancer cells can be challenging early on because noncancer cells also shed DNA into the bloodstream. Since most of the circulating DNA in the bloodstream comes from noncancer cells, detecting the presence of a few molecules of cancer DNA is like finding a needle in a haystack.
Making things even more difficult, blood cells shed abnormal DNA naturally with aging, and these strands can be confused for circulating cancer DNA. This phenomenon, known as clonal hematopoiesis, confounded early attempts at developing MCED tests, with too many false positive results.
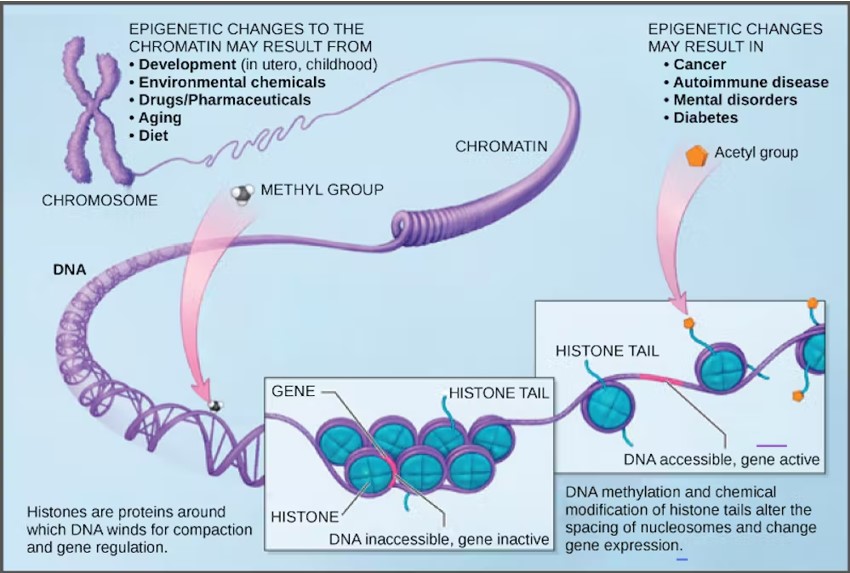
Fortunately, newer tests are able to avoid blood cell interference by focusing on a type of “molecular barcode” embedded in the cancer DNA that identifies the tissue it came from. These barcodes are a result of DNA methylation, naturally existing modifications to the surface of DNA that vary for each type of tissue in the body. For example, lung tissue has a different DNA methylation pattern than breast tissue. Furthermore, cancer cells have abnormal DNA methylation patterns that correlate with cancer type. By cataloging different DNA methylation patterns, MCED tests can focus on the sections of DNA that distinguish between cancerous and normal tissue and pinpoint the cancer’s origin site.
DNA contains molecular patterns that indicate where in the body it came from. (CNX OpenStax/Wikimedia Commons)
Testing Options
There are currently several MCED tests in development and in clinical trials. No MCED test is currently FDA-approved or recommended by medical societies.
In 2021, the biotech company GRAIL, LLC launched the first commercially available MCED test in the U.S. Its Galleri test claims to detect over 50 different types of cancers. At least two other U.S.-based companies, Exact Sciences and Freenome, and one Chinese company, Singlera Genomics, have tests in development. Some of these tests use different cancer detection methods in addition to circulating tumor DNA, such as looking for cancer-associated proteins in blood.
MCED tests are not yet typically covered by insurance. GRAIL’s Galleri test is currently priced at $949, and the company offers a payment plan for people who have to pay out of pocket. Legislators have introduced a bill in Congress to provide Medicare coverage for MCED tests that obtain FDA approval. It is unusual for Congress to consider legislation devoted to a single lab test, and this highlights both the scale of the medical market for MCED and concerns about disparities in access without coverage for these expensive tests.
How Should MCED Tests be Used?
Figuring out how MCED tests should be implemented in the clinic will take many years. Researchers and clinicians are just beginning to address questions on who should be tested, at what age, and how past medical and family history should be taken into account. Setting guidelines for how doctors will further evaluate positive MCED results is just as important.
There is also concern that MCED tests may result in overdiagnoses of low-risk, asymptomatic cancers better left undetected. This happened with prostate cancer screening. Previously, guidelines recommended that all men ages 55 to 69 regularly get blood tests to determine their levels of PSA, a protein produced by cancerous and noncancerous prostate tissue. But now the recommendation is more nuanced, with screening suggested on an individual basis that takes into account personal preferences.
Another concern is that further testing to confirm positive MCED results will be costly and a burden to the medical system, particularly if a full-body scan is required. The out-of-pocket cost for an MRI, for example, can run up to thousands of dollars. And patients who get a positive MCED result but are unable to confirm the presence of cancer after extensive imaging and other follow-up tests may develop lifelong anxiety about a potentially missed diagnosis and continue to take expensive tests in fruitless search for a tumor.
Despite these concerns, early clinical studies show promise. A 2020 study of over 10,000 previously undiagnosed women found 26 of 134 women with a positive MCED test were confirmed to have cancer. A 2021 study sponsored by GRAIL found that half of the over 2,800 patients with a known cancer diagnosis had a positive MCED test and only 0.5% of people confirmed to not have cancer had a false positive test. The test performed best for patients with more advanced cancers but did detect about 17% of the patients who had very-early-stage disease.
MCED tests may soon revolutionize the way clinicians approach cancer screening. The question is whether the healthcare system is ready for them.
What Other Than a Large Rate Hike Can Investors Expect this Week?
Another 75 basis point hike is expected on Wednesday after the November 1-2 FOMC meeting. The discussion that is expected to immediately follow is will the Federal Reserve slow or pause its tightening from there. Those answers can’t be certain as even the Fed hasn’t seen the economic numbers unfold that will lead to the next meeting and play a part in the decision.
Since March, the FOMC has raised rates a cumulative 300 basis points. If they move .75 percent this week, the fed funds target range will be 3.75%-4.00%. This range was last experienced after the January 2008 meeting.
In September’s Summary of Economic Projections, the FOMC forecast for the fed funds rate was 1.25 percent above the current level or .50 percent above what most expect we will have by the end of the week. The statement and remarks following the next FOMC meeting by Chairman Powell may suggest that the FOMC is going to slow down the upward movement in rates while they see if previous rate hikes have begun to have a slowing impact on the economic pace.
The second scheduled event with the most potential to impact markets is the October Employment Situation on Thursday.
From there, all attention and talk may be on the elections next week, as they can have a powerful impact on market moves.
Monday 10/31
9:45 am US Chicago Purchasing Managers Report (PMI). The consensus is 47.3. For September, this survey of business conditions in the Chicago area showed a collapse to 45.7. A small improvement is expected from the October Survey
10:30 am Dallas Fed Manufacturing Survey is expected to come in at -18.0. This would be the sixth straight negative reading. This survey tracks manufacturing in Texas; for September, the results were -17.2.
3:00 pm US Farm Prices are expected to have come down during October by -1.8%, showing a year-over-year rate of 20% increase in farm prices. This is an important inflationary gauge as farm prices are a leading indicator of food price changes Consumer Price Index (CPI). There is a direct relationship between inflation and interest rates; markets can be influenced as interest rate expectations rise and fall.
Tuesday 11/1
The Federal Open Market Committee meets eight times a year in order to determine the near-term direction of monetary policy. The November meeting extends through November 2. After the meeting, typically at 2 pm, any change in monetary policy is announced.
10:00 am US Construction Spending is expected to have fallen by -.5%. Construction spending fell 0.7 percent in August, which was the seventh straight lower-than-expected result, showing lower activity in this important economic sector.
10:00 am JOLTS report consensus is 9.875 million. These reported job openings have been falling over several months; the previous month’s (August) openings reported were 10.05 million. The acronym JOLTS stands for Job Openings and Labor Turnover Survey.
Wednesday 11/2
Motor Vehicle Sales (US) are expected to have increased to 14.2 million from 13.5 million in September. The pattern of consumption is a direct influencer on company earnings and stock prices. Strong economic growth translates to healthy corporate profits and higher stock prices.
10:30 am EIA Petroleum Report shows crude inventory changes, as well as gasoline and other petroleum products. The Energy Information Administration provides this report weekly. During periods when inflation and fuel prices are a concern, the data in these reports can play a wider-than-normal role in influencing stock, bond, and of course, commodity price levels.
FOMC Announcement usually comes at 2:00 pm. The expectations had not changed since the last meeting when it became widely expected that the Federal Reserve would raise overnight lending rates at this meeting by 0.75%. A big focus will be on the policy statement following the meeting to sense at what pace removing accommodation will continue in the US.
Thursday 11/3
8:30 am US Jobless Clams are expected to be 222,000 for the week ending October 29. The prior week they had been 217,000. Employment is one of the Feds’ primary concerns as it fights inflation which also tops the list.
10:00 am US Factory orders are expected to have risen in September by 0.3%. The prior month this leading indicator of future economic activity was flat.
10:30 am EIA Natural Gas weekly report will update the current stocks and storage as well as production information from five regions within the US.
Friday 11/4
8:30 am, the Employment Situation report is released. It is expected to show an unemployment rate of 3.6%, or 210,000. The results of this survey have the potential to jar markets late in the week as one of the more important measures of a healthy economy (weak or overheated) is employment levels.
What Else
If the week brings more clarity from the Federal Reserve and likely next moves, investors may begin to focus on retail numbers as the calendar moves toward the shopping season.
Is the Halloween Investment Strategy a Trick or a Treat?
What Is the Halloween Strategy? Is it statistically reliable? What have the results been?
The directive, “Always remember to buy in November,” has a few different names; the Halloween effect, the Halloween indicator, are among the more common. It answers the question, If I sell in May and walk away, when do I come back? This is because the “Halloween Strategy” and the “Sell in May” strategies are related — they are different ways of suggesting the same action. The results should be identical.
What Is It?
The Halloween strategy is over a century old. Buying when October ends is essentially a market-timing strategy based on the thought that the overall stock market performs better between Oct. 31st (Halloween) and May 1st than it performs from May through the end of October. The directive suggests first that market timing yields better results than buy and hold. Secondly, it says the probability of better results compared to buying and holding is increased, over this period. Those who subscribe to this approach recommend not investing at all during the summer months.
Evidence suggests this strategy does perform well over time, but despite many theories, there is no clear or agreed-upon reason. A famous study was done by Sven Bouman (AEGON Asset Mgmt.) and Ben Jacobsen (Erasmus University Rotterdam) and published in the American Economic Review December 2002. The study documents the existence of a strong seasonal effect in stock returns based on the Halloween indicator. They found the “inherited wisdom” to be true globally and useful in 36 of the 37 developed and emerging markets they studied. They reported the Sell in May effect tends to be particularly strong in European countries and is robust over time. Their sample evidence shows that in the UK the effect has been noticeable since 1694. They also reported, “While we have examined a number of possible explanations, none of these appears to explain the puzzle convincingly.”
Is it Reliable?
I didn’t go back as far as 1694 the way Sven and Ben did. And I didn’t collect data from emerging and developed markets around the globe. More pertinent to Channelchek readers is whether this strategy used on the U.S. markets has been worthwhile.
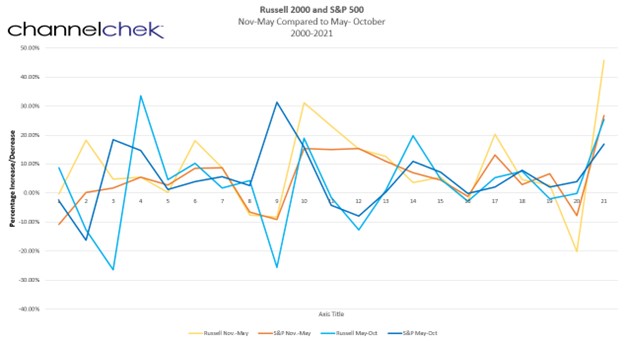
Data Source: Koyfin
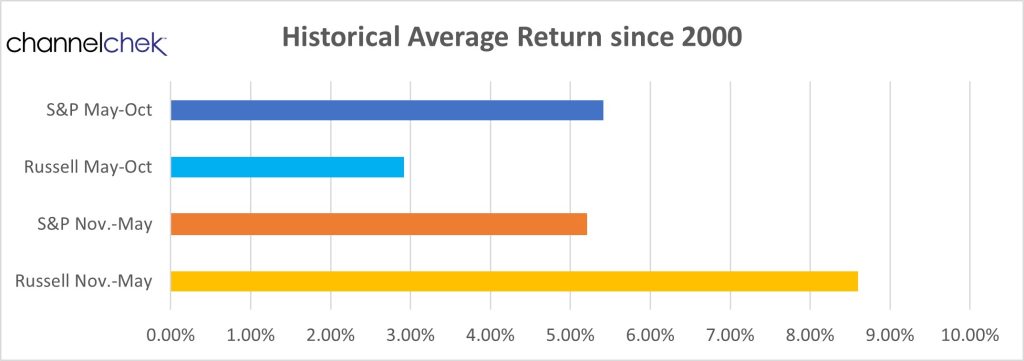
The above chart is a compilation of average results for two six-month periods, May through October and November through April. It also looks at two different indexes, the largest stocks in the S&P 500 (blue shades) index and small-cap stocks of the Russell 2000 (orange shades).
What was discovered is that during the period, investors in either of these indexes would have had positive earnings during either “season.” So it supports “buy and hold” wisdom or, at least, staying invested. During the Halloween through May period, the smallcap Russell returned 8.60%, while during the other six months, performance was a weaker 2.92%. The S&P 500 maintained consistent averages in the low 5% area for either period.
What Have the Results Been?
Since the turn of the century, investors would have fared better if they bought stocks represented in the small-cap average after Halloween, then moved to S&P 500 stocks in May. Below are the results of the 21 periods. The highest returns of either index occurred during the latest Halloween to May cycle. It was the small-cap index that measured a 45.76% gain. The index also measured the second-highest gain during the Sell in May 2004 measurement period. The Sell in May small-cap index also can claim the two lowest performance numbers.
Data Source: Koyfin
Take-Away
The Halloween strategy says that investors should be fully invested in stocks from November through April, and out of stocks from May through October. Variations of this strategy and its accompanying axioms have been around for over a century. Looking at the last 21 years, a deviation that would have paid off would have been moving to small-caps after Halloween.
Both “seasons,” for both measured indexes had positive average earnings. So the notion of staying fully invested is supported using recent data.
TULSA, Okla.–(BUSINESS WIRE)– Alliance Resource Partners, L.P. (NASDAQ: ARLP) today announced that the Board of Directors of ARLP’s general partner approved an increased cash distribution to its unitholders for the quarter ended September 30, 2022 (the “2022 Quarter”).
ARLP unitholders will receive a cash distribution for the 2022 Quarter of $0.50 per unit (an annualized rate of $2.00 per unit), payable on November 14, 2022 to all unitholders of record as of the close of trading on November 7, 2022. The announced distribution represents a 150.0% increase over the cash distribution of $0.20 per unit for the quarter ended September 30, 2021 and a 25.0% increase over the cash distribution of $0.40 per unit for the quarter ended June 30, 2022.
As previously announced, ARLP will report financial results for the 2022 Quarter before the market opens on Monday, October 31, 2022 and Alliance management will discuss these results during a conference call beginning at 10:00 a.m. Eastern that same day.
To participate in the conference call, dial (877) 407-0784 and request to be connected to the Alliance Resource Partners, L.P. earnings conference call. International callers should dial (201) 689-8560 and request to be connected to the same call. Investors may also listen to the call via the “investor relations” section of ARLP’s website at http://www.arlp.com.
An audio replay of the conference call will be available for approximately one week. To access the audio replay, dial U.S. Toll Free (844) 512-2921; International Toll (412) 317-6671 and request to be connected to replay using access code 13733069.
This announcement is intended to be a qualified notice under Treasury Regulation Section 1.1446-4(b), with 100% of the partnership’s distributions to foreign investors attributable to gross income, gain or loss that is effectively connected with a United States trade or business. Accordingly, ARLP’s distributions to foreign investors are subject to federal income tax withholding at the highest applicable tax rate.
About Alliance Resource Partners, L.P.
ARLP is a diversified energy company that is currently the largest coal producer in the eastern United States. ARLP also generates operating and royalty income from mineral interests it owns in strategic coal and oil & gas producing regions in the United States. In addition, ARLP is positioning itself as an energy provider for the future by leveraging its core technology and operating competencies to make strategic investments in the fast-growing energy and infrastructure transition.
News, unit prices and additional information about ARLP, including filings with the Securities and Exchange Commission (“SEC”), are available at http://www.arlp.com. For more information, contact the investor relations department of ARLP at (918) 295-7674 or via e-mail at investorrelations@arlp.com.
Brian L. Cantrell Alliance Resource Partners, L.P. (918) 295-7673
MELVILLE, N.Y.–(BUSINESS WIRE)–Oct. 27, 2022– October 27, 2022– Comtech (NASDAQ: CMTL) announced today that during its first quarter of fiscal 2023, the Company was awarded over $50.0 million of incremental funding on an existing contract to provide next generation troposcatter systems in support of the U.S. military. For over 50 years, Comtech has been a world leader in the design and supply of modernized troposcatter technologies. Our Troposcatter Family of Systems are just one way that Comtech helps to ensure that our customers can count on secure, uninterrupted connectivity where (and when) it matters most.
About Comtech
Comtech Telecommunications Corp. is a leading global provider of next-generation 911 emergency systems and secure wireless communications technologies to commercial and government customers around the world. Headquartered in Melville, New York and with a passion for customer success, Comtech designs, produces and markets advanced and secure wireless solutions. For more information, please visit www.comtech.com or see our Signals blog at https://www.comtech.com/comtech-signals/.
Forward-Looking Statements
Certain information in this press release contains statements that are forward-looking in nature and involve certain significant risks and uncertainties. Actual results could differ materially from such forward-looking information. The Company’s Securities and Exchange Commission filings identify many such risks and uncertainties. Any forward-looking information in this press release is qualified in its entirety by the risks and uncertainties described in such Securities and Exchange Commission filings.
Tokens.com Corp is a publicly traded company that invests in Web3 assets and businesses focused on the Metaverse, NFTs, DeFi, and gaming based digital assets. Tokens.com is the majority owner of Metaverse Group, one of the world’s first virtual real estate companies. Hulk Labs, a wholly-owned Tokens.com subsidiary, focuses on investing in play-to-earn revenue generating gaming tokens and NFTs. Additionally, Tokens.com owns and stakes crypto assets to earn additional tokens. Through its growing digital assets and NFTs, Tokens.com provides public market investors with a simple and secure way to gain exposure to Web3.
Joe Gomes, Senior Research Analyst, Noble Capital Markets, Inc.
Joshua Zoepfel, Research Associate, Noble Capital Markets, Inc.
Refer to the full report for the price target, fundamental analysis, and rating.
Getting More Players. On Wednesday, Tokens.com announced the Company’s subsidiary Hulk Labs has integrated over 1,000 players into its network, with the primary focus being in Africa which includes Tanzania, South Africa, and the Democratic Republic of Congo. The waitlist of players to join the network is over 3,000 and the Company expects to add hundreds of players each month, with the target of getting to 10,000 players by the end of 2023. Hulk Labs has initially allocated over USD$100,000 into gaming assets for the network, and its top gaming titles, Crabada and Thetan Arena, are returning 18-24% per month in revenue.
A New Software? A potential addition to revenue, a new software is being tested that will allow investors to connect to players, and the Company will receive a commission based on the revenue earned. We expect the software to be implemented over time, but add to top-line revenue once fully integrated, as investors are already gauging an interest in the software.
This Company Sponsored Research is provided by Noble Capital Markets, Inc., a FINRA and S.E.C. registered broker-dealer (B/D).
*Analyst certification and important disclosures included in the full report. NOTE: investment decisions should not be based upon the content of this research summary. Proper due diligence is required before making any investment decision.
The GEO Group, Inc. (NYSE: GEO) is a leading diversified government service provider, specializing in design, financing, development, and support services for secure facilities, processing centers, and community reentry centers in the United States, Australia, South Africa, and the United Kingdom. GEO’s diversified services include enhanced in-custody rehabilitation and post-release support through the award-winning GEO Continuum of Care®, secure transportation, electronic monitoring, community-based programs, and correctional health and mental health care. GEO’s worldwide operations include the ownership and/or delivery of support services for 103 facilities totaling approximately 83,000 beds, including idle facilities and projects under development, with a workforce of up to approximately 18,000 employees.
Joe Gomes, Senior Research Analyst, Noble Capital Markets, Inc.
Joshua Zoepfel, Research Associate, Noble Capital Markets, Inc.
Refer to the full report for the price target, fundamental analysis, and rating.
3Q22 Results. GEO once again posted solid operating results for 3Q22. Revenue for the quarter came in at $616.7 million, up from $557.3 million a year ago. Adjusted EBITDA totaled $136.2 million, AFFO was $0.60 per diluted share, EPS was $0.26, and adjusted net income $0.33 per share. In the year ago period, GEO reported $116.0 million, $0.65, $0.24, and $0.35, respectively. We had forecast $605 million, $132 million, $0.55, $0.35, and $0.35, respectively. GEO’s results highlight the resiliency of the business model, in our opinion.
BI Continues to Impress. GEO BI electronic monitoring subsidiary continues to show impressive growth. Segment 3Q22 revenue increased to $137 million up from $121.5 million in 2Q22. Through the first nine months of 2022, electronic monitoring and supervision revenue increased to $346.4 million, up from $278.9 million in all of 2021.
This Company Sponsored Research is provided by Noble Capital Markets, Inc., a FINRA and S.E.C. registered broker-dealer (B/D).
*Analyst certification and important disclosures included in the full report. NOTE: investment decisions should not be based upon the content of this research summary. Proper due diligence is required before making any investment decision.
Mark Reichman, Senior Research Analyst, Natural Resources, Noble Capital Markets, Inc.
Refer to the full report for the price target, fundamental analysis, and rating.
Another box checked. Cypress Development selected thyssenkrupp nucera USA, Inc. to provide the design and engineering for the chlor-alkali plant as it advances its Clayton Valley Lithium Project in Nevada. The chlor-alkali plant will enable the project to produce two key reagents, hydrochloric acid and sodium hydroxide, required for processing lithium-bearing claystone through to a lithium carbonate product. The company’s selection of thyssenkrupp nucera represents another step towards completion of the feasibility study in the second quarter of 2023.
Feasibility study is taking shape. Work on the feasibility study commenced in March under the direction of Wood PLC and is advancing as planned. Wood, along with support from others, has completed or is nearing completion of several items, including resource and reserve estimates, mine plan, processing plant design, and tailings and waste storage facilities.
This Company Sponsored Research is provided by Noble Capital Markets, Inc., a FINRA and S.E.C. registered broker-dealer (B/D).
*Analyst certification and important disclosures included in the full report. NOTE: investment decisions should not be based upon the content of this research summary. Proper due diligence is required before making any investment decision.
Pregnancy in Space: Studying Stem Cells in Zero Gravity May Determine Whether it’s Safe
Space is a hostile, extreme environment. It’s only a matter of time before ordinary people are exposed to this environment, either by engaging in space tourism or by joining self-sustaining colonies far away from Earth.
To this end, there needs to be a much better understanding of how the environmental dangers of space will affect the biology of our cells, tissues, organs, and cognition. Crucially for future space colonies, we need to know whether we can easily reproduce in environments other than those found on Earth.
The effects of radiation on our cells, producing DNA damage, are well documented. What’s less clear is how lower levels of gravity, what scientists call microgravity, will affect the mechanisms and rhythms taking place within our cells.
Scientists are only just beginning to investigate how activity in our cells might be affected by exposure to microgravity. Crucially, experiments on embryonic stem cells, and models of how embryos develop in their first few weeks in space, will help us determine whether it’s possible for humans to produce offspring in the extraplanetary colonies of the future.
Cosmic Conception
The ability to reproduce in space has been assessed in a few animals, including insects, amphibians, fish, reptiles, birds, and rodents. They have found that it’s certainly possible for organisms such as fish, frogs and geckos to produce fertilised eggs during spaceflight that can live and reproduce on Earth.
But the picture is more complicated in mammals. A study of mice, for instance, found that their oestrous cycle, part of the reproductive cycle, was disrupted by exposure to microgravity. Another study found that exposure to microgravity caused negative neurological alterations in rats. Hypothetically, these effects could also be transmitted to subsequent generations.
This likely happens because our cells did not evolve to work in microgravity. They evolved over millions of years on Earth, in it’s unique gravitational field. Earth’s gravity is part of what anchors and exerts physical force on our tissues, our cells, and our intracellular contents, helping to control specific movements within cells. The study of this is called mechanobiology.
The division of cells and the movement of genes and chromosomes within them, which is crucial to the development of a foetus, also works with and against the force of gravity as we know it on Earth. It follows that systems evolved to work perfectly in Earth’s gravity may be affected when the force of gravity changes.
Fetal Position
When an embryo first starts to divide, in a process called cleavage, the rate of division can be faster at one end of the embryo than the other. Gravity plays a role here, determining the position of the very first building blocks in a human life.
gravity also helps to establish the correct body plan of a fetus, ensuring the right cells develop in the right places in the right numbers and in the right spatial orientation.
Researchers have investigated whether embryonic stem cells, which are “pluripotent” and can develop into all cells of the body, are affected by microgravity. At present, there is some evidence that when rodent embryonic stem cells are subjected to microgravity, their ability to become the desired cell types may be impacted.
It is also possible to produce pluripotent human stem cells from normal mature cells of our bodies, which are called induced pluripotent stem cells. These have also been studied under microgravity, with experiments on Earth finding that induced stem cells proliferate faster in simulated microgravity. Two batches of these stem cells are currently on the International Space Station to see whether these results can be replicated in space.
If adult stem cells do proliferate faster in space, it could open the door for commercial stem cell manufacturers to produce these cells in orbit, seeing as it’s difficult to culture enough stem cells on Earth to treat degenerative diseases with stem cell therapies.
Gravitational Field
Besides normal cellular processes, it’s also unclear how fertilization, hormone production, lactation, and even birth itself will be affected by exposure to microgravity.
It seems that short-term exposure to microgravity, of perhaps half an hour, will probably not have too much of an effect on our cells. But longer exposures of days or weeks are likely to have an effect. This is not taking into account the effect of radiation on our cells and DNA, but we already know how to protect against radiation.
Scientists are looking at two ways to protect against the adverse effects of microgravity on our biology: intervention at the cellular level, using drugs or nanotechnology, and intervention on the environmental level, by simulating Earth’s gravity in spacecraft or off-world colonies. Both fields of study are in their early stages.
Still, studying stem cells in space provides a valuable window into how pregnancy could work, or not work when we’re outside Earth’s gravitational field. For now, those fortunate enough to go to space might do well to avoid attempting to conceive before, during or directly after a space flight.
The Mid-Term Elections are Just One of the SEC’s Concerns
The mid-term elections have the potential to alter the course of the markets. It’s easy to recognize how the possible outcomes can cause changes to the overall economy, including industry sectors, fuel prices, and perhaps even national debt levels. But, one area that is less obvious could also impact investors in a big way, regulation. As election day is now days away, many regulatory changes that have been in the works are quickly coming to a head, with the expectations there may be a change in priorities, power, and philosophy. The push to get things through in the coming days may still be undermined by the U.S. system. Here’s why.
The U.S. Government at Work
Federal regulators are in scramble-mode working to finalize proposed rules before what appears will be a change in the balance of power in the legislative branch. The possibility that there may be a Republican-controlled Congress or the expected idea that the democrats will lose control over one of the branches of Congress would soften their ability to institute their aggressive agendas. As the agencies refine their proposals, they also have to be mindful that it isn’t just the new Congress that will be evaluating new regulations. The Supreme Court has recently taken a heightened interest in agencies overstepping their charter, that interest is likely to continue.
It’s easy to see how Congress whose job it is to decide where money is spent, can dampen the agenda of the Department of Education (DOE), Internal Revenue Service (IRS), Food and Drug Administration (FDA), or Gary Gensler’s plans at the Securities and Exchange Commission (SEC). But, the Supreme Court is also more than a casual observer and has shown how willing it is to make sure everyone stays in their defined lanes.
Recent SEC Initiatives
The SEC has a three-part mission that includes protecting investors, maintaining fair, orderly, and efficient markets, and facilitating capital formation. Under Gary Gensler, it has been working overtime to impact the changing marketplaces. The initiatives are considered by some to be beyond the scope of the SEC’s lawful mission.
Gensler, who was appointed by President Biden, has been extremely active. The former Chairman of the U.S. Commodities Futures Trading Commission (CFTC) and MIT economics professor is proposing or finalizing dozens of regulations. Some are minor alterations to existing rules, but many are complete redesigns of how they are handled now. This redesign may make it past an unenthusiastic Congress, as they have more pressing priorities, but they may experience an aggressive halt from the country’s Judicial branch.
Recent Supreme Court Actions
In June of 2022, the Supreme Court decided W. Virginia v. EPA. The decision struck down an EPA regulation fighting climate change. The decision was made based on the grounds that the rule violated the “major questions doctrine.” The Court had never used that term before, but it seemed evident that the court might use the term and intent of the phrase should it be called on to review other federal agencies and commissions.
The Court has the authority and now recent precedent to unwind regulation that goes beyond the original intent of Congress when an agency was created or any subsequent legal grants of authority. The 6-3 ruling against the EPA explained the Clean Air Act, designed for new power plant emissions, did not extend to existing plants requiring them to shift to wind or solar. It’s a nod by the Court to keep bureaucracies from growing beyond the express original legal reason for being.
The ruling also is relevant in that it looked at Congress’s unwillingness to legislate and legitimize the way that the agency chose to regulate. One Justice in a concurring opinion wrote the decision was in part based on whether the agency was “intruding” in a traditional area of state law.
How it Could Impact Investors
Under the major questions doctrine, several SEC efforts may become far more difficult.
One high-profile SEC goal involves environmental initiatives. Climate change activists have supported the SEC’s proposal to require companies to increase their disclosure of anticipated climate risks. But it would be difficult for the SEC to weigh its mission against this initiative and easily demonstrate that anyone has a great impact on the other (orderly markets, investor protection, capital formation). If environmental initiatives are to be carried out, they will need to be enacted by the representatives elected to legislate on behalf of citizens.
It is easy to see how priorities focusing more on fiscal restraint rather than environmental awareness could alter the investors playing field with a power change in the Capital building.
The so-called greening of Wall Street is just one example of how the elections will impact the coming year’s winners and losers in the stock market. Consider the SEC’s proposed rules for swaps, which are financial instruments that some investors use to speculate on securities. The SEC’s suggested rule would require public disclosure within a day of these transactions to the public. The proposed rule can be considered an unprecedented intervention in this multi-trillion-dollar market. The argument is strengthened by the reality that Congress could have authorized disclosure in the 2010 Dodd-Frank Act, but did not. The Supreme Court would be expected to rule on behalf of the laws as written.
Another SEC initiative also at risk is the proposed rule on “beneficial” ownership. Such a definition is important for a host of reporting obligations. The SEC is considering expanding what counts as ownership. But questions of ownership have long been a matter of state concern. Gorsuch may have something to say about the SEC’s effort to expand the definition.
Another example is Kim Kardashian, who was ordered by the SEC to pay a fine for having touted a cryptocurrency on her Instagram account and the compensation she failed to disclose. The SEC has been in a battle with other financial overseers of the U.S. financial system to regulate and control digital currencies, which may or may not meet the definitions of a security or other language that legally created the commission.
Take Away
Regulatory agencies, including the SEC, are likely to have to contend with increased barriers with both the only branch of government that makes both laws and spends money and the branch that deciphers and enforces laws. Rather than argue if this is what should be, or if it slows down progress when wearing one’s investor hat,” investors may only want to consider what industries and what companies within those industries will be the winners and losers – then how does that fit into your overall portfolio strategy.
If you haven’t registered to receive equity research and thoughtful articles and videos from Channelchek, this is a good time to sign-up in preparation for the year-end and 2023. Click here for free registration.