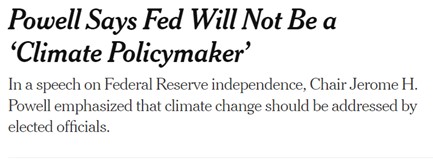
The Fed May Try to Talk Rates Up While Increasing Overnight Levels by a Lower Amount
There will be plenty for the market to digest this week. While all ears will be on what Fed Chairman Powell says following Wednesday’s FOMC policy announcement, investors will get to also digest a barage of earnings reports. The quarterly reports, from various sectors, may set the tone for their industries. These include reporting on Monday by Advanced Micro (AMD), Amgen (AMGN), Caterpillar (CAT), Exxon Mobil (XOM), McDonald’s (MCD), Pfizer (PFE), and United Parcel (UPS). On Tuesday Meta Platforms (META) will be one of the most talked about, then on Wednesday the market gets a barrage from tech and pharmaceutical companies as Alphabet (GOOGL), Amazon.com (AMZN), Apple (AAPL), Bristol-Myers (BMY), Eli Lilly (LLY), Honeywell (HON), Merck (MRK), and Qualcomm (QCOM) are all scheduled to report operating performance.
Monday 1/30
- With no consequential economic releases, market direction may take its tone from earnings reports from a wide swath of industries (see tickers above).
Tuesday 1/31
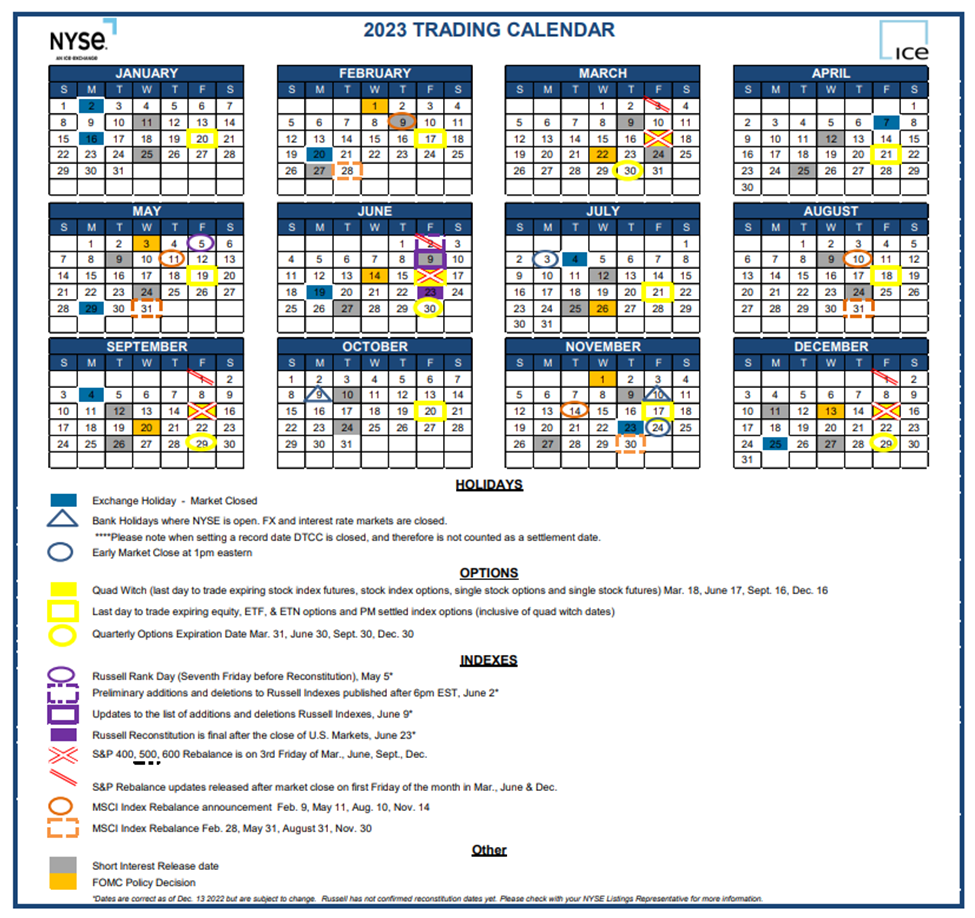
- The first of 2023’s eight scheduled two-day FOMC meetings begins.
- 8:30 AM ET, Employment Cost Index is expected to have risen 1.1% for the fourth quarter. For the last five quarters, large gains of 1 percent and more have been keeping wage inflation a concern.
- 8:30 AM ET, After jumping 7 points in December, the consumer confidence index is expected to firm only 0.7 of a point to 109.0 in January. The pattern in consumer attitudes and spending is often the largest influence on stock and bond markets. For stocks, strong economic growth translates to healthy corporate profits and possibly higher stock prices as a result.
Wednesday 2/1
- 7:00 AM ET, the Mortgage Bankers’ Association (MBA) compiles various mortgage loan indexes. The purchase applications index measures applications at mortgage lenders. This is a leading indicator for single-family home sales and housing construction. The composite index is expected to come in at 27.9%, while the Purchase applications are expected to show a reading of 24.7%. The data provides a gauge of not only the demand for housing, but economic momentum.
- 9:45 AM ET, Construction Spending, for December is expected to slip 0.1 percent after moving 0.2 percent higher in November. Spending has been flat in recent months as gains in non-residential construction have been offset by declines on the residential side.
- 10:00 AM ET, Job Openings and Labor Turnover Survey (JOLTS), which have been steady to lower, are expected to fall to 10.2 million in December versus 10.458 million in November.
- 2:00 PM ET, FOMC meeting concludes with statement of policy shift. The Fed is expected to reduce its rate hike magnitude to 25 basis points. A 0.25% increase would raise the overnight Fed Funds rate range up to 4.50% – 4.75%.
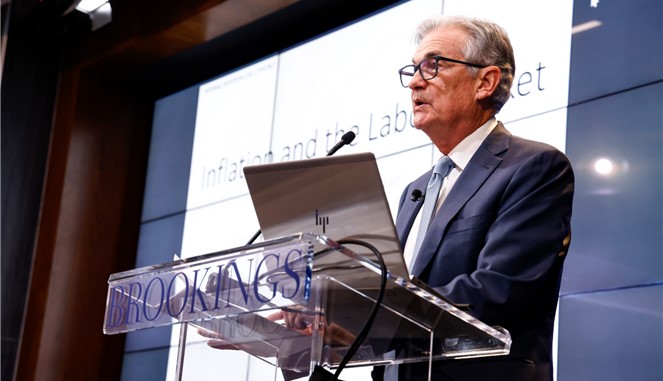
- 2:30 PM ET, Fed Chair Powell’s press briefing. The purpose of the briefing is to provide additional context to the FOMC’s policy decisions and to allow for questions-and-answers with the press. There has been concern that the market has been pushing rates down out in terms beyond two years to maturity. This could be a undermining the Fed’s stated objective by tightening. If this is true, the briefing may be filled with language that tries to convince the bond markets, that the Fed is determined to slow the economy by pushing rates up.
Thursday 2/2
- 7:30 AM ET, the Challenger Job Cut report counts and categorizes announcements of corporate layoffs based on mass layoff data from state departments of labor. The job-cut report doesn’t distinguish between layoffs scheduled for the short-term or the long term, or whether job cuts are handled through attrition or actual dismissals. Also, the job-cut report does not include jobs eliminated in small batches over a longer time period. Unlike most economic data, this series is not adjusted for seasonal variation.
- 8:30 AM ET, Nonfarm Productivity is expected to rise to a 2.4 percent annualized rate in the fourth quarter versus growth of 0.8 percent in the third quarter. Unit labor costs, which rose 2.4 percent in the third quarter, are expected to rise to a 1.5 percent rate in the fourth quarter.
- 10:00 AM ET, Factory Orders are expected to rise 2.2 percent in December following November’s steep 1.8 percent drop. The expected increase comes in the wake of a surge in aircraft orders.
Friday 2/3
• 8:30 AM ET, Nonfarm Payroll is expected to have grown 185,000 in January versus 223,000 in December which was the eighth straight month and tenth of the last eleven that payroll growth exceeded the average economists expectation. Average hourly earnings in January are expected to rise 0.3 percent on the month for a year-over-year rate of 4.4 percent.
What Else
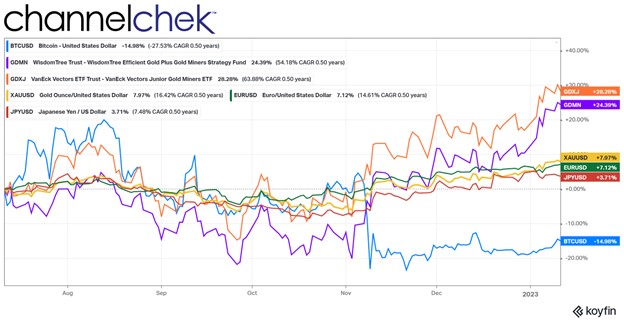
The tone of the chatter that is expected to come from Fed officials is one of continued hawkishness. The Fed’s preferred inflation measure (PCE) was at 4.4% for all of 2022, and has been trending downward. This is more than double the stated target of 2%. The question they are now facing is, whether they should soon pause tightening and observe the impact of previous moves. Or if the solid employment numbers and strong bank reserve positions leave room for continuing the war on inflation through aggressive overnight rate hikes. Powell’s press conference after the 2 pm announcement on Wednesday should reveal quite a bit.
Managing Editor, Channelchek