One Stop Systems, Inc. (OSS) designs and manufactures innovative AI Transportable edge computing modules and systems, including ruggedized servers, compute accelerators, expansion systems, flash storage arrays, and Ion Accelerator™ SAN, NAS, and data recording software for AI workflows. These products are used for AI data set capture, training, and large-scale inference in the defense, oil and gas, mining, autonomous vehicles, and rugged entertainment applications. OSS utilizes the power of PCI Express, the latest GPU accelerators and NVMe storage to build award-winning systems, including many industry firsts, for industrial OEMs and government customers. The company enables AI on the Fly® by bringing AI datacenter performance to ‘the edge,’ especially on mobile platforms, and by addressing the entire AI workflow, from high-speed data acquisition to deep learning, training, and inference. OSS products are available directly or through global distributors. For more information, go to www.onestopsystems.com.
Joe Gomes, Managing Director, Equity Research Analyst, Generalist , Noble Capital Markets, Inc.
Joshua Zoepfel, Research Associate, Noble Capital Markets, Inc.
Refer to the full report for the price target, fundamental analysis, and rating.
1Q23 Results. Revenue of $16.8 million, slightly above guidance and our $16.2 million estimate but down 1.6% y-o-y. As expected, the Disguise business continues to run off. Higher operating expenses, including some one-time items, drove a net loss of $400,512, or a loss of $0.02/sh in the quarter, compared to net income of $579,234, or EPS of $0.03/sh per share last year. We had forecast net income of $31,200, or breakeven on a per share basis. Adjusted EPS was $0.00 compared to $0.05 last year.
Activity Remains High. OSS added seven new program wins during the first quarter. These wins should yield about $5 million of revenue in 2023. The Company also added three new pending major programs during the quarter. The pipeline of pending major programs at the end of the first quarter totaled 34, with 18 of these involving AI transportable applications in the U.S., Asia Pacific, and Europe.
Equity Research is available at no cost to Registered users of Channelchek. Not a Member? Click ‘Join’ to join the Channelchek Community. There is no cost to register, and we never collect credit card information.
This Company Sponsored Research is provided by Noble Capital Markets, Inc., a FINRA and S.E.C. registered broker-dealer (B/D).
*Analyst certification and important disclosures included in the full report. NOTE: investment decisions should not be based upon the content of this research summary. Proper due diligence is required before making any investment decision.
Mark Reichman, Managing Director, Equity Research Analyst, Natural Resources, Noble Capital Markets, Inc.
Refer to the full report for the price target, fundamental analysis, and rating.
Carbon neutral lithium production. In April, LithiumBank signed a memorandum of understanding with ZS2 Technologies Inc. for the eventual deployment of ZS2’s proprietary and patented direct-air-capture technology to capture carbon dioxide emissions from LithiumBank’s Boardwalk and Park Place projects. ZS2 will also process treated brine to collect magnesium and calcium for use in their proprietary magnesium cement products. The ZS2 processing facility will generate acid and base byproducts that can cost effectively be used in LithiumBank’s lithium processing plant at Boardwalk. The collaboration with ZS2 supports LithiumBank’s goal of becoming a carbon neutral lithium producer in Alberta.
Flow-through private placement. In April, LithiumBank announced a C$6 million “bought deal” private placement of 3,158,000 units issued on a charity flow-through (FT) basis at a price of C$1.90 per FT unit for gross proceeds of C$6,000,200. Each FT unit is comprised of one common share to be issued as a flow-through share and three quarters of one common share purchase warrant. Each FT warrant will entitle the holder to purchase one non-flow-through common share at an exercise price of C$2.00 for a period of 36 months from the date of issuance. The proceeds will fund eligible exploration expenditures.
Equity Research is available at no cost to Registered users of Channelchek. Not a Member? Click ‘Join’ to join the Channelchek Community. There is no cost to register, and we never collect credit card information.
This Company Sponsored Research is provided by Noble Capital Markets, Inc., a FINRA and S.E.C. registered broker-dealer (B/D).
*Analyst certification and important disclosures included in the full report. NOTE: investment decisions should not be based upon the content of this research summary. Proper due diligence is required before making any investment decision.
Kelly (Nasdaq: KELYA, KELYB) connects talented people to companies in need of their skills in areas including Science, Engineering, Education, Office, Contact Center, Light Industrial, and more. We’re always thinking about what’s next in the evolving world of work, and we help people ditch the script on old ways of thinking and embrace the value of all workstyles in the workplace. We directly employ nearly 350,000 people around the world and connect thousands more with work through our global network of talent suppliers and partners in our outsourcing and consulting practice. Revenue in 2021 was $4.9 billion. Visit kellyservices.com and let us help with what’s next for you.
Joe Gomes, Managing Director, Equity Research Analyst, Generalist , Noble Capital Markets, Inc.
Joshua Zoepfel, Research Associate, Noble Capital Markets, Inc.
Refer to the full report for the price target, fundamental analysis, and rating.
1Q23. Revenue of $1.27 billion was down 2.2% year-over-year (down 1.4% in constant currency). We were at $1.23 billion. Kelly took a $5.7 million restructuring charge during the quarter. GAAP net income was $10.9 million, or EPS of $0.29/sh, compared to a GAAP loss of $47.6 million, or a loss of $1.23/sh, last year. Adjusted EPS for 1Q23 was $0.40 versus $0.44 last year. We had projected adjusted EPS of $0.27.
Accelerating Profitable Growth. Management announced a comprehensive and intensive transformation initiative to optimize the business and functional operations in a sustainable manner, unlock additional value-creating opportunities, and accelerate profitable growth.
Equity Research is available at no cost to Registered users of Channelchek. Not a Member? Click ‘Join’ to join the Channelchek Community. There is no cost to register, and we never collect credit card information.
This Company Sponsored Research is provided by Noble Capital Markets, Inc., a FINRA and S.E.C. registered broker-dealer (B/D).
*Analyst certification and important disclosures included in the full report. NOTE: investment decisions should not be based upon the content of this research summary. Proper due diligence is required before making any investment decision.
InPlay Oil is a junior oil and gas exploration and production company with operations in Alberta focused on light oil production. The company operates long-lived, low-decline properties with drilling development and enhanced oil recovery potential as well as undeveloped lands with exploration possibilities. The common shares of InPlay trade on the Toronto Stock Exchange under the symbol IPO and the OTCQX Exchange under the symbol IPOOF.
Michael Heim, Senior Vice President, Equity Research Analyst, Energy & Transportation, Noble Capital Markets, Inc.
Refer to the full report for the price target, fundamental analysis, and rating.
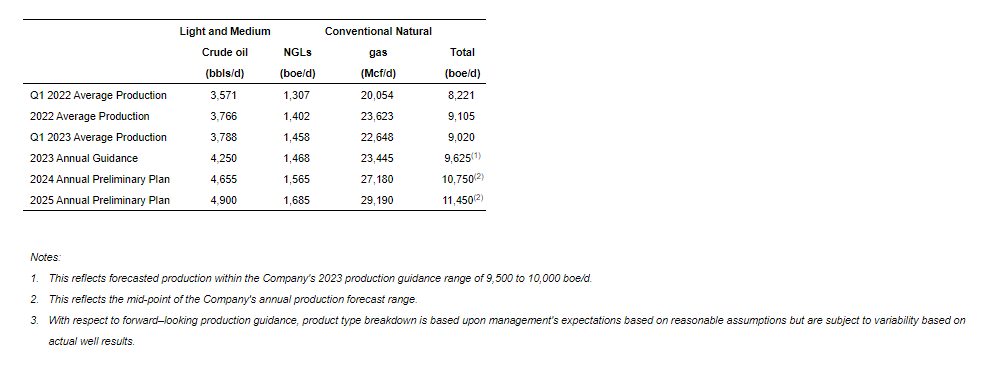
Production levels hit by curtailments. InPlay reported average quarterly production of 9,020 boe/d in the 2023-1Q vs. 8,221 boe/d for 2022-1Q, and below last quarter’s production and our expectations. Management indicated that gas curtailments reduced production by 625 boe/d. Increased back pressure has become an issue in recent quarters as production is rising faster than the infrastructure can handle, even as new infrastructure investments are being made.
Lower production caused bottom-line numbers to be below expectations. Although InPlay did a good job holding the line on costs, it was unable to offset the reduction in sales. As a result, management lowered cash flow guidance for the year. Cash flow should improve in upcoming quarters due to accelerated drilling activity including bringing two wells online with impressive flow rates.
Equity Research is available at no cost to Registered users of Channelchek. Not a Member? Click ‘Join’ to join the Channelchek Community. There is no cost to register, and we never collect credit card information.
This Company Sponsored Research is provided by Noble Capital Markets, Inc., a FINRA and S.E.C. registered broker-dealer (B/D).
*Analyst certification and important disclosures included in the full report. NOTE: investment decisions should not be based upon the content of this research summary. Proper due diligence is required before making any investment decision.
Cumulus Media (NASDAQ: CMLS) is an audio-first media company delivering premium content to over a quarter billion people every month — wherever and whenever they want it. Cumulus Media engages listeners with high-quality local programming through 406 owned-and-operated radio stations across 86 markets; delivers nationally-syndicated sports, news, talk, and entertainment programming from iconic brands including the NFL, the NCAA, the Masters, CNN, the AP, the Academy of Country Music Awards, and many other world-class partners across more than 9,500 affiliated stations through Westwood One, the largest audio network in America; and inspires listeners through the Cumulus Podcast Network, its rapidly growing network of original podcasts that are smart, entertaining and thought-provoking. Cumulus Media provides advertisers with personal connections, local impact and national reach through broadcast and on-demand digital, mobile, social, and voice-activated platforms, as well as integrated digital marketing services, powerful influencers, full-service audio solutions, industry-leading research and insights, and live event experiences. Cumulus Media is the only audio media company to provide marketers with local and national advertising performance guarantees. For more information visit www.cumulusmedia.com.
Michael Kupinski, Director of Research, Equity Research Analyst, Digital, Media & Technology , Noble Capital Markets, Inc.
Patrick McCann, CFA, Research Analyst, Noble Capital Markets, Inc.
Refer to the full report for the price target, fundamental analysis, and rating.
Announces tender offer. On May 12, the company announced that it commenced a modified Dutch auction tender offer to purchase up to $10 million of shares of its Class A common stock. The offer is being made under the company’s previously announced $50 million share repurchase program. The offer begins on May 12, and will expire on June 9, 2023 at 12:00 A.M EST.
Terms of the Offer. The offer allows shareholders to decide how many shares they are willing to sell at a given price. The price range in the offer is $3.25 to $2.85 per share, and is not conditioned on any minimum amount of shares being tendered. All shares purchased in the offer will be purchased at the same price regardless of tendered price. Additionally, the company reserves the right to change the per share purchase price, and offer an additional 2% of its outstanding Class A common shares without amending or extending the offer.
Equity Research is available at no cost to Registered users of Channelchek. Not a Member? Click ‘Join’ to join the Channelchek Community. There is no cost to register, and we never collect credit card information.
This Research is provided by Noble Capital Markets, Inc., a FINRA and S.E.C. registered broker-dealer (B/D).
*Analyst certification and important disclosures included in the full report. NOTE: investment decisions should not be based upon the content of this research summary. Proper due diligence is required before making any investment decision.
Cocrystal Pharma, Inc. is a clinical-stage biotechnology company discovering and developing novel antiviral therapeutics that target the replication process of influenza viruses, coronaviruses (including SARS-CoV-2), hepatitis C viruses and noroviruses. Cocrystal employs unique structure-based technologies and Nobel Prize-winning expertise to create first- and best-in-class antiviral drugs. For further information about Cocrystal, please visit www.cocrystalpharma.com.
Robert LeBoyer, Senior Vice President, Equity Research Analyst, Biotechnology, Noble Capital Markets, Inc.
Refer to the full report for the price target, fundamental analysis, and rating.
Progress Continues In Influenza and COVID-19 Programs. Cocrystal has been using its proprietary structure-based drug discovery and protein engineering technology to develop novel antiviral drugs. Its lead programs in influenza and COVID-19 (the SARS-CoV-2 virus) have reported progress and have new clinical trials ahead in 2023. Other programs are continuing through preclinical development.
Influenza Phase 2a Expected Shortly. Cocrystal has presented preliminary data from its Phase 1 trial for CC-42344 in influenza in December 2022. A Phase 2a trial testing the drug in a human challenge study is expected to begin in 2Q23. This study uses controlled conditions to test efficacy in healthy human volunteers, allowing for a smaller trial with less variance.
Equity Research is available at no cost to Registered users of Channelchek. Not a Member? Click ‘Join’ to join the Channelchek Community. There is no cost to register, and we never collect credit card information.
This Company Sponsored Research is provided by Noble Capital Markets, Inc., a FINRA and S.E.C. registered broker-dealer (B/D).
*Analyst certification and important disclosures included in the full report. NOTE: investment decisions should not be based upon the content of this research summary. Proper due diligence is required before making any investment decision.
Baudax Bio is a pharmaceutical company focused on innovative products for acute care settings. ANJESO is the first and only 24-hour, intravenous (IV) COX-2 preferential non-steroidal anti-inflammatory (NSAID) for the management of moderate to severe pain. In addition to ANJESO, Baudax Bio has a pipeline of other innovative pharmaceutical assets including two novel neuromuscular blocking agents (NMBs) and a proprietary chemical reversal agent specific to these NMBs. For more information, please visit www.baudaxbio.com.
Gregory Aurand, Senior Vice President, Equity Research Analyst, Healthcare Services & Medical Devices, Noble Capital Markets, Inc.
Refer to the full report for the price target, fundamental analysis, and rating.
1Q 2023 reported. Last Friday, the Company reported GAAP EPS of $4.91 per share, as compared to our estimate of $5.75 per share. With the announced asset transfer of ANJESO and write-off of contingent liabilities owed Alkermes, Baudax Bio re-classified the ANJESO operations as discontinued. While showing a net loss operationally, the positive EPS was due to the removal of the Alkermes contingent consideration liability.
Higher expenses in the quarter. The higher than expected expenses consisted primarily of a $2.1 million loss on extinguishment of debt related to the previously disclosed amended credit agreement, and remaining discontinued operation property and equipment write-offs. In addition, continuing operation expenses were $223,000 higher than our estimate, related to higher neuromuscular blocker R&D expenditures.
Equity Research is available at no cost to Registered users of Channelchek. Not a Member? Click ‘Join’ to join the Channelchek Community. There is no cost to register, and we never collect credit card information.
This Company Sponsored Research is provided by Noble Capital Markets, Inc., a FINRA and S.E.C. registered broker-dealer (B/D).
*Analyst certification and important disclosures included in the full report. NOTE: investment decisions should not be based upon the content of this research summary. Proper due diligence is required before making any investment decision.
Is a U.S. Default or Bankruptcy Possible – How Would that Work?
It seems no one is talking about what would happen if the U.S. defaulted on maturing debt, yet it is within the realm of possibilities. Also not impossible is the idea of the powerful country joining the list of sovereign nations that once declared bankruptcy and survived. A retired government employee with a passion for economic history wrote a timely piece on this subject. It was originally published on the Mises Institute website on May 12, 2023. Channelchek has shared it here with permission.
The current known federal debt is $31.7 trillion, according to the website, U.S. Debt Clock, this is about $94,726 for every man, woman, and child who are citizens as of April 24, 2023. Can you write a check right now made payable to the United States Treasury for the known share of the federal debt of each member of your family after liquidating the assets you own?
A report released by the St. Louis Federal Reserve Branch on March 6, 2023, stated a similar figure for the total known federal debt of about $31.4 trillion as of December 31, 2022. The federal debt size is so great, it can never be repaid in its current form.
Some of us have been in or known families or businesses who had financial debt that could not be paid when adjustments like reducing expenses, increasing income, renegotiating loan repayments to lender(s), and selling assets to raise money for loan repayment were not enough. The reality is that they still could not pay the debt owed to the lender(s).
This leads to filing bankruptcy under federal bankruptcy laws overseen by a federal bankruptcy court.
Chapter 7 bankruptcy is a liquidation proceeding available to consumers and businesses. It allows for assets of a debtor that are not exempt from creditors to be collected and liquidated (turned to cash), and the proceeds distributed to creditors. A consumer debtor receives a complete discharge from debt under Chapter 7, except for certain debts that are prohibited from discharge by the Bankruptcy Code.
Chapter 11 bankruptcy provides a procedure by which an individual or a business can reorganize its debts while continuing to operate. The vast majority of Chapter 11 cases are filed by businesses. The debtor, often with participation from creditors, creates a plan of reorganization under which to repay part or all its debts.
These government entities have filed for Chapter 9 federal bankruptcy:
Orange County, California, in 1994 for about $1.7 billion
Jefferson County, Alabama, in 2011 for about $5 billion
The City of Detroit, Michigan, in 2013 for about $18 billion
The Commonwealth of Puerto Rico in 2017 for $72 billion
According to the United States Courts website:
The purpose of Chapter 9 is to provide a financially-distressed municipality protection from its creditors while it develops and negotiates a plan for adjusting its debts. Reorganization of the debts of a municipality is typically accomplished either by extending debt maturities, reducing the amount of principal or interest, or refinancing the debt by obtaining a new loan.
Although similar to other Chapters in some respects, Chapter 9 is significantly different in that there is no provision in the law for liquidation of the assets of the municipality and distribution of the proceeds to creditors.
The bankruptcies of two counties, a major city, and a sovereign territory resulted in bondholders with financial losses not repaid in full as well as reforms enacted in each governmental entity. Each one emerged from bankruptcy, one hopes, humbled and better able to manage their finances.
The federal government’s best solution for bondholders, taxpayers, and other interested parties is to default, declare sovereign bankruptcy, and make the required changes to get the fiscal business in order. Default, as defined by Dictionary.com as a verb, is “to fail to meet financial obligations or to account properly for money in one’s care.”
Sovereign government defaults are not new in our lifetime with Argentina in 1989, 2001, 2014, and 2020; South Korea, Indonesia, and Thailand in 1997, known as the Asian flu; Greece in 2009; and Russia in 1998.
Possible Outcomes
Some outcomes from these defaults lead to sovereign government debt bond ratings being reduced by the private rating agencies, bondholders losing value on their holdings, debt repayments being renegotiated with lenders, many countries receiving loans with a repayment plan from the International Monetary Fund (IMF), reforms being required to nations’ entitlement programs, a number of government taxes being raised, their currency losing value on currency trading exchanges, price inflation becoming more of a reality to its citizens, and higher interest rates being offered on future government debt bond offerings.
Very few in the financial world are talking about any outcomes of a U.S. federal government debt default. One outcome from the 2011 near default was Standard & Poor’s lowering their AAA federal bond rating to AA+ where it has remained.
What organization would oversee the execution of a U.S. federal government debt default, and what authorization would they be given to deal with the situation? No suggestions are offered when its scale is numerically mind-numbing since the U.S. has used debt as its drug of choice to overdose on fiscal reality.
Some outcomes would include a lowered federal bond rating by the three private bond rating agencies, where the reality of higher interest rates being offered on newly issued federal debt cannot be ignored. Federal government spending cuts in some form will be required by the realities of economic law, which includes reducing the number of federal employees, abolishing federal agencies, reducing and reforming military budgets, selling federal government property, delegating federal programs to the states, and reforming the federal entitlement programs of Medicaid, Medicare, and Social Security. Federal government tax revenue to repay the known debt with interest will rise as a percentage of each year’s future federal budget.
One real impact from a federal government debt default would be that the U.S. dollar would no longer be the global reserve currency, with dollars in many national reserve banks coming back to the U.S. Holding dollars will be like holding a hot potato. Nations holding federal debt paper—like China ($859 billion), Great Britain ($668 billion), Japan ($1.11 trillion), and others as of the January 2023 numbers published by the U.S. Treasury—as well as many mutual funds and others will see their holdings reduced in value leading to a selling off of a magnitude one cannot imagine in scale and timing. Many mutual fund holders like retirees, city and state retirement systems, and 401(k) account holders will be impacted by this unfolding event.
The direction of an individual or business when they emerge from federal bankruptcy is hopefully humility—looking back with the perspective of mistakes made, learning from these mistakes, and moving forward with a focus to benefit their family and community.
However, cities, counties, and sovereign territories differ from individuals, families, and private businesses in emerging from federal bankruptcy. What the outcome of a federal government debt default will be is unknown. Yet its reality is before us.
About the Author:
Stephen Anderson is retired from state government service and is a graduate of The University of Texas at Austin. He currently lives in Texas. His passions are reading, writing, and helping friends and family understand economic history.
The Growing Case for Small-Cap Stocks: Is it Time to Make the Shift?
The more time that passes with small cap stocks lagging the large and mega caps, the louder very respected market voices are urging investors to move more assets to these smaller companies. The pro small cap stock outlook was reflected again in a recent Barron’s article. The piece highlighted what others continue to point out, that the large cap, S&P 500, is up nearly 8% on the year, but the gains have only been because of the performance of a few big tech stocks and the math used to measure the equity index.
A very eye-opening line in Barron’s points out that, “Apple (ticker: AAPL), Amazon.com (AMZN), Meta Platforms (META), Alphabet (GOOGL), Microsoft (MSFT), Nvidia (NVDA), and Tesla (TSLA) are up between 29% and 99% for the year.” These stocks make up a significant weighting of the large cap index, which means that much of the other large cap stocks have been negative in order to only provide an 8% return. To demonstrate how the weighting of the larger companies distorts return, just look at the Invesco S&P 500 Equal Weight ETF (RSP). This ETF weighs each stock in the S&P 500 equally. This has the effect of avoiding overweighting and one stock. This ETF is flat year-to-date. In contrast, The few tech names listed above total just under a third of the entire index.
The article also pointed out the truth that smaller names, those not in the S&P 500, have struggled. What does this mean for investors? Barron’s wrote, “They also look cheap—-and it may be time to take a nibble.” The case that others are also making is based on a number of current market setups. These include value, market history, and even macroeconomic trends that now may favor smaller companies over larger ones.
Big Tech companies like those mentioned above borrow massive amounts of money, they have been the beneficiaries of lower bond rates out on the yield curve. In addition to borrowing costs still below normal, valuing these stocks based on future earnings and comparing the expected earnings to available interest rates have caused investors to be less inclined to tie up money for ten years or more, (at 3.50%). Also, better than expected first-quarter earnings of big tech-inspired investors – product enhancements using artificial intelligence was credited with much of this.
Royce Funds’ Premier Quality Fund invests in “small cap quality.” In a recent article to investors co-lead portfolio managers Lauren Romeo and Steven McBoyle explained why, “small-cap quality looks so compelling in today’s uncertain investment environment.” The portfolio managers wrote, “Secular changes in economic trends, interest rates, and monetary and fiscal policies are creating seismic shifts in the investment landscape. The types of companies that benefited most from the past decade’s zero interest rate, low inflation, and low nominal growth regime—specifically, mega-caps and growth stocks—are unlikely to lead going forward.” Under this backdrop, the two gave their perspective which is that, “the unfolding macro environment appears to be set for quality small caps to capture and sustain long-term outperformance over large cap” through an uncertain period that is characterized by a near certain transition.
If tech stocks again falter because rates rise, advancement slows, or competition grows, the appearance of the S&P 500 large cap index stocks performing well could diminish. “Market gains continue to be dominated by uber-caps, masking the fact that 48% of S&P 500 member stocks are down year to date,” wrote Chris Harvey, chief U.S. equity strategist at Wells Fargo, on May 12.
Within the same index family (S&P), is the S&P 600, which is a small cap index. It is not currently having a positive year, and is down about 3%. Interestingly, the reverse argument can be made for this benchmark since it is overweighted in one specific sector. Financials, which have taken a beating this year is the largest sector weighting in the S&P 600. It accounts for just over a fifth of the performance. This has dragged the index lower, as regional banks have seen billions of depositor dollars walk out the door as savers and investors move assets to higher-yielding money-market funds. This, as we know, has caused liquidity problems at many banks, and caused some to fail.
2023 has been a challenging market for stocks despite the S&P 500 performance. It has been challenging for small caps too, but not as challenging as the S&P 600 performance would have one believe without looking under the hood. Small caps, independent of the high weighting of financials in the benchmark are positive on the year. One very real concern large cap investors are now facing is whether the flow into large cap funds have overly inflated the value, based on most stock valuation metrics, above where they would naturally trade if not for indexed funds.
The economy is not expected to get much stronger this year. Higher interest rates have already begun to stress the US economy, and banking problems are expected to cause tighter lending and consumer spending. And as mentioned a few times, the widely quoted S&P 500’s performance, is covering up what has mostly been a tough equity market.
But while large caps look expensive, for the reasons mentioned, respected experts say small caps look cheap. The S&P 600’s aggregate forward price/earnings multiple is just under 13 times – this compares with the S&P 500 which is 18 times. While on the surface, this doesn’t seem striking, it is! While the difference between 13 times and 18 times doesn’t sound wide, it marks a 30% difference. That is a massive discount. Historically the small cap index trades at a slight premium to its large-cap counterpart, but even in times of economic stress, it doesn’t trade at such a wide discount. In March of 2020, the height of pandemic risk aversion, its multiple was only 25% below the S&P 500.
Take Away
It has been a tougher year for stocks than the performance of the large cap S&P 500 would have one think without digging below the surface and netting out its largest sector weighting. The small cap S&P 600 is down, but largely because of its own largest sector weighting. This is one of the many problems inherent in how popular index investing has become. While stocks in general seem to be facing increasing headwinds, investors that selectively evaluate small cap names for inclusion in the equity portion of their portfolio may find the payoff is better than the alternatives.
Evaluating small cap opportunities is easy with Channelchek as the platform specializes in supplying data, information, and no-nonsense research on smaller opportunities. Please feel free to explore further by scrolling up to the search bar and typing in an industry, company name, or ticker. Channelchek is a free platform designed to help investors and opportunities find each other.
The Market Will Experience a Barrage of Appearances by Fed Officials
This will be another week of various regional Fed Presidents speaking and setting expectations of potential adjustments to monetary policy; this includes Jerome Powell and Former Fed Chair Ben Bernanke. Retail and consumer health could come into sharper focus during the week as major retailers report earnings and April retail sales are reported early in the week. The initial results for the Russell Reconstitution of its main indexes will be released after the close of trading on Friday. Also, late week, Fed Chair Jay Powell will make an appearance on a panel with Ben Bernanke.
Monday 5/15
8:30 AM ET, The Empire State Manufacturing Index for May is expected to fall back to negative territory at minus 2.0 after April’s 35-point surge into positive ground at 10.8. This monthly survey of manufacturers in New York State is seldom market moving, but combined with other reports helps draw a picture of economic health within the region and more broadly.
8:45 AM ET, Ralph Bostic, the CEO of the Atlanta Federal Reserve, will be speaking.
9:15 AM ET, Neel Nashkari, the President of the Minneapolis Federal Reserve, will be speaking.
12:30 PM ET, Thomas Barkin, the President of the Richmond Federal Reserve, will be speaking.
Tuesday 5/16
8:15 AM ET, Loretta Mester, CEO of the Federal Reserve Bank of Cleveland, will be speaking.
8:30 AM ET, April Retail Sales are expected to rise 0.7 percent versus March’s 1.0 percent decline that, much of the earlier decline was led by declines in car sales and gasoline.
8:55 AM ET, Raphael Bostic will be speaking. Bostic is the CEO of the Atlanta Fed.
9:15 AM ET, Industrial Production is expected to be unchanged in April after March’s 0.4 percent increase that was boosted by utilities output. Manufacturing output is seen as up 0.1 percent after falling 0.5 percent in March.
10:00 AM ET, Business Inventories in March are expected to remain unchanged following a 0.2 percent build in February.
10:00 AM ET, the Housing Market Index has not been experiencing the steep declines witnessed last year. After April’s previously reported 1-point gain to 45, May’s consensus is no change at 45.
12:15 PM ET, John Williams, the President of the New York Federal Reserve, will be speaking.
3:15 PM ET, Lorrie Logan is the President of the Federal Reserve Dallas, she will be speaking.
7:00 PM ET, Raphael Bostic, will be speaking. Bostic is the CEO of the Atlanta Fed.
Wednesday 5/17
7:30 AM ET, Mortgage Applications, compiled by the Mortgage Bankers’ Association will be released. compiles various mortgage loan indexes. The index measures applications at mortgage lenders. This is a leading indicator for single-family home sales and housing construction.
8:30 AM ET, Housing Starts and Permits during March edged lower to a 1.420 million annualized rate; April is expected to slip further to 1.405 million. Permits, at 1.413 million in March and, though lower than expected, very near the starts rate, is expected to rise to 1.430 million.
10:30 AM ET, The Energy Information Administration (EIA) provides weekly information on petroleum inventories in the U.S., whether produced here or abroad. The level of inventories helps determine prices for petroleum products.
Thursday 5/18
8:30 AM ET, Jobless Claims Jobless claims for weekly period ended May 13 are expected to fall back to 255,000 after rising a steep 22,000 to 264,000 in the prior week.
10:00 AM ET, Philadelphia Fed Manufacturing Index, The Philadelphia Fed manufacturing index has been in contraction the last nine reports and very deeply so in April at minus 31.3. May’s contraction is seen at minus 20.0.
9:05 AM ET, Lorrie Logan, President of the Dallas Fed is scheduled to speak.
10:00 AM, Ecommerce Retail Sales, are sales of goods and services where an order is placed by the buyer or where price and terms of sale are negotiated over the Internet, an extranet, Electronic Data Interchange (EDI) network, or other online system.
10:00 AM, The Index of Leading Economic indicators, had plunged 1.2 percent in March, it is expected to fall a further 0.6 percent in April. This index has been in sharp decline and has long been signaling a pending recession.
10:30 AM, The Energy Information Administration (EIA) provides weekly information on natural gas stocks in underground storage for the U.S. and five regions of the country. The level of inventories helps determine prices for natural gas products.
Friday 5/19
8:30 PM ET, Import/Export Prices. Import Prices, an inflation harbinger is expected to rise 0.3 percent for April, this would end nine straight declines. Export prices are expected to rise 0.2 percent.
8:45 AM, John Williams, the President of the New York Federal Reserve, will be speaking.
10:00 PM ET, Consumer Sentiment looking at the first indication for May, which in April fell 1.5 points to 63.5, is expected to fall another half point to 63.0.
10:00 AM ET, Quarterly Services is expected is focuses on information and technology-related service industries. These include information; professional, scientific and technical services; administrative & support services; and waste management and remediation services. These sectors correspond to three NAICS sectors (51, 54, and 56). The Quarterly Services Survey produces estimates of total operating revenue and the percentage of revenue by class of customer.
11:00 AM, ET, Fed Chair Powell, is joined on a panel titled “Perspectives on Monetary Policy” by former Fed Chair Ben Bernanke.
4:00 PM ET, The FTSE Russell Index reports the first list of stocks leading to the Russell’s Reconstitution in 2023.
What Else
Investment roadshows are like getting a front-row seat to information direct from management’s mouth. The most useful investor information often comes from the unplanned responses to questions during the roadshow – either asked by you, or other interested investors.
Noble Capital Markets has an expanding and interesting calendar of roadshows during the week and month. Some are in cities that are paid less attention to than the major financial centers. This week CoCrystal (COCP) will be presenting at roadshows in Miami, and Boca Raton, FL. For more details, and a complete list of roadshows and cities, Click here.
PHOENIX, May 12, 2023 (GLOBE NEWSWIRE) — QuoteMedia, Inc. (OTCQB: QMCI), a leading provider of market data and financial applications, announced financial results for the quarter ended March 31, 2023.
QuoteMedia provides banks, brokerage firms, private equity firms, financial planners and sophisticated investors with a more economical, higher quality alternative source of stock market data and related research information. We compete with several larger legacy organizations and a modest community of other smaller companies. QuoteMedia provides comprehensive market data services, including streaming data feeds, on-demand request-based data (XML/JSON), web content solutions (financial content for website integration) and applications such as Quotestream Professional desktop and mobile.
Highlights for Q1 2023 include the following:
Quarterly revenue increased by 11% to $4,750,048 in Q1 2023 from $4,263,796 in 2022, an increase of $486,252.
On an FX-neutral basis, revenue growth for Q1 2023 vs Q1 2022 was 14% (1) .
Quarter-over-quarter revenue increased 4% when comparing Q1 2023 to Q4 2022.
Adjusted EBITDA for Q1 2023 was $829,585 compared to $680,424 in Q1 2022, an improvement of $149,161 (22%) (1) .
“2022 was another great year for QuoteMedia, and as anticipated, that momentum is carrying forward into 2023,” said Robert J. Thompson, Chairman of the Board. “We expect improved revenue growth for the remainder of the year, and record profitability for fiscal 2023. These are truly exciting times for QuoteMedia, as we continue to expand our product lines, develop new partnerships, increase our market share and broaden our presence in the financial data industry. We are very pleased with our results to date; and anticipate extending QuoteMedia’s growth and profitability into the foreseeable future.”
QuoteMedia will host a conference call Monday, May 15, 2023 at 2:00 PM Eastern Time to discuss the Q1 2023 financial results and provide a business update.
Conference Call Details:
Date: May 15, 2023
Time: 2:00 PM Eastern
Dial-in number: 800-245-3047
Conference ID: QUOTEMEDIA
An audio rebroadcast of the call will be available later at: www.quotemedia.com
About QuoteMedia
QuoteMedia is a leading software developer and cloud-based syndicator of financial market information and streaming financial data solutions to media, corporations, online brokerages, and financial services companies. The Company licenses interactive stock research tools such as streaming real-time quotes, market research, news, charting, option chains, filings, corporate financials, insider reports, market indices, portfolio management systems, and data feeds. QuoteMedia provides industry leading market data solutions and financial services for companies such as the Nasdaq Stock Exchange, TMX Group (TSX Stock Exchange), Canadian Securities Exchange (CSE), London Stock Exchange Group, FIS, U.S. Bank, Bank of Montreal (BMO), Broadridge Financial Systems, JPMorgan Chase, Scotiabank, CI Financial, Canaccord Genuity Corp., Hilltop Securities, Avantax, Stockhouse, Zacks Investment Research, General Electric, Boeing, Bombardier, Telus International, Business Wire, PR Newswire, The Goldman Sachs Group, Regal Securities, ChoiceTrade, Cetera Financial Group, Dynamic Trend, Inc., Credential Qtrade Securities, CNW Group, iA Private Wealth, Ally Invest, Inc., Suncor, Leede Jones Gable, Firstrade Securities, Charles Schwab, First Financial, Equisolve, Stock-Trak, Mergent, Cision and others. Quotestream®, QMod™ and Quotestream Connect™ are trademarks of QuoteMedia. For more information, please visit www.quotemedia.com .
Statements about QuoteMedia’s future expectations, including future revenue, earnings, and transactions, as well as all other statements in this press release other than historical facts are “forward-looking statements” within the meaning of the Private Securities Litigation Reform Act of 1995. QuoteMedia intends that such forward-looking statements be subject to the safe harbors created thereby. These statements involve risks and uncertainties that are identified from time to time in the Company’s SEC reports and filings and are subject to change at any time. QuoteMedia’s actual results and other corporate developments could differ materially from that which has been anticipated in such statements.
Below are the specific forward-looking statements included in this press release:
We expect improved revenue growth for the remainder of the year, and record profitability for fiscal 2023.
We believe that Adjusted EBITDA, as a non-GAAP pro forma financial measure, provides meaningful information to investors in terms of enhancing their understanding of our operating performance and results, as it allows investors to more easily compare our financial performance on a consistent basis compared to the prior year periods. This non-GAAP financial measure also corresponds with the way we expect investment analysts to evaluate and compare our results. Any non-GAAP pro forma financial measures should be considered only as supplements to, and not as substitutes for or in isolation from, or superior to, our other measures of financial information prepared in accordance with GAAP, such as net income attributable to QuoteMedia, Inc.
We define and calculate Adjusted EBITDA as net income attributable to QuoteMedia, Inc., plus: 1) depreciation and amortization, 2) stock compensation expense, 3) interest expense, 4) foreign exchange loss (or minus a foreign exchange gain), and 5) income tax expense. We disclose Adjusted EBITDA because we believe it is a useful metric by which to compare the performance of our business from period to period. We understand that measures similar to Adjusted EBITDA are broadly used by analysts, rating agencies, investors and financial institutions in assessing our performance. Accordingly, we believe that the presentation of Adjusted EBITDA provides useful information to investors. The table below provides a reconciliation of Adjusted EBITDA to net income attributable to QuoteMedia, Inc., the most directly comparable GAAP financial measure.
QuoteMedia, Inc. Adjusted EBITDA Reconciliation to Net Income:
Three-months ended March 31,
2023
2022
Net income
$
113,290
$
149,041
Depreciation and amortization
627,987
487,095
Stock-based compensation
78,125
59,864
Interest expense
1,452
1,224
Foreign exchange loss (gain)
8,001
(17,590
)
Income tax expense
730
790
Adjusted EBITDA
$
829,585
$
680,424
In addition to the non-GAAP measures discussed above, we also analyze certain measures, including net revenues and operating expenses, on an FX-neutral basis to better measure the comparability of operating results between periods. Management believes that changes in foreign currency exchange rates are not indicative of the company’s operations and evaluating growth in net revenues and operating expenses on an FX-neutral basis provides an additional meaningful and comparable assessment of these measures to both management and investors. FX-neutral results are calculated by translating the current period’s local currency results with the prior period’s exchange rate. FX-neutral growth rates are calculated by comparing the current period’s FX-neutral results by the prior period’s results.
Announced Positive Top-Line Final Results from Phase 2 Randomized Clinical Trial of BX1000
Hosted Key Opinion Leader Webinar to Highlight Potential of BX1000 and Neuromuscular Blocking Agent Portfolio
Secured $4 Million in Gross Proceeds from Public Offering in May
MALVERN, Pa., May 12, 2023 (GLOBE NEWSWIRE) — Baudax Bio, Inc. (Nasdaq:BXRX) (the “Company”), a pharmaceutical company focused on innovative products for hospital and related settings, today reported financial results for the quarter ended March 31, 2023, and provided a business update.
“During the first quarter we made significant progress advancing our neuromuscular blocking agent (NMB) portfolio, announcing positive topline results from our Phase 2 randomized trial of BX1000 and continuing to enroll our Phase 1 dose escalation trial for BX2000,” said Gerri Henwood, President and Chief Executive Officer of Baudax Bio. “Positive top line results from our Phase 2 trial demonstrate that BX1000 was effective at all doses, and compares favorably to rocuronium, with predictable onset and offset. We believe that when BX 1000 is combined with our reversal agent BX3000, it may provide even faster control/reversal of neuromuscular paralysis for surgical patients. These very encouraging data and the potential of our NMB portfolio were highlighted in the Key Opinion Leader webinar we were pleased to host recently. The webinar featured distinguished anesthesiologists Drs. Todd M Bertoch and Harold S. Minkowitz, who shared their experiences with the current standard of care and perspectives on the unmet need for improved NMB and reversal agents and can be found on the Events pages of our website”.
“In addition to announcing Phase 2 topline results for BX1000, during the quarter we also continued to enroll our dose escalation study for BX2000, our ultrashort acting NMB,” continued Ms. Henwood. We expect to complete this study by approximately the end of 2023. BX3000, our NMB reversal agent, remains on track, and we expect to complete the nonclinical and manufacturing studies needed to support an IND filing for BX3000 in late summer of 2023.
“On May 1st, we closed a $4 million financing through a public offering. We also executed the asset transfer of ANJESO® to Alkermes, which included the elimination of further payment obligations to Alkermes. These events will allow us to progress development of product candidates for ambulatory surgery centers and other acute care settings, which we believe may represent important innovations in NMBs along with a proprietary reversal agent,” concluded Ms. Henwood.
First Quarter 2023 and Recent Business Highlights
NMB Portfolio
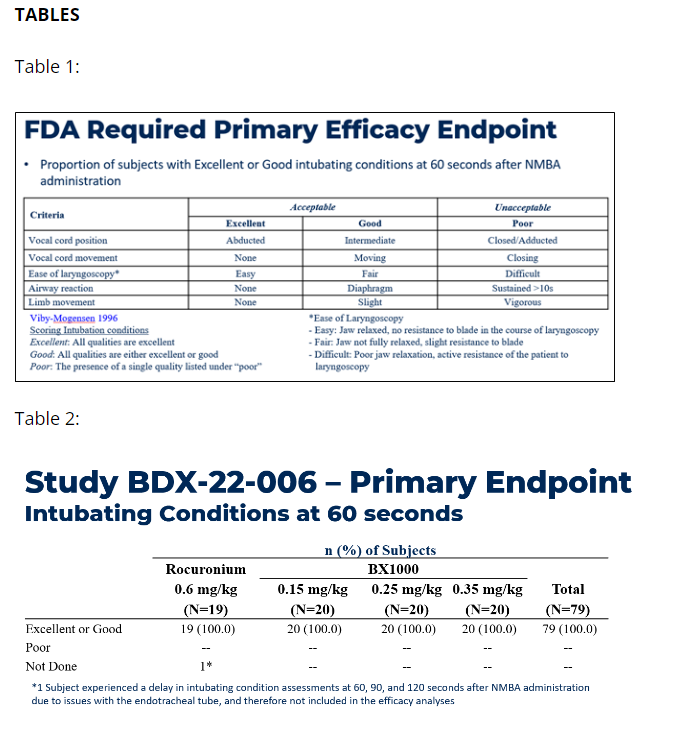
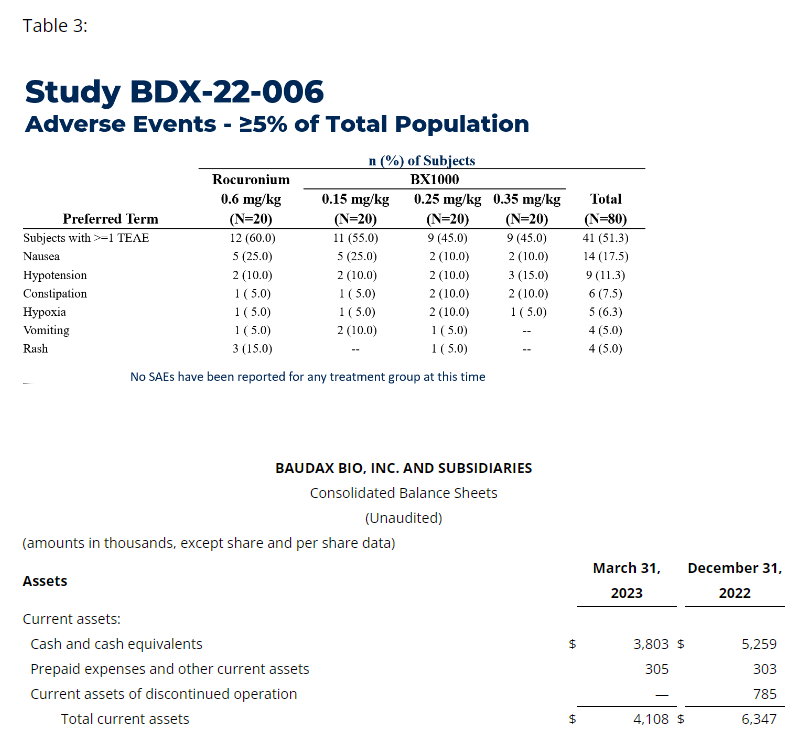
BX1000 Phase 2 Top-Line Data. The Company announced positive top-line results from its Phase 2 clinical trial of BX1000 for neuromuscular blockade (NMB) in patients undergoing elective surgery. Results of the study showed that BX1000 met the primary endpoint of readiness for intubation (evaluated as “Good” or “Excellent”) at all dose levels assessed. No severe adverse events were observed in any dose regimen.
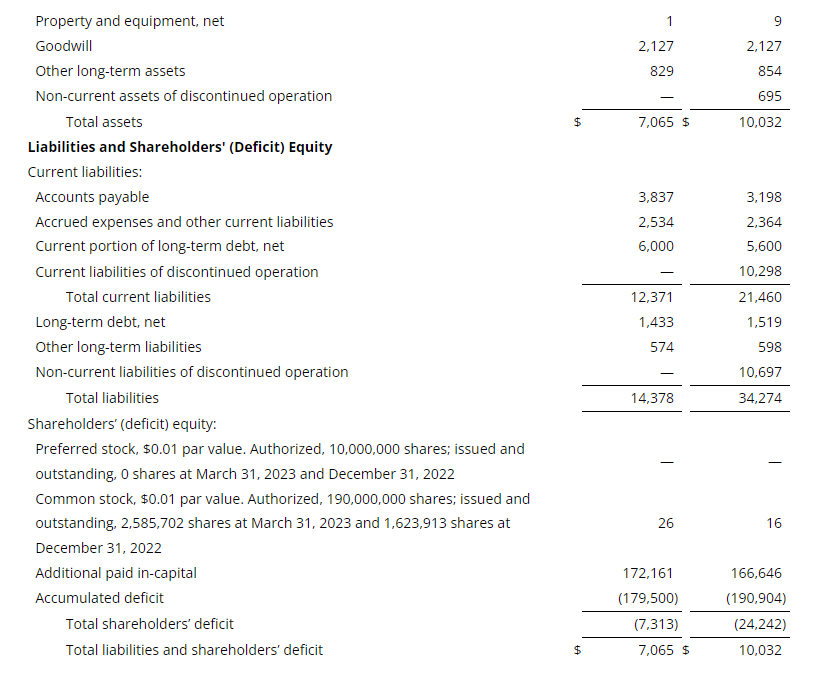
Results showed that all patients in three BX1000 study cohorts were observed to have met the criteria for Good or Excellent intubating conditions at 60 seconds (see Table 1 and Table 2). There was evidence of a dose-response across the three doses of BX1000, and the degree of blockade for the highest dose group appears comparable to that of the “standard” dose of rocuronium (0.6 mg/kg) employed in the study. Study treatments were generally well tolerated, with no occurrence of severe or serious adverse events. The frequency and severity of adverse events was similar across all four dose groups, and no notable events were aggregated in any one dose group (See table 3).
A further patient safety follow-up at 28 days after surgery as well as additional analyses of EMG neuromuscular blockade data is anticipated in the coming weeks. The Company will be continuing the development program for BX 1000 with a target of submitting a New Drug Application (“NDA”).
The Company hosted a key opinion leader webinar to discuss the Phase 2 results and opportunity represented by BX1000 and its NMB portfolio. The event, titled Innovation in Anesthesia: BX1000 for Neuromuscular Blockade (NMB), features Dr. Todd M. Bertoch, Chief Executive Officer of JBR Clinical Research, and Dr. Harold S. Minkowitz, Associate Director for Clinical Research at The University of Texas MD Anderson Cancer Center Department of Anesthesiology and Perioperative Medicine and discusses in greater detail results from the Phase 2 trial of BX1000 for neuromuscular blockade (NMB) in patients undergoing elective surgery. A recording of the presentation can be found on the Baudax Bio website under the Events section.
BX2000 (IV Ultra-short duration of action). Cohort enrollment is ongoing for the Phase I dose escalation study evaluating the safety, tolerability, and pharmacokinetics of BX2000 in intubated healthy volunteers. This study is comprised of likely seven or eight dosing cohorts and each cohort is planned to enroll eight patients. The first and second cohorts have been dosed and enrollment of the third cohort is underway. The Company expects to complete enrollment of the remaining cohorts in the study by the end of 2023.
BX3000 (Reversal agent). Baudax Bio expects to complete nonclinical studies and manufacturing data required to support the IND for BX3000 in late summer of 2023. Early single agent clinical trials of BX3000 will not require intubation and so would be expected to progress quickly once the IND is active, and trials are ready to initiate. The Company believes progress towards a reversal study using BX3000 in patients who have received BX1000 could begin before the end of 2023.
The Company believes the data from the ongoing clinical trials for BX1000 and BX2000 will contribute to decisions to move forward later in 2023.
Corporate and Financial
Closed $4 million public offering – On May 1, 2023, the Company closed a public offering of an aggregate of 3,478,262 shares of its common stock (or pre-funded warrants in lieu thereof), together with accompanying common stock purchase warrants, at a public offering price of $1.15 per share (or pre-funded warrant) and accompanying warrants. Each share of common stock (or pre-funded warrant) was sold in the offering together with one Series A-5 warrant to purchase one share of common stock at an exercise price of $1.15 per share and one Series A-6 warrant to purchase one share of common stock at an exercise price of $1.15 per share. The Series A-5 warrants are exercisable immediately and will expire five years from the date of issuance, and the Series A-6 warrants are exercisable immediately and will expire eighteen months from the date of issuance. Gross proceeds from the offering, before deducting the placement agent’s fees and other offering expenses, were approximately $4 million. The Company intends to use the net proceeds from this offering for pipeline development activities and general corporate purposes.
Alkermes Asset Transfer Agreement – On March 29, 2023, the Company entered into an Asset Transfer Agreement with Alkermes Pharma Ireland Limited (“Alkermes”) (the “Transfer Agreement”). Under the terms of the Transfer Agreement, the Company transferred the rights to certain patents, trademarks, equipment, data and other rights related to ANJESO® (the “Assets”) to Alkermes. The Company withdrew the New Drug Application (“NDA”) related to ANJESO. Additionally, under the Transfer Agreement, the Company granted Alkermes a non-exclusive, perpetual and irrevocable, royalty-free and fully paid-up worldwide license, to the additional intellectual property owned by the Company necessary to or useful to exploit ANJESO®. In consideration of the transfer of the Assets, the parties agreed to the termination of (i) the Purchase and Sale Agreement, dated March 7, 2015 by and among Alkermes, the Company and the other parties thereto (as amended, the “PSA”), (ii) the Asset Transfer and License Agreement, dated April 10, 2015 by and among Alkermes, the Company and the other parties thereto (as amended, the “ATLA”); and (iii) the Development, Manufacturing and Supply Agreement, dated as of July 10, 2015 by and between the Company and Alkermes (as amended, the “Manufacturing Agreement”) between the parties related to ANJESO (the PSA, ATLA and Manufacturing Agreement, collectively, the “ANJESO Agreements”). In connection with the termination of the ANJESO Agreements, no further payments of any kind pursuant to the ANJESO Agreements will be payable by the Company to Alkermes.
Consent to Credit Agreement – On March 29, 2023 the Company entered into a Consent to Credit agreement by and among the Company, Baudax Bio N.A. LLC (“Baudax LLC”), Baudax Bio Limited, Wilmington Trust, National Association, solely in its capacity as administrative and collateral agent (the “Agent”) and the lenders party thereto (the “Lenders”). The Amendment amends that certain Credit Agreement, dated as of May 29, 2020, by and among the Company, the Agent, and the Lenders (as amended, the “Credit Agreement”). Pursuant to the terms of the Amendment, the Lenders consented to the transactions contemplated by the Transfer Agreement (as defined below) and agreed to release and discharge any liens granted or held by the Lenders in respect of the Assets (as defined below). Pursuant to the terms of the Transfer Agreement, the parties also agreed to, among other things, amend the minimum liquidity covenants under the Credit Agreement to require that the Company maintains $2.5 million of liquidity at all times.
Financial Results for the Three Months Ended March 31, 2023
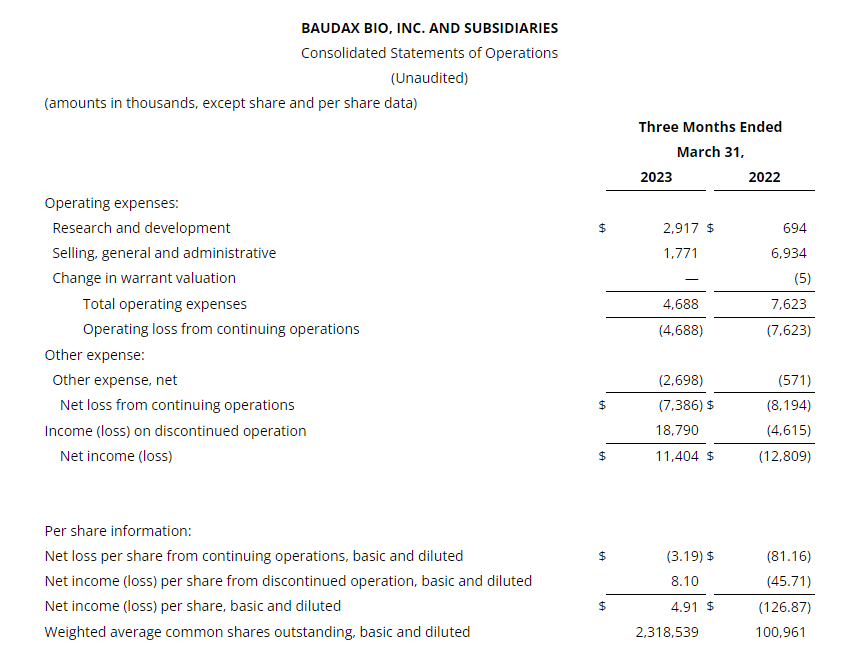
As of March 31, 2023, Baudax Bio had cash and cash equivalents of $3.8 million.
Research and development expenses from continuing operations for the three months ended March 31, 2023 were $2.9 million compared to $0.7 million for the three months ended March 31, 2022. The increase of $2.2 million was primarily due to an increase in clinical and preclinical trials costs associated with our NMB program of $1.7 million and an increase in general expenses, including consulting and other outside service expenses, of $0.5 million.
Selling, general and administrative expenses from continuing operations for the three months ended March 31, 2023 were $1.8 million compared to $6.9 million for the same prior year period. The decrease of $5.1 million was primarily a result of a reduction in personnel costs of $3.5 million, a decrease in public company costs of $0.7 million, a decrease in consulting expenses of $0.5 million, and a decrease of $0.5 million in patent legal and other expenses.
Baudax Bio reported net loss from continuing operations of $(7.4) million, or $(3.19) per share, for the three months ended March 31, 2023. Net loss from continuing operations for the three months ended March 31, 2022 was $(8.2) million, or $(81.16) per share.
About Baudax Bio’s Neuromuscular Blocking Agents (NMBs)
Baudax Bio holds exclusive global rights to two novel NMBs, BX1000, an intermediate duration, clinical stage blocking agent, and BX2000, an ultra-short duration, clinical stage blocking agent, as well as a proprietary chemical reversal agent, BX3000, undergoing nonclinical studies intended to support an investigational new drug (IND) submission in 2023. BX3000 is a specific reversal agent that may rapidly reverse BX1000 and BX2000. All three agents are licensed from Cornell University. We believe these agents, when an NMB and BX3000 are administered in succession, allow for a rapid onset of centrally acting neuromuscular blockade, followed by a rapid reversal of the neuromuscular blockade with BX3000. These novel agents have the potential to meaningfully reduce time to onset and reversal of blockade and improve the reliability of onset and offset of neuromuscular blockade. This can potentially reduce time in operating rooms or post operative suites, or PACU, resulting in potential clinical and cost advantages, as well as valuable cost savings for hospitals and ambulatory surgical centers and has the potential for an improved clinical profile in terms of safety.
About Baudax Bio
Baudax Bio is a pharmaceutical company focused on innovative products for acute care and related settings. The Company has a pipeline of innovative pharmaceutical assets including two clinical-stage, novel neuromuscular blocking (NMBs) agents, one that recently completed a Phase II clinical trial and an additional unique NMB undergoing a dose escalation Phase I clinical trial, as well as a proprietary chemical reversal agent specific to these NMBs, which is currently undergoing nonclinical and manufacturing studies to prepare for an expected IND filing in late summer of 2023. For more information, please visit www.baudaxbio.com.
Forward Looking Statements
This press release contains forward-looking statements that involve risks and uncertainties. Such forward-looking statements, including statements relating to the clinical development of Baudax Bio’s product candidates, reflect Baudax Bio’s expectations about its future performance and opportunities that involve substantial risks and uncertainties. When used herein, the words “anticipate,” “believe,” “estimate,” “may,” “upcoming,” “plan,” “target,” “goal,” “intend” and “expect” and similar expressions, as they relate to Baudax Bio or its management, are intended to identify such forward-looking statements. These forward-looking statements are based on information available to Baudax Bio as of the date of publication of this press release and are subject to a number of risks, uncertainties, and other factors that could cause Baudax Bio’s performance to differ materially from those expressed in, or implied by, these forward-looking statements. These risks and uncertainties include, among other things, risks related to market, economic and other conditions, the ongoing economic and social consequences of the COVID-19 pandemic, Baudax Bio’s ability to advance its current product candidate pipeline through pre-clinical studies and clinical trials, that interim results may not be indicative of final results in clinical trials, that earlier-stage trials may not be indicative of later-stage trials, the approvability of product candidates, Baudax Bio’s ability to raise future financing for continued development of its product candidates such as BX1000, BX2000 and BX3000, Baudax Bio’s ability to pay its debt and satisfy conditions necessary to access future tranches of debt, Baudax Bio’s ability to comply with the financial and other covenants under its credit facility, Baudax Bio’s ability to manage costs and execute on its operational and budget plans, Baudax Bio’s ability to achieve its financial goals; Baudax Bio’s ability to maintain listing on the Nasdaq Capital Market; and Baudax Bio’s ability to obtain, maintain and successfully enforce adequate patent and other intellectual property protection. These forward-looking statements should be considered together with the risks and uncertainties that may affect Baudax Bio’s business and future results included in Baudax Bio’s filings with the Securities and Exchange Commission at www.sec.gov. These forward-looking statements are based on information currently available to Baudax Bio, and Baudax Bio assumes no obligation to update any forward-looking statements except as required by applicable law.
CALGARY, AB, May 12, 2023 /CNW/ – InPlay Oil Corp. (TSX: IPO) (OTCQX: IPOOF) (“InPlay” or the “Company”) announces its financial and operating results for the three months ended March 31, 2023. InPlay’s condensed unaudited interim financial statements and notes, as well as Management’s Discussion and Analysis (“MD&A”) for the three months ended March 31, 2023 will be available at “www.sedar.com” and our website at “www.inplayoil.com“. Our corporate presentation will soon be available on our website.
First Quarter 2023 Financial & Operating Highlights
Achieved average quarterly production of 9,020 boe/d(1) (58% light crude oil and NGLs), an increase of 21% on a debt adjusted per share basis compared to 8,221 boe/d(1) (59% light crude oil and NGLs) in the first quarter of 2022.
Generated strong quarterly adjusted funds flow (“AFF”)(2) of $21.3 million ($0.24 per weighted average basic share(3)).
Maintained balance sheet strength with a low net debt(2) to earnings before interest, taxes and depletion (“EBITDA”)(3) ratio of 0.4 on a trailing twelve month basis down from 1.0 in the first quarter of 2022.
Executed the most active quarter in the Company’s history drilling four (3.2 net) extended reach horizontal (“ERH”) wells in Willesden Green, two (2.0 net) ERH wells in Pembina and two (0.3 net) non-operated Willesden Green ERH wells. InPlay also started the upgrade of an operated gas facility in Willesden Green providing additional capacity. One (0.95 net) additional Willesden Green well which was planned for the second quarter was drilled in March and drilling operations began on another one (0.95 net) Willesden Green well in the first quarter.
Returned $4.4 million in the quarter directly to shareholders through $4.0 million in dividends and $0.4 million of share repurchases under the Company’s Normal Course Issuer Bid.
Realized net income of $9.3 million ($0.11 per basic share; $0.10 per diluted share).
Financial capability to deliver consistent returns to shareholders with the dividend supportable at a $55 WTI pricing environment until 2025.
First Quarter 2023 Financial & Operations Overview:
InPlay’s capital program for the first quarter of 2023 was the Company’s most active quarter in our history. During the quarter, InPlay invested $29.6 million drilling, completing and equipping four (3.2 net) ERH wells in Willesden Green, two (2.0 net) ERH wells in Pembina and two (0.3 net) non-operated Willesden Green ERH wells. Completion operations on two wells were advanced into the quarter that were originally planned to occur in the second quarter to ensure these wells could be brought on production prior to spring breakup. InPlay also advanced the initiation of its second quarter capital program into the first quarter by drilling in Willesden Green an additional one (0.95 net) ERH well in March and beginning the drilling operations on another one (0.95 net) ERH well. During the quarter, the Company also started construction on the first of two planned natural gas facility upgrades in Willesden Green in 2023.
In one area of Pembina, as published in our March 15, 2023 press release, the Company had natural gas production curtailments beginning February 15th from a third party natural gas facility due to capacity constraints. This impacted production in the quarter by approximately 475 boe/d (68% natural gas). InPlay actively responded to mitigate the impact of this curtailment on revenue by shutting in wells with high gas weightings, maximizing oil production and AFF in the strong oil pricing environment. The impact of the constraints was also mitigated by the fact that due to expected weaker natural gas pricing in 2023, InPlay previously shifted 2023 drilling plans away from this prolific production area due to its higher gas weighted production, and its higher gas processing fees in comparison to our Willesden Green property.
In Willesden Green, two (1.6 net) ERH wells that were brought on production in early February had average initial production (“IP”) rates per well of 579 boe/d (73% light crude oil and NGLs) and 428 boe/d (70% light crude oil and NGLs) over their first 30 and 60 days respectively. The Company also brought on production another two (1.6 net) ERH Willesden Green wells in early March. The average IP rates for these wells was 722 boe/d (82% light crude oil and NGLs) and 564 boe/d (81% light crude oil and NGLs) per well over their first 30 and 60 days respectively. These four wells have delivered IP rates significantly above internal expectations and their high production rates led to increased back pressure in the area resulting in operated and non-operated curtailments of approximately 150 boe/d (57% light crude oil and NGLs) during the quarter due to temporarily backing out production from our older lower pressured offsetting wells. During April, InPlay completed the upgrade on the first of two natural gas processing facilities in the Willesden Green area which allowed curtailed production to be brought back online.
Production averaged 9,020 boe/d (58% light crude oil & NGLs) (1) in the first quarter of 2023 resulting in $21.3 million of AFF. The impact on production due to the two above mentioned curtailments was approximately 625 boe/d (48% light crude oil & NGLs) in the first quarter of 2023. During the quarter, InPlay increased light oil and NGLs weighting by approximately 1.5% over the fourth quarter of 2022, and this weighting is expected to continue to increase as the Company is focused on drilling in areas with higher oil weightings.
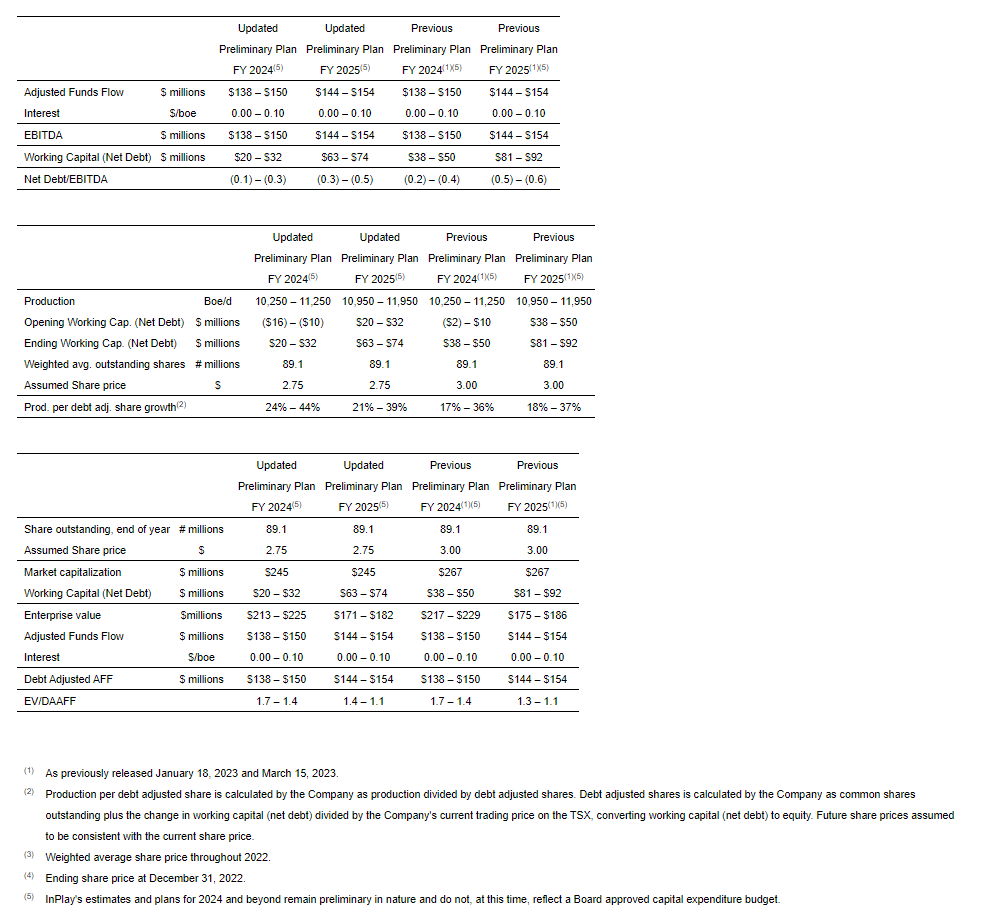
Outlook and Operations Update(5)
InPlay continues to be excited about 2023 as our drilling continues to outperform our expectations including the two oil focused wells drilled in Pembina in the first quarter and brought on production in April. The two (2.0 net) ERH wells had average IP rates over their first 25 days of 307 boe/d (89% light crude oil and NGLs) per well, exceeding our internal forecasts with a strong oil and liquids weighting. These wells are expected to remain at an elevated oil weighting and flat for a few months as we continue to see strong pressures, decreasing water cuts and the artificial lift equipment is operating at maximum pumping capacity.
Capital activity planned for the second quarter will include completing and bringing on production three (2.9 net) ERH wells in Willesden Green which commenced drilling in March and finished in April. These wells are expected to be completed in late May and brought on production in early June. Continued work on our second significant upgrade to an operated natural gas plant in Willesden Green is also planned for the quarter. This upgrade is expected to be online in the second half of July and provides InPlay with considerable increased operated natural gas capacity to facilitate continued development and growth in Willesden Green in the current and future years. Drilling activity is expected to resume in late June or early July but overall capital spending in the second quarter is expected to be significantly lower than the first quarter providing strong free adjusted funds flow(3).
A three week turnaround at the Company’s largest non-operated midstream natural gas facility is expected to occur in June. InPlay proactively secured capacity at alternative facilities for a significant amount of impacted gas production and the production of oil and NGLs in the second quarter of 2023 is not expected to be materially affected.
InPlay responded quickly and effectively to address the production curtailments impacting the Company in the first quarter. Natural decline of InPlay and other operators’ production in Pembina continues to reduce the impact of curtailed production, which is currently estimated at 825 boe/d (68% natural gas), compared to the 950 boe/d (68% natural gas) impact during the last half of the first quarter. We expect natural declines will continue to reduce the impact of curtailed production through the summer and alternative options to bring the remaining curtailed production fully back online are currently being evaluated. The Company anticipates all curtailed production to be back online early in the fourth quarter of 2023 which will be sold into the much higher future winter natural gas prices.
Strong fundamentals have InPlay continuing to focus on high oil weighted properties as we have a much more favorable outlook for oil prices versus natural gas prices, specifically in the second half of 2023. This focus is due to light oil and NGLs representing an estimated 86% of our overall forecasted corporate revenue in 2023. The 2023 capital program will remain flexible and the Company will revisit this program should commodity prices continue to remain volatile.
Similar to other operators, InPlay has had production in the Pembina region affected by the recent wildfires in Alberta. Our first priority was ensuring the safety of our employees, contractors, the community and our infrastructure, which to date has been accomplished. The Company started shutting in production and facilities late on May 4th and had concluded shutting in all affected wells and facilities by late in the day on May 5th. Affected production shut in peaked at approximately 3,400 boe/d (52% light oil and liquids). Since the weekend the fire hazard has somewhat diminished in the area. Production has started to be brought back on over the past few days and we will continue to restart the remaining production down as services allow. We will continue to monitor the hazards and act accordingly. The Company thanks its field employees for their diligent and quick action in safely shutting in operations.
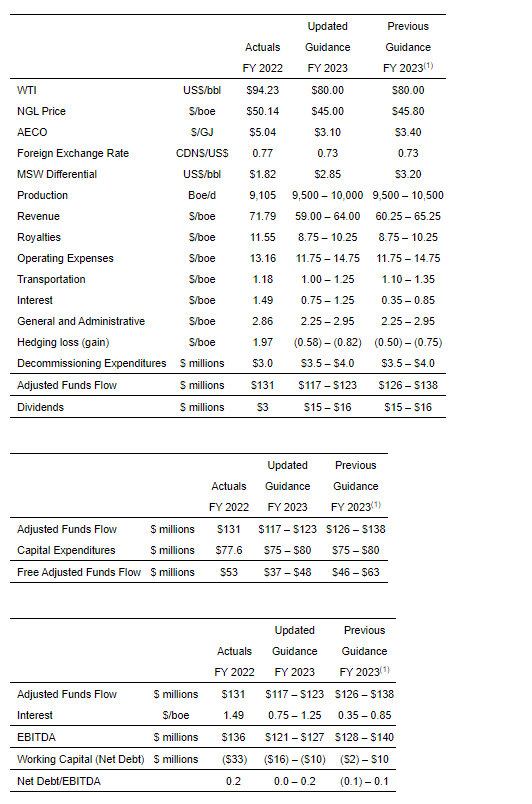
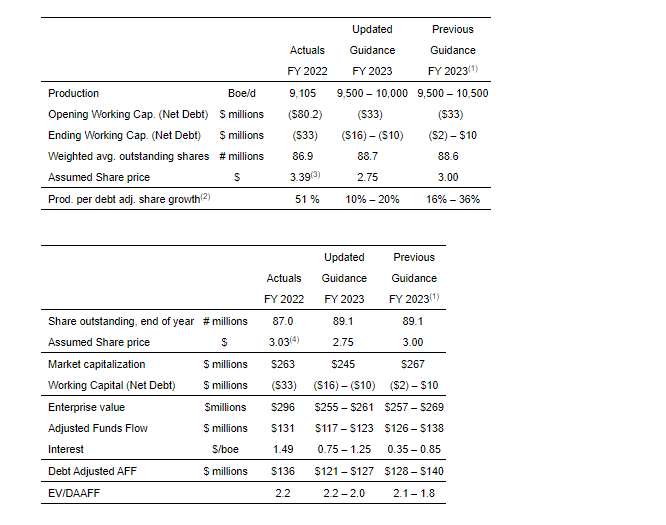
Strong results from our 2023 drilling program to date has InPlay reiterating our previous production guidance of 9,500 – 10,500 boe/d(1). However, given the curtailments experienced to date in 2023 and their expected impact over the next few quarters, the Company is forecasting 2023 average production to be within the lower half of this guidance at 9,500 – 10,000 boe/d(1) but at the higher end of our light crude oil and NGLs weighting guidance at 59% – 61%.
The Company continues to expect near term volatility in commodity prices, specifically natural gas prices, but with the United States refined product inventory levels at five year lows, oil inventory at the five year average and refineries starting back up after maintenance downtime, we anticipate the second half of 2023 to have higher oil prices. The Company’s downside exposure to lower forward summer 2023 natural gas prices are protected with hedges put in place of 12,500 GJ/day swaps at $3.73 AECO per GJ for April to October 2023. InPlay forecasts 2023 AFF(2) of $117 to $123 million with FAFF(3) of $37 to $48 million. The Company’s leverage metrics are forecasted to remain at very low levels, with net debt to EBITDA(3) forecast to be 0.0x – 0.2x for 2023.
The Company continues to remain focused on providing strong returns to shareholders through the payment of our monthly dividend of $0.015/share (which is expected to be only 13%-14% of forecasted 2023 AFF), timely share repurchases under our normal course issuer bid and top-tier production per debt adjusted share growth. The Company’s strong debt position, disciplined and adaptable capital allocation, and high quality asset base provides InPlay with a competitive advantage to continue to provide strong returns to shareholders in a volatile commodity pricing environment. The Company forecasts our base monthly dividend to be sustainable in a scenario where WTI dropped to US $55/bbl through to the end of 2025.
On behalf of our employees, management team and Board of Directors, we would like to thank our shareholders for their support and look forward to updating you on our progress throughout the year.
Notes:
1.
See “Production Breakdown by Product Type” at the end of this press release.
2.
Capital management measure. See “Non-GAAP and Other Financial Measures” contained within this press release.
3.
Non-GAAP financial measure or ratio that does not have a standardized meaning under International Financial Reporting Standards (IFRS) and GAAP and therefore may not be comparable with the calculations of similar measures for other companies. Please refer to “Non-GAAP and Other Financial Measures” contained within this press release.
4.
Supplementary financial measure. See “Non-GAAP and Other Financial Measures” contained within this press release.
5.
See “Reader Advisories – Forward Looking Information and Statements” for key budget and underlying assumptions related to our previous and updated 2023 capital program and associated guidance.
Reader Advisories
Non-GAAP and Other Financial Measures
Throughout this press release and other materials disclosed by the Company, InPlay uses certain measures to analyze financial performance, financial position and cash flow. These non-GAAP and other financial measures do not have any standardized meaning prescribed under GAAP and therefore may not be comparable to similar measures presented by other entities. The non-GAAP and other financial measures should not be considered alternatives to, or more meaningful than, financial measures that are determined in accordance with GAAP as indicators of the Company performance. Management believes that the presentation of these non-GAAP and other financial measures provides useful information to shareholders and investors in understanding and evaluating the Company’s ongoing operating performance, and the measures provide increased transparency and the ability to better analyze InPlay’s business performance against prior periods on a comparable basis.
Non-GAAP Financial Measures and Ratios
Included in this document are references to the terms “free adjusted funds flow”, “operating income”, “operating netback per boe”, “operating income profit margin”, “Net Debt to EBITDA”, “Net Corporate Acquisitions”, “Debt adjusted production per share” and “EV / DAAFF”. Management believes these measures and ratios are helpful supplementary measures of financial and operating performance and provide users with similar, but potentially not comparable, information that is commonly used by other oil and natural gas companies. These terms do not have any standardized meaning prescribed by GAAP and should not be considered an alternative to, or more meaningful than “profit (loss) before taxes”, “profit (loss) and comprehensive income (loss)”, “adjusted funds flow”, “capital expenditures”, “corporate acquisitions, net of cash acquired”, “net debt”, “weighted average number of common shares (basic)” or assets and liabilities as determined in accordance with GAAP as a measure of the Company’s performance and financial position.
Free Adjusted Funds Flow
Management considers FAFF an important measure to identify the Company’s ability to improve its financial condition through debt repayment and its ability to provide returns to shareholders. FAFF should not be considered as an alternative to or more meaningful than AFF as determined in accordance with GAAP as an indicator of the Company’s performance. FAFF is calculated by the Company as AFF less exploration and development capital expenditures and property dispositions (acquisitions) and is a measure of the cashflow remaining after capital expenditures before corporate acquisitions that can be used for additional capital activity, corporate acquisitions, repayment of debt or decommissioning expenditures or potentially return of capital to shareholders. Refer below for a calculation of historical FAFF and to the “Forward Looking Information and Statements” section for a calculation of forecast FAFF.
Operating Income/Operating Netback per boe/Operating Income Profit Margin
InPlay uses “operating income”, “operating netback per boe” and “operating income profit margin” as key performance indicators. Operating income is calculated by the Company as oil and natural gas sales less royalties, operating expenses and transportation expenses and is a measure of the profitability of operations before administrative, share-based compensation, financing and other non-cash items. Management considers operating income an important measure to evaluate its operational performance as it demonstrates its field level profitability. Operating income should not be considered as an alternative to or more meaningful than net income as determined in accordance with GAAP as an indicator of the Company’s performance. Operating netback per boe is calculated by the Company as operating income divided by average production for the respective period. Management considers operating netback per boe an important measure to evaluate its operational performance as it demonstrates its field level profitability per unit of production. Operating income profit margin is calculated by the Company as operating income as a percentage of oil and natural gas sales. Management considers operating income profit margin an important measure to evaluate its operational performance as it demonstrates how efficiently the Company generates field level profits from its sales revenue. Refer below for a calculation of operating income, operating netback per boe and operating income profit margin.
Net Debt to EBITDA
Management considers Net Debt to EBITDA an important measure as it is a key metric to identify the Company’s ability to fund financing expenses, net debt reductions and other obligations. EBITDA is calculated by the Company as adjusted funds flow before interest expense. When this measure is presented quarterly, EBITDA is annualized by multiplying by four. When this measure is presented on a trailing twelve month basis, EBITDA for the twelve months preceding the net debt date is used in the calculation. This measure is consistent with the EBITDA formula prescribed under the Company’s Senior Credit Facility. Net Debt to EBITDA is calculated as Net Debt divided by EBITDA. Refer below for a calculation of Net Debt to EBITDA and to the “Forward Looking Information and Statements” section for a calculation of forecast Net Debt to EBITDA.
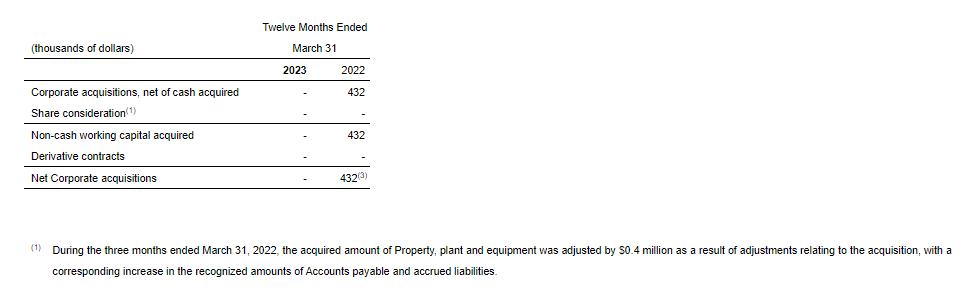
Net Corporate Acquisitions
Management considers Net corporate acquisitions an important measure as it is a key metric to evaluate the corporate acquisition in comparison to other transactions using the negotiated consideration value and ignoring changes to the fair value of the share consideration between the signing of the definitive agreement and the closing of the transaction. Net corporate acquisitions should not be considered as an alternative to or more meaningful than “Corporate acquisitions, net of cash acquired” as determined in accordance with GAAP as an indicator of the Company’s performance. Net corporate acquisitions is calculated as total consideration with share consideration adjusted to the value negotiated with the counterparty, less working capital balances assumed on the corporate acquisition. Refer below for a calculation of Net corporate acquisitions and reconciliation to the nearest GAAP measure, “Corporate acquisitions, net of cash acquired”.
Production per Debt Adjusted Share
InPlay uses “Production per debt adjusted share” as a key performance indicator. Debt adjusted shares should not be considered as an alternative to or more meaningful than common shares as determined in accordance with GAAP as an indicator of the Company’s performance. Debt adjusted shares is a non-GAAP measure used in the calculation of Production per debt adjusted share and is calculated by the Company as common shares outstanding plus the change in net debt divided by the Company’s current trading price on the TSX, converting net debt to equity. Debt adjusted shares should not be considered as an alternative to or more meaningful than weighted average number of common shares (basic) as determined in accordance with GAAP as an indicator of the Company’s performance. Management considers Debt adjusted share is a key performance indicator as it adjusts for the effects of capital structure in relation to the Company’s peers. Production per debt adjusted share is calculated by the Company as production divided by debt adjusted shares. Management considers Production per debt adjusted share is a key performance indicator as it adjusts for the effects of changes in annual production in relation to the Company’s capital structure. Refer below for a calculation of Production per debt adjusted share and to the “Forward Looking Information and Statements” section for a calculation of forecast Production per debt adjusted share.
EV / DAAFF
InPlay uses “enterprise value to debt adjusted AFF” or “EV/DAAFF” as a key performance indicator. EV/DAAFF is calculated by the Company as enterprise value divided by debt adjusted AFF for the relevant period. Debt adjusted AFF (“DAAFF”) is calculated by the Company as adjusted funds flow plus financing costs. Enterprise value is a capital management measures that is used in the calculation of EV/DAAFF. Enterprise value is calculated as the Company’s market capitalization plus working capital (net debt). Management considers enterprise value a key performance indicator as it identifies the total capital structure of the Company. Management considers EV/DAAFF a key performance indicator as it is a key metric used to evaluate the sustainability of the Company relative to other companies while incorporating the impact of differing capital structures. Refer to the “Forward Looking Information and Statements” section for a calculation of forecast EV/DAAFF.
Capital Management Measures
Adjusted Funds Flow
Management considers adjusted funds flow to be an important measure of InPlay’s ability to generate the funds necessary to finance capital expenditures. Adjusted funds flow is a GAAP measure and is disclosed in the notes to the Company’s financial statements for the three months ended March 31, 2023. All references to adjusted funds flow throughout this MD&A are calculated as funds flow adjusting for decommissioning expenditures and transaction and integration costs. Decommissioning expenditures are adjusted from funds flow as they are incurred on a discretionary and irregular basis and are primarily incurred on previous operating assets. Transaction costs are non-recurring costs for the purposes of an acquisition, making the exclusion of these items relevant in Management’s view to the reader in the evaluation of InPlay’s operating performance. The Company also presents adjusted funds flow per share whereby per share amounts are calculated using weighted average shares outstanding consistent with the calculation of profit per common share.
Net Debt / Working Capital
Net debt / working capital is a GAAP measure and is disclosed in the notes to the Company’s financial statements for three months ended March 31, 2023. The Company closely monitors its capital structure with a goal of maintaining a strong balance sheet to fund the future growth of the Company. The Company monitors net debt / working capital as part of its capital structure. The Company uses net debt / working capital (bank debt plus accounts payable and accrued liabilities less accounts receivables and accrued receivables, prepaid expenses and deposits and inventory) as an alternative measure of outstanding debt. Management considers net debt / working capital an important measure to assist in assessing the liquidity of the Company.
Supplementary Measures
“Average realized crude oil price” is comprised of crude oil commodity sales from production, as determined in accordance with IFRS, divided by the Company’s crude oil production. Average prices are before deduction of transportation costs and do not include gains and losses on financial instruments.
“Average realized NGL price” is comprised of NGL commodity sales from production, as determined in accordance with IFRS, divided by the Company’s NGL production. Average prices are before deduction of transportation costs and do not include gains and losses on financial instruments.
“Average realized natural gas price” is comprised of natural gas commodity sales from production, as determined in accordance with IFRS, divided by the Company’s natural gas production. Average prices are before deduction of transportation costs and do not include gains and losses on financial instruments.
“Average realized commodity price” is comprised of commodity sales from production, as determined in accordance with IFRS, divided by the Company’s production. Average prices are before deduction of transportation costs and do not include gains and losses on financial instruments.
“Adjusted funds flow per weighted average basic share” is comprised of adjusted funds flow divided by the basic weighted average common shares.
“Adjusted funds flow per weighted average diluted share” is comprised of adjusted funds flow divided by the diluted weighted average common shares.
“Adjusted funds flow per boe” is comprised of adjusted funds flow divided by total production.
Forward-Looking Information and Statements This news release contains certain forward–looking information and statements within the meaning of applicable securities laws. The use of any of the words “expect”, “anticipate”, “continue”, “estimate”, “may”, “will”, “project”, “should”, “believe”, “plans”, “intends”, “forecast” and similar expressions are intended to identify forward-looking information or statements. In particular, but without limiting the foregoing, this news release contains forward-looking information and statements pertaining to the following: the Company’s business strategy, milestones and objectives; the Company’s planned 2023 capital program including wells to be drilled and completed and the timing of the same and that the operated natural gas plant in Willesden Green is expected to be online in the second half of July; 2023 guidance based on the planned capital program and all associated underlying assumptions set forth in this press release including, without limitation, forecasts of 2023 annual average production levels, debt adjusted production levels, adjusted funds flow, free adjusted funds flow, Net Debt/EBITDA ratio, operating income profit margin, and Management’s belief that the Company can grow some or all of these attributes and specified measures; light crude oil and NGLs weighting estimates; expectations regarding future commodity prices; future oil and natural gas prices; future liquidity and financial capacity; future results from operations and operating metrics; future costs, expenses and royalty rates; future interest costs; the exchange rate between the $US and $Cdn; future development, exploration, acquisition, development and infrastructure activities and related capital expenditures, including our planned 2023 capital program; the amount and timing of capital projects; forecasted spending on decommissioning; that the Company has the financial capability to deliver consistent return to shareholders and the dividend is supportable at a $55 WTI pricing environment until 2025; that the Company’s light oil and NGLs weighting is expected to continue to increase as the Company is focused on drilling in areas with higher oil weightings; that the production profile of the two Pembina wells brought on production in April is expected to remain flat for a few months; the expectation that the second quarter will provide strong free adjusted funds flow; the expectation that all curtailed production will be back online in the fourth quarter of 2023; and methods of funding our capital program.
Without limitation of the foregoing, readers are cautioned that the Company’s future dividend payments to shareholders of the Company, if any, and the level thereof will be subject to the discretion of the Board of Directors of InPlay. The Company’s dividend policy and funds available for the payment of dividends, if any, from time to time, is dependent upon, among other things, levels of FAFF, leverage ratios, financial requirements for the Company’s operations and execution of its growth strategy, fluctuations in commodity prices and working capital, the timing and amount of capital expenditures, credit facility availability and limitations on distributions existing thereunder, and other factors beyond the Company’s control. Further, the ability of the Company to pay dividends will be subject to applicable laws, including satisfaction of solvency tests under the Business Corporations Act (Alberta), and satisfaction of certain applicable contractual restrictions contained in the agreements governing the Company’s outstanding indebtedness.
Forward-looking statements or information are based on a number of material factors, expectations or assumptions of InPlay which have been used to develop such statements and information but which may prove to be incorrect. Although InPlay believes that the expectations reflected in such forward looking statements or information are reasonable, undue reliance should not be placed on forward-looking statements because InPlay can give no assurance that such expectations will prove to be correct. In addition to other factors and assumptions which may be identified herein, assumptions have been made regarding, among other things: the impact of increasing competition; the general stability of the economic and political environment in which InPlay operates; the timely receipt of any required regulatory approvals; the ability of InPlay to obtain qualified staff, equipment and services in a timely and cost efficient manner; drilling results; the ability of the operator of the projects in which InPlay has an interest in to operate the field in a safe, efficient and effective manner; the ability of InPlay to obtain debt financing on acceptable terms; the timing and amount of purchases under the Company’s NCIB; the anticipated tax treatment of the monthly base dividend; field production rates and decline rates; the ability to replace and expand oil and natural gas reserves through acquisition, development and exploration; the timing and cost of pipeline, storage and facility construction and the ability of InPlay to secure adequate product transportation; future commodity prices; that various conditions to a shareholder return strategy can be satisfied; expectations regarding the potential impact of COVID-19 and the Russia/Ukraine conflict; currency, exchange and interest rates; regulatory framework regarding royalties, taxes and environmental matters in the jurisdictions in which InPlay operates; and the ability of InPlay to successfully market its oil and natural gas products.
The forward-looking information and statements included herein are not guarantees of future performance and should not be unduly relied upon. Such information and statements, including the assumptions made in respect thereof, involve known and unknown risks, uncertainties and other factors that may cause actual results or events to defer materially from those anticipated in such forward-looking information or statements including, without limitation: the continuing impact of the COVID-19 pandemic and the Russia/Ukraine conflict; inflation and the risk of a global recession; changes in our planned 2023 capital program; changes in our long range plan; changes in our approach to shareholder returns, including in relation to the Company’s NCIB and the timing and amount of any potential purchases thereunder; changes in commodity prices and other assumptions outlined herein; the risk that dividend payments may be reduced, suspended or cancelled; the potential for variation in the quality of the reservoirs in which we operate; changes in the demand for or supply of our products; unanticipated operating results or production declines; changes in tax or environmental laws, royalty rates or other regulatory matters; changes in development plans or strategies of InPlay or by third party operators of our properties; changes in our credit structure, increased debt levels or debt service requirements; inaccurate estimation of our light crude oil and natural gas reserve and resource volumes; limited, unfavorable or a lack of access to capital markets; increased costs; a lack of adequate insurance coverage; the impact of competitors; and certain other risks detailed from time-to-time in InPlay’s continuous disclosure documents filed on SEDAR including our Annual Information Form and our MD&A.
This press release contains future-oriented financial information and financial outlook information (collectively, “FOFI”) about InPlay’s financial and leverage targets and objectives, InPlay’s long-term forecast, and potential dividends and share buybacks, all of which are subject to the same assumptions, risk factors, limitations, and qualifications as set forth in the above paragraphs. The actual results of operations of InPlay and the resulting financial results will likely vary from the amounts set forth in this press release and such variation may be material. InPlay and its management believe that the FOFI has been prepared on a reasonable basis, reflecting management’s reasonable estimates and judgments. However, because this information is subjective and subject to numerous risks, it should not be relied on as necessarily indicative of future results. Except as required by applicable securities laws, InPlay undertakes no obligation to update such FOFI. FOFI contained in this press release was made as of the date of this press release and was provided for the purpose of providing further information about InPlay’s anticipated future business operations and strategy. Readers are cautioned that the FOFI contained in this press release should not be used for purposes other than for which it is disclosed herein.
The internal projections, expectations, or beliefs underlying our Board approved 2023 capital budget and associated guidance, as well as management’s preliminary estimates and targets in respect of plans for 2024 and beyond (which are not based on Board approved budgets at this time), are subject to change in light of, among other factors, the impact of world events including pandemics and the Russia/Ukraine conflict, ongoing results, prevailing economic circumstances, volatile commodity prices, and industry conditions and regulations. InPlay’s financial outlook and guidance provides shareholders with relevant information on management’s expectations for results of operations, excluding any potential acquisitions or dispositions, for such time periods based upon the key assumptions outlined herein. In this document reference is made to the Company’s longer range 2024 and beyond internal plan and associated economic model. Such information reflects internal estimates and targets used by management for the purposes of making capital investment decisions and for internal long range planning and budget preparation. Readers are cautioned that events or circumstances could cause capital plans and associated results to differ materially from those predicted and InPlay’s guidance for 2023, and more particularly 2024 and beyond, may not be appropriate for other purposes. Accordingly, undue reliance should not be placed on same.
The forward-looking information and statements contained in this news release speak only as of the date hereof and InPlay does not assume any obligation to publicly update or revise any of the included forward-looking statements or information, whether as a result of new information, future events or otherwise, except as may be required by applicable securities laws.
Risk Factors to FLI
Risk factors that could materially impact successful execution and actual results of the Company’s 2023 capital program and associated guidance and long-term preliminary plans and estimates include:
volatility of petroleum and natural gas prices and inherent difficulty in the accuracy of predictions related thereto;
the extent of any unfavorable impacts of wildfires in the province of Alberta;
changes in Federal and Provincial regulations;
the Company’s ability to secure financing for the Board approved 2023 capital program and longer term capital plans sourced from AFF, bank or other debt instruments, asset sales, equity issuance, infrastructure financing or some combination thereof;
those additional risk factors set forth in the Company’s MD&A and most recent Annual Information Form filed on SEDAR
Key Budget and Underlying Material Assumptions to FLI
The key budget and underlying material assumptions used by the Company in the development of its current and previous 2023 guidance and preliminary estimates are as follows:
The change in the current 2023 guidance from prior guidance results from forecasted production to be within the lower half of guidance given the curtailments experienced to date in 2023 and their expected impact over the next few quarters as detailed in this press release.
The Company’s 2024 and 2025 preliminary plans remains the same as previously released January 18, 2023, with net debt (working capital) updated to reflect the updated 2023 ending net debt. The 2024 and 2025 preliminary plan guidance calculations which are impacted by this change and the change in assumed share price to $2.75 are outlined below.
See “Production Breakdown by Product Type” below
Quality and pipeline transmission adjustments may impact realized oil prices in addition to the MSW Differential provided above
Changes in working capital (net debt) are not assumed to have a material impact between the years presented above.
The assumptions above do not include potential future purchases through the Company’s NCIB.
Test Results and Initial Production Rates
Test results and initial production (“IP”) rates disclosed herein, particularly those short in duration, may not necessarily be indicative of long term performance or of ultimate recovery. A pressure transient analysis or well-test interpretation has not been carried out and thus certain of the test results provided herein should be considered to be preliminary until such analysis or interpretation has been completed.
Production Breakdown by Product Type
Disclosure of production on a per boe basis in this press release consists of the constituent product types as defined in NI 51–101 and their respective quantities disclosed in the table below:
References to crude oil, light oil, NGLs or natural gas production in this press release refer to the light and medium crude oil, natural gas liquids and conventional natural gas product types, respectively, as defined in National Instrument 51-101, Standards of Disclosure for Oil and Gas Activities (“Nl 51-101”).
BOE equivalent Barrel of oil equivalents or BOEs may be misleading, particularly if used in isolation. A BOE conversion ratio of 6 mcf: 1 bbl is based on an energy equivalency conversion method primarily applicable at the burner tip and does not represent a value equivalency at the wellhead. Given that the value ratio based on the current price of crude oil as compared to natural gas is significantly different than the energy equivalency of 6:1, utilizing a 6:1 conversion basis may be misleading as an indication of value.
SOURCE InPlay Oil Corp.
For further information: Doug Bartole, President and Chief Executive Officer, InPlay Oil Corp., Telephone: (587) 955-0632; Darren Dittmer, Chief Financial Officer, InPlay Oil Corp., Telephone: (587) 955-0634