Interest Rate Increases are Less Frightening When the Impact is Understood
The fixed income market, and the interest rates market in general have a pronounced role in shaping stock market dynamics and equity investor sentiment. At a minimum, higher rates, the cost of money, when increasing, will most directly impact businesses that borrow as part of their normal activity. Other industries find that growing profits is more difficult in a less direct way. And then there are actually sectors that can benefit from an upward-sloping yield curve. Below we cover five different ways that higher interest rates impact stocks, and mention sectors that may be especially hurt, and some that could even thrive if the rates continue to climb higher.
Background
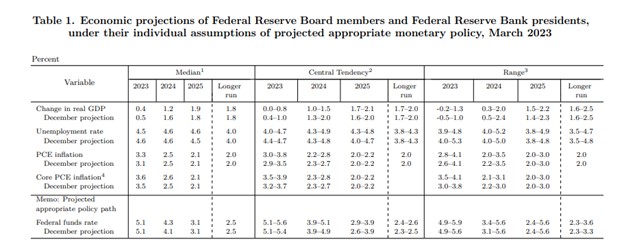
The U.S. central bank, The Federal Reserve has raised overnight interest rates from nearly 0.00% to near 5.25%. Longer-term rates have not followed in lock-step as other dynamics such as future economic expectations, flight to quality, and Fed yield-curve-control have caused longer rates to continue to lag below short-term interest rates.
In recent days there has been some selling in bonds which has driven longer interest rates up. The overall reason is the rekindled belief that the Fed is not finished tightening after the FOMC minutes from June indicated such. But other factors such as investors doing break-even analysis on longer term bonds and then raealizing they may not be getting paid enough interest to offset inflation, or to benefit them more than rolling shorter maturities that may be paying 200bp higher.
The sudden increase in rates, especially the ten-year US Treasury Note which is a benchmark for many lending rates, including mortgages, has caused stock market participants to feel unsettled. Some of their fears may be justified, some may not be.
Five Ways Higher Interest Rates Impact Equities
#1 Higher Rates Impact on Equity Valuations
One of the primary concerns for stock market investors, when interest rates rise, is the potential impact on equity valuations. As interest rates increase, the discount rate used to value future cash flows is then higher. This can put downward pressure on equity valuations, particularly for stocks with high price-to-earnings ratios. Investors become concerned about the potential decline in stock prices and the overall effect on the market’s valuation levels.
#2 Profitability of Interest Rate-Sensitive Sectors
Some sectors are particularly interest rate sensitive. Utilities for example, might have a couple of things working against them. First off, they are notorious for carrying a high level of debt. As this debt needs to be refinanced (as bonds mature), the new bonds need to be issued at higher rates, increasing the utility’s cost of doing business.
Utilities also are popular investments among dividend investors. As yields on bonds increase, there is more competition for income investors to choose from, at times with lower risk, which makes utility stocks less attractive.
As one might imagine REITs, by definition, all have real estate as underlying assets. Rising interest rates can increase borrowing costs for REITs involved in property acquisitions and development. This can potentially affect their profitability and underlying property valuations.
As with utilities, the REIT sector attracts income investors; if bonds become a more attractive alternative, this creates lower demand for REIT investing.
Financial institutions are certainly impacted, however, depending on the segment within financials, some may benefit from increased profit margins, while others are weighed down by increased costs. Basic banking is borrowing short and lending out longer, then managing the risk of maturity mismatch. As longer-term rates rise relative to shorter rates, these institutions find their earnings spread increases.
In recent years the trend has been, especially for larger banks, to create loans and then sell them. They profit on the servicing side, or administrative fees to create the loan. In this way they are shielded from interest rate mismatch risk, and they can make more loans on the same deposit base (selling the loans replenished the funds they can loan from). So the benefit of rising rates on benchmark securities relative to the banks deposit rates could have much less positive impact than it might have if they held the loans. What may actually happen within these institutions is that they experience fewer loans as consumers and business borrow take fewer loans, thus earning less fee income.
#3 Investors Lean Toward Bond Investments
The return on anything is the present value, versus future value, over time held. Higher interest rates can make fixed-income investments more attractive than low rates compared to stocks. When interest rates rise, more investors prefer a known return in terms of interest payments than an unknown move in stocks valuations. This shift in investor preferences can lead to reduced demand for equities and potentially impact stock market performance.
Investors buying bonds as rates are rising will experience a decrease in the value of their fixed income securities. So, they may be surprised to learn that they avoided stocks because stocks may go down in value, and instead invested in fixed income which mathematically will go down in value when rates rise.
#4 Borrowing Costs for Companies
As mentioned earlier, rising interest rates increase the borrowing costs for companies. This can impact corporate profitability and investment decisions, which in turn can affect stock prices. Companies that rely heavily on debt financing may experience higher interest expenses, potentially squeezing profit margins. Investors become concerned about the potential impact on corporate earnings and the overall financial health of companies in a higher interest rate environment.
Analyzing a company’s capital structure, and looking for signs of low debt levels, or long-term debt that is locked in at the low interest rates of the early 2020’s, may be a good way to filter companies that have a profit advantage over their competitors
#5 Consumer Spending and Business Investment
Consumer spending levels are a direct driver in consumer stocks. When borrowing becomes more expensive, consumers may reduce their discretionary spending. This can impact businesses that rely on consumer demand, potentially leading to lower revenues and profitability. The stocks that tend to hold up more when spending levels decrease are those that produce necessities.
Business investment during periods of rising interest rates can influence investment decisions for businesses. As borrowing costs increase, companies may reduce or delay capital investments, expansions, or acquisitions. This cautious approach can impact economic growth and overall industry development, which can in turn affect its performance, for much longer than a quarter or two.
Take Away
Stock market investors have legitimate concerns about the impact of higher interest rates on their investments. The potential effects on equity valuations, profitability of interest rate-sensitive sectors, investor preferences for fixed-income investments, borrowing costs for companies, and consumer spending/business investment are key factors that contribute to investor apprehension. It is as important for investors to monitor interest rate trends and understand the impacts as it is for them to monitor.
Managing Editor, Channelchek