The Russell 2000 index has been an overlooked area of the stock market this year, dominated by the headlines and volatility of mega-cap tech and blue chips. However, a seismic shift occurred last Wednesday when the Russell 2000 rallied over 6% for its best day since March, turning positive for 2023.
This index of approximately 2,000 small-cap stocks just made Wall Street wake up and take notice thanks to this violent swing. Now is the time for investors to understand what’s driving the resurgence and how to capitalize in small caps.
What is the Russell 2000 and Why Does It Matter?
The Russell 2000 index measures the performance of U.S. small-cap stocks with market caps below $3.7 billion. Weights are assigned by market cap, so the index serves as a benchmark for bonafide smaller firms. These companies tend to be younger with higher volatility and growth prospects.
As a result, the Russell 2000 provides a barometer of investor sentiment towards risk assets. Turning points in the index can indicate shifts in the overall stock market as traders move towards or away from speculation.
The recent 6%+ rally last Wednesday jolted the Russell 2000 into positive return territory for the year so far, now up 4% year-to-date. This signals a potential appetite for risk returning to markets, with traders betting on outsized returns potential in small caps after a prolonged lull.
Why Invest in Small Caps?
Investing in Russell 2000 companies over other stocks has compelling advantages if timed appropriately in the market cycle. First, smaller firms have lower visibility and coverage, so mispricings are more common. This creates pockets of opportunities for above-average returns compared to efficient larger cap markets.
Additionally, smaller size allows for exponential growth that massive companies simply can’t replicate. A small cap doubling in customers or revenue could lead to a 10X stock return, while a blue chip would move only minimally. This asymmetric payoff profile rewards those willing to take on some extra risk.
Finally, identifying world-changing new products and innovations is easier in earlier stage small caps not yet on the main stage. Getting in early on the next Roku, Tesla, or Shake Shack while still qualifying for the 2000 index can deliver truly explosive portfolio growth.
What Investors Should Watch Next
Markets are now intently watching the Russell 2000 to see if last week’s awakening of small-cap animal spirits has true staying power. Traders want confirmation that the breakout can lead to a sustained run versus just being a short-lived dead cat bounce.
If the rally holds, it solidifies the thesis of rotating back towards risk—and earlier stage small names often lead the way in such environments. Savvy investors will use this volatility to start building positions in promising small caps with expanding growth prospects.
The secret is identifying the next crop of disruptors poised to multiply before the herd catches on. By getting ahead of the crowd now eyeing the Russell 2000’s surge, spectacular returns await those able to time the next leg up.
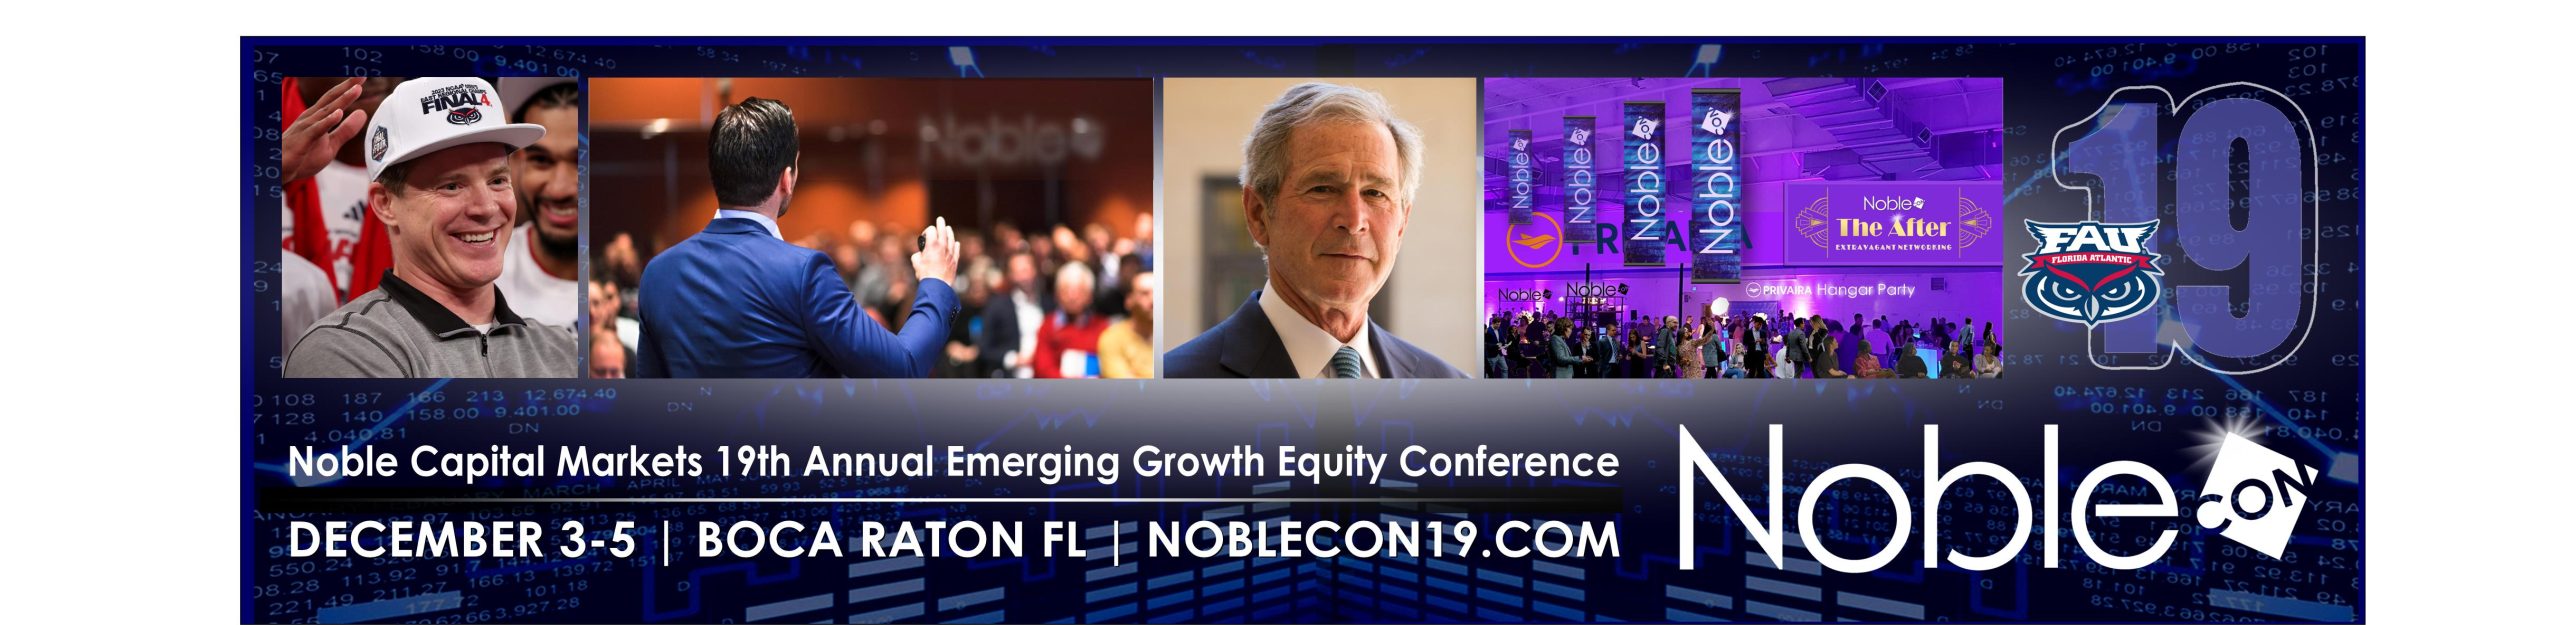
Bargain Hunting for Small Caps at NobleCon
One of the most effective ways to identify the small caps destined to drive the next market boom is to connect directly with leadership at the source. The annual NobleCon investor conference gives the opportunity for exactly that.
On December 3-5 in Boca Raton, Florida, small-cap firms will present their latest innovations, opportunities, and reasons to invest. Attendees gain first look access to fast-growing startups and tomorrow’s giants while they still qualify for the Russell 2000. Now in its 19th year, NobleCon19 promises to uncover the next crop of small cap innovators during the multi-day conference.
For investors looking to capitalize on the Russell 2000’s resurgence, NobleCon19 provides the direct pipeline to target ideas perfectly positioned to ride the reawakening wave in small caps. To learn more and register, visit www.noblecon19.com before discounted early bird rates expire.