Haynes International, Inc. is a leading developer, manufacturer and marketer of technologically advanced, nickel and cobalt-based high-performance alloys, primarily for use in the aerospace, industrial gas turbine and chemical processing industries.
Mark Reichman, Managing Director, Equity Research Analyst, Natural Resources, Noble Capital Markets, Inc.
Refer to the full report for the price target, fundamental analysis, and rating.
Acquisition by North American Stainless. In February, Haynes International entered into an agreement to be acquired by North American Stainless, a wholly owned subsidiary of Acerinox. North American Stainless will acquire all the outstanding shares of Haynes for $61.00 per share.The merger is conditioned on, among other things, the receipt of the approvals, clearances, or expirations of waiting periods under certain regulatory laws.
Receipt of all regulatory approvals and clearances. With the Austria waiting period expiration on November 15, all regulatory approvals and clearances where the applicable authorities have asserted jurisdiction have been obtained, including in the United States and in the United Kingdom.
Equity Research is available at no cost to Registered users of Channelchek. Not a Member? Click ‘Join’ to join the Channelchek Community. There is no cost to register, and we never collect credit card information.
This Company Sponsored Research is provided by Noble Capital Markets, Inc., a FINRA and S.E.C. registered broker-dealer (B/D).
*Analyst certification and important disclosures included in the full report. NOTE: investment decisions should not be based upon the content of this research summary. Proper due diligence is required before making any investment decision.
DLH delivers improved health and readiness solutions for federal programs through research, development, and innovative care processes. The Company’s experts in public health, performance evaluation, and health operations solve the complex problems faced by civilian and military customers alike, leveraging digital transformation, artificial intelligence, advanced analytics, cloud-based applications, telehealth systems, and more. With over 2,300 employees dedicated to the idea that “Your Mission is Our Passion,” DLH brings a unique combination of government sector experience, proven methodology, and unwavering commitment to public health to improve the lives of millions. For more information, visit www.DLHcorp.com.
Joe Gomes, CFA, Managing Director, Equity Research Analyst, Generalist , Noble Capital Markets, Inc.
Joshua Zoepfel, Research Associate, Noble Capital Markets, Inc.
Refer to the full report for the price target, fundamental analysis, and rating.
Credit Facility and CMOP Update. Yesterday, DLH announced the Company has amended its credit facility with lenders to modify the borrowing capacity of the facility itself and the financial covenants of the agreement. The credit facility’s maximum capacity is reduced from $70 million to $50 million with the amendment, although no changes were made to the maturity or pricing terms. We would point out that DLH also is expected to transition a portion of its CMOP locations to set-aside, small business contractors, although no further details were given.
Financial Covenants. As for the financial covenants of the agreement, the two that are specifically being changed are the Total Leverage ratio and Fixed Charge Coverage ratio. Importantly, the amendment increases the maximum threshold of the Total Leverage Ratio, with the most recent being to 4.5 to 1.0 in the first quarter next year from a prior 4.25 to 1.00. As for the Fixed Charge Coverage ratio, the minimum threshold is being lowered with the most recent staying the same at less than to 1.25 to 1.00 in the first quarter next year but lowering in subsequent quarters. While the reduction of the capacity of the facility is not ideal, we believe the changes to the covenants provides DLH flexibility in anticipation of the Company’s CMOP locations being moved to small businesses, impacting performance.
Equity Research is available at no cost to Registered users of Channelchek. Not a Member? Click ‘Join’ to join the Channelchek Community. There is no cost to register, and we never collect credit card information.
This Company Sponsored Research is provided by Noble Capital Markets, Inc., a FINRA and S.E.C. registered broker-dealer (B/D).
*Analyst certification and important disclosures included in the full report. NOTE: investment decisions should not be based upon the content of this research summary. Proper due diligence is required before making any investment decision.
Kratos Led Team Will Design, Implement and Operate Ground Infrastructure Supporting Interoperability Across Multi-Vendor LEO Constellations Using its Kratos OpenSpace® Platform
SAN DIEGO, Nov. 13, 2024 (GLOBE NEWSWIRE) — Kratos Defense & Security Solutions, Inc. (Nasdaq: KTOS), a technology company in the defense, national security and global markets, announced today that it has been awarded a contract valued at a maximum of $116.7 million over five years to create and operate an Advanced Fire Control Ground Infrastructure (AFCGI) for the U.S. Space Development Agency’s (SDA) Advanced Fire Control (AFC) program. The AFC will deliver integrated space and ground elements to demonstrate advanced fire control missions for missile defense.
Advanced fire control brings highly sophisticated systems for space-based sensing. These systems enable precise, real-time coordination for tracking operations in space for effective responses to threats. Among its applications, the AFCGI will support SDA’s Fire-control On Orbit-support-to-the-war Fighter program, also known as FOO Fighter or F2, which is tasked with detecting and tracking advanced missile threats, including hypersonic missiles.
As the AFCGI prime contractor, Kratos will lead a team of partner companies to:
Deliver and manage ground segment resources, including ground entry points and terrestrial network connections;
Fit-out and manage a government-owned, contractor-operated (GOCO) facility called the Demonstration Operations Center;
Manage a government-procured, contractor-operated cloud environment to provide cloud services, including hosting space vehicle mission operations center software and interfacing with mission partner systems; and,
Provide program management, systems engineering, integration, verification, and operations and maintenance of the AFC ground infrastructure.
Members of the Kratos-led team include ASRC Federal Systems Solutions, LLC, Peraton, Inc., Sphinx Defense, Inc. and Stellar Solutions, Inc.
Core to the AFCGI, Kratos will provide a Ground Resource Manager (GRM) which will be built for the FOO Fighter program and designed to support any future fire control demonstrations. Built upon Kratos’s OpenSpace Ground Platform, the GRM will ensure interoperability to support new space vehicles built by multiple manufacturers from multiple AFC constellations. OpenSpace is an orchestrated, software-defined and cloud-native platform based on accepted industry standards. With it, these satellite manufacturers will be able to synchronize their Command and Control (C2) missions into the AFCGI infrastructure, and new network elements and software applications will integrate seamlessly into the AFCGI. The GRM will act as the hub for the AFC constellations, serving to demonstrate modern capabilities as they evolve to support increasingly sophisticated operational programs.
Phil Carrai, President of Kratos’ Space Division stated, “Advancements in missile technology and hypersonics that can travel at more than 3000 mph present new adversarial threats and will require new defensive capabilities to identify, track and respond to them rapidly. The AFCGI will serve as a standing sandbox for exploring and validating new technologies, solutions and techniques to address these threats with commensurate speed and agility. The GRM will enable the Space Force to capitalize on best of breed technologies from across the most advanced developers, and seamlessly integrate and orchestrate their operations.”
About Kratos OpenSpace Kratos’ OpenSpace family of solutions enables the digital transformation of satellite ground systems to become a more dynamic and powerful part of the space network. The family consists of three product lines: OpenSpace SpectralNet for converting satellite RF signals to be used in digital environments; OpenSpace quantum products, which are virtual versions of traditional hardware components; and the OpenSpace Platform, the first commercially available, fully orchestrated, software-defined ground system. These three OpenSpace lines enable government agencies, commercial satellite operators and other service providers to implement digital operations at their own pace and in ways that meet their unique mission goals and business models. For more information about the OpenSpace family visit www.KratosDefense.com/OpenSpace.
About Kratos Defense & Security Solutions Kratos Defense & Security Solutions, Inc. (NASDAQ: KTOS) is a technology, products, system and software company addressing the defense, national security, and commercial markets. Kratos makes true internally funded research, development, capital and other investments, to rapidly develop, produce and field solutions that address our customers’ mission critical needs and requirements. At Kratos, affordability is a technology, and we seek to utilize proven, leading edge approaches and technology, not unproven bleeding edge approaches or technology, with Kratos’ approach designed to reduce cost, schedule and risk, enabling us to be first to market with cost effective solutions. We believe that Kratos is known as an innovative disruptive change agent in the industry, a company that is an expert in designing products and systems up front for successful rapid, large quantity, low cost future manufacturing which is a value add competitive differentiator for our large traditional prime system integrator partners and also to our government and commercial customers. Kratos intends to pursue program and contract opportunities as the prime or lead contractor when we believe that our probability of win (PWin) is high and any investment required by Kratos is within our capital resource comfort level. We intend to partner and team with a large, traditional system integrator when our assessment of PWin is greater or required investment is beyond Kratos’ comfort level. Kratos’ primary business areas include virtualized ground systems for satellites and space vehicles including software for command & control (C2) and telemetry, tracking and control (TT&C), jet powered unmanned aerial drone systems, hypersonic vehicles and rocket systems, propulsion systems for drones, missiles, loitering munitions, supersonic systems, space craft and launch systems, C5ISR and microwave electronic products for missile, radar, missile defense, space, satellite, counter UAS, directed energy, communication and other systems, and virtual & augmented reality training systems for the warfighter. For more information, visit www.KratosDefense.com.
Notice Regarding Forward-Looking Statements
Certain statements in this press release may constitute “forward-looking statements” within the meaning of the Private Securities Litigation Reform Act of 1995. These forward-looking statements are made on the basis of the current beliefs, expectations and assumptions of the management of Kratos and are subject to significant risks and uncertainty. Investors are cautioned not to place undue reliance on any such forward-looking statements. All such forward-looking statements speak only as of the date they are made, and Kratos undertakes no obligation to update or revise these statements, whether as a result of new information, future events or otherwise. Although Kratos believes that the expectations reflected in these forward-looking statements are reasonable, these statements involve many risks and uncertainties that may cause actual results to differ materially from what may be expressed or implied in these forward-looking statements. For a further discussion of risks and uncertainties that could cause actual results to differ from those expressed in these forward-looking statements, as well as risks relating to the business of Kratos in general, see the risk disclosures in the Annual Report on Form 10-K of Kratos for the year ended December 31, 2023, and in subsequent reports on Forms 10-Q and 8-K and other filings made with the SEC by Kratos.
For more than 70 years, Vectrus has provided critical mission support for our customers’ toughest operational challenges. As a high-performing organization with exceptional talent, deep domain knowledge, a history of long-term customer relationships, and groundbreaking technical expertise, we deliver innovative, mission-matched solutions for our military and government customers worldwide. Whether it’s base operations support, supply chain and logistics, IT mission support, engineering and digital integration, security, or maintenance, repair and overhaul, our customers count on us for on-target solutions that increase efficiency, reduce costs, improve readiness, and strengthen national security. Vectrus is headquartered in Colorado Springs, Colo., and includes about 8,100 employees spanning 205 locations in 28 countries. In 2021, Vectrus generated sales of $1.8 billion. For more information, visit the company’s website at www.vectrus.com or connect with Vectrus on Facebook, Twitter, and LinkedIn.
Joe Gomes, CFA, Managing Director, Equity Research Analyst, Generalist , Noble Capital Markets, Inc.
Joshua Zoepfel, Research Associate, Noble Capital Markets, Inc.
Refer to the full report for the price target, fundamental analysis, and rating.
Round 2. American Industrial Partners (AIP) is selling another trance of VVX shares, this time 2.5 million shares with up to an additional 375,000 shares to be sold. As we noted in AIP September’s stock sale, we had expected AIP eventually to begin to sell off its stake, so we are not surprised with this additional sale. V2X will not receive any proceeds from the sale. The additional float is a positive for investors, in our view.
Ownership. Upon the completion of this offering, investment funds affiliated with AIP will beneficially own approximately 44.9% of V2X’s outstanding common stock, or 14,167,286 shares (or approximately 43.7% if the underwriters exercise their option to purchase additional shares in full).
Equity Research is available at no cost to Registered users of Channelchek. Not a Member? Click ‘Join’ to join the Channelchek Community. There is no cost to register, and we never collect credit card information.
This Company Sponsored Research is provided by Noble Capital Markets, Inc., a FINRA and S.E.C. registered broker-dealer (B/D).
*Analyst certification and important disclosures included in the full report. NOTE: investment decisions should not be based upon the content of this research summary. Proper due diligence is required before making any investment decision.
Patrick McCann, CFA, Research Analyst, Noble Capital Markets, Inc.
Michael Kupinski, Director of Research, Equity Research Analyst, Digital, Media & Technology , Noble Capital Markets, Inc.
Refer to the full report for the price target, fundamental analysis, and rating.
Q3 results. The company reported Q3 revenue of $22.2 million and an adj. EBITDA loss of $2.6 million. While the revenue was slightly below our estimate of $24.1 million, the adj. EBITDA loss was milder than our estimate of $3.4 million.
Gaining traction with Home Depot. Since announcing the partnership in July, the company’s presence in Home Depot locations has expanded to 100 stores. Additionally, SKYX products are available on Home Depot’s website. We anticipate more SKUs to become available both online and in stores soon, as a wide variety of SKYX products are expected to arrive from the company’s manufacturing partner, Ruee Appliances.
Equity Research is available at no cost to Registered users of Channelchek. Not a Member? Click ‘Join’ to join the Channelchek Community. There is no cost to register, and we never collect credit card information.
This Company Sponsored Research is provided by Noble Capital Markets, Inc., a FINRA and S.E.C. registered broker-dealer (B/D).
*Analyst certification and important disclosures included in the full report. NOTE: investment decisions should not be based upon the content of this research summary. Proper due diligence is required before making any investment decision.
Mark Reichman, Managing Director, Equity Research Analyst, Natural Resources, Noble Capital Markets, Inc.
Refer to the full report for the price target, fundamental analysis, and rating.
Third quarter financial results. FreightCar America generated third quarter adjusted net income to common stockholders of $2.455 million or $0.08 per share compared to $3.953 million or $0.13 per share during the prior year period. We had anticipated adjusted net income to common stockholders of $2.465 million or $0.07 per share. Average shares outstanding of 31.4 million were lower than our estimate of 34.5 million. Revenue and rail car deliveries increased to $113.3 million and 961, respectively, compared to $61.9 million and 503 during the third quarter of 2023. On a year-over-year basis, adjusted EBITDA increased to $10.9 million compared to $3.5 million during the prior year period and our estimate of $9.8 million. Free cash flow amounted to $5.7 million.
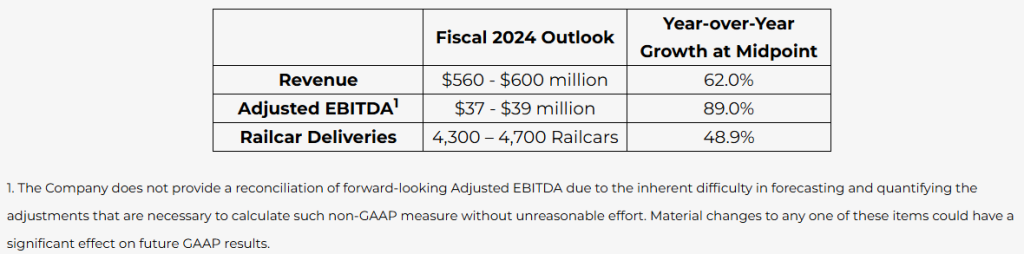
Full year 2024 corporate guidance. While guidance for revenue and rail car deliveries is unchanged, management narrowed its guidance range for EBITDA to $37.0 million to $39.0 million compared to previous expectations of $35.0 million to $39.0 million.
Equity Research is available at no cost to Registered users of Channelchek. Not a Member? Click ‘Join’ to join the Channelchek Community. There is no cost to register, and we never collect credit card information.
This Company Sponsored Research is provided by Noble Capital Markets, Inc., a FINRA and S.E.C. registered broker-dealer (B/D).
*Analyst certification and important disclosures included in the full report. NOTE: investment decisions should not be based upon the content of this research summary. Proper due diligence is required before making any investment decision.
Company delivers 83% year-over-year revenue growth with strong gross margin
Raises mid-point of full year Adjusted EBITDA guidance
CHICAGO, Nov. 12, 2024 (GLOBE NEWSWIRE) — FreightCar America, Inc. (NASDAQ: RAIL) (“FreightCar America” or the “Company”), a diversified manufacturer and supplier of railroad freight cars, railcar parts and components, today reported results for the third quarter ended September 30, 2024.
Third Quarter 2024 Highlights
Revenues of $113.3 million on 961 railcar deliveries, compared to revenues of $61.9 million on 503 railcar deliveries in the third quarter of 2023, up 83% and 91% respectively
Gross margin of 14.3% with gross profit of $16.2 million, compared to gross margin of 14.9% with gross profit of $9.2 million in the third quarter of 2023
Net loss of ($107.0) million, or ($3.57) per share and Adjusted net income of $7.3 million, or $0.08 per share, driven by a ($110.0) million non-cash loss on warrant liability due to a significant appreciation in share price
Adjusted EBITDA of $10.9 million, compared to Adjusted EBITDA of $3.5 million in the third quarter of 2023, up 211%
Ended the quarter with a backlog of 3,611 units valued at $372 million
“We again demonstrate the power of our disciplined approach to growth and operational excellence. Delivering another solid quarter, that continues the momentum for a record-setting year out of our operating facility. Our team has consistently followed through on our commitments, with robust product shipments and adaptable operating capabilities. This reinforces our ability to meet our customers’ needs while improving our gross margins, and further demonstrates the power of our value proposition. We continue to showcase our ability to secure business through innovative solutions, and our ease of doing business which has led to a consistent higher quality of earnings,” commented Nick Randall, President and Chief Executive Officer of FreightCar America.
Randall continued, “Our pipeline is invigorated, with consistent demand across a broad range of railcar types. As we head into the fourth quarter, we are well positioned to sustain this momentum through our differentiated offerings and unique market approach. Our commitment to innovation and operational flexibility sets us apart in the industry, ensuring that we deliver long-term value for our customers and shareholders.”
Fiscal Year 2024 Outlook
The Company has updated its outlook for fiscal year 2024 as follows:
Mike Riordan, Chief Financial Officer of FreightCar America, commented, “Given our strong order activity and delivery performance year to date, we are narrowing and raising the mid-point of our previously issued full-year EBITDA guidance to between $37 million and $39 million while reaffirming our previously stated revenue and delivery guidance. As we move forward, I am confident in our ability to achieve profitable growth and cash generation across the enterprise with an even stronger financial profile.”
Third Quarter 2024 Conference Call & Webcast Information
The Company will host a conference call and live webcast on Tuesday, November 12 at 11:00 a.m. (Eastern Time) to discuss its third quarter 2024 financial results. FreightCar America invites shareholders and other interested parties to listen to its financial results conference call via the following live and recorded methods:
Teleconference: Dial-in numbers for the live Conference Call are (877) 407-0789 or (201) 689-8562. Please call in at least 10 minutes prior to the start time of the call. An audio replay may be accessed at (844) 512-2921 or (412) 317-6671; Passcode: 13749627.
About FreightCar America
FreightCar America, headquartered in Chicago, Illinois, is a leading designer, producer and supplier of railroad freight cars, railcar parts and components. We also specialize in railcar repairs, complete railcar rebody services and railcar conversions that repurpose idled rail assets back into revenue service. Since 1901, our customers have trusted us to build quality railcars that are critical to economic growth and instrumental to the North American supply chain. To learn more about FreightCar America, visit www.freightcaramerica.com.
Forward-Looking Statements
This press release contains statements relating to our expected financial performance, financial condition, and/or future business prospects, events and/or plans that are “forward-looking statements” as defined under the Private Securities Litigation Reform Act of 1995. Forward-looking statements represent our estimates and assumptions only as of the date of this press release. Our actual results may differ materially from the results described in or anticipated by our forward-looking statements due to certain risks and uncertainties. These risks and uncertainties relate to, among other things, the cyclical nature of our business; adverse geopolitical, economic and market conditions, including inflation; material disruption in the movement of rail traffic for deliveries; fluctuating costs of raw materials including steel and aluminum; future changes in U.S. tax laws and regulations or interpretations thereof; delays in the delivery of raw materials; our ability to maintain relationships with our suppliers of railcar components; our reliance upon a small number of customers that represent a large percentage of our sales; the variable purchase patterns of our customers and the timing of completion, delivery and customer acceptance of orders; the highly competitive nature of our industry; the risk of lack of acceptance of our new railcar offerings, and other competitive factors. The factors listed above are not exhaustive. New factors emerge from time to time that may cause our business not to develop as we expect, and it is not possible for us to predict all of them. We expressly disclaim any duty to provide updates to any forward-looking statements made in this press release, whether as a result of new information, future events or otherwise.
Non-GAAP Financial Measures
This press release includes measures not derived in accordance with generally accepted accounting principles (“GAAP”), such as EBITDA, Adjusted EBITDA, Adjusted net income (loss) and Adjusted EPS. These non-GAAP measures should not be considered in isolation or as a substitute for any measure derived in accordance with GAAP and may also be inconsistent with similar measures presented by other companies. Reconciliations of these measures to the applicable most closely comparable GAAP measures, and reasons for the Company’s use of these measures, are presented in the attached pages.
The GEO Group, Inc. (NYSE: GEO) is a leading diversified government service provider, specializing in design, financing, development, and support services for secure facilities, processing centers, and community reentry centers in the United States, Australia, South Africa, and the United Kingdom. GEO’s diversified services include enhanced in-custody rehabilitation and post-release support through the award-winning GEO Continuum of Care®, secure transportation, electronic monitoring, community-based programs, and correctional health and mental health care. GEO’s worldwide operations include the ownership and/or delivery of support services for 103 facilities totaling approximately 83,000 beds, including idle facilities and projects under development, with a workforce of up to approximately 18,000 employees.
Joe Gomes, CFA, Managing Director, Equity Research Analyst, Generalist , Noble Capital Markets, Inc.
Joshua Zoepfel, Research Associate, Noble Capital Markets, Inc.
Refer to the full report for the price target, fundamental analysis, and rating.
Below Expectations. The GEO Group reported third quarter 2024 results below management’s and our expectations. Results in the quarter were driven by lower-than-expected revenues in the Electronic Monitoring and Supervision Services segment, reflecting reduced participant count. ICE populations have remained relatively flat over the past three quarters, although they are up y-o-y.
3Q24. GEO reported total revenues for the third quarter 2024 of $603.1 million compared to $602.8 million last year. We forecasted $612 million. Adjusted EBITDA was $118.6 million, flat with 3Q23. We were at $128 million. Net income for 3Q24 totaled $26.3 million, or $0.19 per diluted share, compared to $24.5 million, or $0.16 per diluted share, for 3Q23. Adjusted EPS was $0.21 per diluted share compared to $0.19 per diluted share for 3Q23. We had projected $0.25 and $0.26, respectively.
Equity Research is available at no cost to Registered users of Channelchek. Not a Member? Click ‘Join’ to join the Channelchek Community. There is no cost to register, and we never collect credit card information.
This Company Sponsored Research is provided by Noble Capital Markets, Inc., a FINRA and S.E.C. registered broker-dealer (B/D).
*Analyst certification and important disclosures included in the full report. NOTE: investment decisions should not be based upon the content of this research summary. Proper due diligence is required before making any investment decision.
Kratos Defense & Security Solutions, Inc. (NASDAQ:KTOS) develops and fields transformative, affordable technology, platforms, and systems for United States National Security related customers, allies, and commercial enterprises. Kratos is changing the way breakthrough technologies for these industries are rapidly brought to market through proven commercial and venture capital backed approaches, including proactive research, and streamlined development processes. At Kratos, affordability is a technology, and we specialize in unmanned systems, satellite communications, cyber security/warfare, microwave electronics, missile defense, hypersonic systems, training and combat systems and next generation turbo jet and turbo fan engine development. For more information go to www.kratosdefense.com.
Joe Gomes, CFA, Managing Director, Equity Research Analyst, Generalist , Noble Capital Markets, Inc.
Joshua Zoepfel, Research Associate, Noble Capital Markets, Inc.
Refer to the full report for the price target, fundamental analysis, and rating.
Environment. The ongoing generational recapitalization of strategic weapon systems, including strategic satellites, air defense radar, and missile systems, continues to be a catalyst for Kratos. Current world events are driving demand for Kratos products, including target drones, which are used to exercise and test air defense systems.
Strong Engine. Kratos’ turbine technologies and engine business is generating record results, including having a record opportunity pipeline with hypersonic supersonic cruise missiles, loitering munitions drones, and space systems, all being expected future growth areas.
Equity Research is available at no cost to Registered users of Channelchek. Not a Member? Click ‘Join’ to join the Channelchek Community. There is no cost to register, and we never collect credit card information.
This Research is provided by Noble Capital Markets, Inc., a FINRA and S.E.C. registered broker-dealer (B/D).
*Analyst certification and important disclosures included in the full report. NOTE: investment decisions should not be based upon the content of this research summary. Proper due diligence is required before making any investment decision.
Graham Corporation designs, manufactures and sells critical equipment for the energy, defense and chemical/petrochemical industries. The Company designs and manufactures custom-engineered ejectors, vacuum pumping systems, surface condensers and vacuum systems. It is a nuclear code accredited fabrication and specialty machining company. It supplies components used inside reactor vessels and outside containment vessels of nuclear power facilities. Its equipment is found in applications, such as metal refining, pulp and paper processing, water heating, refrigeration, desalination, food processing, pharmaceutical, heating, ventilating and air conditioning. For the defense industry, its equipment is used in nuclear propulsion power systems for the United States Navy. The Company’s products are used in a range of industrial process applications in energy markets, including petroleum refining, defense, chemical and petrochemical processing, power generation/alternative energy and other.
Joe Gomes, CFA, Managing Director, Equity Research Analyst, Generalist , Noble Capital Markets, Inc.
Joshua Zoepfel, Research Associate, Noble Capital Markets, Inc.
Refer to the full report for the price target, fundamental analysis, and rating.
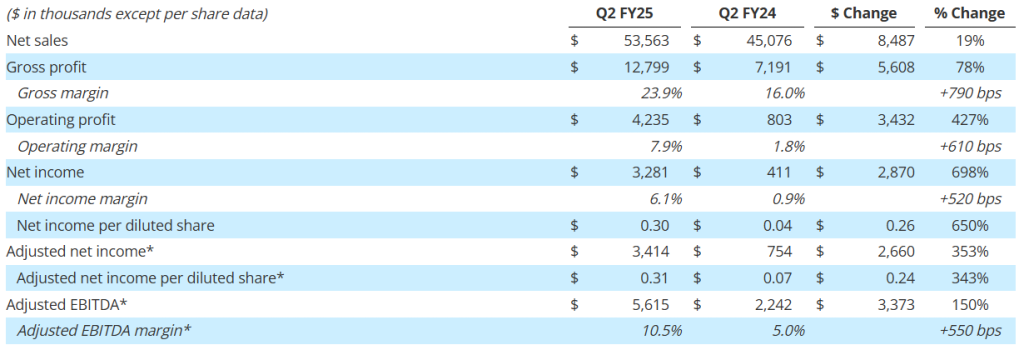
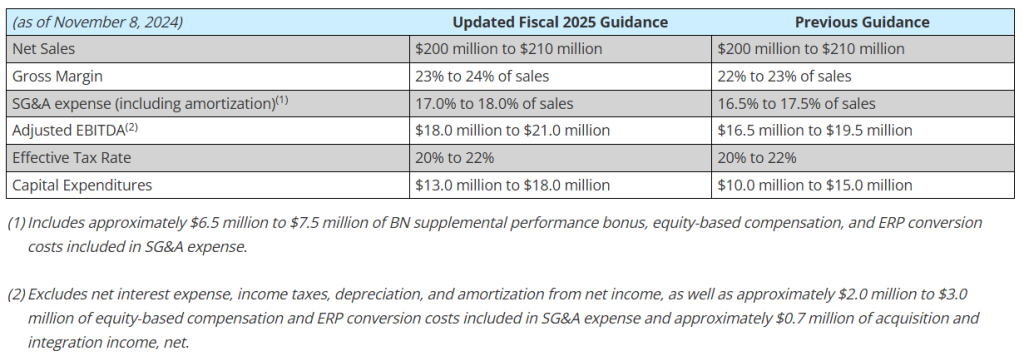
2Q25 Results. Graham’s 2Q25 results exceeded expectations. The Company reported strong sales growth in its markets, along with exceptional execution throughout the business, which drove meaningful margin expansion. The balance sheet remained stellar with $32.3 million of cash and no debt. Graham raised full year gross margin and adjusted EBITDA estimates. GHM shares reacted favorably to the news, rising 17% to $39.07.
Financials. Record quarterly revenue of $53.6 million, up 19% y-o-y. Defense revenue was up 23%, Chemical/Petro sales were up 23%, and Space revenue was up 23%. Gross margin improved 790 basis points to 23.9%, fueled by sales growth and execution. Adjusted EBITDA rose 150% to $5.6 million. Adjusted net income up 353% to $3.4 million, or $0.31.
Equity Research is available at no cost to Registered users of Channelchek. Not a Member? Click ‘Join’ to join the Channelchek Community. There is no cost to register, and we never collect credit card information.
This Company Sponsored Research is provided by Noble Capital Markets, Inc., a FINRA and S.E.C. registered broker-dealer (B/D).
*Analyst certification and important disclosures included in the full report. NOTE: investment decisions should not be based upon the content of this research summary. Proper due diligence is required before making any investment decision.
Key Points: – Shares of Geo Group and CoreCivic saw significant increases (over 7% and 8%, respectively) after the appointment of Tom Homan as “border czar,” – Homan’s appointment aligns with Trump’s strong stance on deportation and border security, so there is an anticipated increase in federal contracts for private detention companies – Renewed focus on immigration enforcement marks a a significant departure from the current adminstration’s stance
Private prison stocks surged Monday after President-elect Donald Trump appointed Tom Homan as “border czar,” sparking market optimism about a renewed focus on immigration enforcement. Shares of Geo Group and CoreCivic, both major players in the private detention sector, jumped over 7% and 8%, respectively, in response to the announcement. Homan, previously the head of Immigration and Customs Enforcement (ICE) under Trump’s first term, is known for his firm stance on deportation and border security. His appointment signals a potential increase in federal contracting for companies that provide detention services, specifically for ICE operations.
Trump’s announcement on Truth Social stated that Homan will be in charge of all deportation efforts, encompassing both land and maritime borders, with an emphasis on accelerating deportations. During a conservative conference in July, Homan declared he would lead the “biggest deportation force” in U.S. history if Trump was re-elected. This strong stance aligns with Trump’s previous immigration policies, which saw heightened demand for detention facilities, and is expected to bolster the private prison industry, including companies like Geo Group and CoreCivic, which have contracts with ICE and the U.S. Marshals Service.
The renewed focus on immigration enforcement under Trump is a significant shift from the current administration’s approach, which has limited federal use of private detention centers. This shift presents a potential growth opportunity for private prison companies, which struggled as President Biden worked to reduce private prison contracts. With Homan’s appointment, investors anticipate a resurgence of federal reliance on private detention services to meet increased demand for housing immigrant detainees.
Analysts have responded positively to this development, citing that Trump’s administration will likely “embrace” companies like Geo Group and CoreCivic. Isaac Boltansky, an analyst with BTIG, noted that private prison companies are positioned for growth under an immigration-focused administration, specifically due to likely contracting needs with the U.S. Marshals Service and ICE. Analysts expect Homan’s policies to generate consistent demand for private facilities, which could lead to stronger financial performance and increased market value for these companies.
Trump’s firm stance on deportation and his choice of Homan as border czar have energized investors. The expected rise in federal contracts signals a favorable outlook for private prison stocks. With immigration reform likely to be a focal point in Trump’s administration, CoreCivic and Geo Group could see sustained growth, especially as they support the expanded need for detention services. The private prison sector, long entangled with federal enforcement policies, now faces a potential resurgence as market trends align with anticipated shifts in government policy.
Revenue increased 19% to $53.6 million, driven by strength across its markets
Margin expansion fueled by sales growth and execution: Gross margin improved 790 basis points to 23.9% of sales, net margin increased 520 basis points to 6.1% of sales, and adjusted EBITDA1 margin expanded 550 basis points to 10.5% of sales
Net income per diluted share was $0.30 in the second quarter; adjusted net income per diluted share¹ was $0.31
Strong orders of $63.7 million, driven by demand from defense, space, and refining, resulted in a book-to-bill ratio of 1.2x and a record backlog of $407 million1
Strong balance sheet with no debt, $32.3 million in cash, and access to $43 million under its revolving credit facility at quarter end to support growth initiatives
Raised full year guidance for gross margin and adjusted EBITDA¹ to reflect improved profitability
BATAVIA, N.Y.–(BUSINESS WIRE)– Graham Corporation (NYSE: GHM) (“GHM” or the “Company”), a global leader in the design and manufacture of mission critical fluid, power, heat transfer and vacuum technologies for the defense, space, energy, and process industries, today reported financial results for its second quarter for the fiscal year ending March 31, 2025 (“fiscal 2025”). Results for the quarter include the P3 Technologies, LLC (“P3”) acquisition, which closed on November 9, 2023.
“Our team’s efforts to diversify and strengthen the business over the past few years are clearly yielding results, as shown by our record second-quarter performance,” commented Daniel J. Thoren, President and Chief Executive Officer. “Strong sales growth in our markets, along with exceptional execution throughout the business, have driven meaningful margin expansion. Our strategic emphasis on higher-margin opportunities and operational efficiencies has been a key driver of this success.”
Mr. Thoren added, “We are also focused on recruiting and retaining top talent, and have initiatives to enhance our supply chain, which helps us to improve performance and manage our risk. These initiatives, along with our strengthened balance sheet, robust orders2, and growing backlog2, we believe positions us well to sustain growth and profitability for the next several years. Importantly, we have raised our full-year adjusted EBITDA guidance, keeping us firmly on track to achieve our FY2027 target of low to mid-teen adjusted EBITDA margins.”
Second Quarter Fiscal 2025 Performance Review
(All comparisons are with the same prior-year period unless noted otherwise.)
*Graham believes that, when used in conjunction with measures prepared in accordance with U.S. generally accepted accounting principles, adjusted net income, adjusted net income per diluted share, adjusted EBITDA and adjusted EBITDA margin, which are non-GAAP measures, help in the understanding of its operating performance. See attached tables and other information on pages 10 and 11 for important disclosures regarding Graham’s use of these non-GAAP measures.
Record quarterly net sales of $53.6 million increased 19%, or $8.5 million, and included $0.9 million of incremental sales from P3. Sales to the defense market grew by $5.8 million, or 23%, driven by the expansion of new defense programs, the ramp-up of existing programs, and the timing of key project milestones. Additionally, higher refining and chemical/petrochemical sales contributed $2.2 million to the growth, largely reflecting the timing of capital improvement projects. Aftermarket sales to the refining, chemical/petrochemical, and defense markets of $9.8 million remained strong but were $1.5 million lower than the prior year record levels. See supplemental data for a further breakdown of sales by market and region.
Gross margin expanded 790 basis points to 23.9%, driven by the leverage on higher volume, a favorable mix toward higher margin projects, improved pricing, and better execution. Additionally, gross profit for the quarter benefited $0.4 million, or approximately 80 basis points, due to the $2.1 million grant from the BlueForge Alliance. This grant is reimbursing the Company for the cost of its defense welder training programs in Batavia and related equipment. Graham expects to realize similar gross profit benefits from the grant over the next two quarters, or for the remainder of fiscal 2025.
Selling, general and administrative expense (“SG&A”), including amortization, totaled $9.2 million, or 17.1% of sales, up $2.8 million compared with the prior year. This increase reflects the Company’s continued investments in its operations, employees, and technology. Notable contributors to the increase included $0.4 million of incremental costs related to P3, $0.3 million increase in the supplemental performance bonus for Barber-Nichols employees2, $0.2 million for enterprise resource planning (“ERP”) conversion costs at the Batavia facility, and $0.2 million of incremental research and development expenses. The remainder of the increase in SG&A was primarily related to increased costs associated with the Company’s growth and various other initiatives.
Included in other operating income for the second quarter of fiscal 2025 was a $0.6 million reversal of a previously accrued contingent earnout liability for P3. The reversal was not due to any lost orders, but rather a delayed project that extended beyond the earnout period.
Cash Management and Balance Sheet
Cash provided by operating activities totaled $22.6 million for the six month period ending September 30, 2024, nearly double the amount from the comparable period in fiscal 2024. As of September 30, 2024, cash and cash equivalents were $32.3 million, up from $16.9 million at the end of fiscal 2024.
Capital expenditures of $6.5 million for the first six months of fiscal 2025 were focused on capacity expansion and productivity improvements. The Company increased its expected fiscal 2025 capital expenditures to be in the range of $13.0 million to $18.0 million from its previous expectations of $10.0 million to $15.0 million due to a land purchase in Arvada, CO, and plans to build a liquid hydrogen and oxygen testing facility to support future growth and customer needs.
The Company had no debt outstanding at September 30, 2024 with $43 million available on its senior secured revolving credit facility after taking into account outstanding letters of credit.
Orders for the three-month period ended September 30, 2024, were $63.7 million, resulting in a book-to-bill ratio of 1.2x. Defense orders represented 48% of total orders and included a contract to supply the MK19 air turbine pump for the torpedo ejection system on the Columbia-class submarine. Space orders, which can fluctuate due to the timing of projects, saw a meaningful increase to $13.5 million, which included a contract for the cryogenic recirculation pump that provides thermal conditioning for upper stage engines on launch vehicles in space. Refining orders totaled $10.6 million and were driven by continued strength in aftermarket demand and the timing of new capital projects.
Backlog at quarter end reached a record $407.0 million, up 30% over the prior-year period and up 3% sequentially. Approximately 35% to 45% of orders currently in backlog are expected to be converted to sales in the next twelve months and another 30% to 40% is expected to convert to sales over the following year. The majority of orders expected to convert beyond twelve months are for the defense industry, specifically the U.S. Navy.
Fiscal 2025 Outlook
The Company’s outlook for 2025 was updated as follows:
Webcast and Conference Call
GHM’s management will host a conference call and live webcast on November 8, 2024 at 11:00 a.m. Eastern Time (“ET”) to review its financial results as well as its strategy and outlook. The review will be accompanied by a slide presentation, which will be made available immediately prior to the conference call on GHM’s investor relations website.
A question-and-answer session will follow the formal presentation. GHM’s conference call can be accessed by calling (201) 689-8560. Alternatively, the webcast can be monitored from the events section of GHM’s investor relations website.
A telephonic replay will be available from 3:00 p.m. ET today through Friday, November 15, 2024. To listen to the archived call, dial (412) 317-6671 and enter conference ID number 13749103 or access the webcast replay via the Company’s website at ir.grahamcorp.com, where a transcript will also be posted once available.
About Graham Corporation
Graham is a global leader in the design and manufacture of mission critical fluid, power, heat transfer and vacuum technologies for the defense, space, energy, and process industries. Graham Corporation and its family of global brands are built upon world-renowned engineering expertise in vacuum and heat transfer, cryogenic pumps, and turbomachinery technologies, as well as its responsive and flexible service and the unsurpassed quality customers have come to expect from the Company’s products and systems. Graham Corporation routinely posts news and other important information on its website, grahamcorp.com, where additional information on Graham Corporation and its businesses can be found.
Safe Harbor Regarding Forward Looking Statements
This news release contains forward-looking statements within the meaning of Section 27A of the Securities Act of 1933, as amended, and Section 21E of the Securities Exchange Act of 1934, as amended.
Forward-looking statements are subject to risks, uncertainties and assumptions and are identified by words such as “expects,” “future,” “outlook,” “anticipates,” “believes,” “could,” “guidance,” ”may”, “will,” “plan” and other similar words. All statements addressing operating performance, events, or developments that Graham Corporation expects or anticipates will occur in the future, including but not limited to, profitability of future projects and the business, its ability to deliver to plan, its ability to continue to strengthen relationships with customers in the defense industry, its ability to secure future projects and applications, expected expansion and growth opportunities, anticipated sales, revenues, adjusted EBITDA, adjusted EBITDA margins, capital expenditures and SG&A expenses, the timing of conversion of backlog to sales, orders, market presence, profit margins, tax rates, foreign sales operations, customer preferences, changes in market conditions in the industries in which it operates, changes in general economic conditions and customer behavior, forecasts regarding the timing and scope of the economic recovery in its markets, and its acquisition and growth strategy, are forward-looking statements. Because they are forward-looking, they should be evaluated in light of important risk factors and uncertainties. These risk factors and uncertainties are more fully described in Graham Corporation’s most recent Annual Report filed with the Securities and Exchange Commission (the “SEC”), included under the heading entitled “Risk Factors”, and in other reports filed with the SEC.
Should one or more of these risks or uncertainties materialize or should any of Graham Corporation’s underlying assumptions prove incorrect, actual results may vary materially from those currently anticipated. In addition, undue reliance should not be placed on Graham Corporation’s forward-looking statements. Except as required by law, Graham Corporation disclaims any obligation to update or publicly announce any revisions to any of the forward-looking statements contained in this news release.
Non-GAAP Financial Measures
Adjusted EBITDA is defined as consolidated net income (loss) before net interest expense, income taxes, depreciation, amortization, other acquisition related expenses, and other unusual/nonrecurring expenses. Adjusted EBITDA margin is defined as Adjusted EBITDA as a percentage of sales. Adjusted EBITDA and Adjusted EBITDA margin are not measures determined in accordance with generally accepted accounting principles in the United States, commonly known as GAAP. Nevertheless, Graham believes that providing non-GAAP information, such as Adjusted EBITDA and Adjusted EBITDA margin, is important for investors and other readers of Graham’s financial statements, as it is used as an analytical indicator by Graham’s management to better understand operating performance. Moreover, Graham’s credit facility also contains ratios based on Adjusted EBITDA. Because Adjusted EBITDA and Adjusted EBITDA margin are non-GAAP measures and are thus susceptible to varying calculations, Adjusted EBITDA, and Adjusted EBITDA margin, as presented, may not be directly comparable to other similarly titled measures used by other companies.
Adjusted net income and adjusted net income per diluted share are defined as net income and net income per diluted share as reported, adjusted for certain items and at a normalized tax rate. Adjusted net income and adjusted net income per diluted share are not measures determined in accordance with GAAP, and may not be comparable to the measures as used by other companies. Nevertheless, Graham believes that providing non-GAAP information, such as adjusted net income and adjusted net income per diluted share, is important for investors and other readers of the Company’s financial statements and assists in understanding the comparison of the current quarter’s and current fiscal year’s net income and net income per diluted share to the historical periods’ net income and net income per diluted share. Graham also believes that adjusted net income per share, which adds back intangible amortization expense related to acquisitions, provides a better representation of the cash earnings of the Company.
Forward-Looking Non-GAAP Measures
Forward-looking adjusted EBITDA and adjusted EBITDA margin are non-GAAP measures. The Company is unable to present a quantitative reconciliation of these forward-looking non-GAAP financial measures to their most directly comparable forward-looking GAAP financial measures because such information is not available, and management cannot reliably predict the necessary components of such GAAP measures without unreasonable effort largely because forecasting or predicting our future operating results is subject to many factors out of our control or not readily predictable. In addition, the Company believes that such reconciliations would imply a degree of precision that would be confusing or misleading to investors. The unavailable information could have a significant impact on the Company’s fiscal 2025 financial results. These non-GAAP financial measures are preliminary estimates and are subject to risks and uncertainties, including, among others, changes in connection with purchase accounting, quarter-end, and year-end adjustments. Any variation between the Company’s actual results and preliminary financial estimates set forth above may be material.
Key Performance Indicators
In addition to the foregoing non-GAAP measures, management uses the following key performance metrics to analyze and measure the Company’s financial performance and results of operations: orders, backlog, and book-to-bill ratio. Management uses orders and backlog as measures of current and future business and financial performance, and these may not be comparable with measures provided by other companies. Orders represent written communications received from customers requesting the Company to provide products and/or services. Backlog is defined as the total dollar value of net orders received for which revenue has not yet been recognized. Management believes tracking orders and backlog are useful as they often times are leading indicators of future performance. In accordance with industry practice, contracts may include provisions for cancellation, termination, or suspension at the discretion of the customer.
The book-to-bill ratio is an operational measure that management uses to track the growth prospects of the Company. The Company calculates the book-to-bill ratio for a given period as net orders divided by net sales.
Given that each of orders, backlog, and book-to-bill ratio are operational measures and that the Company’s methodology for calculating orders, backlog and book-to-bill ratio does not meet the definition of a non-GAAP measure, as that term is defined by the U.S. Securities and Exchange Commission, a quantitative reconciliation for each is not required or provided.
New facility will enable testing of liquid hydrogen (LH2), liquid oxygen (LOX) and liquid methane (LCH4)
BATAVIA, N.Y.–(BUSINESS WIRE)– Graham Corporation (NYSE: GHM) (“Graham” or “the Company”), a global leader in the design and manufacture of mission critical fluid, power, heat transfer and vacuum technologies for the defense, space, energy and process industries, announced today its plans to construct a state-of-the-art cryogenic propellant testing facility in Florida, near its P3 Technologies, LLC subsidiary. Leveraging Graham’s longstanding expertise in the cryogenic and space launch industries, this new facility will help to meet increasing demand for efficient, scalable testing solutions in key markets, including Space, Defense, New Energy, and potential applications in the medical field.
The facility will offer a cost-effective, timely alternative to existing testing centers, which often prioritize flagship programs and leave other critical programs with limited options. This new facility will enable liquid hydrogen (LH2), liquid oxygen (LOX), and liquid methane (LCH4) testing at pressurized, sub-cooled, or saturated conditions, and is ideally suited for testing pumps, components, fluid management systems, and combustion devices. By expanding Graham’s capabilities in cryogenic propellant testing, the Company aims to better support both current and future customer programs, adding agility and depth to its testing services in response to diverse and evolving program requirements.
“We believe this new testing facility will strengthen our position as a trusted partner by directly addressing customer needs for timely and cost-effective cryogenic propellant testing, complementing our existing capabilities and advancing the support we can offer current programs,” said Dan Thoren, Graham Corporation President and Chief Executive Officer. “This investment underscores our commitment to supporting both current and future customer programs through innovative and accessible testing solutions, while enhancing Graham’s role across the Space, Defense, and New Energy sectors.”
The project will be executed over the next year, with initial tests anticipated to begin by mid-2025. The facility is projected to achieve a cash payback period of approximately two to three years and deliver an internal rate of return exceeding 20%, representing a strategic investment in Graham’s future.
About Graham Corporation
Graham is a global leader in the design and manufacture of mission critical fluid, power, heat transfer and vacuum technologies for the defense, space, energy, and process industries. Graham Corporation and its family of global brands are built upon world-renowned engineering expertise in vacuum and heat transfer, cryogenic pumps, and turbomachinery technologies, as well as its responsive and flexible service and the unsurpassed quality customers have come to expect from the Company’s products and systems. Graham Corporation routinely posts news and other important information on its website, grahamcorp.com, where additional information on Graham Corporation and its businesses can be found.
Safe Harbor Regarding Forward Looking Statements
This news release contains forward-looking statements within the meaning of Section 27A of the Securities Act of 1933, as amended, and Section 21E of the Securities Exchange Act of 1934, as amended. Forward-looking statements are subject to risks, uncertainties and assumptions and are identified by words such as “can,” “expects,” “potential,” “will,” “plans,” “aims,” “believe,” “projected,” and other similar words. All statements addressing operating performance, events, or developments that Graham Corporation expects or anticipates will occur in the future, including but not limited to, the completion of the testing facility within the projected timeline, the Company’s ability to capitalize on the potential benefits of the new facility and timing to realize expected returns on investment, the estimated total market opportunity and the Company’s ability to capitalize on such market opportunity. Because they are forward-looking, they should be evaluated in light of important risk factors and uncertainties. These risk factors and uncertainties are more fully described in Graham Corporation’s most recent Annual Report filed with the Securities and Exchange Commission, including under the heading entitled “Risk Factors,” its quarterly reports on Form 10-Q, and other filings it makes with the Securities and Exchange Commission. Should one or more of these risks or uncertainties materialize or should any of Graham Corporation’s underlying assumptions prove incorrect, actual results may vary materially from those currently anticipated. In addition, undue reliance should not be placed on Graham Corporation’s forward-looking statements. Except as required by law, Graham Corporation disclaims any obligation to update or publicly announce any revisions to any of the forward-looking statements contained in this news release.