Release – Gevo Exceeds $1.5B in Long-Term Revenue Contracts with Signing of Trafigura


Gevo Exceeds $1.5B in Long-Term Revenue Contracts with Signing of Trafigura


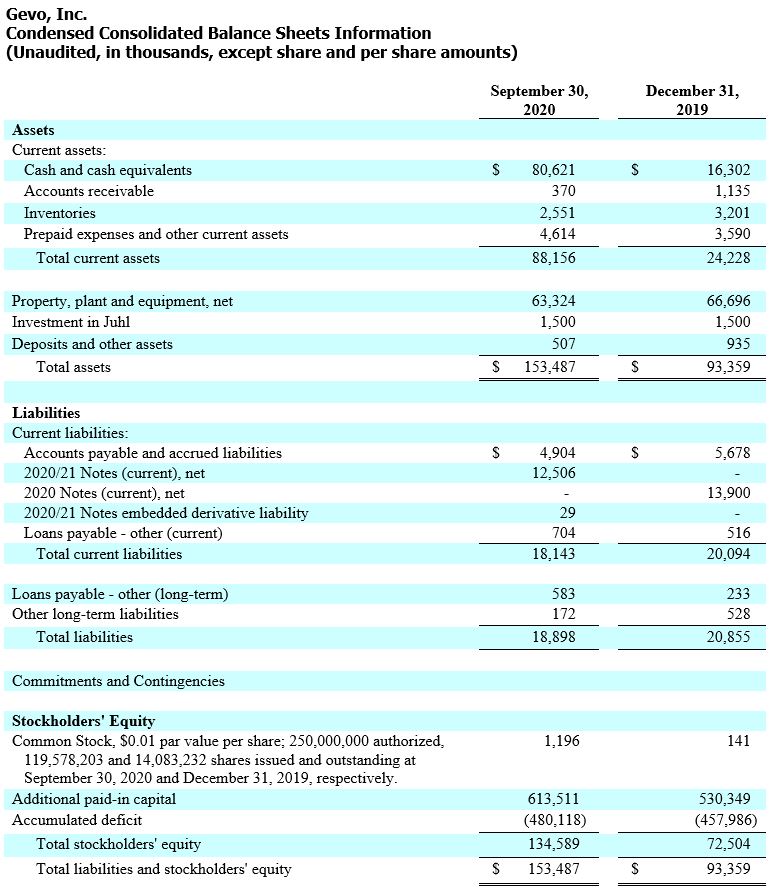
ENGLEWOOD, Colo., Aug. 20, 2020 (GLOBE NEWSWIRE) — Gevo, Inc. (NASDAQ: GEVO) announced today that it has entered into a binding Renewable Hydrocarbons Purchase and Sale Agreement, dated August 17, 2020 (the “Agreement”) with Trafigura Trading LLC, a wholly-owned subsidiary of Trafigura Group Pte Ltd (“Trafigura”). The Agreement is a long term, take or pay contract and is the largest contract in Gevo’s history. Trafigura is one of the world’s leading independent commodity trading companies with over $171B and over $54B in revenue and assets, respectively. Under this contract Trafigura is expected to take delivery of 25MPGY of renewable hydrocarbons, the majority of which is expected to be low-carbon premium gasoline with a smaller portion of the volume for sustainable aviation fuel (“SAF”), starting in 2023.

This commitment will support Trafigura’s efforts to develop the market for low-carbon fuels including low-carbon premium gasoline. The Agreement will also enable Trafigura to supply SAF to both US and international customers whose interest is growing in low-carbon jet fuel.

“This is our largest single contract to date, and with it, brings Gevo to over $1.5B of revenue in long term contracts when added to the other contracts we have in place. As drop-in fuels, Gevo’s renewable, very high-octane gasoline and SAF are a perfect fit with Trafigura’s existing fuels business and will allow them to integrate these low-carbon options seamlessly into their supply chains. We expect that our low-carbon fuels will enable certain of Trafigura’s customers to substantially lower their carbon footprint,” said Patrick Gruber, Chief Executive Officer of Gevo.

“Today’s agreement is a natural fit between our companies that will help drive the expansion of our renewable fuels product offering. We look forward to continuing to make a positive impact on the transition towards a low carbon economy,” said Robert Kreider, Head of the Strategic Management and Development Group, North America for Trafigura.

Having produced SAF and other hydrocarbons for nearly a decade, Gevo has a unique business system as it integrates sustainable agriculture and biorefining to produce SAF and low-carbon premium gasoline. For every gallon of low-carbon premium gasoline or SAF produced, Gevo produces about ten pounds of protein for the food chain, delivering substantially all of the nutritional value of corn to the food chain. The farmers who supply Gevo on average are capturing carbon, building up their soil with regenerative agriculture techniques. Utilizing a low-carbon ecosystem is vital to Gevo. Gevo began to use ISCC+ and Roundtable on Sustainable Biomaterials (RSB) certified corn for its Luverne, Minnesota facility while displacing fossil-derived power and heat with wind turbines and the upcoming implementation of biogas from dairy manure generated nearby. The execution of this circularity is unique and Gevos’ SAF is expected to have greenhouse gas profile reduction of 70% compared to the fossil-based jet fuel alternative. Eventually, it may be possible through soil carbon sequestration to completely decarbonize jet fuel through the use of Gevo’s SAF.

The Agreement is subject to certain conditions precedent, including Gevo acquiring a production facility to produce the renewable hydrocarbon products contemplated by the Agreement and closing a financing transaction for sufficient funds to acquire and retrofit the production facility contemplated by the Agreement. A copy of the Agreement between Trafigura and Gevo has been filed with the U.S. Securities and Exchange Commission on Form 8-K.

About Gevo

Gevo is commercializing the next generation of gasoline, jet fuel and diesel fuel with the potential to achieve zero carbon emissions, addressing the market need of reducing greenhouse gas emissions with sustainable alternatives. Gevo uses low-carbon renewable resource-based carbohydrates as raw materials and is in an advanced state of developing renewable electricity and renewable natural gas for use in production processes, resulting in low-carbon fuels with substantially reduced carbon intensity (the level of greenhouse gas emissions compared to standard petroleum fossil-based fuels across their lifecycle). Gevo’s products perform as well or better than traditional fossil-based fuels in infrastructure and engines, but with substantially reduced greenhouse gas emissions. In addition to addressing the problems of fuels, Gevo’s technology also enables certain plastics, such as polyester, to be made with more sustainable ingredients. Gevo’s ability to penetrate the growing low-carbon fuels market depends on the price of oil and the value of abating carbon emissions that would otherwise increase greenhouse gas emissions. Gevo believes that its proven, patented technology enabling the use of a variety of low-carbon sustainable feedstocks to produce price-competitive low carbon products such as gasoline components, jet fuel, and diesel fuel yields the potential to generate project and corporate returns that justify the build-out of a multi-billion-dollar business. Learn more at www.gevo.com.

Trafigura

Founded in 1993, Trafigura is one of the largest physical commodities trading groups in the world. Trafigura sources, stores, transports and delivers a range of raw materials (including oil and refined products and metals and minerals) to clients around the world. The trading business is supported by industrial and financial assets, including a majority ownership of global zinc and lead producer Nyrstar which has mining, smelting and other operations located in Europe, Americas and Australia; a significant shareholding in global oil products storage and distribution company Puma Energy; global terminals, warehousing and logistics operator Impala Terminals; Trafigura’s Mining Group; and Galena Asset Management. The Company is owned by around 700 of its 8,000 employees who work in 80 offices in 41 countries around the world. Trafigura has achieved substantial growth over recent years, growing revenue from USD12 billion in 2003 to USD171.5 billion in 2019. The Group has been connecting its customers to the global economy for more than two decades, growing prosperity by advancing trade. Visit: www.trafigura.com

Forward-Looking Statements

Certain statements in this press release may constitute “forward-looking statements” within the meaning of the Private Securities Litigation Reform Act of 1995. These forward-looking statements relate to a variety of matters, including, without limitation, statements related to the Agreement with Trafigura, Gevo’s ability to produce the products required by the Agreement, Gevo’s ability to raise the capital necessary to acquire and retrofit the production facility contemplated by the Agreement, Gevo’s ability to realize the full amount of the revenues under its agreements and other statements that are not purely statements of historical fact. These forward-looking statements are made on the basis of the current beliefs, expectations and assumptions of the management of Gevo and are subject to significant risks and uncertainty. Investors are cautioned not to place undue reliance on any such forward-looking statements. All such forward-looking statements speak only as of the date they are made, and Gevo undertakes no obligation to update or revise these statements, whether as a result of new information, future events or otherwise. Although Gevo believes that the expectations reflected in these forward-looking statements are reasonable, these statements involve many risks and uncertainties that may cause actual results to differ materially from what may be expressed or implied in these forward-looking statements. For a further discussion of risks and uncertainties that could cause actual results to differ from those expressed in these forward-looking statements, as well as risks relating to the business of Gevo in general, see the risk disclosures in the Annual Report on Form 10-K of Gevo for the year ended December 31, 2019 and in subsequent reports on Forms 10-Q and 8-K and other filings made with the U.S. Securities and Exchange Commission by Gevo.

Gevo Investor and Media Contact
720-647-9605

IR@gevo.com

Trafigura Media Contact
+41 (0) 22 592 4528
media@trafigura.com


Natural Gas Storage Imbalances and Higher prices


Natural Gas Fell Hard Through Spring – Are We Seeing the Turnaround?


Natural gas in storage ended the winter heating season near historical averages.  Then COVID-19 hit, and the demand for gas went away.  The result is that natural gas in storage for the lower 48 states is now higher than it has been for five years at this time of year.  The chart below shows that gas storage levels relative to trailing five-year averages, minimums, and maximums.


People tend to think of natural gas as a fuel used primarily for space heating.  With more people staying at home, it would reason that natural gas demand would be near historical levels if not higher.  In recent years, however, natural gas consumption has changed.  While gas demand among residential and commercial customers (the primary users of natural gas for space heating) has been steady, demand for natural gas to fuel electricity generations has grown.  Electricity generation now represents the largest use of natural gas.


In fact, the residential and commercial sectors, which tend to be associated with space heating, accounted for only 36% of U.S. natural gas demand, according to the Natural Gas Supply Association.  Twenty years ago, residential and commercial users consumed roughly half of natural gas consumption.  The implications are clear.  Natural gas demand has become more economically sensitive over time and is being hurt by the economic slowdown caused by COVID-19.


As one might expect, there is a direct correlation between natural gas in storage and natural gas prices.  As storage levels have risen in recent months, natural gas prices have fallen.  Natural gas prices began the winter around $2.75 per mcf and fell steadily to a level under $1.50 per mcf by June.


There is good news for natural gas prices.  The drop in natural gas prices has led to a response from drillers.  The number of rigs drilling for natural gas has dropped dramatically this spring.  As of August 24, 2020, there were only 69 natural gas rigs drilling.  That represents a 59% decline from a year ago.


The response has been a surge in natural gas prices in the last two weeks.  Once below $1.50 per mcf, the upcoming September futures contract is now above $2.40 per mcf.  The contract has risen $0.65 in the month of August alone.  Clearly, investors anticipate that the natural gas storage numbers are about to correct to more normal levels.

 Suggested  Content:

GEVO Chairman Interview

OPEC Forecast Lower Demand as Output Cuts Taper

Energy Sector in Rapidly Growing Indonesia

Expect Today’s Nuclear Technologies to Provide an Important Role in the Future of Energy


Each event in our popular Virtual Road Shows Series has maximum capacity of 100 investors online. To take part, listen to and perhaps get your questions answered, see which virtual investor meeting intrigues you here.


Sources:

https://crudeoilfacilitators.blogspot.com/2019/08/us-natural-gas-demand-is-at-record-and.html, Scott DiSavino and Stephanie Kelly, Reuters, August 8, 2019

https://www.bicmagazine.com/industry/natgas-lng/u-s-henry-hub-natural-gas-spot-prices-reached-record-lows-in/, BIC Magazine, July 13, 2020

https://www.eia.gov/naturalgas/weekly/#tabs-rigs-2, EIA, August 12, 2020

Natural Gas Has a Sizeable Energy Role that is Waning


Falling Renewable Costs Could Strand Up to $1 Trillion of Natural Gas Assets


Ten years ago, the American Gas Association declared natural gas to be the bridge to a clean energy future.  Natural gas is the cleanest burning of all carbon-based fuels.  With new environmental restrictions pushing coal and oil out of the picture and renewable energy sources not yet economically competitive, natural gas was in a good position to fill the gap.  Projections around 2015 show that analysts expected coal consumption to fall dramatically, with natural gas consumption soaring to replace coal’s place.


Fast forward five years, and we see that coal has indeed lost market share.  Coal consumption has fallen from 40% ten years ago to a current level of 11%.  Natural gas has picked up much of this market share, rising from 25% to 32%.  However, renewable energy sources, notably wind and solar, have grown faster than anticipated and now represent 11% of all energy consumption, a level equal to coal.


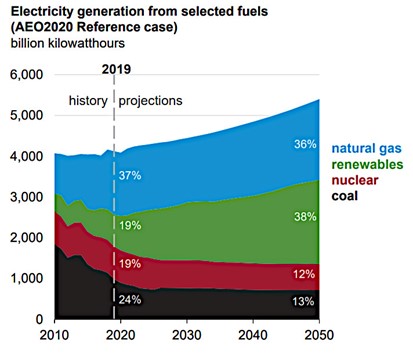
The change in consumption patterns can best be explained by looking at electric generation sources.  Coal, which once accounted for half of all power production, now represents only 24%.  Natural gas, on the other hand, has increased from a 25% market share to 37% of all power generated.  However, this trend shows signs of ending.  The chart below from the U.S. Energy Information Administration shows that analysts expect coal and nuclear to continue to decline, but that it will be renewable energy, not natural gas, that grabs market share in the next few years.  Forecasts even call for natural gas’s market share to show a decline.


The case for natural gas as a key component of power generation is simple.  In addition to being more economically friendly than other carbon fuels, natural gas works well in smaller, simple-cycle, turbine power plants that can economically serve peak power demand.  These plants may only run a few hours a day but can be started up and shut down at little cost, unlike traditional baseload plants.  This is important because renewable wind and solar plants are inconsistent and do not serve peak power demand well.


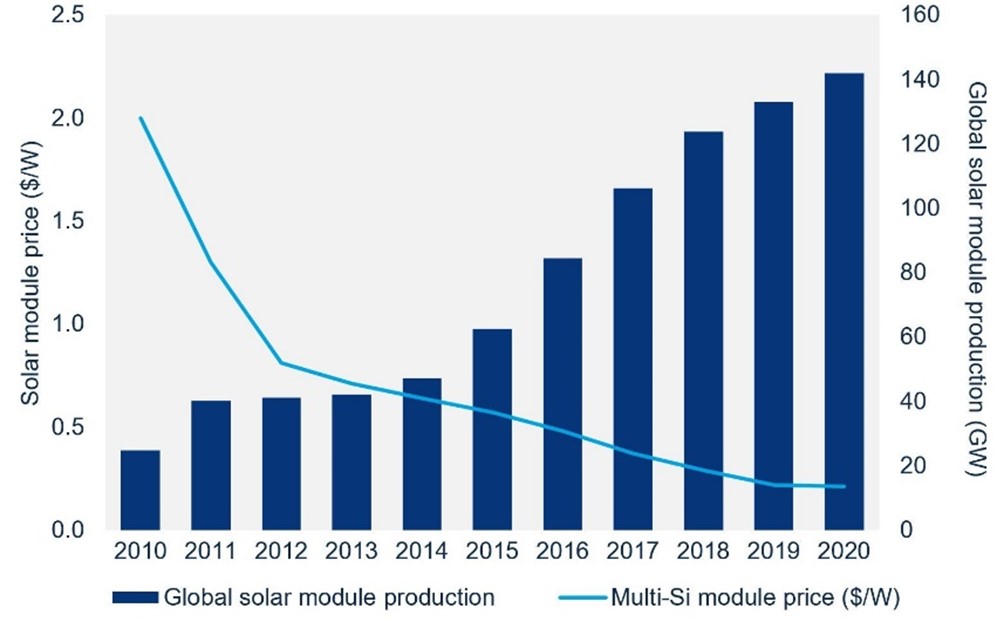
Still, investing in new natural gas power plants is risky.  A gas power plant will produce electricity for decades.  Natural gas pipeline and storage units last even longer.  If renewable energy continues to become more cost-effective as it grows and the ability to store energy improves, natural gas assets could become stranded. Sean Kidney, CEO of the Climate Bonds Initiate, claims, “The window to do gas unabated has closed.” A report by Rethink Energy estimates that investments in natural gas power generation could lead to $1 trillion in losses by 2050, a scary thought for regulated utilities that are granted limited returns on their investments.

We expect natural gas to remain an important energy source for the foreseeable future.  Energy plant investors typically want to invest in multiple energy sources and not rely on one energy source.  The energy source that is cheapest today may not be the cheapest tomorrow—technology changes,  environmental regulations change, the cost of production changes.  That said, signs are beginning to point towards a diminished role for natural gas going forward.


Suggested Reading:


Virtual Power Plants and Tesla Car Batteries

 EIA Reports the Largest Weekly U.S. Crude Decline

Exploration
and Production Second Quarter Review and Outlook


Each event in our popular Virtual Road Shows Series has maximum capacity of 100 investors online. To take part, listen to and perhaps get your questions answered, see which virtual investor meeting intrigues you here.
 

Sources:

https://www.earthisland.org/journal/index.php/magazine/entry/natural_gas_a_bridge_to_nowhere/, Jennifer Krill, Earth Island Journal, Spring 2015

https://ourworld.unu.edu/en/us-natural-gas-revolution-is-a-bridge-to-nowhere, Belinda Waymouth, Our World, September 24, 2014

https://www.power-technology.com/features/bridge-to-nowhere-does-natural-gas-energy-have-a-future/, Heidi Vella, Power Technology, July 6, 2020

https://www.petroleum-economist.com/articles/low-carbon-energy/energy-transition/2020/gas-a-bridge-to-nowhere, Beatrice Bedeschi, Petroleum Economist, February 13, 2020

https://energyinnovation.org/wp-content/uploads/2020/03/Natural-Gas_A-Bridge-to-Climate-Breakdown.pdf, Lila Holzman, Mike O’Boyle and Daniel Stewart, As You Sow, March 2020

https://www.eia.gov/energyexplained/us-energy-facts/, U.S. Energy Information Administration, June 2020

Photo: Photographer,Michael Lewinski, Harquahala Natural Gas Generating Facility, Tonopah, AZ


Energy Services of America (ESOA) – In Line Quarter. Signs of Recovery Ahead.

Tuesday, August 18, 2020

Energy Services of America (ESOA)

In Line Quarter. Signs of Recovery Ahead.

Energy Services of America Corporation is engaged in providing contracting services for energy-related companies. The company is primarily engaged in the construction, replacement, and repair of natural gas pipelines and storage facilities for utility companies and private natural gas companies. It services the gas, petroleum, power, chemical and automotive industries, and does incidental work such as water and sewer projects. Energy Service’s other services include liquid pipeline construction, pump station construction, production facility construction, water and sewer pipeline installations, various maintenance and repair services and other services related to pipeline construction.

Poe Fratt, Senior Research Analyst, Noble Capital Markets, Inc.

Refer to the full report for the price target, fundamental analysis, and rating.

    Fiscal 3Q2020 (June) Quarter in line with expectations. Higher revenue was offset higher operating costs so gross profit of $2.8 million and adjusted EBITDA of $1.4 million were in line.

    Fine-tuning FY2020 EBITDA. We are moving our FY2020 EBITDA estimate to $3.4 million from $3.5 million to reflect fiscal 3Q2020 operating results and more moderate gross margin assumptions due to project cancellations/delays.

    Uncertain outlook and lower backlog, but signs of recovery.  Backlog dropped to was $69.8 million in 3Q2020 from $92.1 million in 2Q2020 due to the shifts in project timing. Current bidding activity continues and adding projects seems likely, but the COVID-19 uncertainty and low energy prices remain concerning and project might …


    Click to get the full report

This Company Sponsored Research is provided by Noble Capital Markets, Inc., a FINRA and S.E.C. registered broker-dealer (B/D).

*Analyst
certification and important disclosures included in the full report. 
NOTE: investment decisions should not be based upon the content of
this research summary.  Proper due diligence is required before
making any investment decision.
 

Eliminating the Con-Fusion


Expect Today’s Nuclear Technologies to Provide an Important Role in the Future of Energy

The International Thermal Experimental Reactor (ITER) Project is the first large-scale nuclear fusion project and is being financed by the European Union, United Kingdom, China, India, Russia, Japan, South Korea, and the United States. The $25 billion project entered its five-year assembly phase in July and aims to produce sustainable fusion energy on a commercial scale. Unlike nuclear fission, a technology used for conventional nuclear reactors, nuclear fusion produces four times as much energy without the risk of meltdowns and little waste.  

Nuclear Fusion Versus Fission

Fusion plants can be fueled by hydrogen and do not rely on radioactive materials. The illustration below, sourced from an infographic sourced from the Office of Nuclear Energy, summarizes some key differences.

Source: U.S. Department of Energy

Despite many years of research, making nuclear fusion commercially viable has been a technical challenge given the difficulty in reliably generating enough energy from the reactions.

Shrinking the Carbon-Free Footprint

The ITER project has inspired private enterprises, both large and small, to explore fusion generation technology on a smaller scale. Last week, Chevron Corp. announced an investment in Zap Energy Inc., joining Italy’s ENI and Norway’s Equinor who have also announced investments in nuclear fusion startups to reduce their carbon footprint. Meanwhile, conventional nuclear technology is advancing to overcome its chief objections, namely, preventing the risk of a meltdown and solutions to reduce or dispose of the radioactive spent fuel. Policymakers are reviewing the feasibility of microreactors and small modular reactors that can generate 20 megawatts to 300 megawatts of electricity. Large scale nuclear reactors can generate 300 megawatts to 1,000 megawatts of power. Nuclear is a carbon free source of electricity and, in terms of power density as measured by watts per square meter, has a smaller footprint than some renewables, including wind farms. According to the Nuclear Energy Institute, wind farms require up to 360 times as much land area to produce the same amount of electricity as a nuclear facility, while solar photovoltaic facilities require up to 75 times the land area.

The Take-Away

The nuclear power industry offers significant potential for innovation and could be a critical part of the solution to curb carbon dioxide emissions and global warming. Big ideas, like the International Thermal Experimental Reactor, may help in advancing nuclear technology as private enterprise grasps for pragmatic solutions for both nuclear fission and fusion. Public policy is also crucial to leveling the playing field. For example, coal-fired and natural gas-fired generation facilities that emit greenhouse gases are not penalized, while nuclear power facilities are not rewarded for producing carbon-free electricity.  A carbon tax, that puts a price on emissions, or a cap-and-trade program are ideas that may help level the playing field among alternative sources of power generation. Rather than going all in on renewables, the public interest may be better served by exploring alternatives and promoting innovation among all sources of energy.  


Suggested Reading:

Carbon-Free
Nuclear Energy Expectations Through 2050

Is M&A Picking up
in Energy Sector

Exploration and
Production Second Quarter Review and Outlook

Each event in our popular Virtual Road Shows Series has maximum capacity of 100 investors online. To take part, listen to and perhaps get your questions answered, see which virtual investor meeting intrigues you here.


Sources:

ITER,
The World’s Largest Nuclear Fusion Project: A Big Step Forward
, Forbes, Ariel Cohen, August 7, 2020.

World’s
Largest Nuclear Fusion Project Begins Assembly in France
, The Guardian, Damian Carrington, July 28, 2020.

A
Giant Fusion Reactor Hotter than the Sun to Provide Unlimited Clean Energy
Without Waste Marks Milestone
, Good News Network, Andy Corbley, August 10, 2020.

ITER: World’s
Largest Nuclear Fusion Project Begins Assembly
, BBC, Paul Rincon, July 28, 2020.

Fission
and Fusion: What is the Difference, Infographic
, Office of Nuclear Energy, U.S. Department of Energy, May 7, 2018.

INFOGRAPHIC:
The Flexibility of Nuclear
, Office of Nuclear Energy, U.S. Department of Energy.

Land
Needs for Wind, Solar Dwarf Nuclear Plant’s Footprint
, Nuclear Energy Institute, July 9, 2015.

2019 Advanced
Nuclear Map: Getting to Zero Emissions by 2050
, Third Way, John Milko, Jackie Kempfner and Todd Allen, October 17, 2019.

Oil
Major Chevron Invests in Nuclear Fusion Startup Zap Energy
, Reuters, August 12, 2020.

Picture: ITER Site, tokamak building

InPlay Oil (IPOOF)(IPO:CA) – Better-than-expected results and new credit facility may mean stock has bottomed out

Monday, August 17, 2020

InPlay Oil (IPOOF)(IPO:CA)

Better-than-expected results and new credit facility may mean stock has bottomed out

As of April 24, 2020, Noble Capital Markets research on InPlay Oil is published under ticker symbols (IPOOF and IPO:CA). The price target is in USD and based on ticker symbol IPOOF. Research reports dated prior to April 24, 2020 may not follow these guidelines and could account for a variance in the price target. InPlay Oil is a junior oil and gas exploration and production company with operations in Alberta focused on light oil production. The company operates long-lived, low-decline properties with drilling development and enhanced oil recovery potential as well as undeveloped lands with exploration possibilities. The common shares of InPlay trade on the Toronto Stock Exchange under the symbol IPO and the OTCQZ Exchange under the symbol IPOOF.

Michael Heim, Senior Research Analyst, Noble Capital Markets, Inc.

Refer to the full report for the price target, fundamental analysis, and rating.

    Second quarter results beat our lowered expectations. The drop off in production stemming from the curtailment and shut in of wells was not as great as expected. The company was able to lower production costs per unit and SG&A costs by scaling back discretionary spending.

    Oil prices have rebounded quicker than expected, and the company is responding. Oil prices rebounded to $40/bbl well ahead of expectations. Management indicated it will begin drilling again in the third quarter and expects to reach pre-COVID production levels by the third quarter …


    Click to get the full report

This Company Sponsored Research is provided by Noble Capital Markets, Inc., a FINRA and S.E.C. registered broker-dealer (B/D).

*Analyst
certification and important disclosures included in the full report. 
NOTE: investment decisions should not be based upon the content of
this research summary.  Proper due diligence is required before
making any investment decision.
 

Release – InPlay Oil Corp. Announces BDC Term Facility and Provides Second Quarter 2020 Financial and Operating Results

InPlay Oil Corp. Announces BDC Term Facility and Provides Second Quarter 2020 Financial and Operating Results


August 14, 2020 – Calgary Alberta – InPlay Oil Corp. (TSX: IPO) (OTCQX: IPOOF) (“InPlay” or the “Company”) is pleased to announce that it has entered into a non-binding term sheet (the “BDC Term Sheet”) with the Business Development Bank of Canada (“BDC”), in partnership with our syndicate of lenders, for a non-revolving term facility of up to $25 million with a four year term. The Company is also announcing its financial and operating results for the second quarter. InPlay’s condensed unaudited interim financial statements and notes, as well as management’s discussion and analysis (“MD&A”) for the three and six months ended June 30, 2020 will be available at www.sedar.com and our website at www.inplayoil.com.


Subsequent to the end of the second quarter, on July 15, 2020 the Company announced the completion of its Credit Facility redetermination at $65 million, maturing on May 31, 2021. On July 30, 2020 the Company entered into the BDC Term Sheet with the BDC under their Business Credit Availability Program (“BCAP”) which, subject to the entering into of definitive agreements, will provide the Company with a non-revolving $25 million, second lien, four year term facility (the “BDC Term Facility”). The Export Development Canada (“EDC”) and BDC programs were initially announced to provide pre-COVID-19 financially viable companies with additional liquidity to continue operations and development activity through the pandemic and allow them to return to preCOVID-19 operating levels in a time frame that can be managed with improved crude oil and commodity pricing.


The BDC Term Facility will provide InPlay with significant additional long term liquidity at reasonable interest rates to withstand the impacts of the COVID-19 pandemic and allow the Company to pursue development opportunities that generate long-term, sustainable net asset value per share growth for our shareholders into the recovery phase. InPlay quickly assessed the program when first announced and were early in initiating discussions with both BDC and Export Development Bank of Canada (“EDC”) regarding their programs. InPlay is pleased to become one of the first companies to be approved for a term sheet through the program, validating our financial strength while also confirming the comments made in our April and May 2020 press releases stating we believed based on the criteria put forward that InPlay was a financially viable Company prior to the COVID19 pandemic. The Company appreciates the support of the BDC and our syndicate of lenders to make this partnership possible.


As a result of crude oil demand improving from the lows seen in April, combined with the reductions in production from OPEC+ and production curtailments by producers, commodity prices have improved earlier than initially expected. Since the end of the second quarter the Company has begun the process of bringing back on our operated shut-in and curtailed production as well as starting to service wells that have been down as long as they have payouts of approximately six months. We anticipate production returning to close to our production capacity levels in late August with average September production forecasted to approximate pre-COVID production rates, including oil inventory of approximately 28,000 to 30,000 barrels which will opportunistically be sold into the spot market prior to year-end.


InPlay has been extremely successful in obtaining approved applications under the Alberta government’s Site Rehabilitation Program (“SRP”). The Company’s diligence in submitting these applications quickly as well as our detailed grant requests has resulted in greater than $1.0 million being received from the program to date. InPlay was allocated a significantly higher portion of the total amount of this program in comparison to our percentage of Alberta oil and gas production. The Company also expects to receive additional grants in subsequent phases of the SRP. As these programs are completed, these amounts will be reflected as a reduction in our decommissioning obligation liability. We thank our operations team and key service providers in their diligence and attentiveness to this program which resulted in well received applications and significant benefit from the program.


Second Quarter 2020 Financial & Operations Results

InPlay was proactive and promptly reacted to the dramatic and unprecedented drop in crude oil pricing in March by immediately suspending its 2020 development capital program, quickly implementing cost cutting initiatives in the field and office and initiating temporary production curtailments and shut-ins resulting in production declines to approximately 65% of estimated capacity. This resulted in average production of 3,154 boe/d in the second quarter of 2020 compared to 5,179 boe/d in the second quarter of 2019.


The Company’s operations are well positioned to make adjustments when facing these extreme volatile commodity price environments. The Company looked at all wells in detail taking into account fixed and variable costs, safety concerns, as well as shut-in and startup costs to determine which wells could be temporarily shut in or curtailed and fully restarted with minimal incremental costs. Further initiatives were also undertaken to reduce costs and scale back discretionary expenditures which allowed the Company to achieve lower operating and G&A costs during the quarter of $4.1 and $0.8 million ($14.18 per boe and $2.73 per boe) respectively compared to $6.7 and $1.8 million ($14.32 per boe and $3.81 per boe) in the second quarter of 2019. This is a significant achievement given the presence of fixed costs being incurred over a significantly lower production base. Improved commodity prices began to materialize in June and allowed us to start bringing on curtailed production easily meeting our sales nominations while continuing to fill inventory storage levels. As of June 30, 2020 approximately 24,000 barrels of oil were in storage allowing the Company to sell this production in the future at advantageous pricing levels.


The commodity price collapse due to demand destruction as a result of the COVID-19 crisis heavily impacted financial results for the second quarter of 2020. Oil prices were significantly lower over the second quarter with WTI prices averaging $27.85 USD/bbl, compared to $59.84 USD/bbl for the second quarter of 2019. Revenue was most affected in April at the apex of the crisis when we had to meet sales volumes that were previously nominated at the beginning of March prior to the crisis. This resulted in a net realized price of only $17.06 CDN/bbl for our crude during the month of April. Reacting to the distressed crude oil pricing environment, InPlay began reducing sales nominations in May and June. NGL prices also continued to remain at multi-year lows over the quarter as the Company’s realized NGL prices averaged $11.66 CDN/bbl in the second quarter of 2020 compared to $19.67 CDN/bbl over the same period in 2019, largely due to the benchmarking of these prices on low WTI pricing during the quarter and continued weakness in propane and butane pricing. With these dramatic reductions in commodity prices during the second quarter of 2020, InPlay incurred an adjusted funds flow (“AFF”) deficit of $1.3 million over the quarter.


The Company’s COVID-19 response also included multiple cost cutting measures highlighted by a 20 percent reduction in field and office salaries as wells as cost reductions in all areas of our operations. InPlay has also taken advantage of certain provincial and federal government programs in response to the COVID-19 crisis. The Company received approximately $0.3 million under the Canada Emergency Wage Subsidy (“CEWS”) during the second quarter of 2020. These cost cutting measures and our curtailed operations resulted in savings of approximately $3.4 million in the second quarter of 2020 compared to our original January 2020 budget.


Financial and Operating Results:


Outlook

The Company is cautiously optimistic for the remainder of 2020 and expects that commodity pricing will start gaining momentum in 2021 and beyond as the lack of capital spending on oil and gas projects on a worldwide scale will lead to declining production and ultimately result in demand exceeding supply. Commodity prices have improved quicker than originally anticipated and all cost structures have decreased as a result of internal cost cutting measures and external market conditions. Success in obtaining additional long term financing with the BDC Term Facility is expected to provide us with ample liquidity to get through this difficult period and the potential to resume our development capital program prior to the end of 2020. At current commodity prices and with lower cost structures, the Company has the ability to commence a capital program on projects that are budgeted to payout in 1 to 1.5 years, based on comparable well performance. Subject to the anticipated closing of the BDC Term Facility, we are currently working on plans to resume our 2020 capital program, depending on pricing, in the fourth quarter of 2020. The Company expects to provide capital guidance for the remainder of 2020 in the near future.


InPlay remains steadfast on managing the current crisis, daily monitoring of our rapidly changing environment and prudently reacting to changing circumstances. Management will continue to take action with the objective of diligently managing costs, preserving liquidity and will make capital spending decisions considering commodity prices and liquidity levels.


We thank our employees and all of our service providers for their commitments and efforts in this unprecedented time as well as our directors for their ongoing commitment and dedication. Finally, we thank all of our shareholders and lending partners for their continued interest and support.


For further information please contact:

Doug Bartole
President and Chief Executive Officer
InPlay Oil Corp.
Telephone: (587) 955-0632

Darren Dittmer
Chief Financial Officer
InPlay Oil Corp.
Telephone: (587) 955-0634


Reader Advisories


Non-GAAP Financial Measures

Included in this press release are references to the terms “adjusted funds flow”, “adjusted funds flow per share, basic and diluted”, “adjusted funds flow per boe”, “operating income”, “operating netback per boe” and “operating income profit margin”. Management believes these measures are helpful supplementary measures of financial and operating performance and provide users with similar, but potentially not comparable, information that is commonly used by other oil and natural gas companies. These terms do not have any standardized meaning prescribed by GAAP and should not be considered an alternative to, or more meaningful than, “funds flow”, “profit (loss) before taxes”, “profit (loss) and comprehensive income (loss)” or assets and liabilities as determined in accordance with GAAP as a measure of the Company’s performance and financial position.


InPlay uses “adjusted funds flow”, “adjusted funds flow per share, basic and diluted” and “adjusted funds flow per boe” as key performance indicators. Adjusted funds flow should not be considered as an alternative to or more meaningful than funds flow as determined in accordance with GAAP as an indicator of the Company’s performance. InPlay’s determination of adjusted funds flow may not be comparable to that reported by other companies. Adjusted funds flow is calculated by adjusting for decommissioning expenditures from funds flow. This item is adjusted from funds flow as decommissioning expenditures are incurred on a discretionary and irregular basis and are primarily incurred on previous operating assets, making the exclusion of this item relevant in Management’s view to the reader in the evaluation of InPlay’s operating performance. Adjusted funds flow per share, basic and diluted is calculated by the Company as adjusted funds flow divided by the weighted average number of common shares outstanding for the respective period. Management considers adjusted funds flow per share, basic and diluted an important measure to evaluate its operational performance as it demonstrates its recurring operating cash flow generated attributable to each share. Adjusted funds flow per boe is calculated by the Company as adjusted funds flow divided by production for the respective period. Management considers adjusted funds flow per boe an important measure to evaluate its operational performance as it demonstrates its recurring operating cash flow generated per unit of production. For a detailed description of InPlay’s method of calculating adjusted funds flow, adjusted funds flow per share, basic and diluted and adjusted funds flow per boe and their reconciliation to the nearest GAAP term, refer to the section “Non-GAAP Measures” in the Company’s MD&A filed on SEDAR.


InPlay also uses “operating income”, “operating netback per boe” and “operating income profit margin” as key performance indicators. Operating income should not be considered as an alternative to or more meaningful than net income as determined in accordance with GAAP as an indicator of the Company’s performance. Operating income is calculated by the Company as oil and natural gas sales less royalties, operating expenses and transportation expenses and is a measure of the profitability of operations before administrative, share-based compensation, financing and other noncash items. Management considers operating income an important measure to evaluate its operational performance as it demonstrates its field level profitability. Operating netback per boe is calculated by the Company as operating income divided by average production for the respective period. Management considers operating netback per boe an important measure to evaluate its operational performance as it demonstrates its field level profitability per unit of production. Operating income profit margin is calculated by the Company as operating income as a percentage of oil and natural gas sales. Management considers operating income profit margin an important measure to evaluate its operational performance as it demonstrates how efficiently the Company generates field level profits from its sales revenue. For a detailed description of InPlay’s method of the calculation of operating income, operating netback per boe and operating income profit margin and their reconciliation to the nearest GAAP term, refer to the section “Non-GAAP Measures” in the Company’s MD&A filed on SEDAR.


Forward-Looking Information and Statements

This news release contains certain forward–looking information and statements within the meaning of applicable securities laws. The use of any of the words “expect”, “anticipate”, “continue”, “estimate”, “may”, “will”, “project”, “should”, “believe”, “plans”, “intends” “forecast” and similar expressions are intended to identify forward-looking information or statements. In particular, but without limiting the foregoing, this news release contains forward-looking information and statements pertaining to the following: the anticipated entering into of definitive documents and closing of the BDC Term Facility; production estimates including timing of production restart plants and the impact thereof; the estimated time to payout of wells; the potential for and extent of planned curtailments or shut-ins and the potential timing and impact thereof; expectations regarding future commodity prices; future liquidity and financial capacity; the potential resumption of our development capital program prior to the end of 2020; future results from operations and operating metrics and capital guidance; future costs (including retention of cost reductions post COVID-19), expenses and royalty rates; future interest costs; the exchange rate between the $US and $Cdn; expectations to receive additional grants under the SRP; and methods of funding our capital program.


Forward-looking statements in this news release also include statements regarding the expected terms and availability of the proposed BDC Term Facility, as well as the use of proceeds therefrom. Pursuant to the terms of the BDC Term Sheet, closing of the BDC Term Facility remains subject to a number of conditions, including final BDC credit approval and the entering into of definitive documentation among BDC, InPlay and InPlay’s current lenders. If the BDC Term Facility is not entered into, there may be an adverse impact on InPlay’s ability to continue to fund its operations and development activities. While approvals of InPlay’s syndicate of lenders have been obtained and definitive documentation is expected to be entered into in short order, there can be no assurances that the BDC Term Facility will be completed on the terms currently contemplated in the BDC Term Sheet or at all and, accordingly, investors should not unduly rely on the same.


Forward-looking statements or information are based on a number of material factors, expectations or assumptions of InPlay which have been used to develop such statements and information but which may prove to be incorrect. Although InPlay believes that the expectations reflected in such forward-looking statements or information are reasonable, undue reliance should not be placed on forward-looking statements because InPlay can give no assurance that such expectations will prove to be correct. In addition to other factors and assumptions which may be identified herein, assumptions have been made regarding, among other things: the impact of increasing competition; the general stability of the economic and political environment in which InPlay operates; the timely receipt of any required regulatory approvals; the ability of InPlay to obtain qualified staff, equipment and services in a timely and cost efficient manner; drilling results; the ability of the operator of the projects in which InPlay has an interest in to operate the field in a safe, efficient and effective manner; the ability of InPlay to obtain financing on acceptable terms including the completion of the BDC Term Facility; field production rates and decline rates; the ability to replace and expand oil and natural gas reserves through acquisition, development and exploration; the timing and cost of pipeline, storage and facility construction and the ability of InPlay to secure adequate product transportation; future commodity prices; currency, exchange and interest rates; regulatory framework regarding royalties, taxes and environmental matters in the jurisdictions in which InPlay operates; and the ability of InPlay to successfully market its oil and natural gas products.


The forward-looking information and statements included herein are not guarantees of future performance and should not be unduly relied upon. Such information and statements, including the assumptions made in respect thereof, involve known and unknown risks, uncertainties and other factors that may cause actual results or events to defer materially from those anticipated in such forward-looking information or statements including, without limitation: the duration and impact of COVID-19; changes in commodity prices; the potential for variation in the quality of the reservoirs in which we operate; changes in the demand for or supply of our products; unanticipated operating results or production declines; changes in tax or environmental laws, royalty rates or other regulatory matters; changes in development plans of InPlay or by third party operators of our properties; increased debt levels or debt service requirements; inaccurate estimation of our oil and gas reserve and resource volumes; limited, unfavorable or a lack of access to capital markets; increased costs; a lack of adequate insurance coverage; the impact of competitors; and certain other risks detailed from time-to-time in InPlay’s disclosure documents.


The forward-looking information and statements contained in this news release speak only as of the date hereof and InPlay does not assume any obligation to publicly update or revise any of the included forward-looking statements or information, whether as a result of new information, future events or otherwise, except as may be required by applicable securities laws.


Test Results and Initial Production Rates

Test results and initial production rates disclosed herein, particularly those short in duration, may not necessarily be indicative of long term performance or of ultimate recovery. A pressure transient analysis or well-test interpretation has not been carried out and thus certain of the test results provided herein should be considered to be preliminary until such analysis or interpretation has been completed.


BOE equivalent

Barrel of oil equivalents or BOEs may be misleading, particularly if used in isolation. A BOE conversion ratio of 6 mcf: 1 bbl is based on an energy equivalency conversion method primarily applicable at the burner tip and does not represent a value equivalency at the wellhead. Given that the value ratio based on the current price of crude oil as compared to natural gas is significantly different than the energy equivalency of 6:1, utilizing a 6:1 conversion basis may be misleading as an indication of value.


OPEC Forecasts Lower Demand as Output Cuts Taper


OPEC Members Have Complied with Production Cuts, but it’s Getting Tricky


OPEC indicated in its monthly report that it expects world oil demand to tumble by 9.06 million barrels per day (bpd) this year versus a previous estimate of 8.95 million bpd.  The decline is, of course, due to the COVID-19 pandemic and largely reflects a decrease in jet fuel although gasoline demand will also be challenged. Recall that OPEC cut production on May 1 by 9.7 million bpd to address an expected drop in demand.  That cut is scheduled to taper to 7.7 million beginning in August. Of course, announcing production cuts and achieving production cuts are two different things.  OPEC members (including OPEC plus members) have a history of not complying with mandated production cuts. Iraq is often mentioned as the primary compliance violators, but there are others. 


The compliance of the initial output cuts has been respectable.  Compliance was near 85% in May according to a Platts survey.  The chart below shows that OPEC members have generally done a better job than OPEC plus members.  It also shows that several members have been producing at levels below their allocated output.  Updated numbers in June and July have shown some slippage in compliance. 


Bull Case for Compliance and Higher Oil Prices

  • Saudi Arabia is In a Better Leadership Position.  Saudi Arabia is the de facto leader of OPEC as the country with the largest reserves and the lowest cost of production.  If production is not controlled and oil prices fall dramatically, it will be the last producer standing able to make a profit at lower prices.  This is what happened in April when Russia would not agree to cost reductions.  Saudi Arabia let oil prices fall forcing Russia and other countries back to the bargaining table.  The result was the 9.7 million bpd cut agreed to in May.  Saudi Arabia played a game of chicken and won.  It emerged as a more powerful enforcer because it has shown its willingness to punish cheaters.  Few OPEC plus members question whether Saudi Arabia would raise production if others were not complying. Nadir Itayim of Argus believes Saudi Arabia officials have taken an “all or nothing” approach. Either all countries do their part or nobody cuts.
  • Measurement Techniques Have Improved.  Measuring compliance is an arduous task given new areas of production, growing storage options (including floating storage) and a reliance on self-reporting. No wonder OPEC plus nations face a lack of trust when dealing with each other.  That said, the level of distrust has eased as new technology grants members a better system of measuring compliance.  Shipping tankers are better tracked and results are reported more frequently, both within and outside of OPEC.


Bear Case for Noncompliance and Lower Oil Prices

  • Compliance May Be Impossible Due to Contractual Agreements.  David Fyfe, chief economist at Argus, indicated that Iraq, Nigeria and Kazakhstan will have difficulties complying with mandated production cuts because of contractual agreements with upstream companies. Often, production cut arrangements are done hastily and simplistically.  Those arrangements may work in theory but are difficult to implement in reality.
  • Enforcement is Difficult.  Saudi Arabia has shown a willingness to allow oil price to drop to punish non-compliers.  However, it does so at great pain to its own financial position.  Historically, the country has turned a blind eye towards minor violations and other OPEC plus countries know this.  That leaves a temptation for members to test other members to see how far they can get away with challenging the system.
  • The United States is the Largest Producer of Oil
    and Not an OPEC Plus Member.
      OPEC became imperative when it lost market share to the United States in recent years. Much of the production has come from the Permian Basin where technological advances have lowered the price at which oil can be produced. The United States became the largest producer of oil in 2018. Domestic production has declined this year with the drop in oil prices.  Should oil prices rise again, it’s safe to bet that domestic production will return.


Summary

It is always difficult to assess whether “this time is different” regarding OPEC compliance.  Early indications are that production cuts have largely been adhered to.  However, it is worth noting that production cuts during a period of lower demand are easier to enforce than during periods of robust demand.  Everyone knows what will happen to oil prices if production is not cut to offset lower demand.  When demand returns and oil prices start to rise, the temptation to cheat may be increased. 


Suggested Reading:

EIA Reports the Largest Weekly U.S.
Crude Decline

Is M&A Picking up
in Energy Sector

Exploration and
Production Second Quarter Review and Outlook

Each event in our popular Virtual Road Shows Series has maximum capacity of 100 investors online. To take part, listen to and perhaps get your questions answered, see which virtual investor meeting intrigues you here.
 

Sources

https://finance.yahoo.com/news/opec-trims-2020-oil-demand-125222084.html, Alex Lawler, Yahoo Finance, August 12, 2020

https://www.argusmedia.com/en/blog/2020/july/2/the-curious-case-of-opec-compliance, Nader Itayim, Argus, July 02, 2020

https://www.cnbc.com/2020/06/11/opec-mostly-met-cut-targets-in-may-but-future-compliance-uncertain.html, Natasha Turak, CNBC, June 11, 2020

https://www.spglobal.com/platts/en/market-insights/latest-news/oil/061020-opec-delivers-85-compliance-on-oil-output-cuts-in-may-sampp-global-platts-survey, S&P Global Platts, June 10, 2020

http://www.energyintel.com/pages/eig_article.aspx?DocId=1077457, International Oil Daily, July 4, 2020

https://momr.opec.org/pdf-download/, Organization of Petroleum Exporting Countries, August 2020

Canadian Oil Production Drops To the Lowest Level Since 2016


The Drop In Canadian Oil Production Will Have Long-term Effects


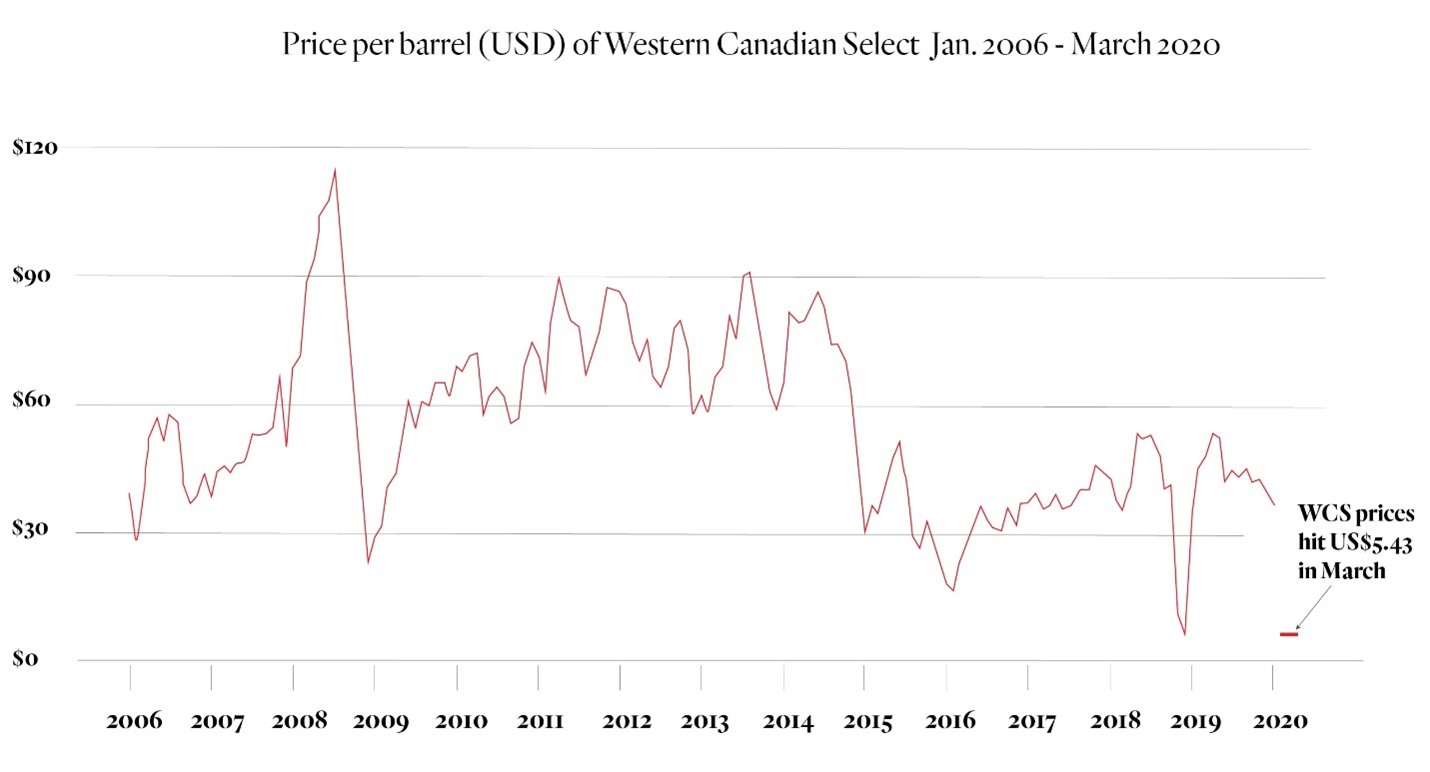
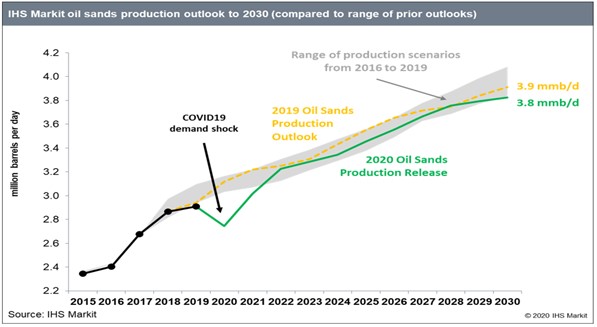
The drop in oil prices in April has not been kind to Canadian producers.  That, combined with imposed production curtailments by the government of Alberta has led to a 20% decline in daily production versus the 2019 average.  This decline is twice the output decline of OPEC countries and the third largest overall decline after Russia and the United States.  The decline for the fourth-largest producer of oil amounts to 1 million barrels of oil per day or 1.3% of the world’s daily supply.


Source: U.S. Energy Information Administration (EIA)


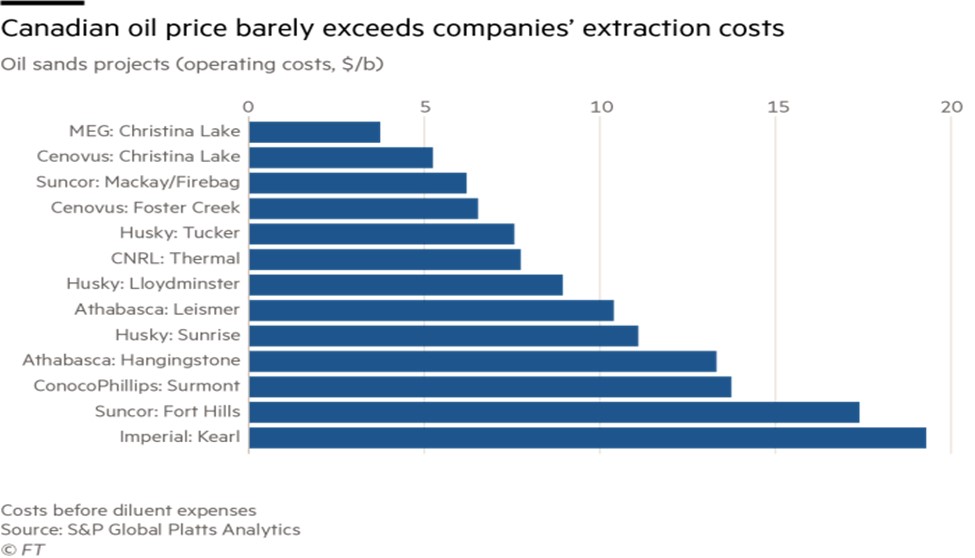
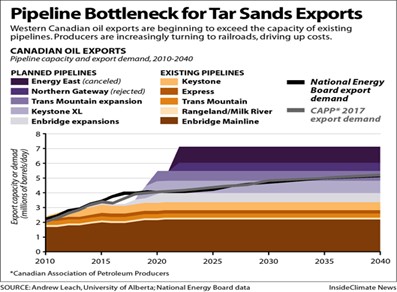
Canadian producers are especially hard hit by declines in oil prices.  Oil sand production is among the higher cost production.  Production costs have been dropping from a level of US$65 but are still believed to be in the mid-forties.  Canadian production may be the first to be shut in when oil prices drop.  What’s more, Western Canada typically receives a lower oil price than other areas due to pipeline constraints. This has been especially true in recent years because western Canadian oil prices have fallen sharper than the West Texas Intermediate oil price.  This disparity is unlikely to abate in the near future due to delays in construction of the Keystone Pipeline. It’s no wonder, then, that major producers such as ExxonMobil, Shell, ConocoPhillips and Marathon Oil Corporation have all reduced or withdrawn their investments in oil sands in recent years.


Some producers, including Canada’s largest producer Suncor, view the decline as temporary.  Suncor Chief Executive Mark Little said on a quarterly call with analysts that “By the end of the year, if we don’t have this upset with a second COVID outbreak, we expect essentially all crude in Western Canada to be back online.”  Others believe the problems faced by Western Canada producers precede COVID or OPEC production level issues.  Ricochet points out that major oil companies have more debt than revenues, estimated at $250 billion coming due in the next five years.  With electric vehicles eating into the largest component of oil demand, it is unlikely that oil producers will be bailed out by higher oil prices.


Source: U.S. Energy Information Administration


In many ways, the perils facing Canadian producers are not different than that of U.S. producers.  However, higher production costs and tighter pipeline capacity make the situation a more immediate concern. 


Suggested Reading:

Is M&A Picking up
in Energy Sector

Exploration and
Production Second Quarter Review and Outlook

Is $40 the Sweet Spot for Sweet Crude?


Each event in our popular Virtual Road Shows Series has maximum capacity of 100 investors online. To take part, listen to and perhaps get your questions answered, see which virtual investor meeting intrigues you here.
 

Sources:

https://www.eia.gov/todayinenergy/detail.php?id=44396&src=email, U.S. Energy Information Administration, July 16, 2020

https://www.yahoo.com/news/canadian-oil-companies-moving-restore-144252160.html, Rod Nickel, Reuters, July 23, 2020

https://www.bloomberg.com/news/articles/2020-03-09/oil-rout-tests-canadian-energy-producers-cost-cutting-drive, Kevin Orland and Robert Tuttle, Bloomberg, March 9, 2020

https://ricochet.media/en/3116/oil-was-doomed-before-the-pandemic, Will Dubitsky, Ricochet, May 14, 2020

https://boereport.com/2019/05/01/costs-of-canadian-oil-sands-projects-fell-dramatically-in-recent-years-but-pipeline-constraints-and-other-factors-will-moderate-future-production-growth-ihs-markit-analysis-says/, BOE Report, May 1, 2019

Gevo, Inc. (GEVO) – Quarterly Loss Narrows After Cost Cuts. Capital Raise Creates Near-term Cash Cushion

Tuesday, August 11, 2020

Gevo, Inc. (GEVO)

Quarterly Loss Narrows After Cost Cuts. Capital Raise Creates Near-term Cash Cushion.

Gevo Inc is a renewable chemicals and biofuels company engaged in the development and commercialization of alternatives to petroleum-based products based on isobutanol produced from renewable feedstocks. Its operating segments are the Gevo segment and the Gevo Development/Agri-Energy segment. By its segments, it is involved in research and development activities related to the future production of isobutanol, including the development of its biocatalysts, the production and sale of biojet fuel, its Retrofit process and the next generation of chemicals and biofuels that will be based on its isobutanol technology. Gevo Development/Agri-Energy is the key revenue generating segment which involves the operation of the Luverne Facility and production of ethanol, isobutanol and related products.

Poe Fratt, Senior Research Analyst, Noble Capital Markets, Inc.

Refer to the full report for the price target, fundamental analysis, and rating.

    Adjusted 2Q2020 EBITDA of $(3.1) million narrowed versus $(6.2) million in 1Q2020 due to idling Luverne plant and cost cutting. Lower cost structure pushed cash burn down to ~$4.7 million and cash burn should move below $4 million in 3Q2020. 2020 EBITDA loss estimate is $15.2 million, up from $14.4 million.

    Two significant commercial agreements likely in near future. Discussions on added supply/licensing agreements are advanced even amidst current turmoil in the airline/refining industries. Agreements would expand supply portfolio of 17 million gallons/year already in place. Expansion plans now include building up supply portfolio to include isooctane (renewable gasoline) agreements. Interest in renewable fuel concept is …


    Click to get the full report

This Company Sponsored Research is provided by Noble Capital Markets, Inc., a FINRA and S.E.C. registered broker-dealer (B/D).

*Analyst
certification and important disclosures included in the full report. 
NOTE: investment decisions should not be based upon the content of
this research summary.  Proper due diligence is required before
making any investment decision.
 

Large Oil Companies Had a Good Run, are We Witnessing the End of an Era?

BP Plc Cuts Dividend and Goes All in on Renewables, Is this a Trend?


Supermajor oil is a term used to describe the largest oil companies in the world. The supermajors are considered to be BP, Chevron, ENI, ExxonMobil, Royal Dutch Shell, Total, and ConocoPhillips. Supermajors were formed between 1998 and 2002 through a series of mergers. Exxon combined with Mobil. Chevron took over Texaco. Conoco Inc. merged with Phillips Petroleum. BP acquired Amoco and ARCO while Total combined with Petrofina and Elf Aquitaine. The supermajors are global energy companies with assets all over the world. They are large enough to be able to make major investments in new oil fields. They are involved in both upstream and downstream operations. Most pay large dividends. At one point, the supermajors were among the largest stocks by market capitalization. With the decline in oil prices and the rise of technology stocks, that is no longer true. 


On August 4, 2020, BP announced that it would cut its dividend 50%, cut oil and gas production by 40%, and boost renewable energy investments to $5 billion annually in order to become carbon neutral. BP becomes the third supermajor to pledge to the cut emissions to net-zero following Shell and Total. BP’s dividend cut follows a similar cut by Shell in April. A smaller energy company, Equinor, also cut its dividend in April. The dividend cuts are perhaps a reflection of decreased cash flow in a new, low oil price, environment. However, it can also be viewed as a recognition that the world’s energy landscape is changing. Technology improvements have lowered the cost of oil production, meaning oil prices may remain at current low levels. The rise of electric vehicles has the potential to take away oil demand. Also, the economic downturn associated with the COVID-19 pandemic has decreased the world’s demand for oil.


So, what does this mean for the supermajors going forward? Will other oil companies follow BP’s lead? Chevron has taken a different route. On July 19, 2020, the company announced the $13 billion (including the assumption of debt) acquisition of Noble Energy. The acquisition greatly increased its position in the Permian Basin and other oil-rich areas. Does the acquisition represent the management’s commitment to oil, or is it simply an attractive acquisition at a good price? Companies can be very profitable, picking up market share, even in industries that are in decline. Investors should pay close attention to Chevron management’s actions going forward to get a better understanding of its corporate strategy.


It is a bit early to declare an end to the era of supermajor oil companies. At the same time, the supermajors and investors in supermajors must recognize changing industry dynamics. Oil demand is slowing while renewable demand is growing. In a broader sense, perhaps it is best not to think in terms of oil demand versus renewable demand. The demand for energy continues to grow, and energy companies must be nimble to adjust to changes in the types of demand. To do so, energy companies may want to have a hand in all types of energy. Perhaps, this really is the end of the supermajor oil companies. But if that is true, it will only mean the birth of supermajor energy companies.


Suggested Reading:

Is M&A Picking up in Energy Sector

Exploration and Production Second Quarter Review and Outlook

Is $40 the Sweet Spot for Sweet Crude?

Each event in our popular Virtual Road Shows Series has maximum capacity of 100 investors online. To take part, listen to and perhaps get your questions answered, see which virtual investor meeting intrigues you here.


Sources:

https://finance.yahoo.com/news/bp-walks-away-oil-supermajor-080220211.html, Will Kennedy, Laura Hurst and Kevin Crowley, Bloomberg, August 5, 2020

https://www.washingtonpost.com/climate-environment/2020/08/04/bp-built-its-business-oil-gas-now-climate-change-is-taking-it-apart/, Steven Mufson, The Washington Post, August 4, 2020

http://priceofoil.org/2020/05/01/from-supermajors-to-superminors-the-fall-of-big-oil/, Andy Rowell, OilChange, May 1, 2020

https://www.worldoil.com/news/2020/5/12/supermajors-all-have-ambitious-and-widely-varying-net-zero-goals, Akshat Rathi, World Oil, May 12, 2020

https://news.bloomberglaw.com/corporate-governance/bp-walks-away-from-the-oil-supermajor-model-it-helped-create, Simon Dawson, Bloomberg, August 5, 2020

Unexpected Lower Oil Inventories are a Dent in the Upward Trend

EIA Reports the Largest Weekly U.S. Crude Decline

The Energy Information Administration reported that inventories for the week ended July 24 fell 10.6 million barrels, the largest decline in seven months.  The decline reflects increased demand associated with a reopening of the economy as well as decreased supply associated with a drop in active drilling rigs.  Figure #1 below shows the sharp decline in active U.S. oil rigs that occurred when oil prices sank below $20 per barrel in early April.  Interestingly, the number of active rigs has not yet rebounded despite oil prices rising back above $40 per barrel.


Rising oil inventories have largely been concentrated in the middle of the country.  The chart below shows inventory trends by region through the month of June, showing that storage levels had been rising several months before the pandemic crisis began.  It also shows that the rise in inventory has been largely concentrated in the Midwest, Cushing-Oklahoma, and Gulf Coast regions.  It also shows that the Midwest and Cushing-Oklahoma regions are starting to see a decrease in inventories in response to decreased drilling while the Gulf Coast has not.  This is not surprising given that higher well costs in the Gulf make the region less flexible to making short-term drilling adjustments to price changes.

Figure #2


The decline in inventories was a much-needed relief from a long steady rise of U.S. Crude inventories, as shown in figure #3.  It’s too early to make the claim that we are now seeing a reduction in supply arising from decreased drilling. One week of data does not make a trend; however, it does warrant increased attention to future inventory reports. 


Suggested Reading:

Is M&A Picking up in Energy Sector

Exploration and Production Second Quarter Review and Outlook

Virtual Power Plants and Tesla Car Batteries

Each event in our popular Virtual Road Shows Series has maximum capacity of 100 investors online. To take part, listen to and perhaps get your questions answered, see which virtual investor meeting intrigues you here.
Sources:

https://finance.yahoo.com/m/885423dd-6248-3267-8c4d-de7148e60f0b/oil-prices-get-a-lift-as-eia.html, Myra P. Saefong, Marketwatch, July 29, 2020

https://tradingeconomics.com/united-states/crude-oil-rigs, Trading Economics, July 24, 2020

https://www.eia.gov/outlooks/steo/report/us_oil.php, EIA, July 7, 2020


Is M and A Picking Up in The Energy Sector?

Chevron Announces the Acquisition of Noble Energy
Will Other Oil and Gas Producers Follow?

On July 20, Chevron Corporation announced it would buy oil and gas producer Noble Energy Inc for $5 billion in stock.  Noble is a highly leveraged company with $8 billion of debt that will be assumed by Chevron.  The shares of Noble have been weak this year along with most leveraged energy companies, having begun the year with a market capitalization near $12 billion.  Noble’s assets will expand Chevron’s shale presence in Colorado and the Permian Basin.  Chevron was close to adding Permian Basin assets last year when it attempted to acquire Anadarko Petroleum.  The Noble acquisition is the largest energy acquisition to be announced in 2020.  As is usually the case, the acquisition begs the questions, “will the acquisition lead to other acquisitions?”

Why Merger Activity Picks Up

The energy industry has always been cyclical, and we remain in the down part of the cycle.  When energy prices are high, managements often take on additional leverage to expand drilling efforts because returns look so attractive.  When prices drop like we have seen this year, the return on those assets is not as attractive, but management is still saddled with the debt they have taken on.  Selling assets is always an option, but there are few takers when everyone is in the process of cutting back, and asset returns are low.  Often, smaller, leveraged energy companies are forced to issue stock at low prices or face the risk of being forced into bankruptcy.

Another option is to sell the entire company.  It is not unusual to see a pickup in merger activity when energy prices have fallen.  Major oil companies, which built up large cash positions during the upcycle, are more than willing to pounce on companies during times of desperation.  Of course, the major oils are not going to waste their time on small acquisitions that will not have an impact on top-line growth.  They want mid-sized companies that will take them into new areas of production, which is why a combination like Chevron and Noble makes sense – a major oil buying a mid-sized energy company.

Expectations for the Months Ahead

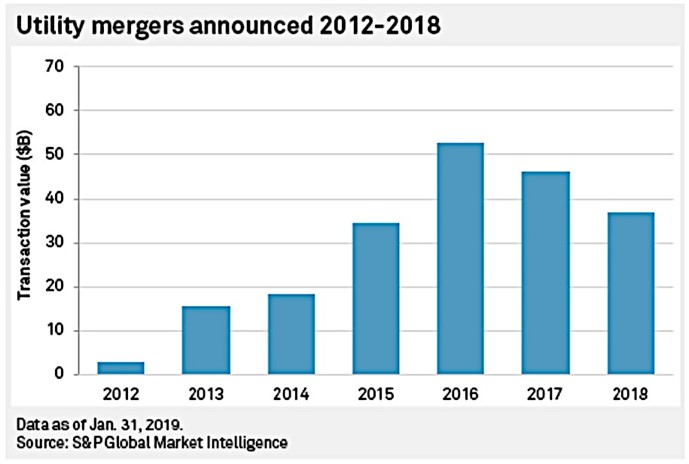
S&P Global Market Intelligence concludes that the biggest oil deals have come following oil price crashes.  They point out that since 1995, more than 50 deals have been completed, valued at over $10 billion.


So, will Chevron’s acquisition of Noble push the other major oils to follow suit?  Probably not.  In some ways, Chevron was still playing catch up the merger activity completed by the other majors in recent years.  The $13 billion acquisition of Noble still pales in comparison to the $33 billion attempted acquisition of Anadarko last year.  In fact, it would not be surprising for Chevron to announce additional acquisitions, albeit once it has had the time to digest the Noble acquisition.  In our opinion, the events surrounding the acquisition are unique in that Chevron was a uniquely motivated buyer seeking to make a major splash to expand in the Permian Basin.

Take-Away

Chevron’s acquisition of Noble probably speaks more to the validity of the Permian Basin than it does to the energy consolidation environment.  Recall that the Permian Basin has become one of the world’s most prolific oil fields following years of falling operating costs due to improved drilling technology.  That came to a bit of a halt this spring when a global economic downturn drove down oil demand forecasts, and an oil price war between Saudi Arabia and Russia flooded the market with additional supply.  With oil prices dropping into the twenties, it became difficult for energy companies to justify drilling new wells in the Permian Basin.  Most experts think producers need an oil price in the forties to justify drilling in the Permian.  Although oil prices have risen back into the forties, the threat of further global weakness or the ending of a contentious detente between Saudi Arabia could mean lower oil prices. Chevron’s acquisition, then, is a sign that they believe in the long-term viability of drilling in the Permian Basin.

Suggested:

Energy Industry Report – Second Quarter Review and Outlook

Will There be an Explosion in New Acquisitions

C-Suite Interview, Indonesia Energy

Enjoy the
Benefits of 
Premium Channelchek Content at No Cost

Each event in our popular Virtual Road Shows Series has maximum capacity of 100 investors online. To take part, listen to and perhaps get your questions answered, see which virtual investor meeting intrigues you 
here.


Sources:

https://finance.yahoo.com/news/chevron-buy-noble-energy-5-111125456.html, Jennifer Hiller, Reuters, July 20, 2020

https://www.spglobal.com/marketintelligence/en/news-insights/latest-news-headlines/consolidation-coming-oil-companies-set-to-party-like-it-s-1999-58753567, S&P Global Market Intelligence, May 28, 2020

https://www.bizjournals.com/houston/news/2020/02/06/energy-analyst-expects-consolidation-deals-in-2020.html, Joshua Mann, Houston Business Journal, February 6, 2020

https://seekingalpha.com/article/4358468-energy-stocks-breakout-following-healthy-consolidation-just-global-oil-inventories-start-to, Seeking Alpha, Juley 14, 2020

https://www.reuters.com/article/us-global-oil-shale-bust-insight/oil-in-the-age-of-coronavirus-a-u-s-shale-bust-like-no-other-idUSKCN21X0HC, Jennifer Hiller, Liz Hampton, Reuters, April 15, 2020