Energy Fuels Announces Q2-2022 Results, Including Continued Robust Balance Sheet And Market-Leading U.S. Uranium And Rare Earth Positions
Research, News, and Market Data on Energy Fuels
Webcast
on August 9, 2022
LAKEWOOD, Colo., Aug. 5, 2022 /CNW/ –
Energy Fuels Inc. (NYSE: UUUU) (TSX: EFR) (“Energy Fuels” or the “Company”) today reported its financial results for the quarter ended June 30, 2022. The Company’s quarterly report on Form 10-Q has been filed with the U.S. Securities and Exchange Commission (“SEC“) and may be viewed on the Electronic Document Gathering and Retrieval System (“EDGAR“) at
www.sec.gov/edgar.shtml, on the System for Electronic Document Analysis and Retrieval (“SEDAR“) at www.sedar.com, and on the Company’s website at www.energyfuels.com. Unless noted otherwise, all dollar amounts are in U.S. dollars.
Highlights:
- At June 30, 2022, the Company had a robust balance sheet with $134.1 million of working capital, including $86.4 million of cash and cash equivalents, $11.8 million of marketable securities, $28.6 million of inventory, and no short term (or long term) debt. At current commodity prices, the Company’s product inventory has a value of $43.9 million.
- During the quarter ended June 30, 2022, the Company incurred a net loss of $18.1 million, which included a non-cash mark-to-market decrease in the value of investments accounted for at fair value of $13.4 million.
- During Q2-2022, the Company entered into three (3) long-term uranium sales contracts with U.S. nuclear utilities. Base quantities under these contracts total 3.0 million pounds with deliveries to occur during the 2023 – 2030 time period. If the buyers exercise all options, total delivery quantities could increase to as much as 4.2 million pounds. Annual quantities vary year-to-year, with lower delivery quantities in the early years, and higher quantities in the later years. Contract pricing has a fixed price component (fully indexed to inflation) and a spot market component, along with floor and ceiling prices (fully indexed to inflation). The Company expects to fulfill deliveries during the early years of these contracts from its significant existing produced inventories.
- In June 2022, the U.S. Department of Energy (“DOE“) issued a Request for Proposals (“RFP“) to purchase uranium (“U3O8“) for the new U.S. Uranium Reserve (the “Reserve“). The DOE states that they expect to purchase up to 1 million pounds of U3O8 inventory from up to four (4) qualified U.S. uranium producers. The uranium must be physically located at Honeywell’s Metropolis Works conversion facility (the “U.S. Converter“). Energy Fuels believes it meets all qualifications to supply the Reserve, and the Company currently holds about 692,000 pounds of U3O8 at the U.S. Converter. The Company has submitted a bid to sell U3O8 to the Reserve, taking into consideration its long-term contract commitments and current and expected market conditions. There are no guarantees the DOE will purchase uranium from the Company under this RFP.
- During the first half of 2022, the Company produced approximately 205 tonnes of mixed rare earth element (“REE“) carbonate (“RE Carbonate“), containing approximately 95 tonnes of total rare earth oxides (“TREO“). Energy Fuels’ RE Carbonate, which is roughly 32% – 34% NdPr, is the most advanced REE material being produced in the U.S. today.
- In May 2022, the Company announced it had entered into agreements to acquire a 58 square mile rare earth land position in Brazil (the “Bahia Project“). The Bahia Project is a well-known heavy mineral sand (“HMS“) deposit that has the potential to feed the Company’s White Mesa Mill with REE and uranium-bearing monazite sand for decades. Due diligence is ongoing, and closing is currently expected to occur on or around August 31, 2022. After closing, the Company expects to conduct an extensive exploration program to better define the HMS and monazite resource, including comprehensive sonic drilling and geophysical mapping with the intent to complete an Initial Assessment under SK-1300 (U.S.) and a Preliminary Economic Assessment under NI 43-101 (Canada) during Q4-2022 or Q1-2023.
- The Company is currently in active discussions with several additional sources of natural monazite sands around the world to significantly increase the supply of feed for its growing REE initiative.
- The Company continues to make excellent progress toward installing full REE separation capabilities at the Mill to produce both “light” and “heavy” separated REE oxides in the coming years, subject to successful licensing, financing, and commissioning, and continued strong market conditions. The Company has hired Carester SAS (“Carester“), a global leader in producing separated REE oxides, to support these REE separation initiatives. The Company is also evaluating installing a smaller “light” separation circuit within the existing Mill facilities with the ability to produce up to 1,500 tonnes TREO and 375 tonnes of NdPr oxide per year in the next 18-24 months. Initial estimates indicate low capital and operating costs for this circuit until a larger facility in the order of 10,000 tonnes TREO can be permitted, constructed and commissioned.
- During the first half of 2022, the Company sold approximately 575,000 pounds of the Company’s existing inventory of vanadium (“V2O5“) (as ferrovanadium, “FeV“), for an average weighted net price of $13.44 per pound of V2O5. Vanadium markets have dropped in recent weeks. Therefore, the Company has halted sales of its inventory which currently stands at approximately 1.05 million pounds of V2O5. However, the Company expects to resume sales when markets improve again. The Company is evaluating the potential to resume vanadium recovery at the Mill in the future as market conditions may warrant for future sale and to replace sold inventory, where its tailings pond solutions contain an estimated additional 1.0 to 3.0 million recoverable pounds of V2O5.
- To bolster the Company’s management team during its current growth phase and expansion into the REE industry, Energy Fuels has hired John Uhrie as Chief Operating Officer (“COO“), effective August 1, 2022, and Tom Brock as Chief Financial Officer (“CFO“), effective August 8, 2022. Mr. David Frydenlund, the Company’s current CFO, General Counsel and Corporate Secretary, was appointed to the position of Executive Vice President, Chief Legal Officer and Corporate Secretary of the Company, effective August 8, 2022. Mr. Brock previously served as Vice President and Chief Accounting Officer for Extraction Oil and Gas Inc. and prior thereto as Vice President, Chief Accounting Officer and Corporate Controller for American Midstream Partners LP. Dr. Uhrie most recently served as Vice President for Metals, Exploration and Development for The Doe Run Company, a global leader in lead, zinc and copper production and prior thereto as President, Consulting Services of the Americas for RPM Global, as Manager of Process Metallurgy for Newmont Mining Corp., and as Manager, Metallurgy and Strategic Planning, Africa and Manager of Hydrometallurgical Operations for Freeport McMoRan Copper and Gold, Bagdad Operations. Both Mr. Brock and Dr. Uhrie bring significant experience in managing producing natural resource companies.
Mark S. Chalmers, Energy Fuels’ President and CEO, stated:
“Energy Fuels continues to make progress on all fronts of our uranium, rare earth, vanadium and medical isotope businesses. Uranium markets have been volatile but remain strong. We continue to believe the short and long-term fundamentals for uranium continue to point to higher pricing. We are extremely pleased to announce the execution of three long-term contracts with U.S. nuclear utilities. With up to 4.2 million pounds of uranium deliveries between 2023 and 2030, at attractive pricing and other terms, these contracts will help underpin Energy Fuels’ uranium business for many years to come. We are also beginning to perform the work needed to recommence production at one or more of our uranium mines. The Company’s substantial existing uranium inventories are expected to provide sufficient uranium for the early years of the contract deliveries. However, we expect to be in production at one or more of our uranium mines in the next two years. Our substantial inventories will also allow Energy Fuels the potential to offer significant quantities of uranium to the new U.S. Uranium Reserve. During the second half of 2022, we expect to shift back to processing stockpiled ores for uranium production, and we expect to produce 100,000 to 120,000 pounds of uranium in 2022.
“We sold some of our substantial vanadium inventories during the first half of 2022, as prices rose during the quarter. However, in recent weeks, vanadium prices have dropped back. Therefore, we stopped our sales. Nonetheless, during the first half of 2022, we sold about 575,000 pounds of V2O5, contained in ferrovanadium, at an average net price of $13.44 per pound V2O5. Our vanadium inventory was carried on our balance sheet at $6.09 per pound V2O5, so we have been able to capture some gross margin on these sales. Plus, we still have another 1.05 million pounds of V2O5 in inventory that we can sell into future market strength.
“Energy Fuels’ rare earth initiative continues to proceed extremely well, and we believe we are making more progress, faster, than any other U.S. company. Last year, we began production of a high-purity mixed rare earth carbonate that is ready for separation. No other company in the U.S. is commercially producing a product as advanced as Energy Fuels. In March 2022, we began the partial separation of lanthanum from our rare earth carbonate, using existing solvent extraction equipment at our White Mesa Mill. This is the first commercial-scale rare earth separation to occur in the U.S. in many years. As a result, we produced a very high-purity rare earth carbonate, with most of the lanthanum removed, that contains about 32% – 34% NdPr. We also performed pilot-scale rare earth separation in the Mill’s laboratory, where we produced about two kilograms of high-purity NdPr oxide per day. We expect to resume rare earth processing later in 2022, when we receive additional shipments of monazite sand from Chemours. It is early days, but with the outstanding achievements of our internal staff, complemented by our relationships with Neo Performance Materials (“Neo“) and Carester, we are confident that we will restore U.S. rare earth separation capabilities in the coming years.
“Finally, our medical isotope initiative is also advancing nicely. As previously announced, we are evaluating the recovery of radioisotopes from our existing uranium and rare earth process streams at the White Mesa Mill that could potentially be used in emerging targeted alpha therapy (“TAT“) cancer therapeutics. We look forward to providing more information on this initiative in the coming months.
“Lastly, I would like to welcome Tom Brock and John Uhrie to Energy Fuels’ management team. I believe Energy fuels is making the leap to large-scale production of uranium and rare earth elements in the coming years. Therefore, we are extremely pleased to add these two individuals to our management team, both of whom have extensive experience in managing operating natural resource companies.”
Webcast at 4:00 pm EDT on August 9, 2022:
Energy Fuels will be hosting a video webcast on August 9, 2022 at 4:00 pm EDT (2:00 pm MDT) to discuss its Q2-2022 financial results, the outlook for 2022, uranium, rare earths, vanadium, and medical isotopes. To join the webcast and access the presentation and viewer-controlled webcast slides, please click on the link below:
Webcast Link
If you would like to participate in the webcast and ask questions, please dial in to 1-888-664-6392 (toll free in the U.S. and Canada).
A link to a recorded version of the proceedings will be available on the Company’s website shortly after the webcast by calling 1-888-390-0541 (toll free in the U.S. and Canada) and by entering the code 536175#. The recording will be available until August 23, 2022.
Selected Summary Financial Information:
|
$000’s, except per share data
|
Six months ended
June 30, 2022
|
|
Six months ended
June 30, 2021
|
|
Results
of Operations:
|
|
|
|
|
Total revenues
|
$
|
9,404
|
|
$
|
809
|
|
Gross profit
|
3,093
|
|
809
|
|
Operating loss
|
(16,920)
|
|
(17,189)
|
|
Net loss attributable to the company
|
(32,783)
|
|
(21,692)
|
|
Basic and diluted net loss per common share
|
(0.21)
|
|
(0.15)
|
|
|
|
|
|
|
|
|
|
$000’s
|
As at
June 30, 2022
|
|
As at
December 31, 2021
|
|
Financial
Position:
|
|
|
|
|
Working capital
|
$
|
134,089
|
|
$
|
143,190
|
|
Property, plant and equipment, net
|
21,515
|
|
21,983
|
|
Mineral properties
|
83,539
|
|
83,539
|
|
Total assets
|
288,258
|
|
315,446
|
|
Total long-term liabilities
|
13,927
|
|
13,805
|
Financial Discussion:
At June 30, 2022, the Company had $134.1 million of working capital, including $98.1 million of cash and cash equivalents and marketable securities and $28.6 million of inventory, including approximately 692,000 pounds of uranium and 1.05 million pounds of high-purity vanadium, both in the form of immediately marketable product. The current spot price of U3O8, according to TradeTech, is $48.75 per pound, and the current mid-point spot price of V2O5, according to Metal Bulletin, is $8.00 per pound. Based on those spot prices, the Company’s uranium and vanadium inventories have a current market value of $33.7 million and $8.4 million, respectively, totaling $42.1 million. The Company also holds RE Carbonate inventory with a current value of $1.8 million, for total product inventory of $43.9 million at current commodity prices.
During the quarter ended June 30, 2022, the Company incurred a net loss of $18.1 million, compared to a net loss of $10.8 million for the second quarter of 2021, and a net loss of $32.8 million for the six months ended June 30, 2022 compared to a net loss of $21.7 million during the first six months of 2021. The increased net losses in 2022 are due primarily to a non-cash mark-to-market decrease in the value of investments accounted for at fair value of $13.4 million for the second quarter of 2022 and $16.8 million for the six months ended June 30, 2022. The Company has seen improvement in the value of these investments accounted for at fair value subsequent to quarter end.
Operations Update and Outlook for 2022:
Overview
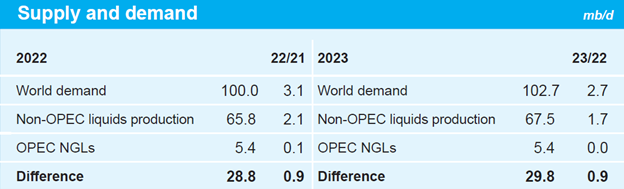
The Company continues to believe that uranium supply and demand fundamentals point to higher sustained uranium prices in the future. In addition, Russia’s recent invasion of Ukraine and the recent entry into the uranium market by financial entities purchasing uranium on the spot market to hold for the long-term has the potential to result in higher sustained spot and term prices and, perhaps, induce utilities to enter into more long-term contracts with non-Russian producers like Energy Fuels to ensure security of supply and more certain pricing. Having recently secured three long-term uranium contracts with major U.S. utilities, the Company is beginning to perform the work needed to recommence production at one or more of its mines and in-situ recovery (“ISR“) facilities, starting as soon as 2023. Until such time when the Company has ramped back up to commercial uranium production, it can rely on its significant uranium inventories to fulfill its new contract requirements. The Company also continues to evaluate selling a portion of its inventories on the spot market in response to future upside price volatility, into the newly created U.S. Uranium Reserve Program, or for delivery into additional long-term supply contracts if procured. During the first half of 2022, the Company also began selling a portion of its vanadium inventory into then strengthening markets.
The Company will also continue to seek new sources of revenue, including through its emerging REE business, as well as new sources of Alternate Feed Materials and new fee processing opportunities at the Mill that can be processed without reliance on current uranium sales prices. The Company is also seeking new sources of natural monazite sands (in addition to the proposed acquisition of the Bahia Project) for its emerging REE business, is evaluating the potential to recover radioisotopes for use in the development of TAT medical isotopes for the treatment of cancer, and continues its support of U.S. governmental activities to assist the U.S. uranium mining industry, including the new U.S. Uranium Reserve Program and other efforts to restore domestic nuclear fuel capabilities.
Extraction and Recovery Activities Overview
During 2022, the Company plans to recover 100,000 to 120,000 pounds of uranium and approximately 650 to 1,000 tonnes of mixed RE Carbonate containing approximately 300 to 450 tonnes of TREO.
No vanadium production is currently planned during 2022, though the Company sold some of its existing vanadium inventory into recent strong markets and is evaluating the potential to recommence vanadium production in 2023 or later years as market conditions may warrant for future sale and to replace sold inventory.
The Company has secured three new long-term sales contracts with U.S. nuclear utilities and is continuing to strategically pursue additional uranium sales commitments with pricing expected to have both fixed and market-related components. The Company believes that recent price increases, volatility and focus on security of supply in light of Russia’s invasion of Ukraine have increased the potential for the Company to make uranium sales and procure additional term sales contracts with utilities at pricing that sustains production and covers corporate overhead. Therefore, existing inventories may increase from 692,000 pounds of U3O8 to 792,000 to 812,000 pounds of U3O8 at year-end 2022 or may increase to a lesser extent, or be reduced, in the event the Company sells a portion of its inventory on the spot market, to the U.S. Uranium Reserve, or pursuant to term contracts in 2022.
ISR Activities
The Company expects to produce insignificant quantities of U3O8 in the year ending December 31, 2022 from Nichols Ranch and Alta Mesa. Until such time when market conditions improve sufficiently, suitable term sales contracts can be procured, or the U.S. Uranium Reserve Program is expanded, the Company expects to maintain the Nichols Ranch and Alta Mesa Projects on standby and defer development of further wellfields and header houses.
Conventional Activities
Conventional Extraction and Recovery Activities
During the six months ended June 30, 2022, the Mill did not package any material quantities of U3O8, focusing instead on developing its REE recovery business. During the six months ended June 30, 2022, the Mill produced approximately 205 tonnes of RE Carbonate, containing approximately 95 tonnes of TREO. The Mill recovered small quantities of uranium during the Quarter, which were retained in circuit. During 2022, the Company expects to recover 100,000 to 120,000 pounds of uranium at the Mill as finished product. The Company expects to recover approximately 650 to 1,000 tonnes of mixed RE Carbonate containing approximately 300 to 450 tonnes of TREO at the Mill during 2022. The Company expects to sell all or a portion of its mixed RE Carbonate to Neo or other global separation facilities and/or to stockpile it for future production of separated REE oxides at the Mill or elsewhere. The Company is in advanced discussions with several sources of natural monazite sands (in addition to the Bahia Project) to secure additional supplies of monazite sands, which if successful, would be expected to allow the Company to increase RE Carbonate production.
In addition to its 692,000 pounds of finished uranium inventories currently located at North American conversion facilities and at the Mill, the Company has approximately 300,000 pounds of U3O8 contained in stockpiled Alternate Feed Materials and other ore inventory at the Mill that can be recovered relatively quickly in the future, as general market conditions may warrant (totaling about 992,000 pounds of U3O8 of total uranium inventory). The Company is also seeking to acquire additional ore inventory from third party mine cleanup activities that can be recovered relatively quickly in the future.
The Company currently holds 1.05 million pounds of V2O5 in inventory, and there remains an estimated 1.0 to 3.0 million pounds of additional solubilized recoverable V2O5 remaining in tailings solutions awaiting future recovery, as market conditions may warrant.
Conventional Standby, Permitting and Evaluation Activities
During the six months ended June 30, 2022, standby and environmental compliance activities continued at the fully permitted and substantially developed Pinyon Plain Project (uranium and, potentially, copper) and the fully permitted and developed La Sal Complex (uranium and vanadium). The Company plans to continue carrying out engineering, metallurgical testing, procurement and construction management activities at its Pinyon Plain Project. The timing of the Company’s plans to extract and process mineralized materials from these Projects will be based on sustained improvements in general market conditions, procurement of suitable sales contracts and/or the expansion of the U.S. Uranium Reserve Program.
The Company is selectively advancing certain permits at its other major conventional uranium projects, such as the Roca Honda Project, which is a large, high-grade conventional project in New Mexico. The Company is also continuing to maintain required permits at its conventional projects, including the Whirlwind Project, which came out of temporary cessation during the Quarter, and the Sheep Mountain project. In addition, the Company will continue to evaluate the Bullfrog Project. Expenditures for certain of these projects have been adjusted to coincide with expected dates of price recoveries based on the Company’s forecasts. All these projects serve as important pipeline assets for the Company’s future conventional production capabilities, as market conditions may warrant.
Uranium Sales
During the six months ended June 30, 2022, the Company entered into three uranium sale and purchase agreements with major U.S. utilities, constituting its first new long-term supply contracts since 2018. Having observed a marked uptick in interest from nuclear utilities seeking long-term uranium supply, the Company remains actively engaged in pursuing additional selective long-term uranium sales contracts.
The Company submitted a bid to sell a portion of its existing uranium inventory into the U.S. Uranium Reserve at pricing that provides an appropriate rate of return to the Company. There are no guarantees that the U.S. government will buy all, or any, of the uranium the Company offers for sale.
Vanadium Sales
As a result of strengthening vanadium markets, during the six months ended June 30, 2022, the Company sold approximately 575,000 pounds of V2O5 (as FeV) at a gross weighted average price of $13.44 per pound of V
2O5. The Company expects to sell its remaining finished vanadium product when justified into the metallurgical industry, as well as other markets that demand a higher purity product, including the aerospace, chemical, and potentially the vanadium battery industries. The Company expects to sell to a diverse group of customers in order to maximize revenues and profits. The vanadium produced in the 2018/19 pond return campaign was a high-purity vanadium product of 99.6%-99.7% V2O5. The Company believes there may be opportunities to sell certain quantities of this high-purity material at a premium to reported spot prices. The Company may also retain vanadium product in inventory for future sale, depending on vanadium spot prices and general market conditions.
RE Carbonate Sales
The Company commenced its ramp-up to commercial production of a mixed RE Carbonate in March 2021 and has shipped all its RE Carbonate produced to-date to Neo’s Silmet facility in Estonia, where it is currently being fed into their separation process. All RE Carbonate produced at the Mill in 2022 is expected to be sold to Neo for separation at Silmet. Until such time as the Company expects to permit and construct its own separation circuits at the Mill, production in future years is expected to be sold to Neo for separation at Silmet and, potentially, to other REE separation facilities outside the U.S. To the extent not sold, the Company expects to stockpile mixed RE Carbonate at the Mill for future separation and other downstream REE processing at the Mill or elsewhere. During the quarter ended June 30, 2022, the Company sold approximately 18,000 kilograms of TREO at an average price of $25.35 per kilogram of TREO.
As the Company continues to ramp up its mixed RE Carbonate production and additional funds are spent on process enhancements, improving recoveries, product quality and other optimization, profits from this initiative are expected to be minimal until such time when monazite throughput rates are increased and optimized. However, even at the current throughput rates, the Company is recovering most of its direct costs of this growing initiative, with the other costs associated with ramping up production, process enhancements and evaluating future separation capabilities at the Mill being expensed as underutilized capacity production costs applicable to RE Carbonate and development expenditures. Throughout this process, the Company is gaining important knowledge, experience and technical information, all of which will be valuable for current and future mixed RE Carbonate production and expected future production of separated REE oxides and other advanced REE materials at the Mill. As discussed above, the Company is evaluating installing a full separation circuit at the Mill to produce both “light” and “heavy” separated REE oxides in the coming years, subject to successful licensing, financing, and commissioning and continued strong market conditions, and has hired Carester to support these REE separation initiatives.
About Energy Fuels: Energy Fuels is a leading
U.S.-based uranium mining company, supplying U3O8 to
major nuclear utilities. The Company also produces vanadium from certain of its
projects, as market conditions warrant, and is ramping up to full
commercial-scale production of RE Carbonate. Its corporate offices are in Lakewood,
Colorado near Denver, and all its assets and employees are in the
United States. Energy Fuels holds three of America’s key uranium production
centers: the White Mesa Mill in Utah, the Nichols Ranch ISR Project
in Wyoming, and the Alta Mesa ISR Project in Texas. The White Mesa Mill
is the only conventional uranium mill operating in the U.S. today, has a
licensed capacity of over 8 million pounds of U3O8 per
year, and has the ability to produce vanadium when market conditions warrant,
as well as RE Carbonate from various uranium-bearing ores. The Nichols Ranch
ISR Project is currently on standby and has a licensed capacity of 2 million
pounds of U3O8 per
year. The Alta Mesa ISR Project is also currently on standby and has a
licensed capacity of 1.5 million pounds of U3O8 per
year. In addition to the above production facilities, Energy Fuels also has one
of the largest S-K 1300 and NI 43-101 compliant uranium resource portfolios in
the U.S. and several uranium and uranium/vanadium mining projects on standby
and in various stages of permitting and development. The primary trading market
for Energy Fuels’ common shares is the NYSE American under the trading symbol
“UUUU,” and the Company’s common shares are also listed on the
Toronto Stock Exchange under the trading symbol “EFR.” Energy Fuels’
website is www.energyfuels.com.
Cautionary Note Regarding Forward-Looking Statements: This
news release contains certain “Forward Looking Information” and
“Forward Looking Statements” within the meaning of applicable United
States and Canadian securities legislation, which may include, but are not
limited to, statements with respect to: production and sales forecasts; costs
of production; any expectation that the Company will be awarded any sales under
the U.S. Uranium Reserve; scalability, and the Company’s ability and readiness
to re-start, expand or deploy any of its existing projects or capacity to
respond to any improvements in uranium market conditions or in response to the
Uranium Reserve; any expectation as to future uranium, vanadium, RE Carbonate
or REE market fundamentals or sales; any expectation as to recommencement of
production at any of the Company’s uranium mines or the timing thereof; any
expectation regarding any remaining dissolved vanadium in the Mill’s tailings
facility solutions or the ability of the Company to recover any such vanadium
at acceptable costs or at all; any expectation as to the ability of the Company
to secure any new sources of Alternate Feed Materials or other processing
opportunities at the Mill; any expectation as to timelines for the permitting
and development of projects; any expectation as to longer term fundamentals in
the market and price projections; any expectation as to the implications of the
current Russian invasion of Ukraine on uranium, vanadium or other
commodity markets; any expectation that the Company will maintain its position
as a leading uranium company in the United States; any expectation
with respect to timelines to production; any expectation that the Mill
will be successful in producing RE Carbonate on a full-scale commercial basis;
any expectation that Neo will be successful in separating the Mill’s RE
Carbonate on a commercial basis; any expectation that Energy Fuels will be
successful in developing U.S. separation, or other value-added U.S. REE
production capabilities at the Mill, or otherwise, including the timing of any
such initiatives and the expected production capacity or capital and operating
costs associated with any such production capabilities; any expectation that
the Company will restore U.S. rare earth separation capabilities in the coming
years; any expectation with respect to the future demand for REEs; any
expectation with respect to the quantities of monazite sands to be acquired by
Energy Fuels, the quantities of RE Carbonate to be produced by the Mill or the
quantities of contained TREO in the Mill’s RE Carbonate; any expectation that
any additional supplies of monazite sands will result in sufficient throughput
at the Mill to reduce underutilized capacity production costs and allow the
Company to realize its expected margins on a continuous basis; any expectation
that the Company will close the acquisition of the Bahia Project as scheduled
or at all; any expectation that the Bahia Project has the potential to feed the
Mill with REE and uranium-bearing monazite sand for decades; any expectation
that the Company will complete comprehensive sonic drilling and geophysical
mapping at the Bahia Project or complete an Initial Assessment under SK-1300
(U.S.) and a Preliminary Economic Assessment under NI 43-101 (Canada) during
Q4-2022 or Q1-2023, or otherwise; any expectation that the Company’s evaluation
of thorium and radium recovery at the Mill will be successful; any expectation
that the potential recovery of medical isotopes from any thorium and radium
recovered at the Mill will be feasible; any expectation that any thorium,
radium and other isotopes can be recovered at the Mill and sold on a commercial
basis; any expectation as to the quantities to be delivered under existing
uranium sales contracts, or that such contracts may help underpin the Company’s
uranium business for many years to come; any expectation that the Company will
be successful in completing any additional contracts for the sale of uranium to
U.S. utilities; any expectation that any existing or potential future uranium
sales contracts will be at prices and quantities that provide an appropriate
rate of return or sustain production and cover corporate overhead; any
expectation that the value of the Company’s investments accounted for at fair
value may improve in future periods; and any expectation that the Company will
generate net income in future periods. Generally, these forward-looking
statements can be identified by the use of forward-looking terminology such as
“plans,” “expects,” “does not expect,” “is
expected,” “is likely,” “budgets,” “scheduled,”
“estimates,” “forecasts,” “intends,”
“anticipates,” “does not anticipate,” or
“believes,” or variations of such words and phrases, or state that
certain actions, events or results “may,” “could,”
“would,” “might” or “will be taken,”
“occur,” “be achieved” or “have the potential
to.” All statements, other than statements of historical fact, herein are
considered to be forward-looking statements. Forward-looking statements involve
known and unknown risks, uncertainties and other factors which may cause the actual
results, performance or achievements of the Company to be materially different
from any future results, performance or achievements express or implied by the
forward-looking statements. Factors that could cause actual results to differ
materially from those anticipated in these forward-looking statements include
risks associated with: commodity prices and price fluctuations; processing and
mining difficulties, upsets and delays; permitting and licensing requirements
and delays; changes to regulatory requirements; legal challenges; the
availability of sources of Alternate Feed Materials and other feed sources for
the Mill; competition from other producers; public opinion; government and
political actions; available supplies of monazite sands; the ability of the
Mill to produce RE Carbonate to meet commercial specifications on a commercial
scale at acceptable costs; the ability of Neo to separate the RE Carbonate
produced by the Mill to meet commercial specifications on a commercial scale at
acceptable costs; market factors, including future demand for REEs; the ability
of the Mill to be able to separate radium or other radioisotopes at reasonable
costs or at all; market prices and demand for medical isotopes; and the other
factors described under the caption “Risk Factors” in the Company’s
most recently filed Annual Report on Form 10-K, which is available for review
on EDGAR at www.sec.gov/edgar.shtml,
on SEDAR at www.sedar.com, and on
the Company’s website at www.energyfuels.com.
Forward-looking statements contained herein are made as of the date of this
news release, and the Company disclaims, other than as required by law, any
obligation to update any forward-looking statements whether as a result of new
information, results, future events, circumstances, or if management’s
estimates or opinions should change, or otherwise. There can be no assurance
that forward-looking statements will prove to be accurate, as actual results
and future events could differ materially from those anticipated in such
statements. Accordingly, the reader is cautioned not to place undue reliance on
forward-looking statements. The Company assumes no obligation to update the
information in this communication, except as otherwise required by law.
SOURCE Energy Fuels Inc.