Petrodollar Dusk, Petroyuan Dawn: What Investors Need To Know
While most investors were trying to gauge the Federal Reserve’s next moves in light of recent bank failures last week, something interesting happened in Moscow.
During a three-day state visit, Chinese President Xi Jinping held friendly talks with Russian President Vladimir Putin in a show of unity, as both countries increasingly seek to position themselves as leaders of what they call a “multipolar world order,” one that challenges U.S.-centric alliances and agreements.
Among those agreements is the petrodollar, which has been in place for over 50 years.
In case you’re wondering, “petrodollars” are not a real currency. They’re simply dollars being used to trade oil. Early in the 1970s, the U.S. government provided economic aid to Saudi Arabia, its chief oil-producing rival, in exchange for assurances that Riyadh would price its crude exports exclusively in the U.S. dollar. In 1975, other members of the Organization of Petroleum Exporting Countries (OPEC) followed suit, and the petrodollar was born.
This had the immediate effect of strengthening the U.S. dollar. Since countries around the world had to have dollars on hand in order to buy oil (and other key commodities such as gold, also priced in dollars), the greenback became the world’s reserve currency, a status formerly enjoyed by the British pound, French franc and Dutch guilder.
All things must come to an end, however. We may be witnessing the end of the petrodollar as more and more countries, including China and Russia, are agreeing to make settlements in currencies other than the U.S. dollar. This could have wide-ranging implications on not just a macro scale but also investment portfolios.
This article was republished with permission from Frank Talk, a CEO Blog by Frank Holmes of U.S. Global Investors (GROW). Find more of Frank’s articles here – Originally published March 27, 2023
Dawn For The Petroyuan?
Putin couldn’t have been more explicit. During Xi’s state visit, he named the Chinese yuan as his favored currency to conduct trade in. Ever since Western sanctions were levied on the Eastern European country for its invasion of Ukraine early last year, Russia has increasingly depended on its southern neighbor to buy the oil other countries won’t touch.
In just the first two months of 2023, China’s imports from Russia totaled $9.3 billion, exceeding full-year 2022 imports in dollar terms. In February alone, China imported over 2 million barrels of Russian crude, a new record high.
Except that now, the yuan is presumably being used to make these settlements.
As Zoltar Pozsar, New York-based economist and investment research director at Credit Suisse, put it recently: “That’s dusk for the petrodollar… and dawn for the petroyuan.”
U.S. Dollar Still The World’s Reserve Currency, But Its Dominance Is Slipping
Before you dismiss Pozsar’s comment as an exaggeration, consider that other major OPEC nations and BRICS members (Brazil, Russia, India, China and South Africa) are either accepting yuan already or strongly considering it. Russia, Iran and Venezuela account for about 40% of the world’s proven oilfields, and the three sell their oil in exchange for yuan. Turkey, Argentina, Indonesia and heavyweight oil producer Saudi Arabia have all applied for admittance into BRICS, while Egypt became a new member this week.
What this suggests is that the yuan’s role as a reserve currency will continue to strengthen, signifying a broader shift in the global power balance and potentially giving China a bigger hand with which to shape economic policies that affect us all.
To be clear, the U.S. dollar remains the world’s top reserve currency for now, though its share of global central banks’ official holdings has slipped in the past 20 years, from 72% in 2001 to just under 60% today. By contrast, the yuan’s share of official holdings has more than doubled since 2016. The Chinese currency accounted for about 2.8% of reserves as of September 2022.
Russia Diversifying Away From The Dollar By Loading Up On Gold
It’s not all about the yuan, of course. Gold has also increased as a foreign reserve, especially among emerging economies that seek to diversify away from the dollar.
Last week, Russia announced that its bullion holdings jumped by approximately 1 million ounces over the past 12 months as its central bank loaded up on gold in the face of Western sanctions. The bank reported having nearly 75 million ounces at the end of February 2023, up from about 74 million a year earlier.
Long-Term Implications For Investors
The implications of the dollar potentially losing its status as the global reserve are numerous. Obviously, there may be currency risks, and a decrease in demand for U.S. Treasury bonds could result in rising interest rates. I would expect to see massive swings in commodity prices, especially oil prices, which could be an opportunity if you can stomach the volatility.
Gold would look exceptionally attractive, I think. A significant decrease in the relative value of the dollar would be supportive of the gold price, and I would be surprised not to see new highs. It’s for reasons like these that I always recommend a 10% weighting in gold, with 5% in physical bullion and the other 5% in high-quality gold mining equities. Be sure to rebalance at least on an annual basis.
All opinions expressed and data provided are subject to change without notice. Some of these opinions may not be appropriate to every investor. By clicking the link(s) above, you will be directed to a third-party website(s). U.S. Global Investors does not endorse all information supplied by this/these website(s) and is not responsible for its/their content.
The building wave of M&A deals in at least two of the mining sectors, is difficult to ignore. This week, lithium miner Albemarle (ALB) disclosed it had submitted a proposal to acquire Liontown Resources (LTR.Australia). Last month Newmont Mining’s proposed acquisition of Newcrest Mining, highlighted the rising interest in M&A in the gold sector. To date, both proposals have been shunned, but as companies look to increase production, inflation increases producers capital outlays, plus long permitting processes, a case could be made that growth by acquisition, friendly or not, is becoming more appealing in the sector.
Typically growing demand to buy smaller companies in a sector puts upward pressure on valuations.
The gold and lithium sectors have mostly lead over the past six months in terms of deal-making. For gold, the largest driver is these miners remain undervalued by historical levels. The trend for lithium producers in the years ahead, as battery production ramps up to meet surging demand for electric storage and green technology, is expected to continue to accelerate.
The Price of lithium, key to batteries found in most EVs, over the years has risen. This created a situation where car manufacturers themselves have realized that the best way to ensure a key ingredient to their product is to own all or part of a large enough producer. Lithium producers are looking for ways to increase yield and own more production facilities. These factors could unfold into a situation where the stock prices of companies producing either of these two metals, and even other mined minerals with growing demand, could outperform other sectors.
Five Reasons to Explore Small Mining Companies
While the real heat is on producers of minerals used to make batteries and gold miners, the below supply/demand concepts may apply to an increased need for other miners to involve themselves in M&A as well.
New List of Acquirers – The big car companies, energy companies, and other additional industrial consumers are in need of reliable supply.
Cheaper to Buy than Find – M&A is a solution to the increased costs of growing organically. It also helps circumvent what could be permitting delays and supply chain problems that prevent headway.
Scale – Gold companies normally try to extract synergies when seeking to size up, while lithium producers seek pure scale.
Big Picture Economics – The economic environment favors miners if inflation remains elevated; the companies’ production is more likely to sell for more. The cost of money, on an opportunity cost basis, especially net of inflation (real interest) favors mining.
Finding Value – Informed stock selection is key to discover and invest in companies best positioned to benefit from swelling M&A in the sector.
The fifth on this list is less of a reason to explore mining companies and more a common sense reminder. Last week the Channelchek Take Away Series brought to viewers a live in-depth presentation of 12 mining companies that were just coming off the huge PDAC mining conference in Canada. These presentations are being replayed and may be just the place to begin to hear from company executives, and a highly respected senior natural resources analyst. Audience questions and answers follow.
The information on these on-demand replay videos is current, and as you’ll see by clicking here, the list of video presentations includes a diversified mix of producers and explorers.
CALGARY, AB, March 21, 2023 /CNW/ – Alvopetro Energy Ltd. (TSXV: ALV) (OTCQX: ALVOF) is pleased to announce a 17% increase in our quarterly dividend, to US$0.14 per common share, our financial results for the year ended December 31, 2022, filing of our annual information form, an automatic share repurchase plan, and an operational update.
All references herein to $ refer to United States dollars, unless otherwise stated and all tabular amounts are in thousands of United States dollars, except as otherwise noted.
President & CEO, Corey C. Ruttan commented:
“We are very pleased with our 2022 results, from revenues of $63.5 million we generated $49.9 million of funds flow from operations and net income of $31.7 million, increases of 82%, 102% and 467% respectively, year over year. This represents industry leading operating netback margins underpinning our disciplined capital allocation model that balances organic growth and stakeholder returns. Since commencing production from our Caburé project in 2020, we have repaid all outstanding debt and today’s announcement represents the third increase in our quarterly dividend since Q1 2022. With this, we will have already returned $22 million ($0.62/share) to shareholders in the form of dividends. We are also firmly focused on our next phase of growth and are looking forward to an exciting 2023 capital program.”
Quarterly Dividend Increased 17% to $0.14 per Share
Alvopetro is pleased to announce that our Board of Directors has approved a 17% increase in our quarterly dividend, to $0.14 per common share, payable in cash on April 14, 2023, to shareholders of record on March 31, 2023. This dividend is designated as an “eligible dividend” for Canadian income tax purposes.
Dividend payments to non-residents of Canada will be subject to withholding taxes at the Canadian statutory rate of 25%. Shareholders may be entitled to a reduced withholding tax rate under a tax treaty between their country of residence and Canada. For further information, see Alvopetro’s website at https://alvopetro.com/Dividends-Non-resident-Shareholders.
Operational Update
Our average daily sales have continued at strong rates in 2023, averaging 2,754 boepd in January and a new daily record of 2,866 boepd in February. Effective February 1, 2023, our natural gas price increased to BRL2.00/m3 and is effective for all natural gas sales from February 1 to July 31, 2023. Including recently approved and enhanced sales tax credits, our realized gas price, net of sales taxes, for the month of February was approximately $12.23/Mcf (based on our average heat content to date and the average February 2023 BRL/USD foreign exchange rate of 5.17).
On February 6, 2023, we announced our 2023 capital program, focused on lower risk development opportunities on our Murucututu natural gas project and our Bom Lugar oil field. We have commenced stimulation operations at our 197(1) well on Murucututu. The 197(1) well location has already been tied in to our 183(1) facility and we expect to commence production from the well in the second quarter. Following this stimulation, we plan to drill two follow-up wells at Murucututu, with one well having additional uphole exploration potential. We have budgeted total capital expenditures of $16 million for our Murucututu project in 2023.
On our Bom Lugar field, we plan to drill up to two development wells in 2023, targeting the Caruaçu Formation with additional potential in the deeper Gomo and Agua Grande Formations, the first of which is planned for the second quarter. Total capital expenditures of up to $11 million are budgeted at Bom Lugar.
Additional capital spending budgeted for 2023 includes $3 million on our Caburé field for the expansion of unit facilities and drilling two additional wells, $0.5 million at our Mãe-da-lua field for stimulation of the existing well and $0.4 million in capital expenditures at our 182-C2 and 183-B2 wells.
Automatic Share Repurchase Plan
In January 2023, we received approval from the TSX Venture Exchange (“TSXV”) for a normal course issuer bid (the “NCIB”) as more particularly described in our news release dated January 3, 2023. The terms of the NCIB permit Alvopetro to repurchase up to 2,876,414 common shares from January 6, 2023 to the earlier of January 5, 2024 or when the NCIB is completed or terminated by Alvopetro. No repurchases have been made under the NCIB to date.
Alvopetro intends to enter into an automatic share purchase plan (“ASPP”) with our designated broker, subject to the approval of the TSXV. The ASPP is intended to allow for the purchase of common shares under the NCIB at times when the Corporation may not ordinarily be permitted to purchase common shares due to regulatory restrictions and customary self-imposed blackout periods.
The ASPP is to be implemented upon TSXV approval and would allow the designated broker to purchase common shares pursuant to the proposed ASPP until the expiry of the NCIB on January 5, 2024. Such purchases will be determined by the broker at its sole discretion based on the purchasing parameters set out by the Corporation in accordance with the rules of the TSXV, applicable securities laws and the terms of the ASPP. The ASPP will terminate on the earlier of the date on which: (i) the NCIB expires; (ii) the maximum number of common shares have been purchased under the ASPP; and (iii) the Corporation terminates the ASPP in accordance with its terms.
Outside of the ASPP and outside of pre-determined blackout periods, common shares may continue to be purchased under the NCIB based on management’s discretion, in compliance with the rules of the TSXV and applicable securities laws. All purchases made under the ASPP will be included in the number of common shares available for purchase under the NCIB.
December 31, 2022 Reserves and Net Asset Value
On February 28, 2023, Alvopetro announced its December 31, 2022 reserves based upon the independent reserve assessment and evaluation prepared by GLJ Ltd. (“GLJ”) dated February 27, 2023 with an effective date of December 31, 2022 (the “GLJ Reserves and Resources Report”).
Key highlights from the GLJ Reserves and Resources Report1:
2P net present value before tax discounted at 10% (“NPV10”) increased 17% to $348.2 million.
Proved reserves (“1P”) decreased 12% to 3.9 MMboe and 2P reserves increased 3% to 9.0 MMboe after 0.9 MMboe of production in 2022.
2P production replacement ratio of 132%.
2P F&D costs of $28.66/boe.
2P recycle ratio of 2.1 times.
2P Net Asset Value of CAD$13.70/share ($9.99/share) before any potential from contingent or prospective resources.
Risked best estimate contingent resource of 2.9 MMboe (NPV10 $62.2 million) and risked best estimate prospective resource of 12.5 MMboe (NPV10 $259.1 million).
1 Refer to the section entitled “Oil and Natural Gas Advisories” for additional disclosures regarding oil and natural gas reserves, contingent resources and prospective resources. In addition refer to “Oil and – Natural Gas Advisories – Other Metrics” and “Non-GAAP and Other Financial Measures” for additional disclosures and assumptions used in calculating production replacement ratio, F&D costs, recycle ratio, net asset value and net asset value per share.
Financial and Operating Highlights – Fourth Quarter of 2022
Our average daily sales increased to a new quarterly record of 2,724 boepd (+3% from Q3 2022 and +12% from Q4 2021).
With natural gas sales in Q4 2022 continuing at the ceiling price in our contract, our average realized natural gas price was $11.18/Mcf (+58% from Q4 2021) and our average realized price per boe was $68.13 (+54% from Q4 2021). Higher realized prices and record daily sales volumes resulted in a 73% increase in our natural gas, condensate and oil revenue compared to Q4 2021.
Our operating netback was $60.08 per boe in Q4 2022, an improvement of $23.70 per boe from Q4 2021 (+65%) and $0.25 per boe from Q3 2022.
We generated funds flows from operations of $13.2 million ($0.36 per basic share and $0.35 per diluted share), an increase of $6.7 million compared to Q4 2021 and a decrease of $0.2 million compared to Q3 2022.
We reported net income of $5.2 million in Q4 2022, an increase of $2.4 million (+87%) compared to Q4 2021. Net income was impacted by impairment expense of $6.3 million recognized on exploration assets.
Capital expenditures totaled $5.9 million, including drilling and testing costs for our 182-C2 well, testing of the Unit-C well and facilities expenditures at the Caburé unit, testing costs for our 183-B1 well, development costs on our Murucututu project and long-lead purchases.
Our Q4 2022 dividend increased 50% to $0.12 per share. The Q4 2022 dividend was paid on January 13, 2023 to shareholders of record on December 30, 2022.
Our cash and working capital increased to $14.7 million, an improvement of $2.5 million compared to September 30, 2022 and an increase of $12.1 million compared to December 31, 2021 working capital net of debt of $2.6 million.
Financial and Operating Highlights – Year Ended December 31, 2022
Our annual sales averaged 2,557 boepd (95% natural gas, 4% NGLs from condensate and marginal crude oil production), an increase of 8% compared to 2021.
We reported net income of $31.7 million, compared to $5.6 million in 2021 (+467%).
We generated funds flow from operations of $49.9 million ($1.44 per basic share on $1.35 per diluted share) compared to $24.6 million in 2021 ($0.74 per basic share and $0.71 per diluted share).
Capital expenditures totaled $24.8 million in 2022.
In the third quarter of 2022, all outstanding warrants were exercised. Alvopetro received cash proceeds of $2.4 million and issued a total of 2,081,616 common shares on the exercise.
The credit facility was fully repaid in September 2022 and has been cancelled.
Dividends totaled $0.36 per share in 2022 compared to $0.12 per share in 2021 (+200%).
The following table provides a summary of Alvopetro’s financial and operating results for periods noted. The consolidated financial statements with the Management’s Discussion and Analysis (“MD&A”) are available on our website at www.alvopetro.com and will be available on the System for Electronic Document Analysis and Retrieval (SEDAR) website at www.sedar.com.
2022 Results Webcast
Alvopetro will host a live webcast to discuss 2022 financial results at 9:00 am Mountain time on Wednesday March 22, 2023. Details for joining the event are as follows:
The webcast will include a question and answer period. Online participants will be able to ask questions through the Zoom portal. Dial-in participants can email questions directly to socialmedia@alvopetro.com.
Annual Information Form
Alvopetro has filed its annual information form (“AIF”) with the Canadian securities regulators on SEDAR. The AIF includes the disclosure and reports relating to oil and gas reserves data and other oil and gas information required pursuant to National Instrument 51-101 of the Canadian Securities Administrators. The AIF may be accessed electronically at www.sedar.com.
Corporate Presentation
Alvopetro’s updated corporate presentation is available on our website at:
Alvopetro Energy Ltd.’svision is to become a leading independent upstream and midstream operator in Brazil. Our strategy is to unlock the on-shore natural gas potential in the state of Bahia in Brazil, building off the development of our Caburé natural gas field and our strategic midstream infrastructure.
Neither the TSX Venture Exchange nor its Regulation Services Provider (as that term is defined in the policies of the TSX Venture Exchange) accepts responsibility for the adequacy or accuracy of this news release.
Oil and Natural Gas Advisories
Oil and Natural Gas Reserves
The disclosure in this news release summarizes certain information contained in the GLJ Reserves and Resources Report but represents only a portion of the disclosure required under National Instrument 51-101 (“NI 51-101”). For additional details, see our news release dated February 28, 2023. Full disclosure with respect to the Company’s reserves as at December 31, 2022 is contained in the Company’s annual information form for the year ended December 31, 2022 which has been filed on SEDAR (www.sedar.com). All net present values in this press release are based on estimates of future operating and capital costs and GLJ’s forecast prices as of December 31, 2022. The reserves definitions used in this evaluation are the standards defined by the Canadian Oil and Gas Evaluation Handbook (COGEH) reserve definitions, are consistent with NI 51-101 and are used by GLJ. The net present values of future net revenue attributable to the Alvopetro’s reserves estimated by GLJ do not represent the fair market value of those reserves. Other assumptions and qualifications relating to costs, prices for future production and other matters are summarized herein. The recovery and reserve estimates of the Company’s reserves provided herein are estimates only and there is no guarantee that the estimated reserves will be recovered. Actual reserves may be greater than or less than the estimates provided herein. Possible reserves are those additional reserves that are less certain to be recovered than probable reserves. There is a 10% probability that the quantities actually recovered will equal or exceed the sum of proved plus probable plus possible reserves.
Contingent Resources
This news release discloses estimates of Alvopetro’s contingent resources and the net present value associated with net revenues associated with the production of such contingent resources as included in the GLJ Reserves and Resources Report. There is no certainty that it will be commercially viable to produce any portion of such contingent resources and the estimated future net revenues do not necessarily represent the fair market value of such contingent resources. Estimates of contingent resources involve additional risks over estimates of reserves. For additional details with respect to Alvopetro’s contingent resources evaluated as at December 31, 2022, see our news release dated February 28, 2023 and additional details contained in the Company’s annual information form for the year ended December 31, 2022 which has been filed on SEDAR (www.sedar.com).
Prospective Resources
This news release discloses estimates of Alvopetro’s prospective resources included in the GLJ Reserves and Resources Report. There is no certainty that any portion of the prospective resources will be discovered and even if discovered, there is no certainty that it will be commercially viable to produce any portion. Estimates of prospective resources involve additional risks over estimates of reserves. The accuracy of any resources estimate is a function of the quality and quantity of available data and of engineering interpretation and judgment. While resources presented herein are considered reasonable, the estimates should be accepted with the understanding that reservoir performance subsequent to the date of the estimate may justify revision, either upward or downward. For additional details with respect to Alvopetro’s prospective resources evaluated as at December 31, 2022, see our news release dated February 28, 2023 and additional details contained in the Company’s annual information form for the year ended December 31, 2022 which has been filed on SEDAR (www.sedar.com).
Other Metrics
This press release contains metrics commonly used in the oil and natural gas industry, which have been prepared by management, including “F&D costs”, “net asset value”, “net asset value per share”, “production replacement ratio” and “recycle ratio”. These terms do not have a standardized meaning and may not be comparable to similar measures presented by other companies, and therefore should not be used to make such comparisons.
“F&D costs” are reflected on a per barrel of oil equivalent and are calculated as the sum of capital expenditures in the current year plus the change in FDC for the period, divided by the change in reserves in the period, before current year production. The 2022 F&D costs are computed as follows:
“Net asset value” is based on the before tax net present value of the Company’s reserves as at December 31, 2022, discounted at 10% plus the Company’s net working capital balance as of December 31, 2022. Net working capital is a capital management measure. See “Non-GAAP and Other Financial Measures” below for further details.
“Net asset value per share” is based on the computation of net asset value divided by basic shares outstanding of 36,311,579 adjusted to Canadian dollars based on the foreign exchange rate on March 21, 2023.
“Production replacement ratio” is calculated as total reserve additions divided by current year production. Alvopetro’s 2P production replacement ratio in 2022 is calculated as:
“Recycle ratio” is calculated by dividing the 2022 operating netback by F&D costs per boe for the year. The Company’s 2022 recycle ratio is calculated as follows:
Management uses these oil and gas metrics for its own performance measurements and to provide shareholders with measures to compare our operations over time. Readers are cautioned that the information provided by these metrics, or that can be derived from the metrics presented in this press release, should not be relied upon for investment or other purposes.
Non-GAAP and Other Financial Measures
This news release contains references to various non-GAAP financial measures, non-GAAP ratios, capital management measures and supplementary financial measures as such terms are defined in National Instrument 52-112 Non-GAAP and Other Financial Measures Disclosure. Such measures are not recognized measures under GAAP and do not have a standardized meaning prescribed by IFRS and might not be comparable to similar financial measures disclosed by other issuers. While these measures may be common in the oil and gas industry, the Company’s use of these terms may not be comparable to similarly defined measures presented by other companies. The non-GAAP and other financial measures referred to in this report should not be considered an alternative to, or more meaningful than measures prescribed by IFRS and they are not meant to enhance the Company’s reported financial performance or position. These are complementary measures that are used by management in assessing the Company’s financial performance, efficiency and liquidity and they may be used by investors or other users of this document for the same purpose. Below is a description of the non-GAAP financial measures, non-GAAP ratios, capital management measures and supplementary financial measures used in this news release. For more information with respect to financial measures which have not been defined by GAAP, including reconciliations to the closest comparable GAAP measure, see the “Non-GAAP Measures and Other Financial Measures” section of the Company’s MD&A which may be accessed through the SEDAR website at www.sedar.com.
Non-GAAP Financial Measures
Operating netback
Operating netback is calculated as natural gas, oil and condensate revenues less royalties and production expenses. This calculation is provided in the “Operating Netback” section of the Company’s MD&A using our IFRS measures. The Company’s MD&A may be accessed through the SEDAR website at www.sedar.com. Operating netback is a common metric used in the oil and gas industry used to demonstrate profitability from operations.
Non-GAAP Financial Ratios
Operating netback per boe
Operating netback is calculated on a per unit basis, which is per barrel of oil equivalent (“boe”). It is a common non-GAAP measure used in the oil and gas industry and management believes this measurement assists in evaluating the operating performance of the Company. It is a measure of the economic quality of the Company’s producing assets and is useful for evaluating variable costs as it provides a reliable measure regardless of fluctuations in production. Alvopetro calculated operating netback per boe as operating netback divided by total sales volumes (barrels of oil equivalent). This calculation is provided in the “Operating Netback” section of the Company’s MD&A using our IFRS measures. The Company’s MD&A may be accessed through the SEDAR website at www.sedar.com. Operating netback is a common metric used in the oil and gas industry used to demonstrate profitability from operations on a per unit basis (boe).
Operating netback margin
Operating netback margin is calculated as operating netback per boe divided by the realized sales price per boe. Operating netback margin is a measure of the profitability per boe relative to natural gas, oil and condensate sales revenues per boe and is calculated as follows:
Funds Flow from Operations Per Share
Funds flow from operations per share is a non-GAAP ratio that includes all cash generated from operating activities and is calculated before changes in non-cash working capital, divided by the weighted the weighted average shares outstanding for the respective period. For the periods reported in this news release the cash flows from operating activities per share and funds flow from operations per share is as follows:
Capital Management Measures
Funds Flow from Operations
Funds flow from operations is a non-GAAP capital management measure that includes all cash generated from operating activities and is calculated before changes in non-cash working capital. The most comparable GAAP measure to funds flow from operations is cash flows from operating activities. Management considers funds flow from operations important as it helps evaluate financial performance and demonstrates the Company’s ability to generate sufficient cash to fund future growth opportunities. Funds flow from operations should not be considered an alternative to, or more meaningful than, cash flows from operating activities however management finds that the impact of working capital items on the cash flows reduces the comparability of the metric from period to period. A reconciliation of funds flow from operations to cash flows from operating activities is as follows:
Net Working Capital
Net working capital is computed as current assets less current liabilities. Net working capital is a measure of liquidity, is used to evaluate financial resources, and is calculated as follows:
Working Capital Net of Debt
Working capital net of debt is computed as net working capital surplus decreased by the carrying amount of the Credit Facility. Working capital net of debt is used by management to assess the Company’s overall financial position.
Supplementary Financial Measures
“Average realized natural gas price – $/Mcf” is comprised of natural gas sales as determined in accordance with IFRS, divided by the Company’s natural gas sales volumes.
“Average realized NGL – condensate price – $/bbl” is comprised of condensate sales as determined in accordance with IFRS, divided by the Company’s NGL sales volumes from condensate.
“Average realized oil price – $/bbl” is comprised of oil sales as determined in accordance with IFRS, divided by the Company’s oil sales volumes.
“Average realized price – $/boe” is comprised of natural gas, condensate and oil sales as determined in accordance with IFRS, divided by the Company’s total natural gas, condensate and oil sales volumes (barrels of oil equivalent).
“Royalties per boe” is comprised of royalties, as determined in accordance with IFRS, divided by the total natural gas, condensate and oil sales volumes (barrels of oil equivalent).
“Production expenses per boe” is comprised of production expenses, as determined in accordance with IFRS, divided by the total natural gas, condensate and oil sales volumes (barrels of oil equivalent).
BOE Disclosure
The term barrels of oil equivalent (“boe”) may be misleading, particularly if used in isolation. A boe conversion ratio of six thousand cubic feet per barrel (6 Mcf/bbl) of natural gas to barrels of oil equivalence is based on an energy equivalency conversion method primarily applicable at the burner tip and does not represent a value equivalency at the wellhead. All boe conversions in this news release are derived from converting gas to oil in the ratio mix of six thousand cubic feet of gas to one barrel of oil.
Forward-Looking Statements and Cautionary Language
This news release contains forward-looking information within the meaning of applicable securities laws. The use of any of the words “will”, “expect”, “intend” and other similar words or expressions are intended to identify forward-looking information. Forward–looking statements involve significant risks and uncertainties, should not be read as guarantees of future performance or results, and will not necessarily be accurate indications of whether or not such results will be achieved. A number of factors could cause actual results to vary significantly from the expectations discussed in the forward-looking statements. These forward-looking statements reflect current assumptions and expectations regarding future events. Accordingly, when relying on forward-looking statements to make decisions, Alvopetro cautions readers not to place undue reliance on these statements, as forward-looking statements involve significant risks and uncertainties. More particularly and without limitation, this news release contains forward-looking statements concerning plans relating to the Company’s operational activities, proposed exploration development activities and the timing for such activities, exploration and development prospects of Alvopetro, capital spending levels, future capital and operating costs, timing and taxation of dividends and plans for dividends in the future, plans for share repurchases under the NCIB and the duration of the NCIB, future production and sales volumes, the expected natural gas price, gas sales and gas deliveries under Alvopetro’s long-term gas sales agreement, the expected timing of production commencement from the 197(1) well, the proposed automatic share purchase plan, and projected financial results. Forward-looking statements are necessarily based upon assumptions and judgments with respect to the future including, but not limited to, expectations and assumptions concerning the timing of regulatory licenses and approvals, equipment availability, the success of future drilling, completion, testing, recompletion and development activities and the timing of such activities, the performance of producing wells and reservoirs, well development and operating performance, expectations regarding Alvopetro’s working interest and the outcome of any redeterminations, environmental regulation, including regulation relating to hydraulic fracturing and stimulation, the ability to monetize hydrocarbons discovered, the outlook for commodity markets and ability to access capital markets, foreign exchange rates, general economic and business conditions, forecasted demand for oil and natural gas, the impact of the COVID-19 pandemic, weather and access to drilling locations, the availability and cost of labour and services, the regulatory and legal environment and other risks associated with oil and gas operations. The reader is cautioned that assumptions used in the preparation of such information, although considered reasonable at the time of preparation, may prove to be incorrect. Actual results achieved during the forecast period will vary from the information provided herein as a result of numerous known and unknown risks and uncertainties and other factors. In addition, the declaration, timing, amount and payment of future dividends remain at the discretion of the Board of Directors. Although we believe that the expectations and assumptions on which the forward-looking statements are based are reasonable, undue reliance should not be placed on the forward-looking statements because we can give no assurance that they will prove to be correct. Since forward looking statements address future events and conditions, by their very nature they involve inherent risks and uncertainties. Actual results could differ materially from those currently anticipated due to a number of factors and risks. These include, but are not limited to, risks associated with the oil and gas industry in general (e.g., operational risks in development, exploration and production; delays or changes in plans with respect to exploration or development projects or capital expenditures; the uncertainty of reserve estimates; the uncertainty of estimates and projections relating to production, costs and expenses, reliance on industry partners, availability of equipment and personnel, uncertainty surrounding timing for drilling and completion activities resulting from weather and other factors, changes in applicable regulatory regimes and health, safety and environmental risks), commodity price and foreign exchange rate fluctuations, market uncertainty associated with financial institution instability, and general economic conditions. The reader is cautioned that assumptions used in the preparation of such information, although considered reasonable at the time of preparation, may prove to be incorrect. Although Alvopetro believes that the expectations and assumptions on which such forward-looking information is based are reasonable, undue reliance should not be placed on the forward-looking information because Alvopetro can give no assurance that it will prove to be correct. Readers are cautioned that the foregoing list of factors is not exhaustive. Additional information on factors that could affect the operations or financial results of Alvopetro are included in our annual information form which may be accessed on Alvopetro’s SEDAR profile at www.sedar.com. The forward-looking information contained in this news release is made as of the date hereof and Alvopetro undertakes no obligation to update publicly or revise any forward-looking information, whether as a result of new information, future events or otherwise, unless so required by applicable securities laws.
Three Reasons the Willow Arctic Oil Drilling Project Was Approved
For more than six decades, Alaska’s North Slope has been a focus of intense controversy over oil development and wilderness protection, with no end in sight. Willow field, a 600-million-barrel, US$8 billion oil project recently approved by the Biden administration – to the outrage of environmental and climate activists – is the latest chapter in that long saga.
To understand why President Joe Biden allowed the project, despite vowing “no more drilling on federal lands, period” during his campaign for president, some historical background is necessary, along with a closer look at the ways domestic and international fears are complicating any decision for or against future oil development on the North Slope.
More Than Just Willow
The Willow project lies within a vast, 23 million-acre area known as the National Petroleum Reserve-Alaska, or NPR-A. This was one of four such reserves set aside in the early 1900s to guarantee a supply of oil for the U.S. military. Though no production existed at the time in NPR-A, geologic information and surface seeps of oil suggested large resources across the North Slope.
This article was republished with permission from The Conversation, a news site dedicated to sharing ideas from academic experts. It represents the research-based findings and thoughts of, Scott L. Montgomery, Lecturer, Jackson School of International Studies, University of Washington.
Proof came with the 1968 discovery of the supergiant Prudhoe Bay field, which began producing oil in 1977. Exploratory programs in the NPR-A, however, found only small oil accumulations worthy of local uses.
Then, in the 2000s, new geologic understanding and advanced exploration technology led companies to lease portions of the reserve, and they soon made large fossil fuel discoveries. Because NPR-A is federal land, government approval is required for any development. To date, most have been approved. Willow is the latest.
Caribou in the National Petroleum Reserve-Alaska are important for Native groups. However, Native communities have also been split over support for drilling, which can bring income. Bob Wick/Bureau of Land Management
Caribou in the National Petroleum Reserve-Alaska are important for Native groups. However, Native communities have also been split over support for drilling, which can bring income. Bob Wick/Bureau of Land Management
Opposition to North Slope drilling from conservationists, environmental organizations and some Native communities, mainly in support of wilderness preservation, has been fierce since the opening of Prudhoe Bay and the construction of the Trans-Alaska Pipeline in the 1970s. In the wake of 1970s oil crises, opponents failed to stop development.
During the next four decades, controversy shifted east to the Arctic National Wildlife Refuge. Republican presidents and congressional leaders repeatedly attempted to open the refuge to drilling but were consistently stifled – until 2017. That year, the Trump administration opened it to leasing. Ironically, no companies were interested. Oil prices had fallen, risk was high and the reputational cost was large.
To the west of the refuge, however, a series of new discoveries in NPR-A and adjacent state lands were drawing attention as a major new oil play with multibillion-barrel potential. Oil prices had risen, and though they fell again in 2020, they have been mostly above $70 per barrel – high enough to encourage significant new development.
ConocoPhillips’ Willow project is in the northeast corner of the National Petroleum Reserve-Alaska. USGS, Department of Interior
Opposition, with Little Success
Opposition to the new Willow project has been driven by concerns about the effects of drilling on wildlife and of increasing fossil fuel use on the climate. Willow’s oil is estimated to be capable of releasing 287 million metric tons of carbon dioxide if refined into fuels and consumed.
In particular, opponents have focused on a planned pipeline that will extend the existing infrastructure further westward, deeper into NPR-A, and likely encourage further exploratory drilling.
So far, that resistance has had little success.
Twenty miles to the south of Willow is the Peregrine discovery area, estimated to hold around 1.6 billion barrels of oil. Its development was approved by the Biden administration in late 2022. To the east lies the Pikka-Horseshoe discovery area, with around 2 billion barrels. It’s also likely to gain approval. Still other NPR-A drilling has occurred to the southwest (Harpoon prospect), northeast (Cassin), and southeast (Stirrup).
One reason the Biden administration approved the Willow project involves legality: ConocoPhillips holds the leases and has a legal right to drill. Canceling its leases would bring a court case that, if lost, would set a precedent, cost the government millions of dollars in fees and do nothing to stop oil drilling.
Instead, the government made a deal with ConocoPhillips that shrank the total surface area to be developed at Willow by 60%, including removing a sensitive wildlife area known as Teshekpuk Lake. The Biden administration also announced that it was putting 13 million acres of the NPR-A and all federal waters of the Arctic Ocean off limits to new leases.
That has done little to stem anger over approval of the project, however. Two groups have already sued over the approval.
Taking Future Risks into Account
To further understand Biden’s approval of the Willow project, one has to look into the future, too.
Discoveries in the northeastern NPR-A suggest this will become a major new oil production area for the U.S. While actual oil production is not expected there for several years, its timing will coincide with a forecast plateau or decline in total U.S. production later this decade, because of what one shale company CEO described as the end of shale oil’s aggressive growth.
Historically, declines in domestic supply have brought higher fuel prices and imports. High gasoline and diesel prices, with their inflationary impacts, can weaken the political party in power. While current prices and inflation haven’t damaged Biden and the Democrats too much, nothing guarantees this will remain the case.
Geopolitical Concerns, Particularly Europe
The Biden administration also faces geopolitical pressure right now due to Russia’s war on Ukraine.
U.S. companies ramped up exports of oil and natural gas over the past year to become a lifeline for Europe as the European Union uses sanctions and bans on Russian fossil fuel imports to try to weaken the Kremlin’s ability to finance its war on Ukraine. U.S. imports have been able to replace a major portion of Russian supply that Europe once counted on.
Europe’s energy crisis has also led to the return of energy security as a top concern of national leaders worldwide. Without a doubt, the crisis has clarified that oil and gas are still critical to the global economy. The Biden administration is taking the position that reducing the supply by a significant amount – necessary as it is to avoid damaging climate change – cannot be done by prohibition alone. Halting new drilling worldwide would drive fuel prices sky high, weakening economies and the ability to deal with the climate problem.
Energy transitions depend on changes in demand, not just supply. As an energy scholar, I believe advancing the affordability of electric vehicles and the infrastructure they need would do much more for reducing oil use than drilling bans. Though it may seem counterintuitive, by aiding European economic stability, U.S. exports of fossil fuels may also help the EU plan to accelerate noncarbon energy use in the years ahead.
InPlay Oil is a junior oil and gas exploration and production company with operations in Alberta focused on light oil production. The company operates long-lived, low-decline properties with drilling development and enhanced oil recovery potential as well as undeveloped lands with exploration possibilities. The common shares of InPlay trade on the Toronto Stock Exchange under the symbol IPO and the OTCQX Exchange under the symbol IPOOF.
Michael Heim, CFA, Senior Research Analyst, Noble Capital Markets, Inc.
Refer to the full report for the price target, fundamental analysis, and rating.
Results demonstrate strong growth, generally meeting expectations. Annual production volumes came in at the lower end of guidance but 58% above last year. Higher production levels in the area may be beginning to show signs of affecting takeaway capacity (see third party curtailment and widening basis discount differentials). Weak summer natural gas prices bounced back nicely in the fourth quarter.
Drilling is accelerating and creating higher producing wells. The company drilled 17.5 net wells in 2022 surpassing our 15 well estimate. Management reports that initial production rates for recent wells were “significantly above internal expectations”. InPlay has been shifting towards longer horizontal laterals and spending more on infrastructure. Production increases seem to justify the higher costs. Management believes the steps it is taking will offset recent curtailments and reiterated 2023 production guidance.
Equity Research is available at no cost to Registered users of Channelchek. Not a Member? Click ‘Join’ to join the Channelchek Community. There is no cost to register, and we never collect credit card information.
This Company Sponsored Research is provided by Noble Capital Markets, Inc., a FINRA and S.E.C. registered broker-dealer (B/D).
*Analyst certification and important disclosures included in the full report. NOTE: investment decisions should not be based upon the content of this research summary. Proper due diligence is required before making any investment decision.
Largo has a long and successful history as one of the world’s preferred vanadium companies through the supply of its VPURE™ and VPURE+™ products, which are sourced from one of the world’s highest-grade vanadium deposits at the Company’s Maracás Menchen Mine in Brazil. Aiming to enhance value creation at Largo, the Company is in the process of implementing a titanium dioxide pigment plant using feedstock sourced from its existing operations in addition to advancing its U.S.-based clean energy division with its VCHARGE vanadium batteries. Largo’s VCHARGE vanadium batteries contain a variety of innovations, enabling an efficient, safe and ESG-aligned long duration solution that is fully recyclable at the end of its 25+ year lifespan. Producing some of the world’s highest quality vanadium, Largo’s strategic business plan is based on two pillars: 1.) leading vanadium supplier with an outlined growth plan and 2.) U.S.-based energy storage business support a low carbon future.
Michael Heim, CFA, Senior Research Analyst, Noble Capital Markets, Inc.
Refer to the full report for the price target, fundamental analysis, and rating.
Sales and realized prices were down. Production volumes (preannounced) fell 31% q-t-q due to maintenance and rain. Realized vanadium prices fell 12% with Largo prices falling below benchmark prices due to a drop in ferrovanadium prices and timing factors associated with contract deliveries.
Costs were up. Operating costs continued to rise in the fourth quarter. The change in cost per unit produced was especially noteworthy as production levels dropped. Management has put a priority on controlling operating costs and expects costs in future quarters to decline. Non-operating cost remain high, although they have eased since the third quarter.
Equity Research is available at no cost to Registered users of Channelchek. Not a Member? Click ‘Join’ to join the Channelchek Community. There is no cost to register, and we never collect credit card information.
This Company Sponsored Research is provided by Noble Capital Markets, Inc., a FINRA and S.E.C. registered broker-dealer (B/D).
*Analyst certification and important disclosures included in the full report. NOTE: investment decisions should not be based upon the content of this research summary. Proper due diligence is required before making any investment decision.
Which Way is Oil Going, and What it Could Mean for Investors in Related Sectors
Whether the sudden and severe decline in oil prices is an opportunity to invest in sectors that will benefit from cheaper fuel, a sign of further problems in the economy, or transitory, remains to be seen. It may depend on two overriding factors – and there are strong arguments supporting each. Below we look at the different scenarios and the sectors that are impacted.
Background
Energy futures and oil-related stocks like Chevron (CVX) and Exxon (XOM) gapped down at the open two days this week as concern about the overall health of the financial sector as two banks were closed and a major rating agency downgraded the banking sector Since Friday. U.S. oil futures remained below $70 per barrel midweek, as prices of WTI have now dipped 13% to levels not seen since December 2021.
These downward price moves are a reaction to thinking that demand will wane in a slowing U.S. economy. Also that it may take longer for the Chinese economy to rise to expected levels. Although far less impactful, approval of the Willow oil drilling project by the White House demonstrates a reversal of the ‘no more drilling’ policy by this administration.
A report by the International Energy Agency (IEA) this morning suggests the price decline may be temporary. The IEA anticipates that the oil markets will switch from a supply overhang in the first half of 2023 to a deficit later in the year. This is expected as OPEC continues its plan to cut production, and that the increased air traffic, along with an economic rebound in China will push global oil demand to a record high, according to the IEA.
Image: President Joe Biden meets with staff in the Oval Office, Monday, January 23, 2023, to discuss the Willow oil project. (Official White House Photo by Cameron Smith)
Oil remains one of the most crucial commodities to the modern world. Its price has a significant impact on various industries and investment sectors. Below are the sectors that stand to benefit if the recent decline in prices remains intact or declines further:
Transportation Industry is a significant beneficiary of lower oil prices. The reason of course is because fuel costs are a significant expense for airlines, trucking, and shipping companies. When the cost of fuel follows the decline, the transportation industry enjoys a reduction in operating costs. This can result in wider margins on tickets sold for air travel, lower shipping costs for businesses including retailers, and lower prices for cruise lines.
The Chemical Industry is another sector that benefits from declining oil prices. Many chemicals are derived from crude oil, and a decrease in oil prices means a decrease in the cost of raw materials. This, in turn, can lead to lower prices for chemical products such as fertilizers, plastics, and other materials.
The Consumer Goods Industry is also a significant beneficiary of declining oil prices. This is because many consumer goods are made from oil-based materials such as plastics, rubber, and synthetic fabrics. When oil prices decline, the cost of these materials decreases, resulting in lower production costs and, ultimately, lower prices for consumers.
The Renewable Energy Industry is not directly related to oil prices, a decline in oil prices can benefit this sector indirectly. Renewable energy sources such as wind and solar power are becoming increasingly competitive with traditional fossil fuels, and a decrease in the price of oil can make it more challenging for the fossil fuel industry to compete. This can result in increased investment in renewable energy and a shift toward cleaner, more sustainable sources of energy.
Emerging Markets, particularly those that are oil-importing countries, can benefit significantly from declining oil prices. These countries rely heavily on imported oil, and a decrease in oil prices can result in significant cost savings for these countries. This can lead to increased economic growth, as businesses have more money to invest in other areas and consumers have more disposable income to spend.
Take Away
Oil has dropped considerably this year. This is in part because economic activity is expected to become lower, and problems in the banking sector. This may not last through the year as indicated by the IEA. Others believe this is the start of further declines. Should oil prices not track higher, stock market investors could look at the transportation, chemical, and consumer goods industries, as well as the renewable energy sector and emerging markets. As with any economic change, it is essential to carefully analyze the potential effects on different industries and sectors to make informed investment decisions.
All dollar amounts expressed are in thousands of U.S. dollars unless otherwise indicated.
Q4 & Full Year 2022 Highlights
Revenues of $47.5 million in Q4 2022, 6% below Q4 2021; Revenues per pound sold1 of $7.77 in Q4 2022, largely in line with $7.88 recognized in Q4 2021
Operating costs of $44.5 million in Q4 2022 vs. $37.7 million in Q4 2021, and cash operating costs excluding royalties per pound1 of V2O5 equivalent sold of $5.15 in Q4 2022 vs. $3.68 in Q4 2021
Net loss of $15.6 million in Q4 2022 vs. net income of $1.0 million in Q4 2021; Basic loss per share of $0.24 in Q4 2022 vs. basic earnings per share of $0.01 in Q4 2021
In Q4 2022, the Company’s net loss included approximately $6.3 million of non-recurring expenditures
Revenues of $229.3 million in 2022, a 16% increase over 2021; Revenues per pound sold1 of $9.38 in 2022, a 19% increase over 2021
Operating costs of $169.7 million in 2022 vs. $133.0 million in 2021, and cash operating costs excluding royalties per pound1 of V2O5 equivalent sold of $4.57 in 2022 vs. $3.37 in 2021; 2% above upper range of revised 2022 guidance for cash operating costs excluding royalties per pound1
Net loss of $2.2 million in 2022 vs. net income of $22.6 million in 2021; Basic loss per share of $0.03 in 2022 vs. basic earnings per share of $0.35 in 2021
In 2022, the Company’s net loss included approximately $15.0 million of non-recurring expenditures
V2O5 production of 2,004 tonnes in Q4 2022 vs. 2,003 tonnes in Q4 2021; Annual V2O5 production of 10,436 tonnes in 2022 vs. 10,319 tonnes in 2021 and 6% below lower range of revised production guidance
Quarterly sales of 2,772 tonnes of V2O5 equivalent (inclusive of 118 tonnes of purchased material) in Q4 2022 vs. 2,899 tonnes in Q4 2021; Annual V2O5 equivalent sales of 11,091 (inclusive of 1,057 tonnes of purchased material) tonnes in 2022 vs. 11,393 tonnes in 2021 and within revised sales guidance of 11,000 – 12,000 tonnes
Vanadium Price Update2
The average benchmark price per pound of V2O5 in Europe was $8.25 in Q4 2022, being largely in line with the average of $8.23 seen in Q3 2022 and $8.30 in Q4 2021; The average benchmark price as of March 3, 2023 was $10.78, a 44% increase from the lows of 2022
The average benchmark price per kg of ferrovanadium (“FeV”) in Europe was $33.35 in Q4 2022, a 3% decrease from the average of $32.29 seen in Q4 2021; The average FeV benchmark price as of March 3, 2023 was $40.88, a 30% increase from the lows of 2022
TORONTO–(BUSINESS WIRE)– Largo Inc. (“Largo” or the “Company“) (TSX: LGO) (NASDAQ: LGO) today released financial and operating results for the three and twelve months ended December 31, 2022. The Company reported annual vanadium pentoxide (“V2O5”) equivalent sales of 11,091 tonnes at a cash operating cost excluding royalties per pound1 sold of $4.58. Revenues in 2022 increased 16% over 2021 to $229.3 million mainly due to a strengthening of vanadium prices in the year.
Daniel Tellechea, Interim CEO and Director of Largo, stated: “For Largo, 2022 was a challenging year, which led to an underperformance on both production and cost metrics, particularly in Q4 2023 with the mining disruption caused by record rainfall at our mine, cost inflation of key raw materials and sizeable non-recurring expenditures. Although we continue to navigate an inflationary environment, we anticipate delivering and capitalizing on a 10% increase in production for 2023 over 2022, particularly with the recent strengthening of vanadium prices.” He continued: “This recent increase is due in part to increased demand from the energy storage sector, especially in China, where new vanadium redox flow battery (“VRFB”) deployments totaling around 2 GWh or approximately 10% of global vanadium output are planned for the next 12-24 months.Importantly, the VRFB sector accounted for the second largest source of vanadium demand outside of the steel sector in Q3 2022, according to Vanitec, a global vanadium organization. Other key markets including steel, aerospace, and chemical have also shown considerable demand growth in recent months.”
He continued: “As for growth plans this year, Largo’s ilmenite project remains on track and is expected to generate a new source of revenue for the Company. We anticipate providing guidance on ilmenite production for 2023 once commissioning of the plant has been completed. We continue to make progress on the installation of our first VRFB in Spain and our negotiations toward the formation of a joint venture with Ansaldo Green Tech (“Ansaldo”) for the deployment of VRFBs in the Europe, Middle East and Africa power generation markets. Lastly, safety and sustainability remain key priorities for Largo and we are pleased to be recently ranked in the top quartile of our peer group as measured by certain ESG rating agencies for 2022.”
Q4 & Full Year 2022 Financial Results Overview
During 2022, the Company recognized revenues of $229.3 million from sales of 11,091 tonnes of V2O5 equivalent (2021 – 11,393 tonnes). This represents a 16% increase in revenues over 2021 ($198.3 million) mainly due to higher vanadium prices in the year, particularly with revenues recognized in Q2 2022. During Q4 2022, the Company recognized revenues of $47.5 million (Q4 2021 – $50.3 million) from sales of 2,772 tonnes of V2O5 equivalent (Q4 2021 – 2,899 tonnes).
Operating costs of $169.7 million in 2022 (2021 – $133.0 million) include direct mine and production costs of $94.5 million (2021 – $75.1 million), conversion costs of $8.1 million (2021 – $9.3 million), product acquisition costs of $24.4 million (2021 –$9.7 million), royalties of $10.4 million (2021 – $8.9 million), distribution costs of $9.2 million (2021 – $5.3 million), inventory write-down of $2.3 million (2021 – $3.2 million), depreciation and amortization of $20.9 million (2021 – $21.5 million) and iron ore costs of $1.0 million (2021 – $0.05 million), partially offset by insurance proceeds of $1.0 million (2021 – $nil).
Operating costs of $44.5 million in Q4 2022 (Q4 2021 – $37.7) include direct mine and production costs of $28.4 million (Q4 2021 – $21.4 million), conversion costs of $2.2 million (Q4 2021 – $2.6 million), product acquisition costs of $3.8 million (Q4 2021 – $1.0 million), royalties of $2.1 million (Q4 2021 – $2.3 million), distribution costs of $2.3 million (Q4 2021 – $1.5 million), inventory write-down of $0.4 million (Q4 2021 – $3.2 million), depreciation and amortization of $6.0 million (Q4 2021 – $5.8 million) and iron ore costs of $0.02 million (Q4 2021 – $nil), partially offset by insurance proceeds of $1.0 million (Q4 2021 – $nil).
The increases in direct mine and production costs are attributable to a decrease in the global recovery5, cost increases in critical consumables, including heavy fuel oil (“HFO”) and ammonium sulfate, as well as increased consumption of these critical consumables and sodium carbonate. Costs were further impacted by the Company’s mining contractor transition in Q3 2022 and corrective maintenance in the plant throughout the year. Higher costs of production in the current and previous periods in the year related to shutdowns caused by abnormally high rainfall during Q4 2022, while corrective maintenance continued to impact operating costs as a result of the time between production and sales.
Cash operating costs excluding royalties per pound1 of V2O5 equivalent soldwere $4.57 in 2022, compared with $3.37 in 2021. Cash operating costs excluding royalties per pound1 sold were $5.15 in Q4 2022, compared with $3.68 in Q4 2021. The increase seen in Q4 2022 and 2022 compared with Q4 2021 and 2021 is largely due to the impacts noted previously, in addition to produced V2O5 equivalent sold having decreased in 2022 as compared with 2021, with 10,034 tonnes sold versus 10,864 tonnes.
Professional, consulting and management fees were $25.3 million in 2022, compared with $17.9 million in 2021. Professional, consulting and management fees were $5.7 million in Q4 2022, compared with $5.6 million in Q4 2021. For 2022, the increase is primarily attributable to costs incurred earlier in the year in connection with LCE, which was not fully operational earlier in 2021 and transaction and listing related costs incurred by Largo Physical Vanadium Corp. (“LPV”) in connection with the completion of its qualifying transaction.
Other general and administrative expenses were $14.3 million in 2022, compared with $6.4 million in 2021. Other general and administrative expenses were $3.5 million in Q4 2022, compared with $2.3 million in Q4 2021. For 2022, the increase is primarily due to an increase in provisions as well as costs incurred in Q4 2022 in connection with LPV, and in Largo Clean Energy Corp. (“LCE”) which has scaled up activities throughout 2022. The increase in provisions relates to a supply agreement for the Maracás Menchen Mine which was filed with Brazilian courts in October 2014. The ruling requires the Company to pay amounts due, plus interest and legal fees.
Technology start-up costs were $12.7 million in 2022 (2021 – $3.8 million) and $8.2 million in Q4 2022 (Q4 2021 – 3.1 million). This includes a full write-down of battery components inventory at LCE of $6.4 million (Q4 2022 and 2022) (Q4 2021 and 2021 – $nil) to their expected net realizable value. Technology start-up costs relate to LCE’s activities related to ramping up its operations for the deployment of the VCHARGE VRFB system and the titanium project in Brazil.
Finance costs in Q4 2022 increased from Q4 2021 by 118% (or $0.4 million), which is attributable to increased debt, as well as the initial financing fees on the Company’s new debt facilities.
For 2022, cash provided by financing activities increased from cash used in financing activities in 2021 by $33.3 million. The movement is primarily attributable to the receipt of debt of $55.0 million and cash received from the sale of non-controlling interest of $7.3 million (2021 – $nil), partially offset by the repayment of debt of $30.0 million (2021 – $24.8 million) and share repurchases of $6.0 million. Cash provided by financing activities in Q4 2022 increased from cash used in financing activities in Q4 2021 by $24.1 million. This movement was primarily due to the receipt of new debt of $40.0 million, partially offset by a repayment of debt of $15.0 million.
Cash used in investing activities in Q4 2022 of $26.8 million is an increase of $19.8 million from the $7.0 million seen in Q4 2021. This movement was primarily driven by the purchase of vanadium assets and continued work on the ilmenite project. For 2022, the increase from 2021 was $32.7 million. Expenditures in 2022 primarily relate to the ilmenite project, mining equipment, costs relating to a software implementation and cash outflows for purchased product vanadium assets.
Additional Company Updates
Q4 and Full Year 2022 Operational Results: Production of 2,004 tonnes of V2O5 in Q4 2022 was in line with the 2,003 tonnes of V2O5 produced in Q4 2021, primarily due to reduced massive ore inventory arising from the transition in mining contractors in Q3 2022 and due to unusually heavy rainfall in December 2022. In Q4 2022, the Company produced 839 V2O5 equivalent tonnes of high purity products, including 650 tonnes of high purity V2O5 and 189 tonnes of high purity vanadium trioxide (“V2O3”). This represented 42% of the total quarterly production. In 2022, the Company produced 1,801 V2O5 equivalent tonnes of high purity products, including 1,368 tonnes of high purity V2O5 and 433 tonnes of high purity V2O3. In Q4 2022, 326,552 tonnes of ore were mined with an effective grade4 of 0.96% of V2O5. The ore mined in Q4 2022 was 18% higher than in Q4 2021. The Company produced 90,797 tonnes of concentrate with an effective grade4 of 2.94%. The global recovery5 achieved in Q4 2022 was 74.7%, a decrease of 1.7% from the 76.0% achieved in Q4 2021 and 7.4% lower than the 80.7% achieved in Q3 2022. The global recovery5 in October 2022 was 75.0%, with 67.8% achieved in November 2022 and 80.8% achieved in December 2022.
Continued Focus on ESG in 2022: The Company continued to improve its overall Environmental, Social and Governance (“ESG”) performance and public disclosures in 2022. This is reflected in additional improved ratings and scores, most notably its S&P Global Corporate Sustainability Assessment (“CSA”) rating having improved approximately 38%, placing the Company in the top quartile of its mining peer group for 2022. This improvement was largely driven by updates to Largo’s governance of ESG, including new policies, ESG oversight at the Board level and climate-related disclosures, as well as improved responses related to the Company’s on-going environmental compliance in Brazil. The Company expects to issue its 2022 sustainability report in late Q2 2023.
Largo Clean Energy Recent Developments: During Q4 2022, LCE continued to make significant progress on the delivery of the Enel Green Power España (“EGPE”) contract, which remains a priority focus. Substantially all the hardware is either in transit to or is in Spain awaiting installation. The Company shipped the remaining six of 12 electrolyte storage containers in early 2023 and the Field Service team has been on site in Q1 2023 and work is ongoing to install and interconnect the AC and DC power systems. Provisional acceptance, which requires the completion of as-build drawings, manuals, final punch-list items, and operational testing by EGPE, is expected to be completed by the end of May 2023. Additionally, LCE and Ansaldo continue to focus on the formation of a joint venture for the manufacturing and commercial deployment of VRFBs in the European, African and Middle East power generation markets. The Company’s previously announced memorandum of understanding (“MOU”) has been extended to March 31, 2023, to allow for the negotiation and entering into a joint venture and other ancillary agreements. Ansaldo and LCE continue to develop a business path for the joint venture to service the European markets with Long Duration Energy Storage (“LDES”).
Ilmenite Concentration Plant Progress: The Company progressed with the construction of its ilmenite concentration plant at its Maracás Menchen Mine in Q4 2022. The Company received all required flotation structures and is finalizing the building of its desliming, flotation, filtration, warehouse and pipe rack structures ands expects commissioning of the plant to be completed in Q2 2023.
January and February 2023 Production and Sales: Subsequent to Q4 2022, the Company produced 354 tonnes of V2O5 in January and 843 tonnes in February. The Company also sold 1,080 tonnes of V2O5 equivalent (including 68 tonnes of purchased material) in January 2023 and 750 tonnes (including 11 tonnes of purchased material) in February. Production in January and February was largely impacted by low ore availability in due to the heavy rains at the mine site and planned maintenance of the kiln for its refractory refurbishment, with sales in February being impacted by a delay in sales recognition. The Company expects to remain within its quarterly production and sales guidance for Q1 2023.
Largo Physical Vanadium Update: LPV’s net assets are now over 90% held in physical vanadium products and near-term delivery commitments (approximately 2.9 million lbs of V2O5 equivalent). The launch of LPV in September 2022 coincided with lower vanadium prices, which allowed LPV to purchase vanadium units at favorable market prices. LPV’s net asset value (“NAV”) is now C$2.56 per share or 28% above the closing share price of C$2.00 per share on March 8, 2023. LPV believes its NAV to share price discount offers current and new LPV investors an attractive investment case and closing this disconnect is now LPV’s key focus. LPV management are working on a broad marketing and communication campaign to raise awareness of its investment proposal.
Director Resignation: Following the Company’s previously announced leadership change on February 16, 2023, Mr. Paulo Misk has resigned from his position as a Director of the Company effective March 7, 2023.
Annual 2022 Webcast and Conference Call Information
The Company will host a webcast and conference call on Friday, March 10, 2023, at 1:00 p.m. ET, to discuss its fourth quarter and annual 2022 results and progress.
Details of the webcast and conference call are listed below:
To join the conference call without operator assistance, you may register and enter your phone number at https://bit.ly/3Yho3fJ to receive an instant automated call back.
You can also dial direct to be entered to the call by an Operator via dial-in details below.
A playback recording will be available on the Company’s website for a period of 60-days following the conference call.
The information provided within this release should be read in conjunction with Largo’s annual consolidated financial statements for the years ended December 31, 2022 and 2021 and its management’s discussion and analysis for the year ended December 31, 2022 which are available on our website at www.largoinc.com or on the Company’s respective profiles at www.sedar.com and www.sec.gov.
About Largo
Largo has a long and successful history as one of the world’s preferred vanadium companies through the supply of its VPURETM and VPURE+TM products, which are sourced from one of the world’s highest-grade vanadium deposits at the Company’s Maracás Menchen Mine in Brazil. Aiming to enhance value creation at Largo, the Company will be implementing a titanium dioxide pigment plant using feedstock sourced from its existing operations in addition to advancing its U.S.-based clean energy division with its VCHARGE vanadium batteries. Largo’s VCHARGE vanadium batteries contain a variety of innovations, enabling an efficient, safe and ESG-aligned long duration solution that is fully recyclable at the end of its 25+ year lifespan. Producing some of the world’s highest quality vanadium, Largo’s strategic business plan is based on two pillars: 1.) leading vanadium supplier with an outlined growth plan and 2.) U.S.-based energy storage business support a low carbon future.
Largo’s common shares trade on the Nasdaq Stock Market and on the Toronto Stock Exchange under the symbol “LGO”. For more information, please visit www.largoinc.com.
This press release contains “forward-looking information” and “forward-looking statements” within the meaning of applicable Canadian and United States securities legislation. Forward‐looking information in this press release includes, but is not limited to, statements with respect to the timing and amount of estimated future production and sales; the future price of commodities; costs of future activities and operations, including, without limitation, the effect of inflation and exchange rates; the effect of unforeseen equipment maintenance or repairs on production; timing and cost related to the build-out of the ilmenite plant; the ability to produce vanadium trioxide according to customer specifications; the extent of capital and operating expenditures; the impact of global delays and related price increases on the Company’s global supply chain and future sales of vanadium products. Forward‐looking information in this press release also includes, but is not limited to, statements with respect to our ability to build, finance and successfully operate a VRFB business, the projected timing and cost of the completion of the EGPE project; our ability to protect and develop our technology, our ability to maintain our IP, the competitiveness of our product in an evolving market, our ability to market, sell and deliver our VCHARGE batteries on specification and at a competitive price, our ability to successfully deploy our VCHARGE batteries in foreign jurisdictions; our ability to negotiate and enter into a joint venture with Ansaldo Green Tech on terms satisfactory to the Company and the success of such joint venture; the receipt of necessary governmental permits and approvals on a timely basis, our ability to secure the required resources to build and deploy our VCHARGE batteries, and the adoption of VRFB technology generally in the market.
The following are some of the assumptions upon which forward-looking information is based: that general business and economic conditions will not change in a material adverse manner; demand for, and stable or improving price of V2O5 and other vanadium commodities; receipt of regulatory and governmental approvals, permits and renewals in a timely manner; that the Company will not experience any material accident, labour dispute or failure of plant or equipment or other material disruption in the Company’s operations at the Maracás Menchen Mine or relating to Largo Clean Energy, specially in respect of the installation and commissioning of the EGPE project; the availability of financing for operations and development; the ability to mitigate the impact of continuing heavy rainfall; the Company’s ability to procure equipment and operating supplies in sufficient quantities and on a timely basis; that the estimates of the resources and reserves at the Maracás Menchen Mine are within reasonable bounds of accuracy (including with respect to size, grade and recovery and the operational and price assumptions on which such estimates are based); the competitiveness of the Company’s VRFB technology; the ability to obtain funding through government grants and awards for the Green Energy sector, the accuracy of cost estimates and assumptions on future variations of VCHARGE battery system design, that the Company’s current plans for ilmenite and VRFBs can be achieved; the Company’s “two-pillar” business strategy will be successful; the Company’s sales and trading arrangements will not be affected by the evolving sanctions against Russia; and the Company’s ability to attract and retain skilled personnel and directors; the ability of management to execute strategic goals.
Forward-looking statements can be identified by the use of forward-looking terminology such as “plans”, “expects” or “does not expect”, “is expected”, “budget”, “scheduled”, “estimates”, “forecasts”, “intends”, “anticipates” or “does not anticipate”, or “believes”, or variations of such words and phrases or statements that certain actions, events or results “may”, “could”, “would”, “might” or “will be taken”, “occur” or “be achieved”. All information contained in this news release, other than statements of current and historical fact, is forward looking information. Forward-looking statements are subject to known and unknown risks, uncertainties and other factors that may cause the actual results, level of activity, performance or achievements of Largo or Largo Clean Energy to be materially different from those expressed or implied by such forward-looking statements, including but not limited to those risks described in the annual information form of Largo and in its public documents filed on www.sedar.com and available on www.sec.gov from time to time. Forward-looking statements are based on the opinions and estimates of management as of the date such statements are made. Although management of Largo has attempted to identify important factors that could cause actual results to differ materially from those contained in forward-looking statements, there may be other factors that cause results not to be as anticipated, estimated or intended. There can be no assurance that such statements will prove to be accurate, as actual results and future events could differ materially from those anticipated in such statements. Accordingly, readers should not place undue reliance on forward-looking statements. Largo does not undertake to update any forward-looking statements, except in accordance with applicable securities laws. Readers should also review the risks and uncertainties sections of Largo’s annual and interim MD&As which also apply.
Trademarks are owned by Largo Inc.
Non-GAAP Measures
The financial statements and related notes of Largo have been prepared in accordance with International Financial Reporting Standards (“IFRS”) as issued by the International Accounting Standards Board. This press release contains non-GAAP financial measures and non-GAAP ratios, which are not standardized financial measures under IFRS, and might not be comparable to similar financial measures disclosed by other issuers. These measures are intended to provide additional information and should not be considered in isolation or as a substitute for measures of performance prepared in accordance with IFRS.
Revenues Per Pound
The Company’s press release refers to revenues per pound sold, V2 O5 revenues per pound of V2 O5 sold, V2 O3 revenues per pound of V2 O3 sold and FeV revenues per kg of FeV sold, which are non-GAAP financial measures that are used to provide investors with information about a key measure used by management to monitor performance of the Company.
These measures, along with cash operating costs, are considered to be key indicators of the Company’s ability to generate operating earnings and cash flow from its Maracás Menchen Mine and sales activities. These measures differ from measures determined in accordance with IFRS, and are not necessarily indicative of net earnings or cash flow from operating activities as determined under IFRS.
The following table provides a reconciliation of revenues per pound sold, V2 O5 revenues per pound of V2 O5 sold, V2 O3 revenues per pound of V2 O3 sold and FeV revenues per kg of FeV sold to revenues and the revenue information presented in note 18 as per the 2022 annual consolidated financial statements.
Cash Operating Costs and Cash Operating Costs Excluding Royalties
The Company’s press release refers to cash operating costs per pound and cash operating costs excluding royalties per pound, which are non-GAAP ratios based on cash operating costs and cash operating costs excluding royalties, which are non-GAAP financial measures, in order to provide investors with information about a key measure used by management to monitor performance. This information is used to assess how well the Maracás Menchen Mine is performing compared to plan and prior periods, and also to assess its overall effectiveness and efficiency.
Cash operating costs includes mine site operating costs such as mining costs, plant and maintenance costs, sustainability costs, mine and plant administration costs, royalties and sales, general and administrative costs (all for the Mine properties segment), but excludes depreciation and amortization, share-based payments, foreign exchange gains or losses, commissions, reclamation, capital expenditures and exploration and evaluation costs. Operating costs not attributable to the Mine properties segment are also excluded, including conversion costs, product acquisition costs, distribution costs and inventory write-downs.
Cash operating costs excluding royalties is calculated as cash operating costs less royalties.
Cash operating costs per pound and cash operating costs excluding royalties per pound are obtained by dividing cash operating costs and cash operating costs excluding royalties, respectively, by the pounds of vanadium equivalent sold that were produced by the Maracás Menchen Mine.
Cash operating costs, cash operating costs excluding royalties, cash operating costs per pound and cash operating costs excluding royalties per pound, along with revenues, are considered to be key indicators of the Company’s ability to generate operating earnings and cash flow from its Maracás Menchen Mine. These measures differ from measures determined in accordance with IFRS, and are not necessarily indicative of net earnings or cash flow from operating activities as determined under IFRS.
The following table provides a reconciliation of cash operating costs and cash operating costs excluding royalties, cash operating costs per pound and cash operating costs excluding royalties per pound for the Maracás Menchen Mine to operating costs as per the 2022 annual consolidated financial statements.
Investor Relations Alex Guthrie Senior Manager, External Relations +1.416.861.9778 aguthrie@largoinc.com
Preparing multiple uranium mines for production, completing profitable sales & developing rare earth refining capacity to power up to 1 million EVs per year by late-2023 or early-2024, while strengthening the balance sheet and avoiding debt.
LAKEWOOD, Colo., March 8, 2023 /CNW/ – Energy Fuels Inc. (NYSE American: UUUU) (TSX: EFR) (“Energy Fuels” or the “Company”) today reported its financial results for the year ended December 31, 2022. The Company’s Annual Report on Form 10-K has been filed with the U.S. Securities and Exchange Commission (“SEC“) and may be viewed on the Electronic Document Gathering and Retrieval System (“EDGAR“) at www.sec.gov/edgar.shtml, on the System for Electronic Document Analysis and Retrieval (“SEDAR“) at www.sedar.com, and on the Company’s website at www.energyfuels.com. Unless noted otherwise, all dollar amounts are in U.S. dollars.
Financial Highlights:
At December 31, 2022, the Company had a robust balance sheet with $116.97 million of working capital, including $62.80 million of cash and cash equivalents, $12.19 million of marketable securities, $38.16 million of inventory, and no debt. At current commodity prices, the Company’s product inventory has a value of $62.48 million;
During the year ended December 31, 2022, the Company incurred a net loss of $59.85 million or $0.38 per share, due in large part to: i) a non-cash mark-to-market loss on investments accounted for at fair value of $16.90 million; ii) increased expenses associated with preparing four(4) of our uranium mines for production; iii) development expenses associated with developing commercial rare earth element (“REE“) separation capabilities in addition to our existing mixed REE carbonate (“RE Carbonate“) commercial production capabilities; (iv) expenses associated with advancing our medical isotope initiatives;(v) increased selling, general and administrative expenses arising from costs associated with acquiring the South Bahia monazite sand project in Brazil (the “Bahia Project“) and costs associated with the sale of the Company’s Alta Mesa in situ recovery (“ISR“) project in Texas; and (vi) increased other selling, general and administrative expenses associated with significant additions to personnel, enhanced business processes, and other general and administrative expenses required to support all these increased levels of activity.
The Company held 1,027,000 pounds of finished uranium (“U3O8“) inventory at year end, along with approximately 985,000 pounds of finished vanadium (“V2O5“) inventory. At March 8, 2023, following sale and purchase transactions discussed below, the Company held 847,000 pounds of U3O8 and approximately 945,000 pounds of V2O5 inventory.
Uranium Highlights:
During 2022, the Company produced 162,000 pounds of U3O8 at its White Mesa Mill in Utah (the “Mill“) and remains the largest producer of uranium in the U.S.
During 2022, the Company was awarded four (4) new uranium supply contracts, with deliveries beginning in 2023, of which three (3) are long-term contracts with U.S. nuclear utilities and one (1) is with the U.S. government to supply the newly established strategic U.S. Uranium Reserve (“U.S. Uranium Reserve“).
In January 2023, the Company completed the sale of 300,000 pounds of U.S.-origin U3O8 to the U.S. Uranium Reserve realizing total gross proceeds of $18.47 million, or $61.57 per pound of U3O8, resulting in an expected margin of approximately $35.85 per pound of uranium.
During Q4-2022 and Q1-2023, the Company purchased a total of 301,052 pounds. of U.S.-origin U3O8 on the spot market for a weighted-average price of $50.08 per pound.
During 2022, the Company made significant progress in preparing four (4) of its conventional uranium and uranium/vanadium mines to be ready to resume uranium ore production, including significant workforce expansion and performing needed rehabilitation of surface and underground infrastructure.
On February 15, 2023, the Company announced it had completed its previously announced sale of its Alta Mesa ISR Project to enCore Energy Corp. (“enCore“) for total consideration of $120 million, comprised of $60 million in cash and $60 million in a secured convertible note bearing interest at a rate of eight percent (8%) per annum, convertible into common shares of enCore at a price of $2.9103 per share. This sale of a lower priority project provides Energy Fuels with significant additional cash and working capital, enabling the Company to ramp-up its US industry-leading uranium and REE production, while avoiding dilution to shareholders.
Rare Earth Element Highlights:
During 2022, the Company produced approximately 205 metric tons (“MT“) of high-purity, partially separated RE Carbonate from monazite, containing approximately 95 MT of total rare earth oxides (“TREO“), which is the most advanced REE material being produced commercially in the U.S. today. In Q4-2022, the Company received approximately 600 MT of monazite, which is expected to be processed into 375 to 485 MT of RE Carbonate, containing 175 to 225 MT or TREO, during 2023.
In early 2023, the Company began modifying and enhancing its existing solvent extraction (“SX“) circuits at the Mill to be able to produce separated REE oxides (“Phase 1“). “Phase 1” is expected to be completed and fully commissioned by late 2023 or early 2024 and have the capacity to produce roughly 800 to 1,000 MT of recoverable separated neodymium-praseodymium (“NdPr“) oxide per year, subject to securing sufficient monazite feed, or enough to provide the permanent magnets to power up to 1 million electric vehicles (“EVs“) per year, which is expected to position the Company as one of the world’s leading producers of NdPr outside of China. “Phase 1” capital costs are expected to total approximately $25 million. The Company is also proceeding with engineering on further enhancements to expand NdPr production capability (“Phase 2“) by 2026 and to produce separated dysprosium (“Dy“), terbium (“Tb“) and potentially other REE materials in the future (“Phase 3“) from monazite and potentially other REE process streams by 2027.
On February 13, 2023, the Company announced it had completed its previously announced acquisition of a large heavy mineral project in Brazil (the “Bahia Project“), which has the potential to supply the Company’s growing REE business with significant quantities of REE-bearing natural monazite sand for decades. The Bahia Project also contains significant quantities of high-value titanium (ilmenite and rutile) and zirconium (zircon) minerals.
The Company is currently in active discussions with several additional suppliers of natural monazite around the world to significantly increase the supply of feed for our growing REE initiative.
Vanadium Highlights:
During 2022, the Company sold approximately 642,000 pounds of existing V2O5 inventory (as ferrovanadium, “FeV“), for an average weighted net price of $13.67 per pound of V2O5.
Medical Isotope Highlights:
The Company continued advancing its program to evaluate the potential to recover radioisotopes from its process streams for use in emerging targeted alpha therapy (“TAT“) cancer therapeutics.
Mark S. Chalmers, Energy Fuels’ President and CEO, stated:
“2022 was an extraordinary year for Energy Fuels as we expanded our US industry-leading uranium business and established a new, sustainable US rare earth supply chain that is already commercially producing the most advanced rare earth material in the US today. We believe we have clearly emerged as one of the leading U.S. critical mineral companies, producing many of the raw materials needed for the clean energy transition.
“In 2022, positive uranium market fundamentals were magnified by concerns over security of supply, potentially creating new market dynamics for nuclear fuel. Nations around the world are embracing nuclear, as it provides clean, carbon-free electricity on a 24/7 basis, making it indispensable in the fight against climate change. Existing uranium mines globally are depleting, and underinvestment in new mines globally over the past several years could cause supply shortfalls in the coming years. These market fundamentals alone are the best I’ve seen in decades. Then, just over a year ago, Russia invaded Ukraine. Regrettably, the world has allowed Russian state-owned entities to exert disproportionate influence over global uranium and nuclear fuel supply chains over the past several years. Our company has been a leader warning about the inherent risks of such dependence since at least 2017. Most governments and utilities are taking concrete action to stop funding Russia’s war effort in Ukraine through uranium and nuclear fuel purchases. Energy Fuels continues to stand ready to supply and increase the availability of secure, US-produced uranium.
“We have been very active in the uranium space over the past year. In 2022, we began readying several of our conventional uranium and uranium/vanadium mines for production. We have hired about 30 people, and we are making the investments required to put one or more of these facilities into production as soon as later this year. We were also the only U.S. company to produce material quantities of uranium in 2022, having produced 162,000 pounds during Q4-2022, far more than any other company in the U.S. We are proud to have had the opportunity to sell 300,000 pounds of U.S.-produced uranium to the newly established strategic U.S. Uranium Reserve, which is a small but important step in re-establishing the U.S. nuclear fuel capabilities that will allow us to reduce our reliance on Russian uranium imports. We also have another 260,000 pounds of uranium deliveries to a U.S. utility later this year. Our strong uranium inventory position, which currently sits at 847,000 pounds along with another approximately 351,000 pounds contained in ore on the pad at the Mill, together with planned production, will allow us to meet contract deliveries over the life of those contracts, while also providing the flexibility to sell into the spot market and sign new long-term contracts under favorable market conditions.
“2022 was also an incredible year for our rare earth business. No other company is making progress like Energy Fuels in the rare earth space. We continued to produce and optimize our production of partially separated mixed RE Carbonate, though we produced less than expected due to a delay in deliveries that pushed late-2022 production into early-2023. We announced that we are beginning development of a rare earth separation circuit at the Mill that is expected to be commissioned in late-2023 or early-2024. Once operational, this circuit will have the capacity to produce up to 1,000 MT of refined NdPr oxide per year, or enough for up to one million EVs per year. We are also securing the monazite required to feed our rare earth infrastructure, including our recent acquisition of the Bahia Project — a large rare earth, titanium and zirconium project in Brazil — with additional third-party purchases of monazite from Chemours and others expected to be in the pipeline. Today, Energy Fuels’ mixed RE Carbonate is already the most advanced rare earth material commercially produced in the U.S. If we continue to be successful, no other U.S. company will be producing commercial quantities of refined NdPr products ready for offtake as quickly as Energy Fuels.
“We opportunistically sold some of our vanadium inventory in 2022, and we are looking to potentially sell more with V2O5 prices gaining strength recently. Further, our medical isotope initiative is continuing to progress well, and we hope to have more announcements on this very soon.
“Finally, we continue to manage our cash, assets, and working capital to achieve all these heightened initiatives. We take pride in maintaining a strong balance sheet and maintaining the flexibility to do big things. At the end of 2022, we had about $117 million of working capital, with inventories considerably worth more if you apply today’s market prices for uranium and vanadium. In January 2023, we completed the sale of 300,000 pounds of U3O8 to the U.S. Department of Energy for $18.5M. In February 2023, we closed on the sale of our Alta Mesa property in Texas, adding another $120 million to our treasury. Of this, $60 million is in cash and $60 million is in a convertible note bearing interest at eight percent per annum, or about $4.8 million per year.
“We accomplished a great deal over the past year, but this is just the beginning. We have market, geopolitical, and societal tailwinds behind all the commodities we produce, and we fully intend to continue building our critical mineral processes and capabilities. We look forward to providing more updates on future milestones as we achieve them in the weeks and months to come.”
Webcast at 11:00 am ET on March 10, 2023:
Energy Fuels will be hosting a video webcast on March 10, 2023 at 11:00 1m ET (9:00 am MT) to discuss its FY-2022 financial results, the outlook for 2023, and its uranium, rare earths, vanadium, and medical isotopes initiatives. To join the webcast and access the presentation and viewer-controlled webcast slides, please click on the link below:
By clicking this link and registering your name and phone number, the system will call you and place you directly into the call without talking to an operator. If you wish to call in on your own, please dial in to 1-888-664-6392 (toll free in the U.S. and Canada).
A link to a recorded version of the proceedings will be available on the Company’s website shortly after the webcast by calling 1-888-390-0541 (toll free in the U.S. and Canada) and by entering the code 145847#. The recording will be available until March 24, 2023.
Financial Discussion:
At December 31, 2022, the Company had $116.97 million of working capital, including $74.27 million of cash and cash equivalents and marketable securities and $38.16 million of inventory, including approximately 1,027,000 pounds of uranium and 985,000 pounds of high-purity vanadium, both in the form of finished, immediately marketable product. The current spot price of U3O8, according to TradeTech, is $50.50 per pound, and the current mid-point spot price of V2O5, according to Fastmarkets, is $10.78 per pound. Based on those spot prices, the Company’s uranium and vanadium inventories have a current market value of $51.86 million and $10.62 million, respectively, totaling $62.48 million
For the year ended December 31, 2022, we recognized a net loss of $59.85 million or $0.38 per share compared to net income of $1.54 million or $0.01 per share for the year ended December 31, 2021. The change between periods was primarily due to (i) a gain of $35.73 million recognized on the sale of a portfolio of the Company’s non-core conventional uranium projects to Consolidated Uranium Inc. (“CUR“) in 2021 primarily in exchange for shares in CUR; (ii) a non-cash mark-to-market loss on investments accounted for at fair value of $16.90 million in 2022 due primarily to a decrease in the market price of our CUR shares over 2022 (iii) increased expenses in 2022 associated with preparing four (4) of our uranium mines for production or operational readiness amounting to $2.4 million; (iv) development expenses in 2022 associated with developing commercial REE separation capabilities in addition to our existing mixed RE Carbonate commercial production capabilities; (v) expenses in 2022 associated with advancing our medical isotope initiatives; (vi) increased transaction expenses in 2022 arising from costs associated with acquiring the Bahia Project and costs associated with the sale of the Company’s Alta Mesa project in Texas; and (vii) increased other selling, general and administrative expenses in 2022 of $10.2 million associated with significant additions to executive and management/supervisory personnel (including non-cash share-based compensation of $2.5 million), enhanced business processes, and other general and administrative expenses required to support all these increased levels of activity, partially offset by increased revenues in 2022.
Sale to the U.S. Uranium Reserve:
On December 16, 2022, the Company announced it had been awarded a contract to sell 300,000 pounds of U3O8 for $18.5 million ($61.57 per pound of U3O8) to the U.S. government for the establishment of the U.S. Uranium Reserve, resulting in an expected margin of approximately $35.85 per pound of uranium. The Uranium Reserve is intended to be a backup source of supply for domestic nuclear power plants in the event of a significant market disruption. The Company completed the transfer and received the proceeds in January 2023.
Update on Rare Earth Initiatives and the Bahia Project:
Earlier this year, the Company began “Phase 1” REE separation, which includes modifications and enhancements to the existing SX circuits at the Mill. “Phase 1” is expected to have the capacity to process approximately 8,000 to 10,000 MT of monazite per year, producing roughly 4,000 to 5,000 MT TREO, containing roughly 800 to 1,000 MT of recoverable separated NdPr oxide per year. Because Energy Fuels is utilizing existing infrastructure at the Mill, “Phase 1” capital is expected to total only about $25 million. “Phase 1” is expected to be operational later this year or early 2024, subject to receipt of sufficient monazite supply and successful development and commissioning. If these milestones are achieved, Energy Fuels believes it will be the ‘first to market’ among U.S. companies with commercial quantities of separated NdPr available to EV, renewable energy, and other companies for offtake. Later, the Company expects to complete further enhancements to the Mill to expand NdPr production capability (“Phase 2“) by 2026 and to produce separated Dy, Tb and potentially other REE materials in the future (“Phase 3“) from monazite and potentially other REE-bearing process streams by 2027.
On February 13, 2023, the Company announced it had completed the previously announced acquisition of the Bahia Project located between the towns of Prado and Caravelas in the State of Bahia, Brazil totaling 15,089.71 hectares (approximately 37,300 acres or 58.3 square miles). The Bahia Project is a well-known heavy mineral sand (“HMS“) deposit that has the potential to supply 3,000 – 10,000 MT of natural monazite per year for decades to the Mill for processing into high-purity RE Carbonate, separated REE oxides and other REE products and materials. The Bahia Project is also expected to produce large quantities of high-quality titanium (ilmenite and rutile) and zirconium (zircon) minerals that are also in high demand. REE production is highly complementary to Energy Fuels’ existing US-leading uranium business, as monazite and other major REE-bearing minerals naturally contain uranium that will be recovered and other impurities that will be removed at the Mill before further processing into advanced high-purity REE materials. 3,000 – 10,000 MT of monazite contains roughly 1,500 – 5,000 MT of TREO, including 300 – 1,000 MT of NdPr and significant commercial quantities of Dy and Tb.
Prior to the closing on the Bahia Project, the Company commenced a sonic drilling program to further define and quantify the HMS resource, particularly at depth. The limited sonic drilling completed by Energy Fuels over the past few months appears to be confirming that the mineral-bearing sands continue at depth. The Company finished phase 1 of sonic drilling at the Bahia Project on February 14, 2023 totaling 2,266 meters. The Company plans to announce phase 1 drilling results this year and start phase 2 drilling in Q3-2023. Once data from both drill programs are available, the Company plans to engage industry leaders to calculate an initial mineral resource estimate for use in an S-K 1300 (U.S.) compliant Initial Assessment and an NI 43-101 (Canada) compliant Technical Report.
Prior owners of the Bahia Project performed extensive exploration work on the property, including the drilling of over 3,300 hand augur drill holes and a gamma survey of the region. Data from the drilling was used to publish highly detailed exploration and “reserve” reports prepared between 2016 and 2022 that were submitted to the National Mineral Agency of Brazil (“ANM“) in order to move the areas forward toward mining. Based on these seventeen historical reports dated between October 20, 2016 and April 29, 2022, the Bahia Project is estimated to contain 204 million MT of HMS, containing 7.18 million MT of heavy minerals at an average grade of 3.52%, including monazite concentrations in the HMS concentrate between 0.66% and 13.1%. It should be noted that these numbers are historical in nature and a Qualified Person under S-K 1300 or NI-43-101 has not done sufficient work to classify the estimates as a current estimate of Mineral Resources, Mineral Reserves, or exploration results. The Company is not treating these estimates as a current estimate of Mineral Resources, Mineral Reserves or exploration results. Further drilling and data collection might not prove out these numbers.
Sale of Alta Mesa Property to enCore Energy:
On February 15, 2023, the Company announced it had completed the sale (the “Closing“) of three (3) wholly owned subsidiaries that together hold the Alta Mesa ISR Project (“Alta Mesa“) to enCore Energy Corp. (“enCore“) for total consideration of $120 million (the “Transaction“). The consideration is comprised of:
$60 million cash at or prior to Closing; and
$60 million in a secured convertible note (the “Note“), payable two (2) years from the Closing, bearing annual interest of eight percent (8%). The Note will be convertible at Energy Fuels’ election into enCore common shares at a conversion price of $2.9103 per share, being a 20% premium to the 10-day volume-weighted average price of enCore shares ending the day before the Closing. enCore was recently listed on the NYSE American and also trades on the TSX Venture Exchange.
The Note is guaranteed by enCore and is fully secured by Alta Mesa. Unless a block trade or similar distribution is executed by Energy Fuels to sell enCore shares received upon conversion of the Note, Energy Fuels will be limited to converting the Note into a maximum of $10 million principal amount per thirty (30) day period.
In addition, enCore replaced the existing reclamation bonds for the Alta Mesa project shortly after the Closing, which will result in Energy Fuels receiving an additional $3.6 million cash as a return of collateral from those bonds. The Transaction is also expected to reduce the Company’s holding costs related to Alta Mesa by approximately $2 million per year.
The Transaction provides Energy Fuels with significant additional cash and working capital, enabling the Company to ramp-up its US industry-leading uranium and REE production, while avoiding dilution to shareholders. In addition, the Note provides Energy Fuels with significant exposure to uranium market upside through potential conversion into enCore common shares.
Operations Update and Outlook for 2023:
Overview
The Company continues to believe that uranium supply and demand fundamentals point to higher sustained uranium prices in the future. The Company believes that nuclear energy, fueled by uranium, is experiencing a global resurgence with an increased focus by governments, policymakers, and citizens on decarbonization, electrification, and security of energy supply. In addition, Russia’s invasion of Ukraine and the entry into the uranium market by financial entities purchasing uranium on the spot market to hold for the long-term has the potential to result in higher sustained spot and term prices and, perhaps, induce utilities to enter into more long-term contracts with non-Russian producers like Energy Fuels to foster security of supply, avoid transportation issues, and ensure more certain pricing.
In 2022, we entered into three long-term uranium contracts with major U.S. utilities for which the Company is beginning to perform the necessary work to recommence production at one or more of its mines, starting as soon as 2023. Until such time when the Company has ramped back up to commercial uranium production, it can rely on its significant uranium inventories to fulfill its new contract requirements, including its recent purchases of U.S. origin uranium on the spot market.
The Company is seeking additional sources of natural monazite to supply feedstock to its emerging REE projects. The Company is also evaluating the potential to recover radioisotopes for use in the development of TAT medical isotopes for the treatment of cancer and continues its support of U.S. governmental activities to assist the U.S. uranium mining industry, including expanding the new U.S. Uranium Reserve Program, supporting efforts to restore domestic nuclear fuel capabilities, and advocating for the responsible sourcing of uranium and nuclear fuel.
We continually evaluate the optimal mix of production, inventory and purchases in order to retain the flexibility to deliver long-term value.
Mill Activities
During the year ended December 31, 2022, the Company recovered and packaged approximately 162,000 pounds of its final uranium product, U3O8, at the Mill, which was added to the Company’s finished product inventory. The Mill recovered an additional small quantity of uranium, which was retained in-circuit and was not packaged in 2022. During 2022, the Mill also focused on its mixed RE Carbonate production and produced approximately 205 MT of high-purity, partially separated mixed RE Carbonate during 2022, while working to secure additional monazite ore feedstock to increase production. The Mill did not recover any vanadium in 2022.
During 2023, the Company does not plan to recover uranium at the Mill, other than from its monazite processing which will likely remain in circuit and not be packaged in 2023. During early 2023, the Company expects to process approximately 600 MT of monazite delivered late in 2022 from Chemours and recover approximately 175 to 225 MT of TREO at the Mill in the form of approximately 375 to 485 MT of RE Carbonate. The Company expects to receive an additional 400 – 700 MT of monazite from Chemours later in 2023, which the Company expects to process for the recovery of uranium and production of separated NdPr and a heavy REE (Sm+) Re Carbonate upon commissioning of the Mill’s Phase 1 REE Separation circuit in late 2023 or early 2024. The Company is also in active discussion with several parties globally to acquire additional quantities of natural monazite, which if secured and delivered to the Mill, could result in significant additional quantities of uranium and separated NdPr and heavy REE (Sm+) Re Carbonate production in 2024 and beyond.
No vanadium production is currently planned during 2023, though the Company continually monitors its inventory and vanadium markets to guide future potential vanadium production.
Conventional Mine Activities
During the year ended December 31, 2022, the Company performed rehabilitation and development work on its La Sal, Beaver, Whirlwind and Pinyon Plain projects for future potential production, including engineering, procurement, construction management, increased development activities, significant workforce expansion and needed rehabilitation of surface and underground infrastructure, while its other conventional mining properties remain on standby. The Company expects to continue its rehabilitation and development work, as it prepares these mines for future production. Although, the timing of the Company’s plans to extract and process mineralized materials from these projects will be based on current contract requirements, inventory levels, sustained improvements in general market conditions, procurement of suitable sales contracts and/or the expansion of the U.S. Uranium Reserve Program, the Company is making the investments required to put one or more of these facilities into production as soon as later in 2023.
The Company is selectively advancing certain permits at its other major conventional uranium projects, such as the Roca Honda, Sheep Mountain, and Bullfrog Projects. All these projects serve as important pipeline assets for the Company’s future conventional production capabilities, as market conditions may warrant.
ISR Mine Activities
The Company expects to produce insignificant quantities of U3O8 in the year ending December 31, 2023 from Nichols Ranch. Until such time when (i) market conditions improve sufficiently, (ii) suitable term sales contracts can be procured, and/or (iii) the U.S. Uranium Reserve Program is expanded, the Company expects to maintain the Nichols Ranch Project on standby and defer development of further wellfields and header houses. The Company currently holds 34 fully permitted, undeveloped wellfields at Nichols Ranch, including four additional wellfields at the Nichols Ranch wellfields, 22 wellfields at the adjacent Jane Dough wellfields, and eight wellfields at the Hank Project, which is fully permitted to be constructed as a satellite facility to the Nichols Ranch Plant.
Inventory
As of December 31, 2022, the Company had approximately 1,027,000 pounds of finished uranium inventories located at North American conversion facilities. Additionally, the Company had approximately 351,000 pounds of additional U3O8 contained in stockpiled Alternate Feed Materials and other ore inventory at the Mill that can be recovered relatively quickly in the future, as general market conditions may warrant. During Q1-2023, the Company completed the purchase 120,000 additional pounds of uranium and the sale of 300,000 pounds of uranium to the U.S. Uranium Reserve, resulting in the Company holding approximately 847,000 pounds of U3O8 in inventory as of March 8, 2023. The Company expects to deliver 260,000 pounds of U3O8 under its existing uranium term contracts in 2023, resulting in expected uranium inventories to total approximately 587,000 pounds of U3O8 at year-end 2023, subject to currently unplanned uranium spot sales and purchases.
The Company currently has approximately 945,000 pounds of V2O5 in inventory, and there remains an estimated 1.0 to 3.0 million pounds of additional solubilized recoverable V2O5 remaining in tailings solutions awaiting future recovery, as market conditions may warrant.
Sales Update and Outlook for 2023
Uranium Sales
While the Company did not sell uranium during the year ended December 31, 2022, the Company entered into four (4) uranium sale and purchase agreements in 2022, three (3) with major U.S. nuclear utilities and one (1) with the U.S. Uranium Reserve. Under these contracts, the Company expects to sell 560,000 pounds of U3O8 during 2023 with an expected weighted-average sales price of $58 – $60 per pound, subject to then-prevailing market prices at the time of delivery.
The three (3) utility contracts require deliveries of uranium between 2023 and 2030, with base quantities totaling 3.0 million pounds of uranium over the period, and up to 4.1 million pounds of uranium if all remaining options are exercised. Having observed a marked uptick in interest from nuclear utilities seeking long-term uranium supply, the Company remains actively engaged in pursuing additional selective long-term uranium sales contracts. During 2023, the Company expects to sell 260,000 pounds of its U3O8 inventory into these contracts at an expected sales price of approximately $54 – $58 per pound, subject to inflation and spot prices in effect at the time of delivery. In addition, in January 2023, the Company completed the sale of 300,000 pounds of its inventories located at ConverDyn to the U.S. Uranium Reserve, receiving total proceeds of $18.47 million ($61.57 per pound).
To provide the Company with additional flexibility to fulfill its contract obligations and gain direct exposure to potential future uranium price increases, the Company has recently purchased a total of 301,052 lbs. of U.S. origin uranium on the spot market for a weighted-average gross price of approximately $50.08 per pound.
Vanadium Sales
As a result of strengthening vanadium markets, during the year ended December 31, 2022, the Company sold approximately 642,000 pounds of the Company’s existing inventory of V2O5 (as FeV) at a net weighted average price of $13.67 per pound of V2O5. The Company expects to sell its remaining finished vanadium product when justified into the metallurgical industry, as well as other markets that demand a higher purity product, including the aerospace, chemical, and potentially the vanadium battery industries. The Company expects to sell to a diverse group of customers in order to maximize revenues and profits. The vanadium produced in the 2018/19 Pond Return campaign was a high-purity vanadium product of 99.6%-99.7% V2O5. The Company believes there may be opportunities to sell certain quantities of this high-purity material at a premium to reported spot prices.
The Company intends to continue to selectively sell itsV2O5 inventory on the spot market as markets warrant but will otherwise continue to maintain its vanadium in inventory.
Rare Earth Sales
The Company commenced its commercial production of a mixed RE Carbonate in March 2021 and has shipped all its RE Carbonate produced to-date to Neo Performance Material’s (“Neo’s“) REE separation plant, Silmet, located in Estonia where it is currently being fed into their separation process. All RE Carbonate produced at the Mill in 2022 was sold to Neo for separation at Silmet. Until such time as the Company commissions its own separation circuits at the Mill, which is expected to be in late 2023 or early 2024, all or a portion of RE Carbonate production is expected to be sold to Neo for separation at Silmet and/or, potentially, to other REE separation facilities outside of the U.S. To the extent not sold, the Company expects to stockpile mixed RE Carbonate at the Mill for future separation and other downstream REE processing at the Mill or elsewhere. During the year ended December 31, 2022, the Company sold approximately 89,000 kilograms of RE Carbonate at an average price of $23.88 per kilogram of RE Carbonate.
While the Company continues to make progress on its mixed RE Carbonate production and additional funds are spent on process enhancements, improving recoveries, product quality and other optimization, profits from this initiative are expected to be minimal until such time when monazite throughput rates are increased and optimized. However, even at the current throughput rates, the Company is recovering most of its direct costs of this growing initiative, with the other costs associated with ramping up production and process enhancements at the Mill being expensed as underutilized capacity production costs applicable to RE Carbonate and development expenditures. Throughout this process, the Company is gaining important knowledge, experience and technical information, all of which are valuable for current and future mixed RE Carbonate production and planned future production of separated REE oxides and other advanced REE materials at the Mill or elsewhere.
ABOUT ENERGY FUELS
Energy Fuels is a leading US-based critical minerals company. The Company mines uranium and produces natural uranium concentrates that are sold to major nuclear utilities for the production of carbon-free nuclear energy. Energy Fuels recently began production of advanced rare earth element (“REE“) materials, including mixed REE carbonate, and plans to produce commercial quantities of separated REE oxides in the future. Energy Fuels also produces vanadium from certain of its projects, as market conditions warrant, and is evaluating the recovery of radionuclides needed for emerging cancer treatments. Its corporate offices are in Lakewood, Colorado, near Denver, and substantially all its assets and employees are in the United States. Energy Fuels holds two of America’s key uranium production centers: the White Mesa Mill in Utah and the Nichols Ranch in-situ recovery (“ISR“) Project in Wyoming. The White Mesa Mill is the only conventional uranium mill operating in the US today, has a licensed capacity of over 8 million pounds of U3O8 per year, has the ability to produce vanadium when market conditions warrant, as well as REE products, from various uranium-bearing ores. The Nichols Ranch ISR Project is on standby and has a licensed capacity of 2 million pounds of U3O8 per year. The Company recently acquired the Bahia Project in Brazil, which is believed to have significant quantities of titanium (ilmenite and rutile), zirconium (zircon) and REE (monazite) minerals. In addition to the above production facilities, Energy Fuels also has one of the largest NI 43-101 compliant uranium resource portfolios in the US and several uranium and uranium/vanadium mining projects on standby and in various stages of permitting and development. The primary trading market for Energy Fuels’ common shares is the NYSE American under the trading symbol “UUUU,” and the Company’s common shares are also listed on the Toronto Stock Exchange under the trading symbol “EFR.” Energy Fuels’ website is www.energyfuels.com.
Daniel Kapostasy, P.G., Director of Technical Services for Energy Fuels, is a Qualified Person as defined by Canadian National Instrument 43-101 and has reviewed and approved the technical disclosure contained in this news release, including sampling, analytical, and test data underlying such disclosure.
The data collected and provided in this disclosure related to the Bahia Project is derived entirely from the exploration reports for each of the seventeen ANM Process Areas. Dan Kapostasy, Director of Technical Services and a Qualified Person for the Company has reviewed these reports in detail and discussed the methods used with the project geologist in charge of field and laboratory activities for the previous owners. This person is also currently an employee of Energy Fuels Brazil, Ltda. Heavy mineral concentrations were derived for every meter drilled using heavy liquid separations, a standard method of heavy mineral determination.
To determine the concentration of the various heavy minerals in a sample, the heavy fraction was separated from the silica sand by using heavy liquid separation. The heavy fraction was then mounted in epoxy or dispersed on slide glass and viewed under a microscope. A geologist can then identify the various minerals and determine the concentration of each mineral through a process called point counting, whereby the geologist identifies each sand grain individually, tallies the number of each mineral and then divides by the total.
Verification of the heavy mineral concentration was started by the Company in September 2022, when it hired a contract driller to collect samples using a sonic rig. While no laboratory analyses have been received to date, visual estimation of the heavy mineral quantity indicates that the historical values seen at the various Process Areas are valid.
Cautionary Note Regarding Forward-Looking Statements: This news release contains certain “Forward Looking Information” and “Forward Looking Statements” within the meaning of applicable United States and Canadian securities legislation, which may include, but are not limited to, statements with respect to: production and sales forecasts; costs of production; any expectation that the Company will be awarded any future sales under the U.S. Uranium Reserve; scalability, and the Company’s ability and readiness to re-start, expand or deploy any of its existing projects or capacity to respond to any improvements in uranium market conditions or in response to the Uranium Reserve; any expectation as to future uranium, vanadium, RE Carbonate, REE oxide, or REE market fundamentals or sales; any expectation as to recommencement of production at any of the Company’s uranium mines or the timing thereof; any expectation regarding any remaining dissolved vanadium in the Mill’s tailings facility solutions or the ability of the Company to recover any such vanadium at acceptable costs or at all; any expectation as to timelines for the permitting and development of projects; any expectation as to longer term fundamentals in the market and price projections; any expectation as to the implications of the current Russian invasion of Ukraine on uranium, vanadium or other commodity markets; any expectation that the Company will maintain its position as a leading U.S.-based critical minerals company; any expectation with respect to timelines to production; any expectation that the sale of the Alta Mesa project and the use of the proceeds from that sale will not result in any dilution to shareholders; any expectation that the Mill will be successful in producing RE Carbonate on a full-scale commercial basis; any expectation that Energy Fuels will be successful in developing U.S. separation, or other value-added U.S. REE production capabilities at the Mill, or otherwise, including the timing of any such initiatives and the expected production capacity or capital and operating costs associated with any such production capabilities; any expectation with respect to the future demand for REEs; any expectation with respect to the quantities of monazite to be acquired by Energy Fuels, the quantities of RE Carbonate or REE oxides to be produced by the Mill or the quantities of contained TREO in the Mill’s RE Carbonate; any expectation that the Company may sell its separated NdPr oxide to major electric vehicle manufacturers in the U.S. and Europe; any expectation that the Bahia Project has the potential to feed the Mill with REE and uranium-bearing monazite sand for decades or at all; any expectation that the Company will complete comprehensive sonic drilling and geophysical mapping at the Bahia Project or complete an Initial Assessment under SK-1300 (U.S.) and a Technical Report Technical Report under NI 43-101 (Canada) during Q4-2023 or Q1-2024, or otherwise; any expectation that the Company’s evaluation of thorium and radium recovery at the Mill will be successful; any expectation that the potential recovery of medical isotopes from any thorium or radium recovered at the Mill will be feasible; any expectation that any thorium, radium or other isotopes can be recovered at the Mill and sold on a commercial basis; any expectation as to the quantities to be delivered under existing uranium sales contracts; any expectation that the Company will be successful in completing any additional contracts for the sale of uranium to U.S. utilities on commercially reasonable terms or at all; and any expectation that the Company will generate net income in future periods. Generally, these forward-looking statements can be identified by the use of forward-looking terminology such as “plans,” “expects,” “does not expect,” “is expected,” “is likely,” “budgets,” “scheduled,” “estimates,” “forecasts,” “intends,” “anticipates,” “does not anticipate,” or “believes,” or variations of such words and phrases, or state that certain actions, events or results “may,” “could,” “would,” “might” or “will be taken,” “occur,” “be achieved” or “have the potential to.” All statements, other than statements of historical fact, herein are considered to be forward-looking statements. Forward-looking statements involve known and unknown risks, uncertainties and other factors which may cause the actual results, performance or achievements of the Company to be materially different from any future results, performance or achievements express or implied by the forward-looking statements. Factors that could cause actual results to differ materially from those anticipated in these forward-looking statements include risks associated with: commodity prices and price fluctuations; engineering, construction, processing and mining difficulties, upsets and delays; permitting and licensing requirements and delays; changes to regulatory requirements; legal challenges; the availability of sources of Alternate Feed Materials and other feed sources for the Mill; competition from other producers; public opinion; government and political actions; available supplies of monazite; the ability of the Mill to produce RE Carbonate, REE oxides or other REE products to meet commercial specifications on a commercial scale at acceptable costs or at all; market factors, including future demand for REEs; the ability of the Mill to be able to separate radium or other radioisotopes at reasonable costs or at all; market prices and demand for medical isotopes; and the other factors described under the caption “Risk Factors” in the Company’s most recently filed Annual Report on Form 10-K, which is available for review on EDGAR at www.sec.gov/edgar.shtml, on SEDAR at www.sedar.com, and on the Company’s website at www.energyfuels.com. Forward-looking statements contained herein are made as of the date of this news release, and the Company disclaims, other than as required by law, any obligation to update any forward-looking statements whether as a result of new information, results, future events, circumstances, or if management’s estimates or opinions should change, or otherwise. There can be no assurance that forward-looking statements will prove to be accurate, as actual results and future events could differ materially from those anticipated in such statements. Accordingly, the reader is cautioned not to place undue reliance on forward-looking statements. The Company assumes no obligation to update the information in this communication, except as otherwise required by law.
SOURCE Energy Fuels Inc.
For further information: Investor Inquiries: Energy Fuels Inc., Curtis Moore, VP – Marketing and Corporate Development, (303) 974-2140 or Toll free: (888) 864-2125, investorinfo@energyfuels.com , www.energyfuels.com
Energy Fuels is a leading U.S.-based uranium mining company, supplying U3O8 to major nuclear utilities. Energy Fuels also produces vanadium from certain of its projects, as market conditions warrant, and is ramping up commercial-scale production of REE carbonate. Its corporate offices are in Lakewood, Colorado, near Denver, and all its assets and employees are in the United States. Energy Fuels holds three of America’s key uranium production centers: the White Mesa Mill in Utah, the Nichols Ranch in-situ recovery (“ISR”) Project in Wyoming, and the Alta Mesa ISR Project in Texas. The White Mesa Mill is the only conventional uranium mill operating in the U.S. today, has a licensed capacity of over 8 million pounds of U3O8 per year, has the ability to produce vanadium when market conditions warrant, as well as REE carbonate from various uranium-bearing ores. The Nichols Ranch ISR Project is on standby and has a licensed capacity of 2 million pounds of U3O8 per year. The Alta Mesa ISR Project is also on standby and has a licensed capacity of 1.5 million pounds of U3O8 per year. In addition to the above production facilities, Energy Fuels also has one of the largest NI 43-101 compliant uranium resource portfolios in the U.S. and several uranium and uranium/vanadium mining projects on standby and in various stages of permitting and development. The primary trading market for Energy Fuels’ common shares is the NYSE American under the trading symbol “UUUU,” and the Company’s common shares are also listed on the Toronto Stock Exchange under the trading symbol “EFR.” Energy Fuels’ website is www.energyfuels.com.
Michael Heim, CFA, Senior Research Analyst, Noble Capital Markets, Inc.
Refer to the full report for the price target, fundamental analysis, and rating.
Report full of future promise. UUUU’s press release was full of previously announced news items: Rare Earth Element (REE) progress, signed uranium sales contracts, vanadium inventory sales, Alta Mesa sale, etc. At the same time, production levels have been lagging behind expectations for a variety of reasons including economic conditions, supply issues, etc. Management is clearly focused on developing REE separation operations which it sees as a late 2023/early 2024 event. It is also prepping uranium mines for eventual production.
Production not there yet. The company has yet to resume mining uranium. It signed sales contracts to deliver uranium but is meeting those obligations with inventory or uranium purchases. We initially had hoped uranium operations would have resumed by 2023. REE Carbonate sales to the NEO plant in Estonia are being completed but at levels below initial expectations due to limited Monzanite supply issues. We had also hoped to see vanadium production resume by the end of the year.
Equity Research is available at no cost to Registered users of Channelchek. Not a Member? Click ‘Join’ to join the Channelchek Community. There is no cost to register, and we never collect credit card information.
This Company Sponsored Research is provided by Noble Capital Markets, Inc., a FINRA and S.E.C. registered broker-dealer (B/D).
*Analyst certification and important disclosures included in the full report. NOTE: investment decisions should not be based upon the content of this research summary. Proper due diligence is required before making any investment decision.
CALGARY, AB, March 1, 2023 /CNW/ – InPlay Oil Corp. (TSX: IPO) (OTCQX: IPOOF) (“InPlay” or the “Company”) is pleased to confirm that its Board of Directors has declared a monthly cash dividend of $0.015 per common share payable on March 31, 2023, to shareholders of record at the close of business on March 15, 2023. The monthly cash dividend is expected to be designated as an “eligible dividend” for Canadian federal and provincial income tax purposes.
About InPlay Oil Corp.
InPlay is a junior oil and gas exploration and production company with operations in Alberta focused on light oil production. The company operates long-lived, low-decline properties with drilling development and enhanced oil recovery potential as well as undeveloped lands with exploration possibilities. The common shares of InPlay trade on the Toronto Stock Exchange under the symbol IPO and the OTCQX Exchange under the symbol IPOOF.
For further information:
Doug Bartole, President and Chief Executive Officer InPlay Oil Corp. Telephone: (587) 955-0632, www.inplayoil.com
CALGARY, AB, Feb. 28, 2023 /CNW/ – Alvopetro Energy Ltd. (TSXV: ALV) (OTCQX: ALVOF) announces our reserves as at December 31, 2022 with total proved plus probable (“2P”) reserves of 9.0 MMboe and a before tax net present value discounted at 10% of $348.2 million. 2P reserve additions replaced 132% of 2022 production. 2P reserve volumes increased by 3%, despite 0.9 MMboe of production in 2022, due to reserve additions associated mainly with two additional Murucututu development locations (previously included in contingent resources). The before tax net present value of our 2P reserves (discounted at 10%) increased by 17% from December 31, 2021, due to reserve additions and increases in forecasted natural gas prices. Alvopetro also announces the December 31, 2022 assessment of the Company’s Murucututu natural gas resource with risked best estimate contingent resource of 2.9 MMboe and risked best estimate prospective resource of 12.5 MMboe. The Murucututu natural gas contingent and prospective resource values (risked best estimate net present value before tax, discounted at 10%) are $62.2 million and $259.1 million, respectively. The reserves and resources data set forth herein is based on an independent reserves and resources assessment and evaluation prepared by GLJ Ltd. (“GLJ”) dated February 27, 2023 with an effective date of December 31, 2022 (the “GLJ Reserves and Resources Report”).
All references herein to $ refer to United States dollars, unless otherwise stated.
December 31, 2022 GLJ Reserves and Resource Report Highlights
2P net present value before tax discounted at 10% increased 17% to $348.2 million.
Proved reserves (“1P”) decreased 12% to 3.9 MMboe and 2P reserves increased 3% to 9.0 MMboe after 0.9 MMboe of production in 2022.
2P production replacement ratio(1) of 132%.
2P F&D costs(1) estimated at $28.66/boe.
2P recycle ratio(1) estimated at 2.1 times.
2P Net Asset Value(1) of CAD$13.56/share ($9.99/share) before any potential from contingent or prospective resources.
Risked best estimate contingent resource of 2.9 MMboe (NPV10 $62.2 million) and risked best estimate prospective resource of 12.5 MMboe (NPV10 $259.1 million).
Corey Ruttan, President and Chief Executive Officer, commented:
“Our 2022 year-end reserves and resource evaluations highlight the continued strong profitability from our Caburé natural gas field and the long-term potential of our Murucututu project. The increase in forecasted cash flows reflects the impact of reserve additions associated with our near-term development plans on our Murucututu asset and increases in forecasted natural gas prices under our long-term gas sales agreement. Our 2023 capital program is focused on lower risk development opportunities including accelerated activity on our Murucututu asset targeting the long-term natural gas potential of this field.”
(1)
Refer to the sections entitled “Oil and Natural Gas Advisories – Other Metrics” and “Non-GAAP and Other Financial Measures” for additional disclosures and assumptions used in calculating production replacement ratio, F&D costs, recycle ratio, net asset value and net asset value per share.
Net Present Value Before Tax Discounted at 10%:(1)(2)(3)(4)(5)(6)(7)(8)
NET ASSET VALUE
Following the December 31, 2022 reserves evaluation, based on the before tax net present value of Alvopetro’s 2P reserves (discounted at 10%), our total 2P net asset value is $362.9 million; CAD$13.56 per common share outstanding. Our 2P net asset value of $362.9 million is before including the before tax net present value (discounted at 10%) of our risked best estimate risked contingent resource of $62.2 million and our risked prospective resource of $259.1 million from the Murucututu natural gas field.
PRICING ASSUMPTIONS – FORECAST PRICES AND COSTS
GLJ employed the following pricing and inflation rate assumptions as of January 1, 2023 in the GLJ Reserves and Resources Report in estimating reserves and resources data using forecast prices and costs.
As of February 1, 2023, Alvopetro’s contracted natural gas price under the terms of our long-term gas sales agreement is based on the ceiling price within the contract and is forecasted to remain at the ceiling price until 2027. The ceiling price incorporates assumed US inflation of 3% in 2023 and 2% thereafter.
GLJ RESERVES AND RESOURCES REPORT
The GLJ Reserves and Resources Report has been prepared in accordance with the standards contained in the Canadian Oil and Gas Evaluation Handbook (“COGEH”) that are consistent with the standards of National Instrument 51-101 (“NI 51-101”). GLJ is a qualified reserves evaluator as defined in NI 51-101. The GLJ Reserves and Resources Report was an evaluation of all reserves of Alvopetro including our Caburé and Caburé Leste natural gas fields (collectively referred to as our Caburé natural gas field), our Murucututu natural gas project (previously referred to as Gomo), as well as our Bom Lugar and Mãe-da-lua oil fields. The GLJ Reserves and Resources Report also includes an evaluation of the gas resources of our Murucututu natural gas. In addition to the reserves assigned to our two existing Murucututu wells (197-1 and 183-1) and four additional development locations, contingent resource was assigned to the area in proximity to our existing Murucututu reserves, deemed to be discovered. The area mapped by 3D seismic west and north of the area defined as contingent was assigned prospective resource. Additional reserves and resources information as required under NI 51-101 will be included in the Company’s Annual Information Form for the 2022 fiscal year which will be filed on SEDAR by April 30, 2023.
December 31, 2022 Reserves Information:
Summary of Reserves (1)(2)(3)
Summary of Before Tax Net Present Value of Future Net Revenue – $000s(1)(2)(3)(7)(8)
Summary of After Tax Net Present Value of Future Net Revenue – $000s(1)(2)(3)(7)(8)
Future Development Costs (1)(2)(3)(7)(8)
The table below sets out the total development costs deducted in the estimation of future net revenue attributable to proved reserves, proved plus probable reserves and proved plus probable plus possible reserves (using forecast prices and costs), by field, in the GLJ Reserves and Resources Report. Total development costs include capital costs for drilling and facility and pipeline expenditures but excludes abandonment and reclamation costs.
Under each reserve category, Alvopetro has elected to reflect 100% of the contractual obligations pursuant to our Gas Treatment Agreement with Enerflex, including all operating, capital, and related financing costs for the full duration of the agreement. These costs are mainly attributable to the Caburé field and also represent the majority of the future development costs for the Caburé field in the table below. The future costs associated with equipment rental are also reflected as a capital lease obligation on our financial statements. Also included in future development costs for the Caburé field are two step-out wells and expansion of the unit facilities.
The future development costs for the Murucututu field in the proved category are for two development locations in the field and the stimulation of the 197(1) well. In the probable and possible categories, there are future development costs for two additional development locations. Also included in the Murucututu future development costs for all reserve categories are a portion of the anticipated contractual obligations associated with the expansion of the gas treatment facility. The future development costs for Bom Lugar in the proved category include costs for one development well and facilities upgrade. A second development well is included in the future development costs for the possible category for Bom Lugar. Future development costs at the Mãe-da-lua field relate to a stimulation of the existing producing well.
Reconciliation of Alvopetro’s Gross Reserves (Before Royalty) (1)(2)(3)(8)
December 31, 2022 Murucututu Contingent Resources Information:
Summary of Unrisked Company Gross Contingent Resources (1)(2)(5)(6)
Summary of Before Tax Net Present Value of Future Net Revenue of Unrisked Contingent Resources- $000s (1)(2)(5)(6)(7)(8)
The GLJ Contingent Resource Report for Murucututu assumes capital deployment starting in 2024 for the drilling of wells with total project costs of $19.1 million and first commercial production in 2024. The information presented herein is based on company net project development costs. The recovery technology assumed for purposes of the estimate is based on established technologies utilized repeatedly in the industry.
There can be no certainty that the project will be developed on the timelines discussed herein. The project is based on a pre-development study. Development of the project is dependent on several contingencies as further described in this news release. Significant positive factors relevant to the estimate include existing production in close proximity, proximity to infrastructure, existing long-term gas sales agreement and corporate commitment to the project. Significant negative factors relevant to the estimate include reservoir performance and the economic viability of the project (with sensitivity to low commodity prices), access to and amount of capital required to develop resources at an acceptable cost, and regulatory approvals for planned activities including stimulations and new infrastructure developments.
Summary of Development Pending Risked Company Gross Contingent Resources(1)(2)(5)(6)
The GLJ Reserves and Resources Report estimates the Chance of Development as the product of two main contingencies associated with the project development, which are: 1) the probability of corporate sanctioning, which GLJ estimates at 95%; 2) the probability of finalization of a development plan, which GLJ estimates at 95%. The product of these two contingencies is 90%. As there is no risk related to discovery, the Chance of Commerciality for the contingent resource is therefore 90% which is the risk factor that has been applied to the Development Risked company gross contingent resources and the net present value figures reported below.
Summary of Development Pending Risked Before Tax Net Present Value of Future Net Revenue of Contingent Resources- $000s(1)(5)(6)(7)(8)
December 31, 2022 Murucututu Prospective Resources Information:
Summary of Unrisked Company Gross Prospective Resources (1)(2)(4)(6)
Summary of Before Tax Net Present Value of Future Net Revenue of Unrisked Prospective Resources – $000s (1)(4)(6)(7)(8)
The GLJ Reserves and Resources Report for Murucututu prospective resources assumes capital deployment starting in 2025 for the drilling of wells, expansion of field facilities, and additional pipeline capacity, with total project costs of $70.0 million and first commercial production in 2025. The information presented herein is based on company project development costs. The recovery technology assumed for purposes of the estimate is based on established technologies utilized repeatedly in the industry.
There can be no certainty that the project will be developed on the timelines discussed herein. Development of the project is dependent on several contingencies as further described in this news release. The project is based on a conceptual study. Significant positive factors relevant to the estimate include existing production in close proximity, proximity to infrastructure, existing long-term gas sales agreement and corporate commitment to the project. Significant negative factors relevant to the estimate include reservoir performance and the economic viability of the project (with sensitivity to low commodity prices), access to and amount of capital required to develop resources at an acceptable cost, and regulatory approvals for planned activities including stimulations and new infrastructure developments.
Summary of Development Risked Company Gross Prospective Resources(1)(2)(4)(6)
The GLJ Reserves and Resources Report estimates the Chance of Commerciality as the product between the Chance of Discovery and the Chance of Development. The Chance of Discovery of the prospective resources has been assessed at 90%, while the Chance of Development has been assessed as the same as for the Contingent Resources described above at 90%. The resulting Chance of Commerciality is 81%, which has been applied to the company gross unrisked prospective resources and the net present value figures reported below.
Summary of Development Risked Before Tax Net Present Value of Future Net Revenue of Prospective Resources- $000s(1)(4)(6)(7)(8)
UPCOMING 2022 RESULTS AND LIVE WEBCAST
Alvopetro anticipates announcing its 2022 fourth quarter and year-end results on March 21, 2023 after markets close and will host a live webcast to discuss the results at 9:00 am Mountain time, on March 22, 2023. Details for joining the event are as follows:
The webcast will include a question and answer period. Online participants will be able to ask questions through the Zoom portal. Dial-in participants can email questions directly to socialmedia@alvopetro.com.
CORPORATE PRESENTATION
Alvopetro’s updated corporate presentation is available on our website at:
References to Company Gross reserves or Company Gross Resources means the total working interest share of remaining recoverable reserves or resources held by Alvopetro before deductions of royalties payable to others and without including any royalty interests held by Alvopetro.
(2)
The tables above are a summary of the reserves of Alvopetro and the net present value of future net revenue attributable to such reserves as evaluated in the GLJ Reserves and Resources Report based on forecast price and cost assumptions. The tables summarize the data contained in the GLJ Reserves and Resources Report and as a result may contain slightly different numbers than such report due to rounding. Also due to rounding, certain columns may not add exactly.
(3)
Possible reserves are those additional reserves that are less certain to be recovered than probable reserves. There is a 10% probability that the quantities actually recovered will equal or exceed the sum of proved plus probable plus possible reserves.
(4)
Prospective Resources are defined in the COGE Handbook as those quantities of petroleum estimated, as of a given date, to be potentially recoverable from undiscovered accumulations by application of future development projects. Prospective resources have both an associated chance of discovery and a chance of development. There is no certainty that any portion of the prospective resources will be discovered and even if discovered, there is no certainty that it will be commercially viable to produce any portion. Prospective Resources are further subdivided in accordance with the level of certainty associated with recoverable estimates assuming their discovery as described in footnote 11.
(5)
Contingent Resources are defined in the COGE Handbook as those quantities of petroleum estimated, as of a given date, to be potentially recoverable from known accumulations using established technology or technology under development, but are not currently considered to be commercially recoverable due to one or more contingencies. Contingencies may include factors such as economic, legal, environmental, political and regulatory matters or a lack of markets. It is also appropriate to classify as contingent resources the estimated discovered recoverable quantities associated with a project in the early evaluation stage. Contingent Resources are further classified in accordance with the level of certainty associated with the estimates as described in footnote 11 and may be subclassified based on project maturity and/or characterized by their economic status. The Contingent Resources estimated in the GLJ Reserves and Resources Report are classified as “economic contingent resources”, which are those contingent resources that are currently economically recoverable. All such resources are further sub-classified with a project status of “development pending”, meaning that resolution of the final conditions for development are being actively pursued. The recovery estimates of the Company’s contingent resources provided herein are estimates only and there is no guarantee that the estimated resources will be recovered. There is uncertainty that it will be commercially viable to produce any portion of the resources. Actual recovered resource may be greater than or less than the estimates provided herein.
(6)
Low Estimate: This is considered to be a conservative estimate of the quantity that will actually be recovered. It is likely that the actual remaining quantities recovered will exceed the low estimate. If probabilistic methods are used, there should be at least a 90 percent probability (P90) that the quantities actually recovered will equal or exceed the low estimate.Best Estimate: This is considered to be the best estimate of the quantity that will actually be recovered. It is equally likely that the actual remaining quantities recovered will be greater or less than the best estimate. If probabilistic methods are used, there should be at least a 50 percent probability (P50) that the quantities actually recovered will equal or exceed the best estimate.High Estimate: This is considered to be an optimistic estimate of the quantity that will actually be recovered. It is unlikely that the actual remaining quantities recovered will exceed the high estimate. If probabilistic methods are used, there should be at least a 10 percent probability (P10) that the quantities actually recovered will equal or exceed the high estimate.
(7)
The net present value of future net revenue attributable to Alvopetro’s reserves and resources are stated without provision for interest costs and general and administrative costs, but after providing for estimated royalties, production costs, development costs, other income, future capital expenditures, well abandonment and reclamation costs for only those wells assigned reserves and material dedicated gathering systems and facilities. The net present values of future net revenue attributable to Alvopetro’s reserves and resources estimated by GLJ do not represent the fair market value of those reserves. Other assumptions and qualifications relating to costs, prices for future production and other matters are summarized herein. The recovery and reserve and resource estimates of the Company’s reserves and resources provided herein are estimates only and there is no guarantee that the estimated reserves and resources will be recovered. Actual reserves and resources may be greater than or less than the estimates provided herein.
(8)
GLJ’s January 1, 2023 escalated price forecast is used in the determination of future gas sales prices under Alvopetro’s long-term gas sales agreement and for all forecasted oil sales and natural gas liquids sales. See https://www.gljpc.com/sites/default/files/pricing/Jan23.pdf for GLJ’s price forecast.
Alvopetro Energy Ltd.’svision is to become a leading independent upstream and midstream operator in Brazil. Our strategy is to unlock the on-shore natural gas potential in the state of Bahia in Brazil, building off the development of our Caburé natural gas field and our strategic midstream infrastructure.
Neither the TSX Venture Exchange nor its Regulation Services Provider (as that term is defined in the policies of the TSX Venture Exchange) accepts responsibility for the adequacy or accuracy of this news release.
All amounts contained in this news release are in United States dollars, except as otherwise noted.
Abbreviations:
1P = proved reserves2P = proved plus probable reserves3P = proved plus probable plus possible reservesCAD = Canadian dollarsF&D = finding and development costsFDC = future development costs;Mbbl = thousands of barrelsMboe = thousand barrels of oil equivalentMMbtu = million British Thermal UnitsMMcf = million cubic feetMMcf/d = million cubic feet per dayMMboe = million barrels of oil equivalent$000s = thousands of U.S. dollars
Oil and Natural Gas Advisories
Oil and Natural Gas Reserves
The disclosure in this news release summarizes certain information contained in the GLJ Reserves and Resources Report but represents only a portion of the disclosure required under NI 51-101. Full disclosure with respect to the Company’s reserves as at December 31, 2022 will be included in the Company’s annual information form for the year ended December 31, 2022 which will be filed on SEDAR (www.sedar.com) on or before April 30, 2023. All net present values in this press release are based on estimates of future operating and capital costs and GLJ’s forecast prices as of December 31, 2022. The reserves definitions used in this evaluation are the standards defined by COGEH reserve definitions and are consistent with NI 51-101 and used by GLJ. The net present values of future net revenue attributable to the Alvopetro’s reserves estimated by GLJ do not represent the fair market value of those reserves. Other assumptions and qualifications relating to costs, prices for future production and other matters are summarized herein. The recovery and reserve estimates of the Company’s reserves provided herein are estimates only and there is no guarantee that the estimated reserves will be recovered. Actual reserves may be greater than or less than the estimates provided herein. Possible reserves are those additional reserves that are less certain to be recovered than probable reserves. There is a 10% probability that the quantities actually recovered will equal or exceed the sum of proved plus probable plus possible reserves.
Contingent Resources
This news release discloses estimates of Alvopetro’s contingent resources and the net present value associated with net revenues associated with the production of such contingent resources as included in the GLJ Reserves and Resources Report. There is no certainty that it will be commercially viable to produce any portion of such contingent resources and the estimated future net revenues do not necessarily represent the fair market value of such contingent resources. Estimates of contingent resources involve additional risks over estimates of reserves. Full disclosure with respect to the Company’s contingent resources as at December 31, 2022 will be contained in the Company’s annual information form for the year ended December 31, 2022 which will be filed on SEDAR (www.sedar.com) on or before April 30, 2023.
Prospective Resources
This news release discloses estimates of Alvopetro’s prospective resources included in the GLJ Reserves and Resources Report. There is no certainty that any portion of the prospective resources will be discovered and even if discovered, there is no certainty that it will be commercially viable to produce any portion. Estimates of prospective resources involve additional risks over estimates of reserves. The accuracy of any resources estimate is a function of the quality and quantity of available data and of engineering interpretation and judgment. While resources presented herein are considered reasonable, the estimates should be accepted with the understanding that reservoir performance subsequent to the date of the estimate may justify revision, either upward or downward. Full disclosure with respect to the Company’s prospective resources as at December 31, 2022 will be contained in the Company’s annual information form for the year ended December 31, 2022 which will be filed on SEDAR (www.sedar.com) on or before April 30, 2023.
Boe Disclosure
The term barrels of oil equivalent (“boe”) may be misleading, particularly if used in isolation. A boe conversion ratio of six thousand cubic feet per barrel (6Mcf/bbl) of natural gas to barrels of oil equivalence is based on an energy equivalency conversion method primarily applicable at the burner tip and does not represent a value equivalency at the wellhead. All boe conversions in this news release are derived from converting gas to oil in the ratio mix of six thousand cubic feet of gas to one barrel of oil.
Other Metrics
This press release contains metrics commonly used in the oil and natural gas industry, which have been prepared by management, including “F&D costs”, “net asset value”, “net asset value per share”, “operating netback per boe”, “production replacement ratio” and “recycle ratio”. These terms do not have a standardized meaning and may not be comparable to similar measures presented by other companies, and therefore should not be used to make such comparisons.
“F&D costs” are reflected on a per barrel of oil equivalent and are calculated as the sum of capital expenditures in the current year plus the change in FDC for the period, divided by the change in reserves in the period, before current year production. The estimated 2022 F&D costs are computed as follows:
“Net asset value” is based on the before tax net present value of the Company’s reserves as at December 31, 2022, discounted at 10% plus the Company’s net working capital balance estimated as of December 31, 2022. Net working capital is a capital management measure. See “Non-GAAP and Other Financial Measures” below for further details. The estimated net working capital as of December 31, 2022 is unaudited and subject to change upon completion of audited financial statements for the year-ended December 31, 2022. Such changes could be material. See “Unaudited Financial Information” for further details.
“Net asset value per share” is based on the computation of net asset value divided by basic shares outstanding of 36,311,579 adjusted to Canadian dollars based on the foreign exchange rate on February 27, 2023.
“Operating netback per boe” is a non-GAAP financial measure and operating netback per boe is a non-GAAP financial ratio. See “Non-GAAP and Other Financial Measures” below for further details. Alvopetro’s operating netback for the year ended December 31, 2022 is estimated at $59.43 per boe. This estimate is based on unaudited financial information and subject to change upon completion of audited financial statements for the year-ended December 31, 2022. Such changes could be material. See “Unaudited Financial Information” for further details.
“Production replacement ratio” is calculated as total reserve additions divided by current year production. Alvopetro’s 2P production replacement ratio in 2022 is calculated as:
“Recycle ratio” is calculated by dividing the estimated 2022 operating netback by estimated F&D costs per boe for the year. The Company’s estimated 2022 recycle ratio is calculated as follows:
Management uses these oil and gas metrics for its own performance measurements and to provide shareholders with measures to compare our operations over time. Readers are cautioned that the information provided by these metrics, or that can be derived from the metrics presented in this press release, should not be relied upon for investment or other purposes.
Forward-Looking Statements and Cautionary Language
This news release contains “forward-looking information” within the meaning of applicable securities laws. The use of any of the words “will”, “expect”, “intend” and other similar words or expressions are intended to identify forward-looking information. Forward-looking statements involve significant risks and uncertainties, should not be read as guarantees of future performance or results, and will not necessarily be accurate indications of whether or not such results will be achieved. A number of factors could cause actual results to vary significantly from the expectations discussed in the forward-looking statements. These forward-looking statements reflect current assumptions and expectations regarding future events. Accordingly, when relying on forward-looking statements to make decisions, Alvopetro cautions readers not to place undue reliance on these statements, as forward-looking statements involve significant risks and uncertainties. More particularly and without limitation, this news release contains forward-looking information concerning plans relating to the Company’s operational activities, proposed development activities and the timing for such activities, capital spending levels and future capital costs, the expected natural gas price, gas sales and gas deliveries under Alvopetro’s long-term gas sales agreement. The forward-looking statements are based on certain key expectations and assumptions made by Alvopetro, including but not limited to expectations and assumptions concerning the timing of regulatory licenses and approvals, equipment availability, the success of future drilling, completion, testing, recompletion and development activities, the performance of producing wells and reservoirs, well development and operating performance, expectations regarding Alvopetro’s working interest and the outcome of any redeterminations, environmental regulation, including regulation relating to hydraulic fracturing and stimulation, the ability to monetize hydrocarbons discovered, the outlook for commodity markets and ability to access capital markets, foreign exchange rates, general economic and business conditions, the impact of the COVID-19 pandemic, weather and access to drilling locations, the availability and cost of labour and services, the regulatory and legal environment and other risks associated with oil and gas operations. The reader is cautioned that assumptions used in the preparation of such information, although considered reasonable at the time of preparation, may prove to be incorrect. Actual results achieved during the forecast period will vary from the information provided herein as a result of numerous known and unknown risks and uncertainties and other factors. Although Alvopetro believes that the expectations and assumptions on which such forward-looking information is based are reasonable, undue reliance should not be placed on the forward-looking information because Alvopetro can give no assurance that it will prove to be correct. Readers are cautioned that the foregoing list of factors is not exhaustive. Additional information on factors that could affect the operations or financial results of Alvopetro are included in our annual information form which may be accessed on Alvopetro’s SEDAR profile at www.sedar.com. The forward-looking information contained in this news release is made as of the date hereof and Alvopetro undertakes no obligation to update publicly or revise any forward-looking information, whether as a result of new information, future events or otherwise, unless so required by applicable securities laws.
Unaudited Financial Information
Certain financial and operating information included in this news release for the year ended December 31, 2022 including, without limitation, 2022 capital expenditures and the impact on F&D costs, working capital, recycle ratio and operating netback, are based on estimated unaudited financial results for the year then ended, and are subject to the same limitations as discussed under Forward Looking Statements and Cautionary Language set out in this news release. These estimated amounts may change upon the completion of audited financial statements for the year ended December 31, 2022 and changes could be material.
Non-GAAP and Other Financial Measures
This news release contains references to various non-GAAP financial measures, non-GAAP ratios, capital management measures and supplementary financial measures as such terms are defined in National Instrument 52-112 Non-GAAP and Other Financial Measures Disclosure. Such measures are not recognized measures under GAAP and do not have a standardized meaning prescribed by IFRS and might not be comparable to similar financial measures disclosed by other issuers. While these measures may be common in the oil and gas industry, the Company’s use of these terms may not be comparable to similarly defined measures presented by other companies. The non-GAAP and other financial measures referred to in this news release should not be considered an alternative to, or more meaningful than measures prescribed by IFRS and they are not meant to enhance the Company’s reported financial performance or position. These are complementary measures that are used by management in assessing the Company’s financial performance, efficiency and liquidity and they may be used by investors or other users of this document for the same purpose. Below is a description of the non-GAAP financial measures, non-GAAP ratios, capital management measures and supplementary financial measures used in this news release. For more information with respect to financial measures which have not been defined by GAAP, including reconciliations to the closest comparable GAAP measure, see the “Non-GAAP Measures and Other Financial Measures” section of the Company’s most recent MD&A which may be accessed through the SEDAR website at www.sedar.com .
Non-GAAP Financial Ratios
Operating netback per boe
Operating netback is calculated on a per unit basis, which is per barrel of oil equivalent (“boe”). It is a common non-GAAP measure used in the oil and gas industry and management believes this measurement assists in evaluating the operating performance of the Company. It is a measure of the economic quality of the Company’s producing assets and is useful for evaluating variable costs as it provides a reliable measure regardless of fluctuations in production. Alvopetro calculated operating netback per boe as operating netback (a non-GAAP financial measure calculated as natural gas, oil and condensate revenues less royalties and production expenses) divided by total sales volumes (barrels of oil equivalent). More details on the method of calculation is provided in the “Operating Netback per boe” section of the Company’s MD&A. The Company’s MD&A may be accessed through the SEDAR website at www.sedar.com. Operating netback is a common metric used in the oil and gas industry used to demonstrate profitability from operations on a per unit basis (boe). The Company’s operating netback per boe is estimated at $59.43 per boe for the year ended December 31, 2022. This amount is unaudited and subject to change as further discussed in the section “Unaudited Financial Information”.
Capital Management Measures
Net Working Capital
Net working capital is computed as current assets less current liabilities. Net working capital is a measure of liquidity, is used to evaluate financial resources. The Company’s net working capital as of December 31, 2022 is estimated at $14.7 million. This amount is unaudited and subject to change as further discussed in the section “Unaudited Financial Information”.
Will Tesla Investors be Inspired or Disappointed on March 1 (Investor Day)?
Tesla’s Investor Day is March 1st. The lead-up to these events is usually filled with speculation of how the founder, Elon Musk, may surprise EV fans and the investment community. Tesla’s (TSLA) innovations and unique marketing and distribution have made it the most valuable car company in the world. Part of that marketing is the mystique and confidence Musk brings whenever he has an audience. The company is also inspiring as it is less than 20 years in the making and is leading a revolution in how automobiles are built, driven, and fueled.
As plans are kept under wraps, most of the rumors as to what to expect fall in the category of speculation. Below are some of the most likely ideas from past announcements from Tesla and across the internet since the meeting date was announced.
Battery Production
Sourcing raw materials for batteries to make certain new EVs have all the needed components is becoming a concern among car manufacturers.
News has leaked of a proposed $3.6 billion Giga factory to produce up to 100 Gwh of batteries. The factory is expected to be in Nevada and eventually be used to assemble the Tesla semi when production eventually starts.
Tesla is expected to build a processing facility to make lithium hydroxide from spodumene concentrate in Corpus Christie, Texas. The location is good for shipping, and it is close to sources of sulfuric acid from the oil industry. This would be the first lithium hydroxide production facility in the U.S. If true, it would help Tesla fulfill the raw material sourcing requirements of the Inflation Reduction Act to qualify its cars for the $7,500 federal tax credit.
Those deals are at market prices; Tesla would reap the profits from processing the spodumene concentrate into hydroxide, but the bulk of the profit from the material supply accrues to the mining company. Tesla has hinted previously of plans to enter the lithium mining business.
The $25,000 EV
First mentioned in 2020, Tesla’s proposed $25,000 car earned the nickname “fluffy pillow” after Musk showed a picture of an object covered by a blanket that many thought resembled a large pillow. The project was put on hold in early 2022 when Musk said Tesla had too much on its plate.
Tesla’s existing best sellers, the Model 3 and Model Y, have been around for a while, a new model, whether it is the truck or an affordable entry level car would freshen up the line-up.
New Factory
Tesla’s production goals put it at or near capacity. The current factory capacity is listed as 1.9 million vehicles per year. The current goal is six million cars a year by 2026. This would require the expansion of existing plants and then some. A new factory takes three years to design, construct, and get rolling. So planning would have to start now. Musk is more likely to build a new plant than change his production goals.
Thoughts from across the internet suggest this could be in Indonesia or Mexico. Cars built in Mexico could qualify for the $7500 tax credit to purchasers.
Capital Raise
To accomplish the above requires money. Currently, there is construction in progress building out Tesla’s German and Texas factories. Billions more would be needed to implement other plans.
There is as of recent reporting, $22 billion in cash on Tesla’s balance sheet. This is a snapshot of quarter-end and not an accurate representation of the company’s finances. Offsetting this large number is $15 billion in trade payables and $7 billion in accrued payables, much of which is due soon.
Tesla may have to go to the market to raise cash for projects that will be presented on March 1st.
About Tesla Day
The investor event will be live-streamed from Tesla’s Gigafactory in Texas, with some of the company’s institutional and retail investors attending in person. According to Tesla’s press release, investors will be able to see its most advanced production line as well as discuss long-term expansion plans, the generation 3 platform, and capital allocation.
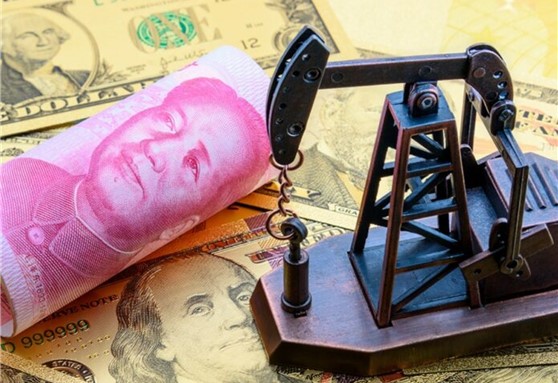
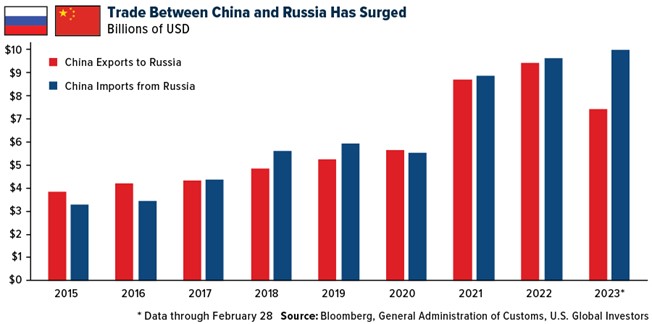
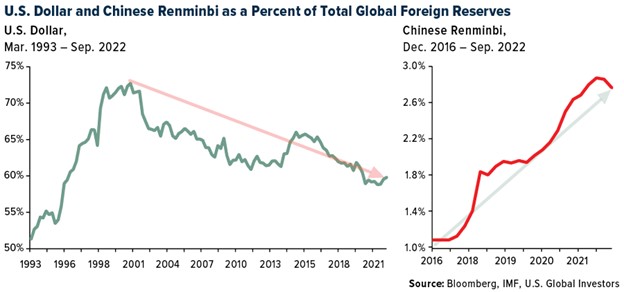
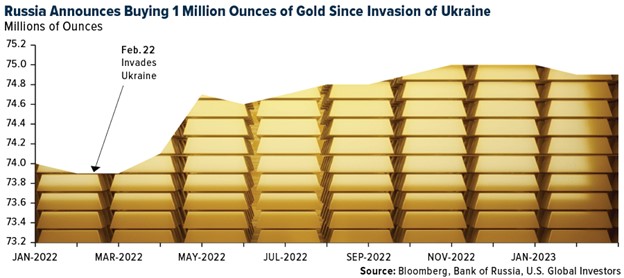


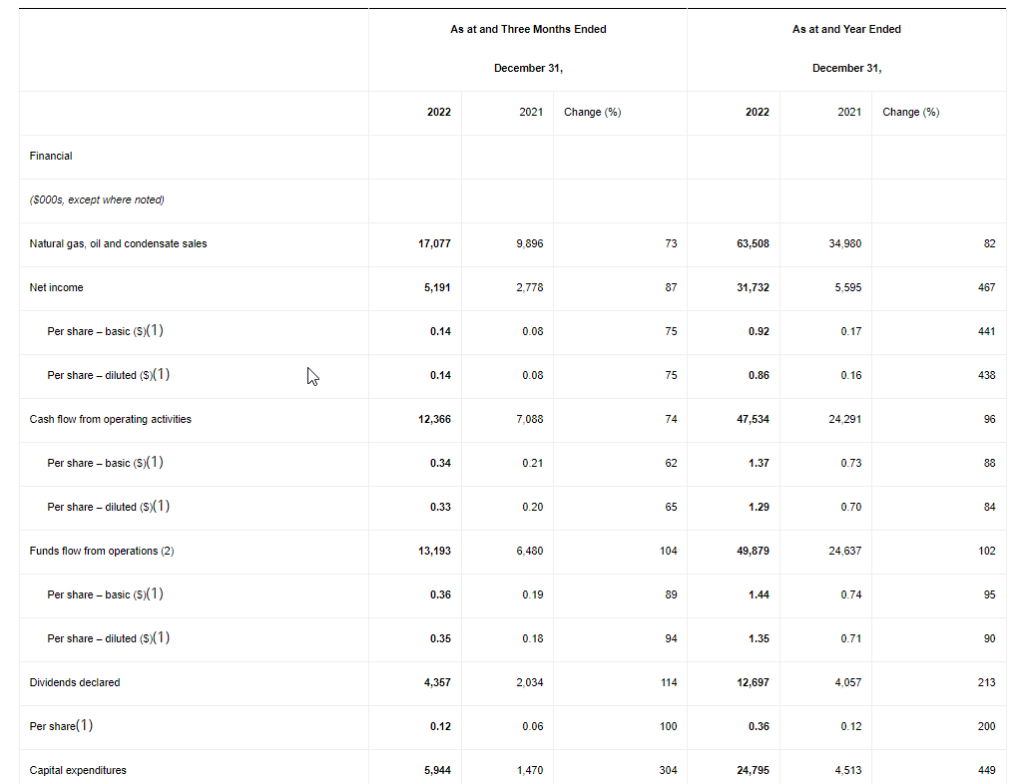
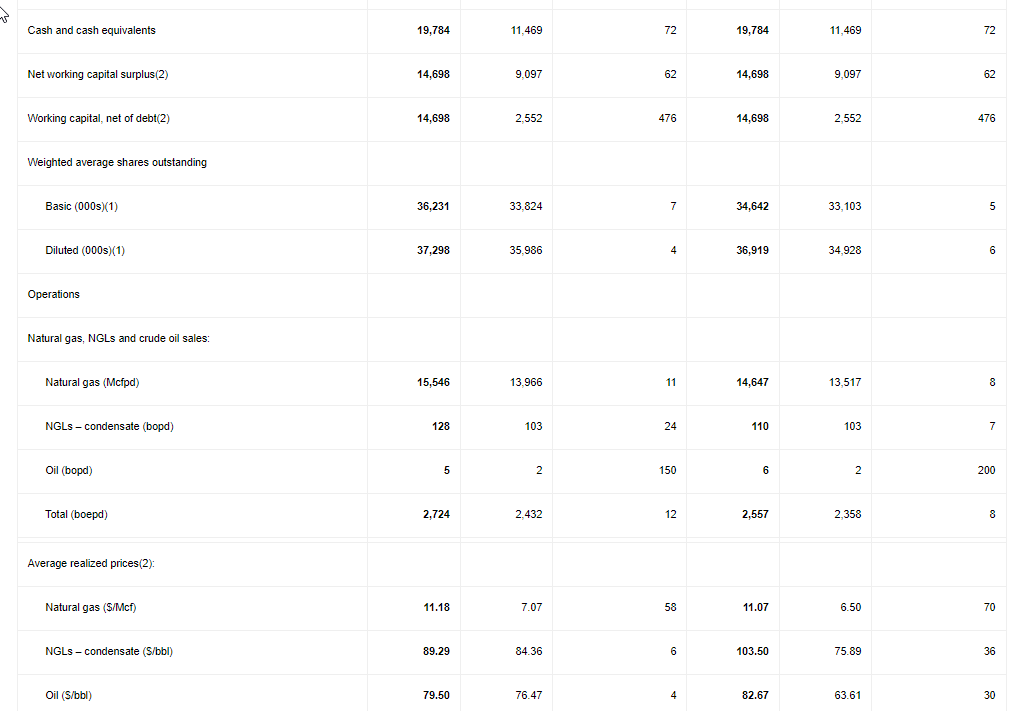
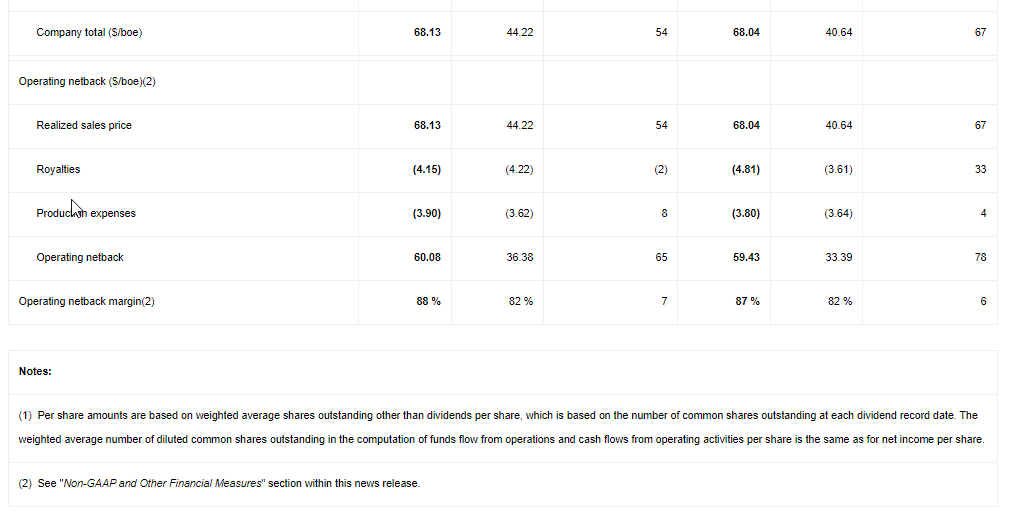
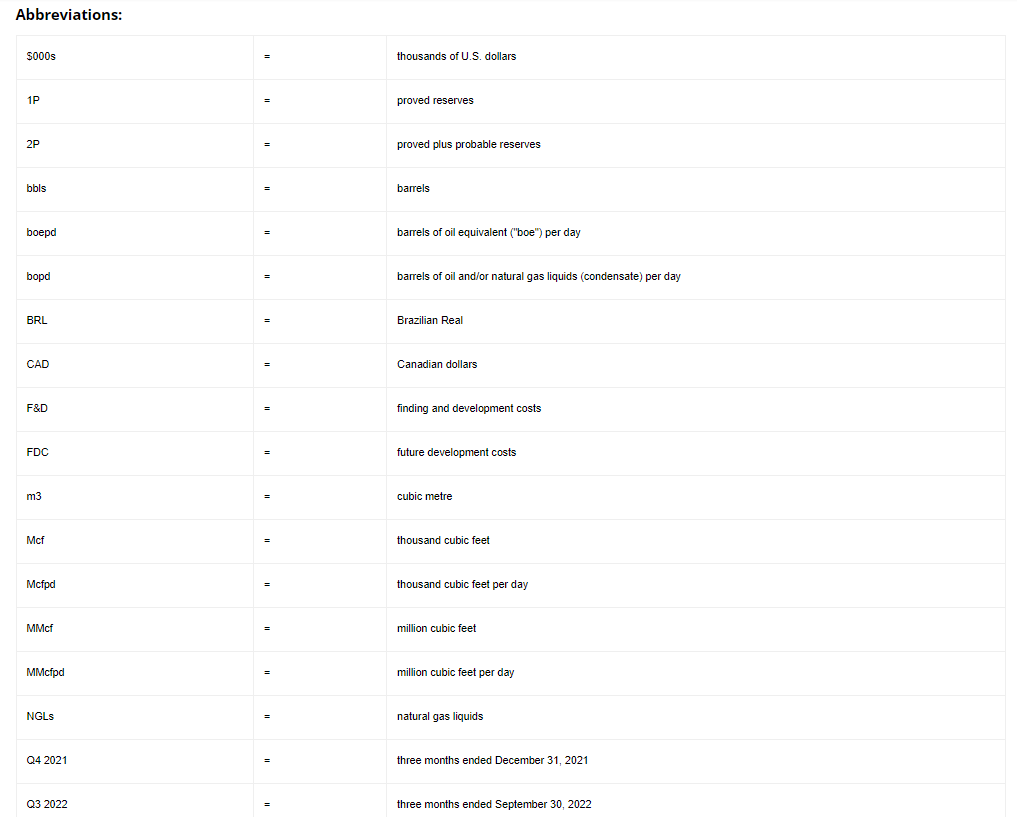

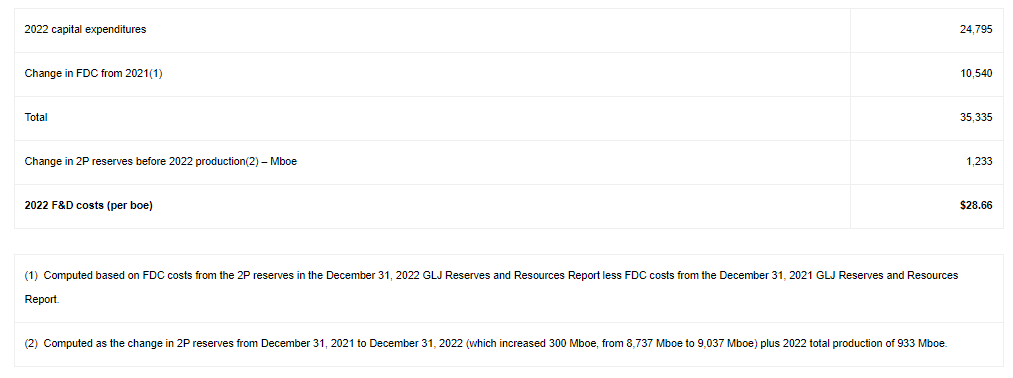
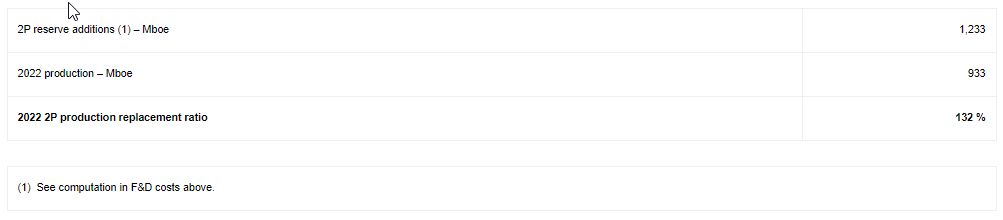
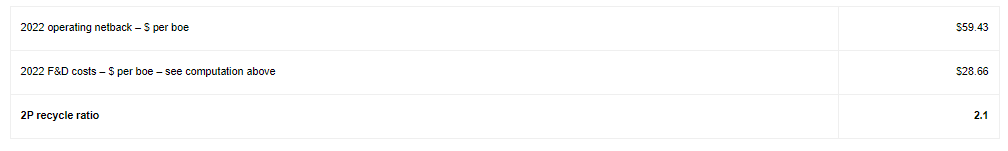
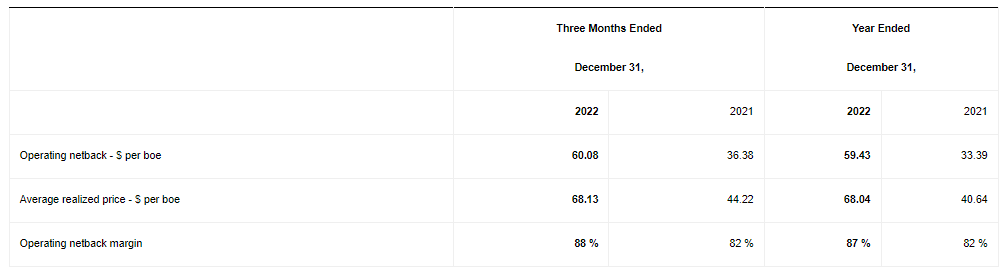
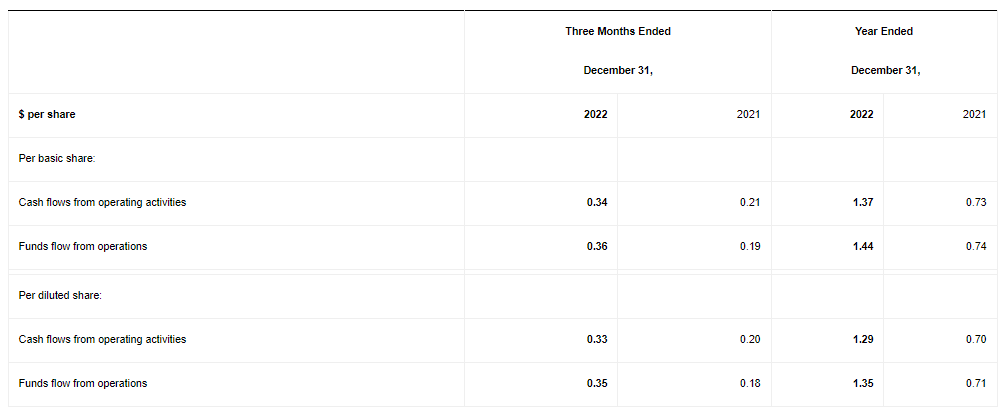
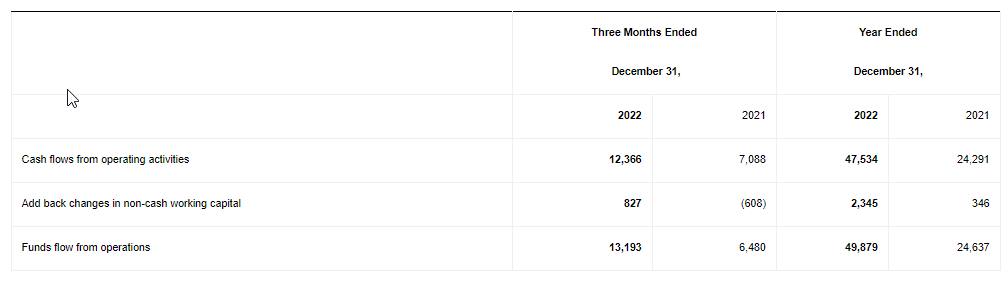
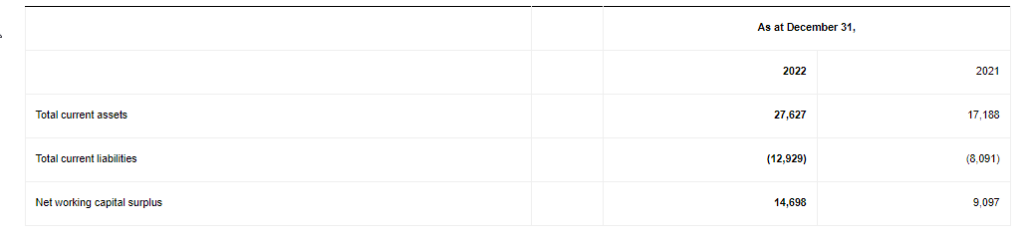
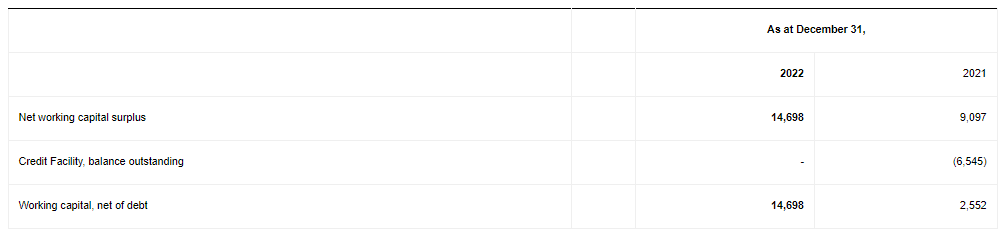


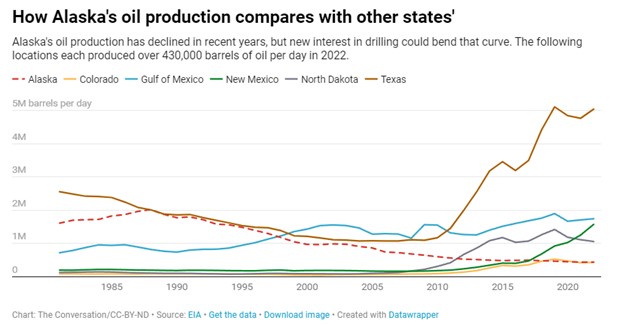


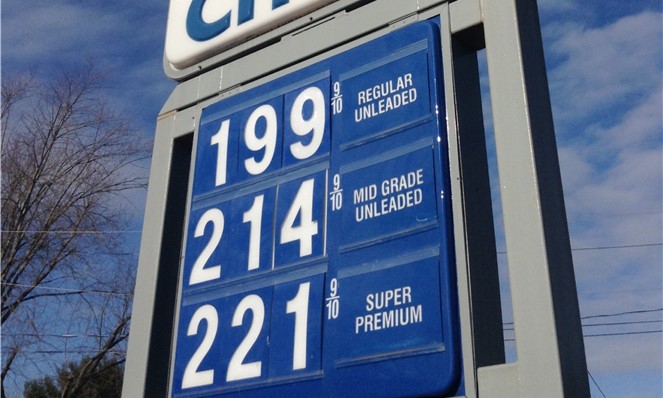
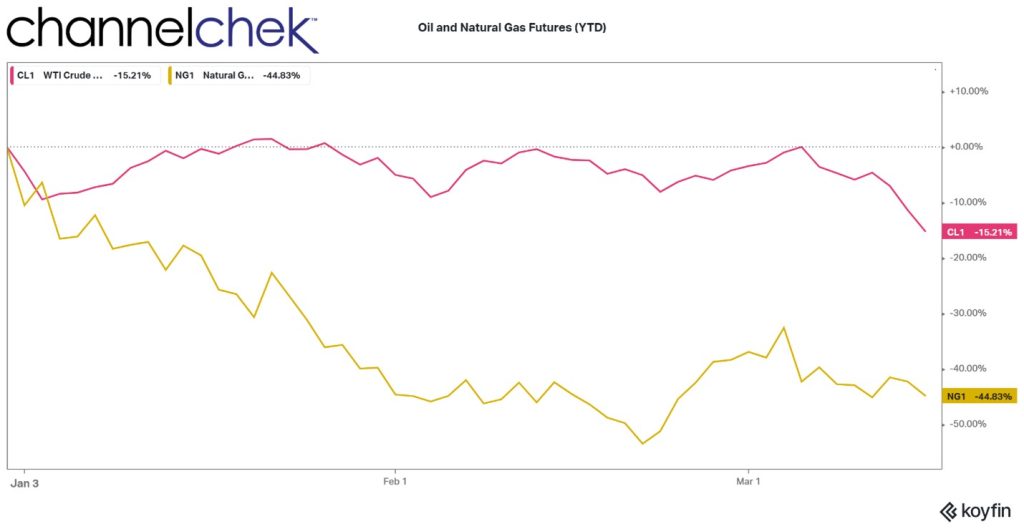

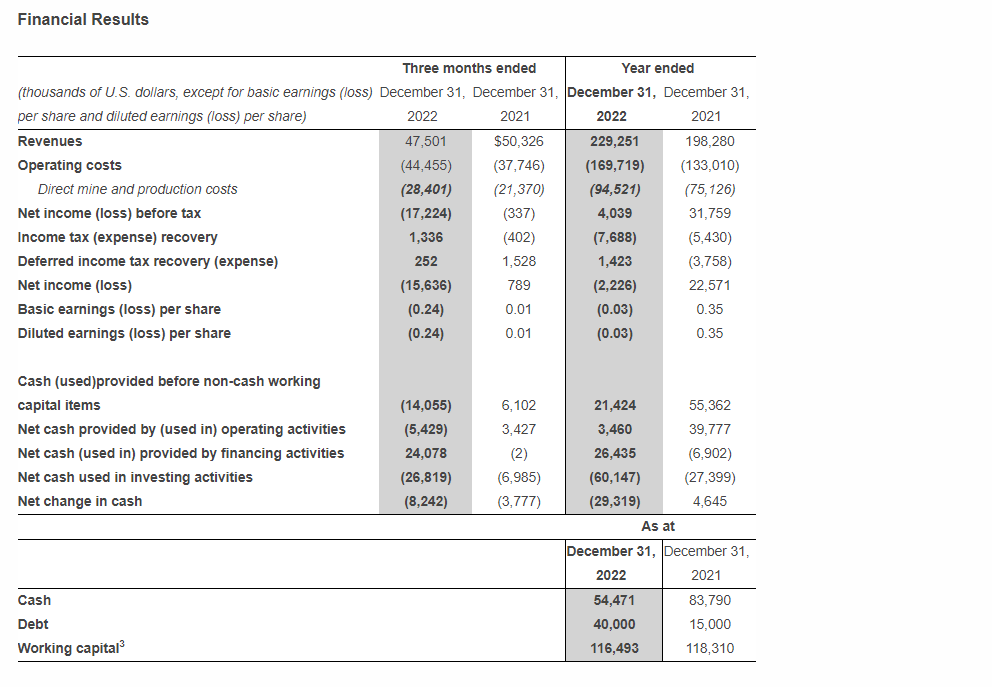
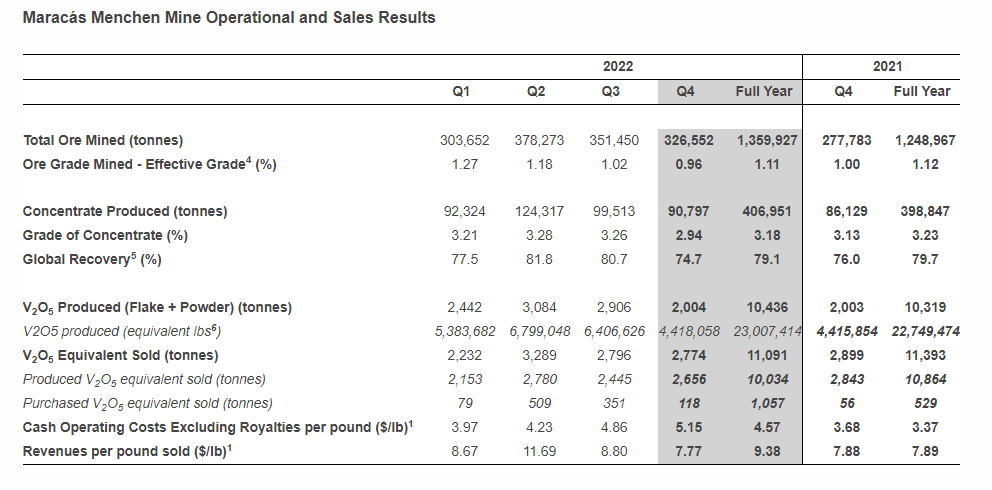

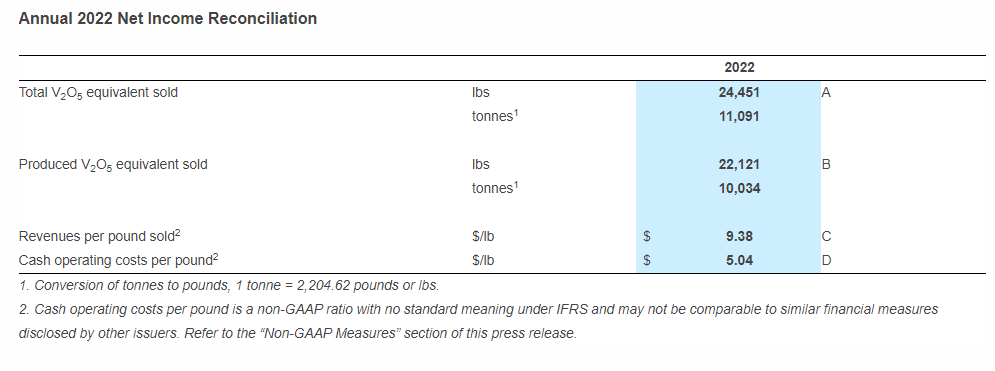
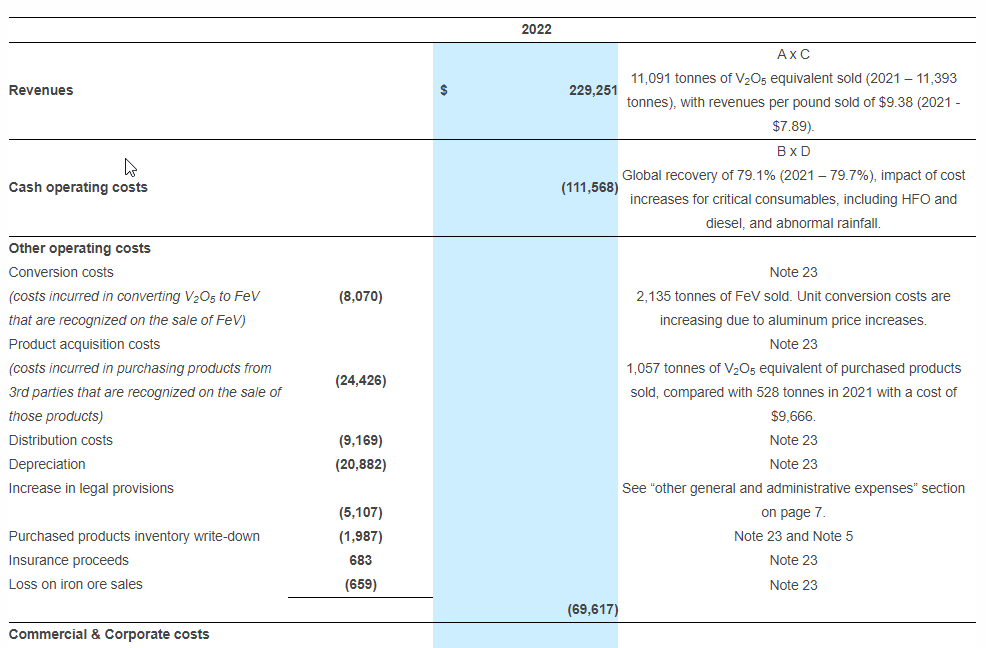
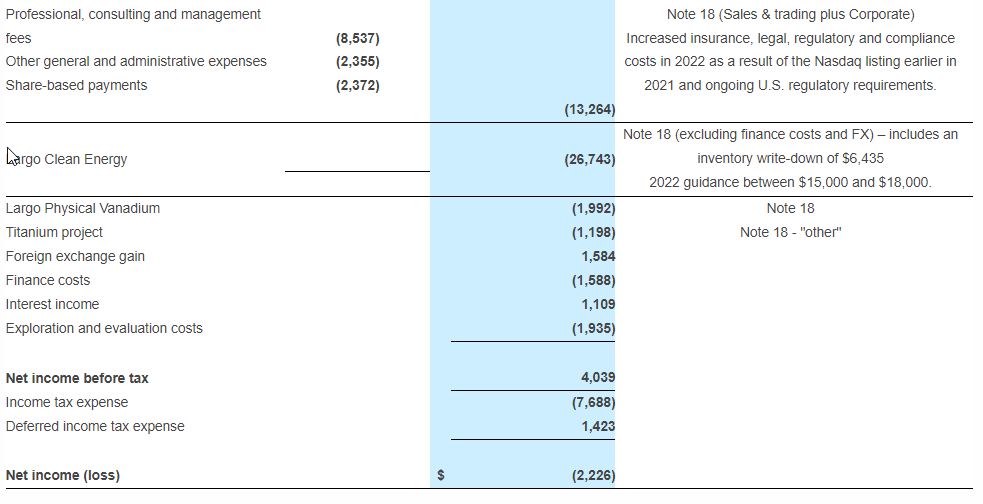
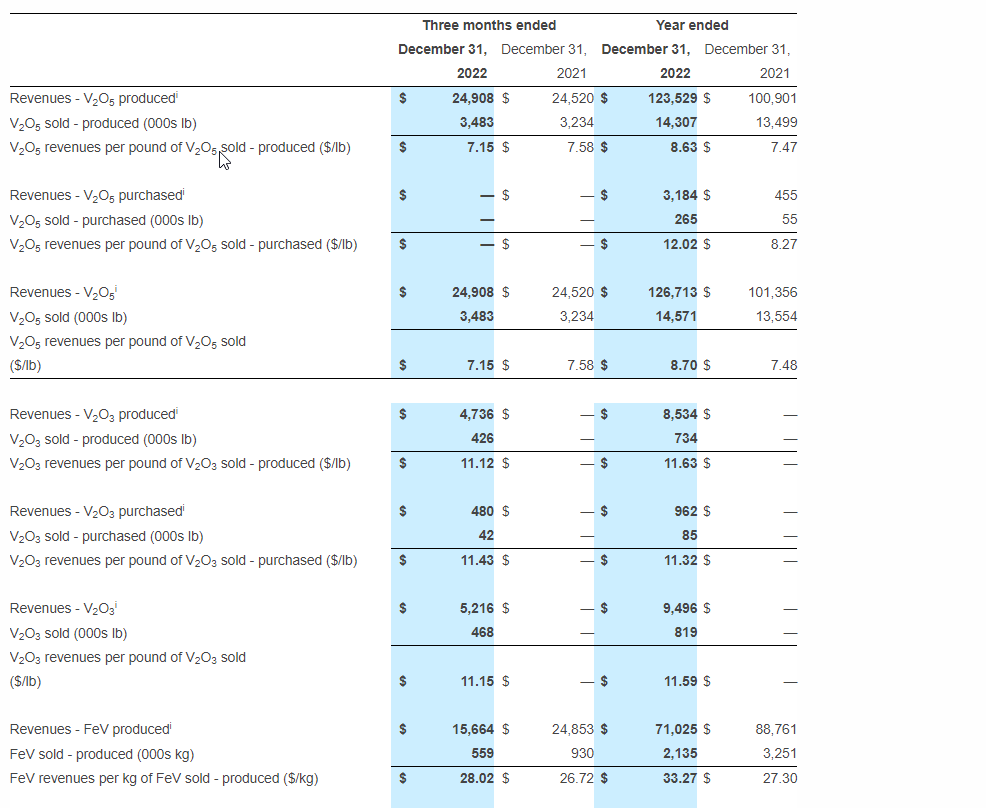
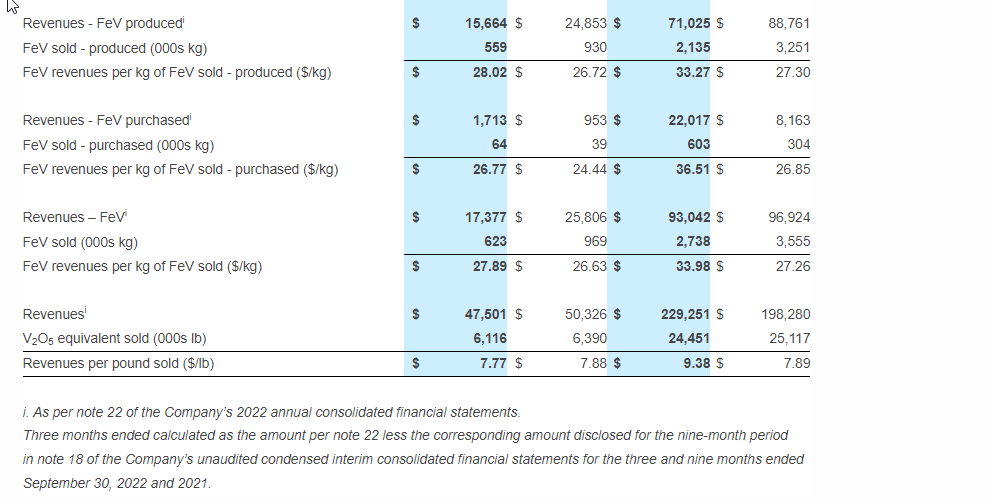
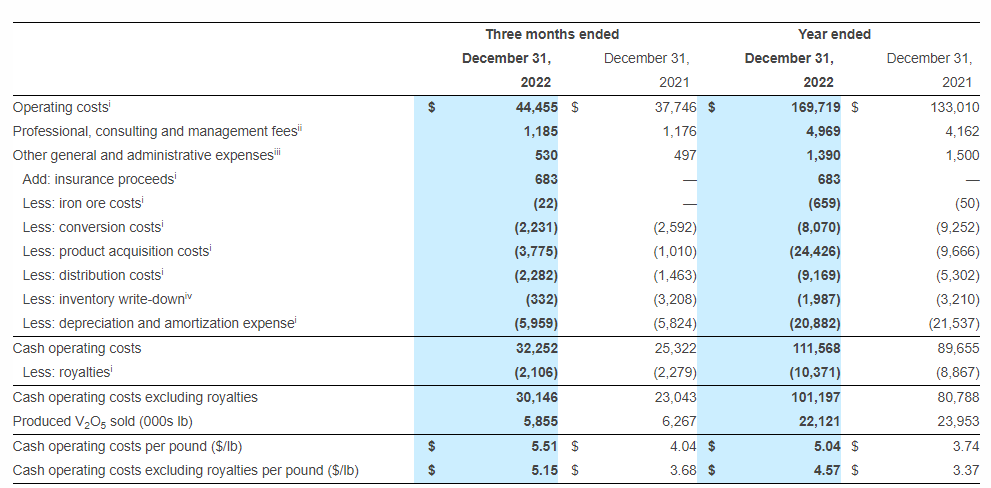
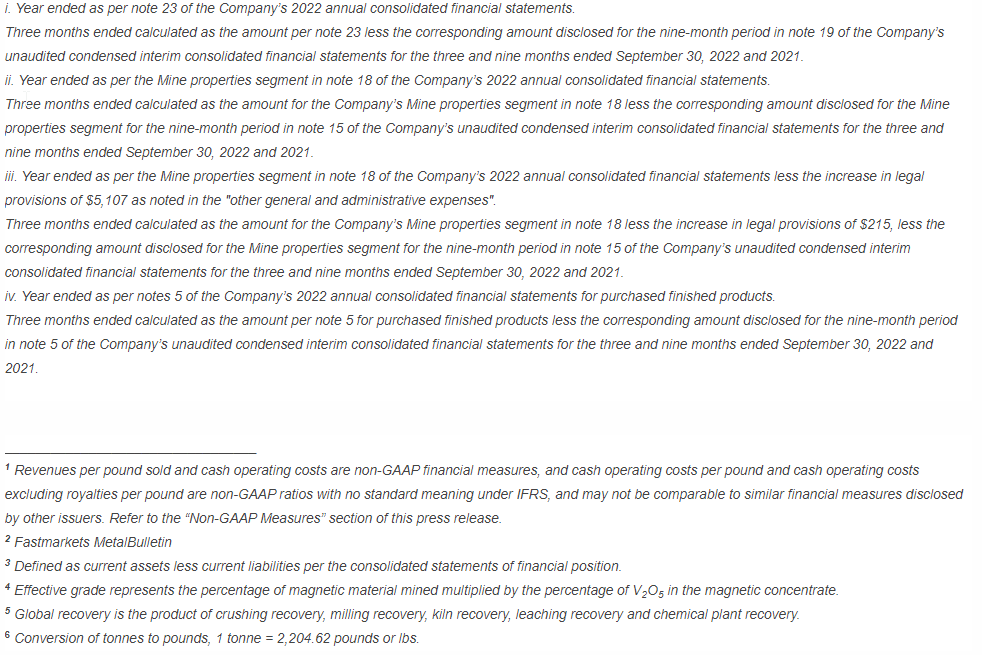
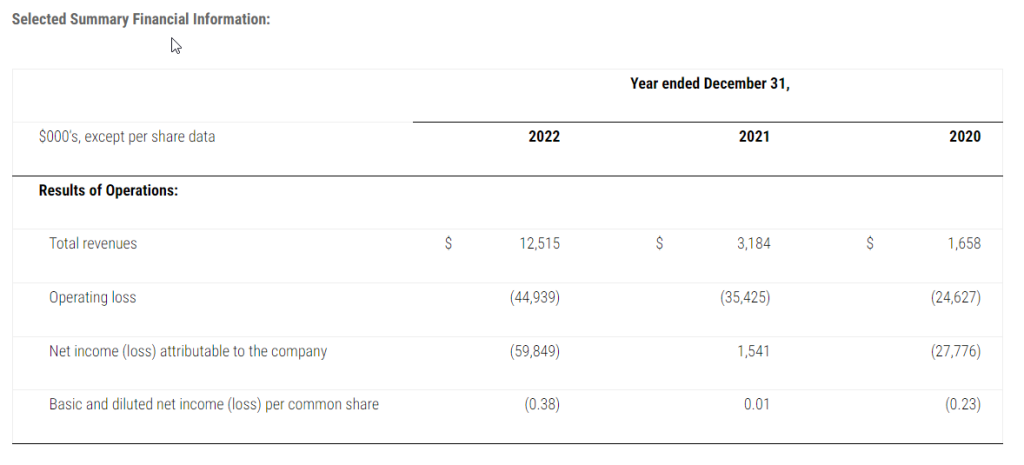
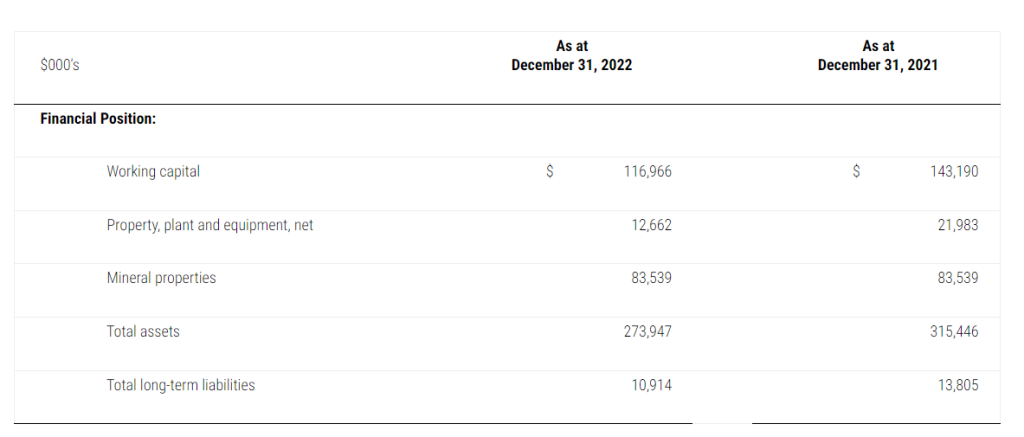


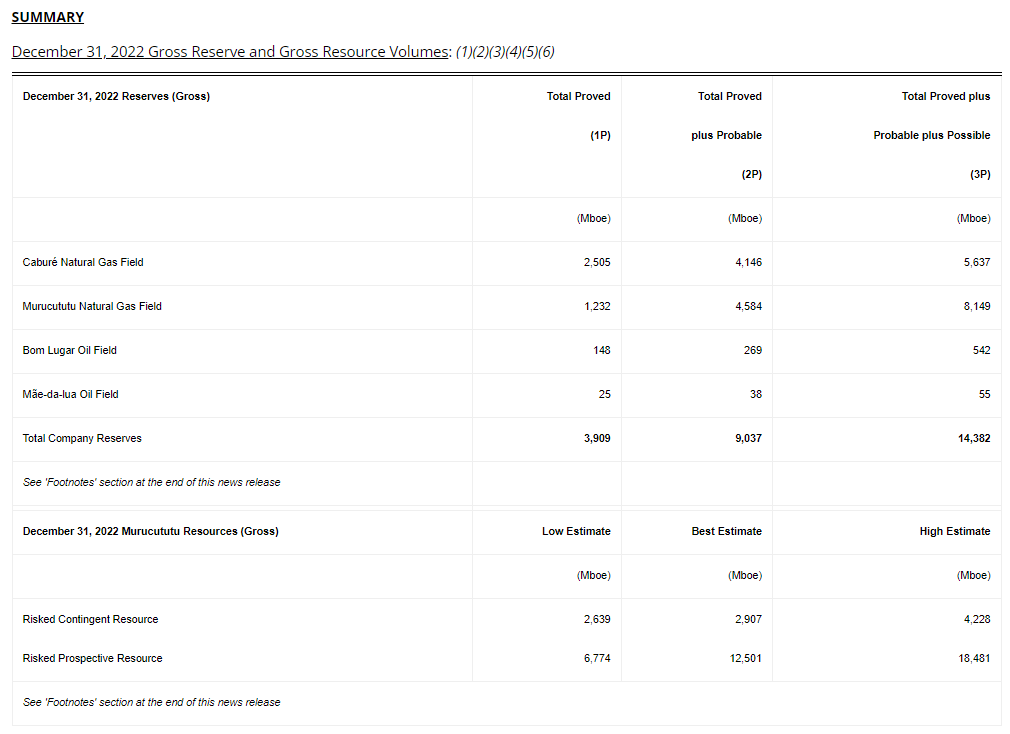
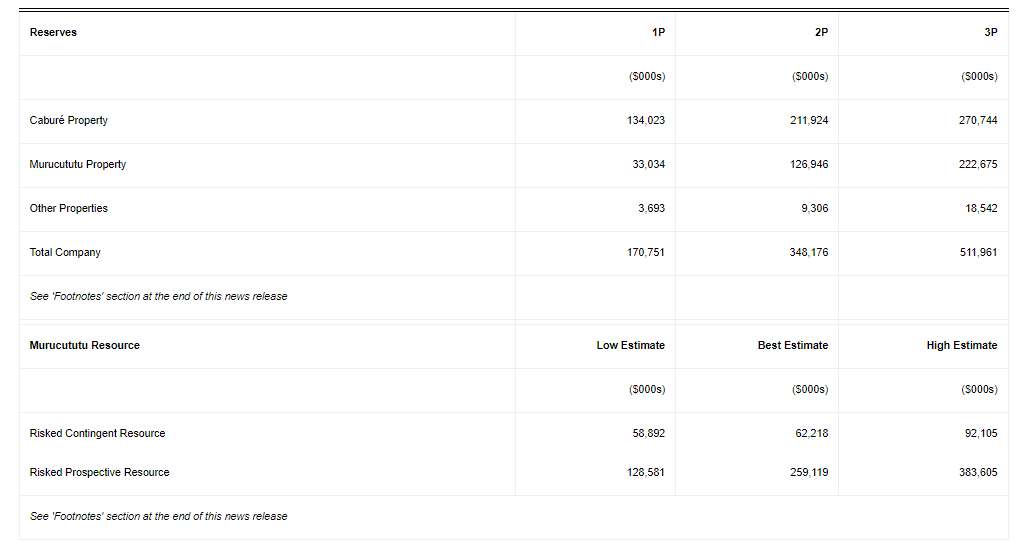
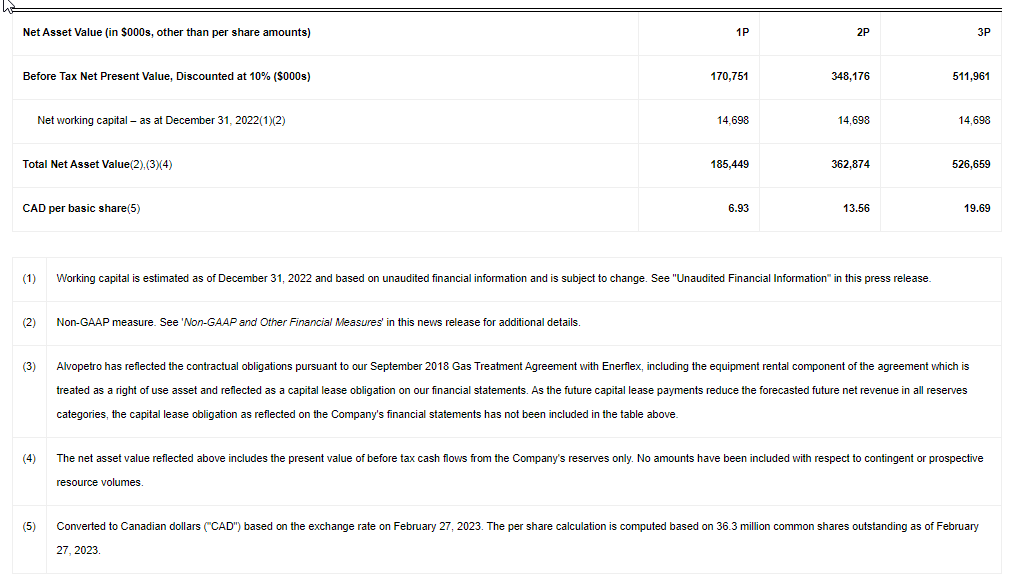
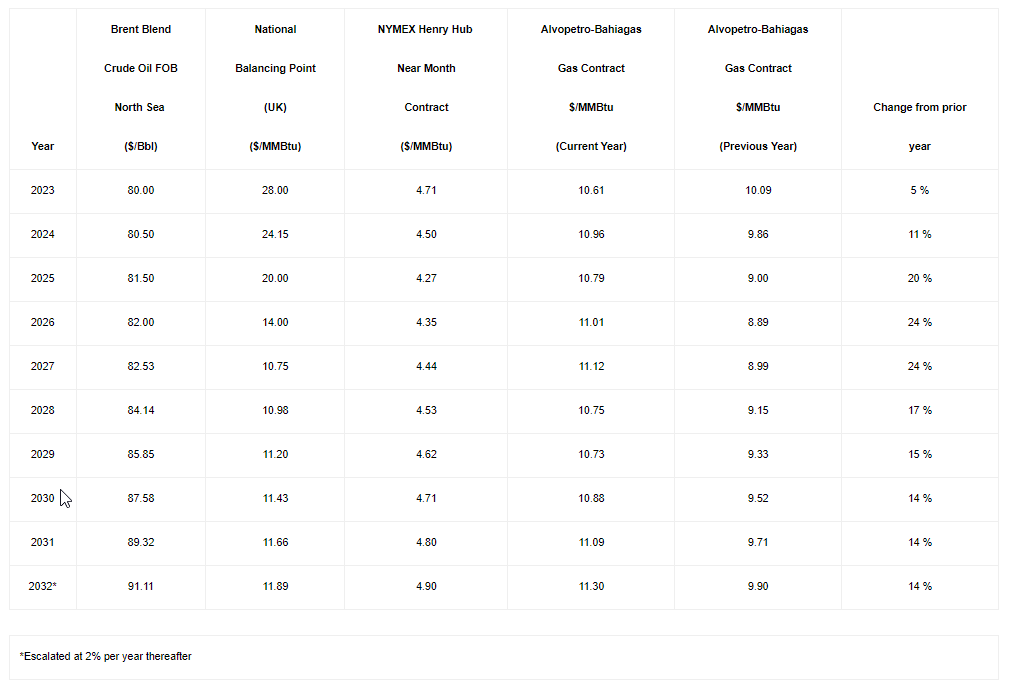
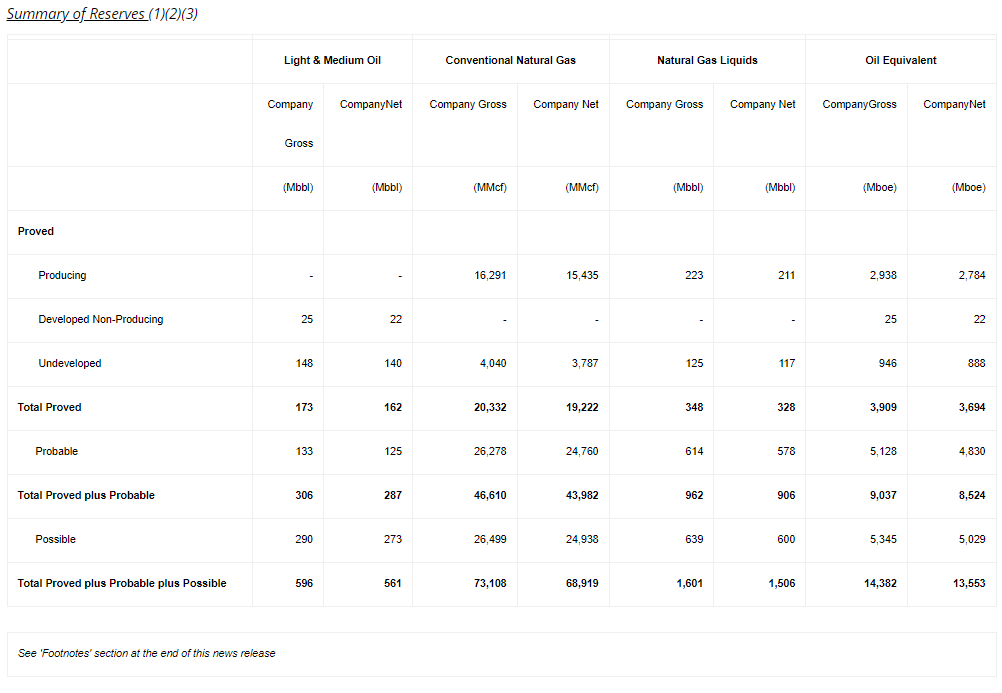

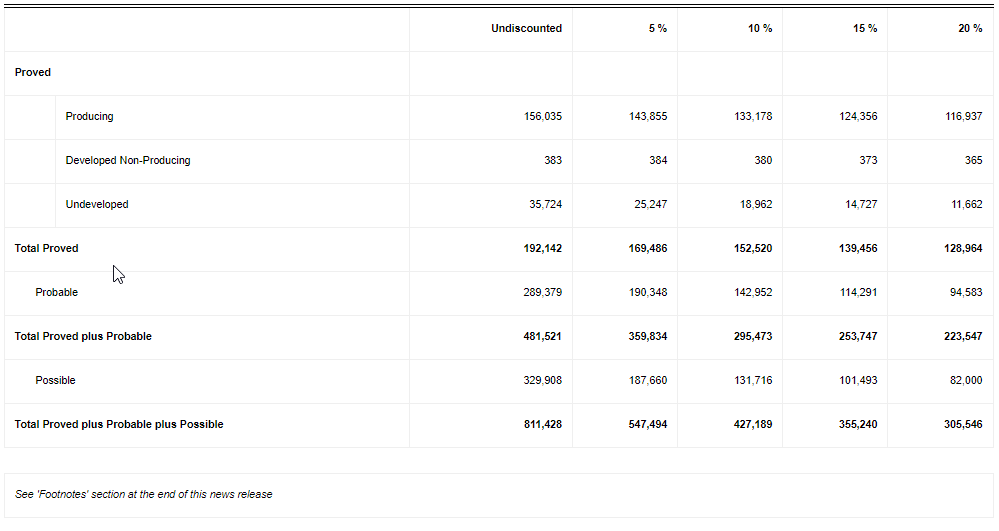
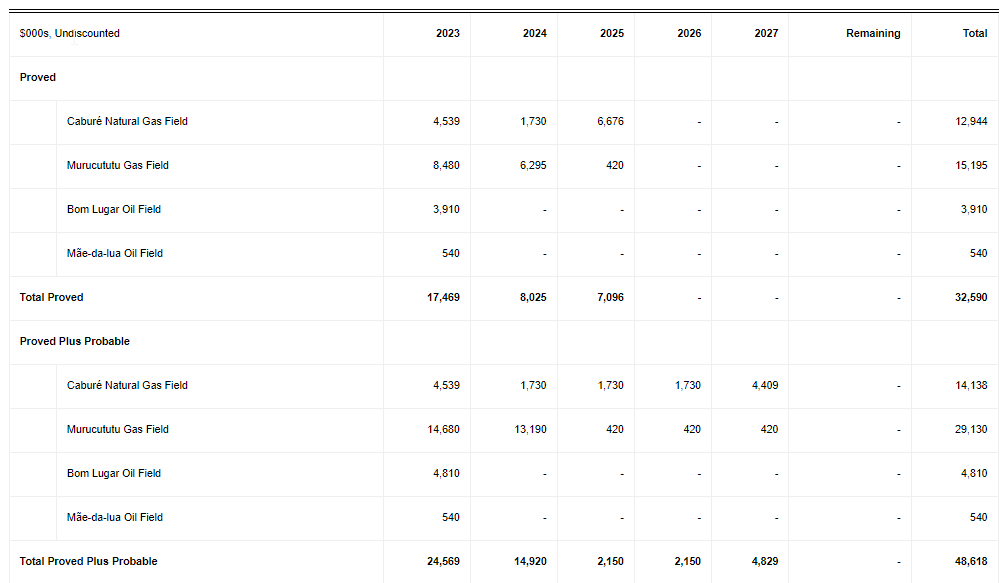
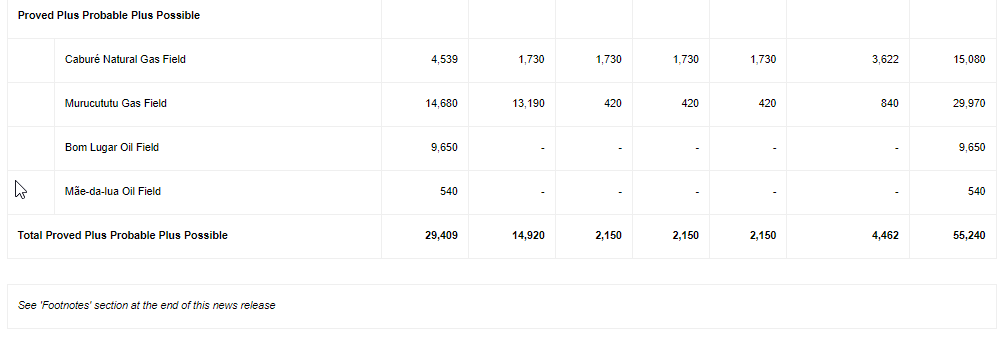
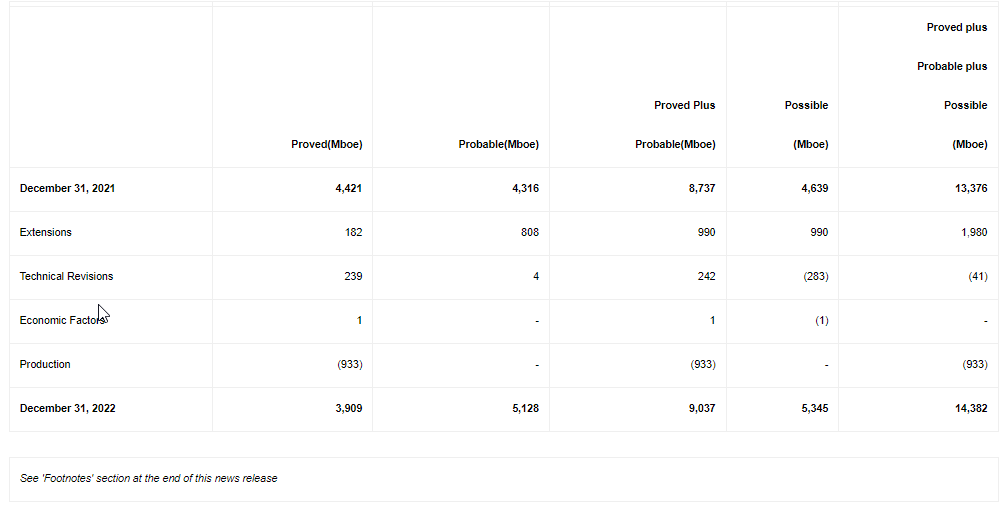
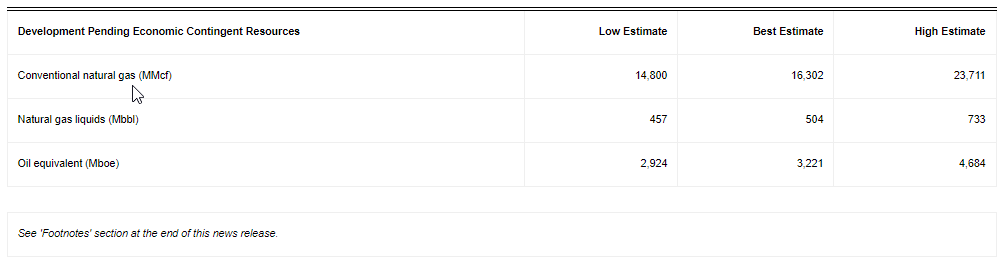
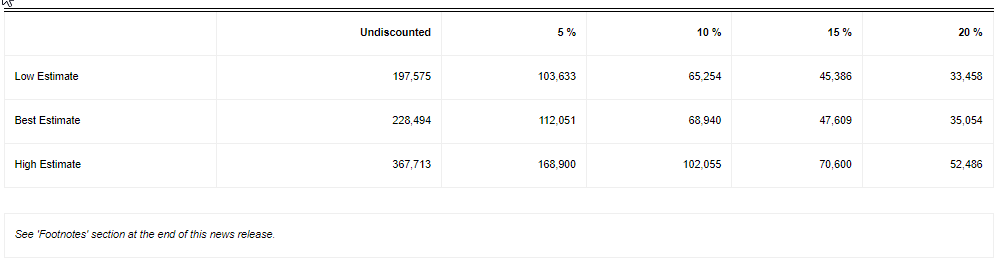
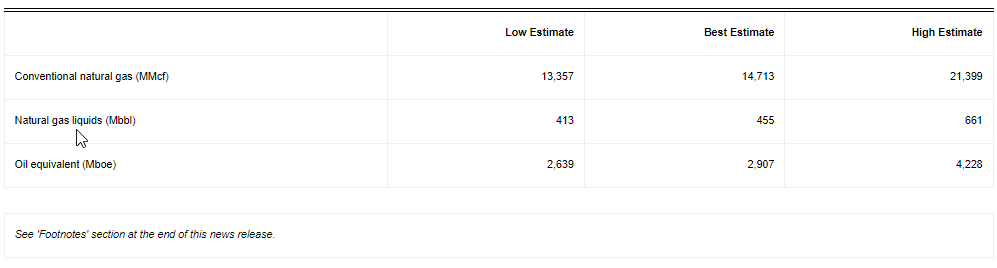
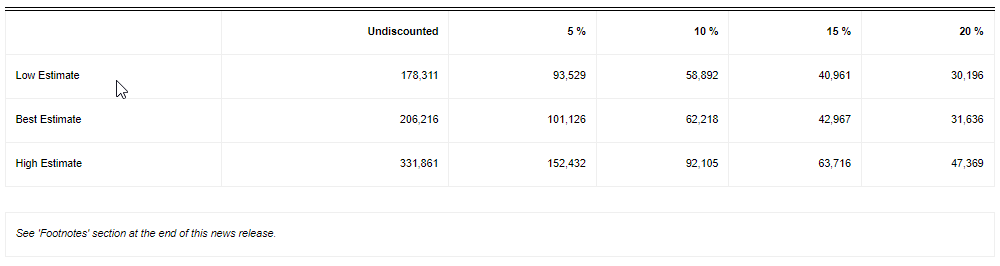


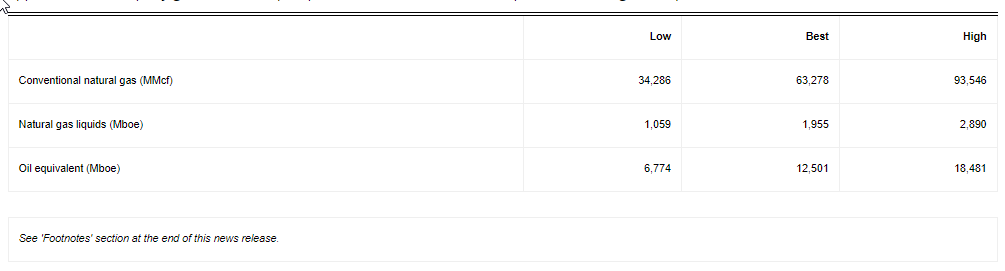
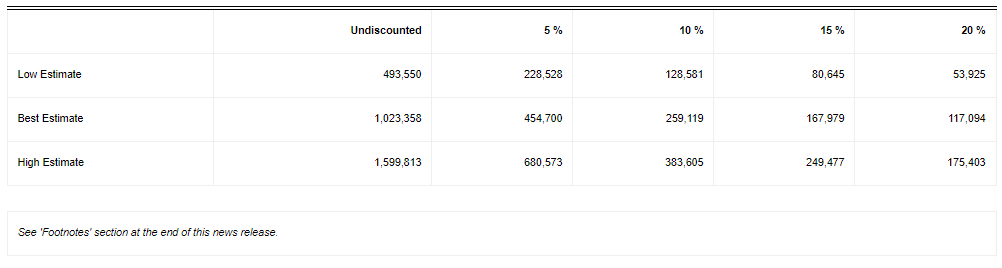
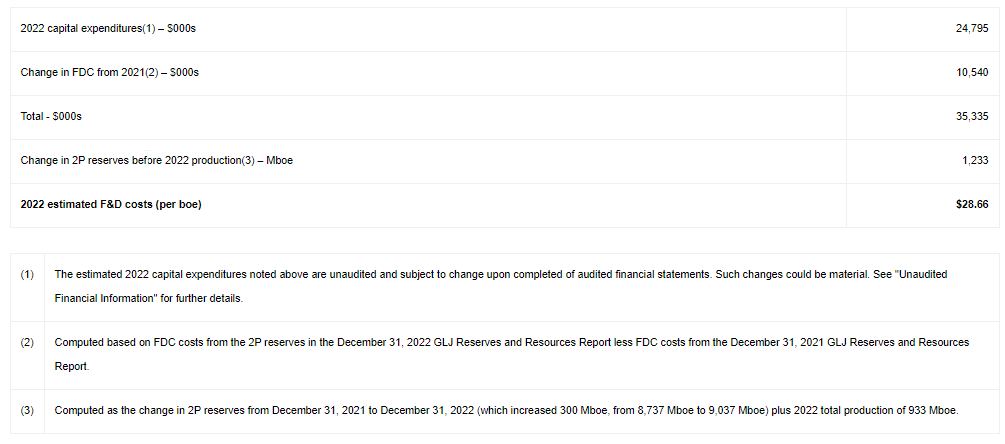
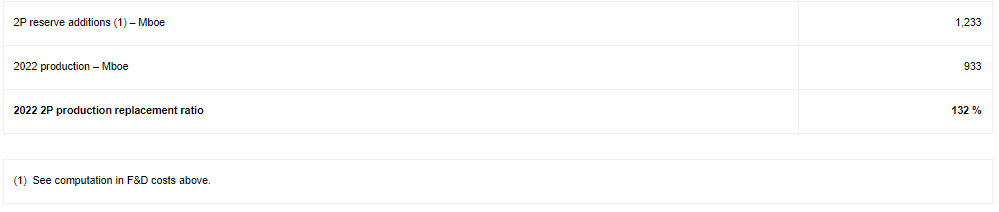
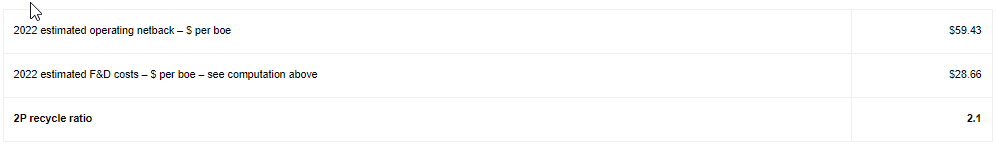
