Job Market Stats Suggest More Clarity, More Clarity Suggests More Economic Activity
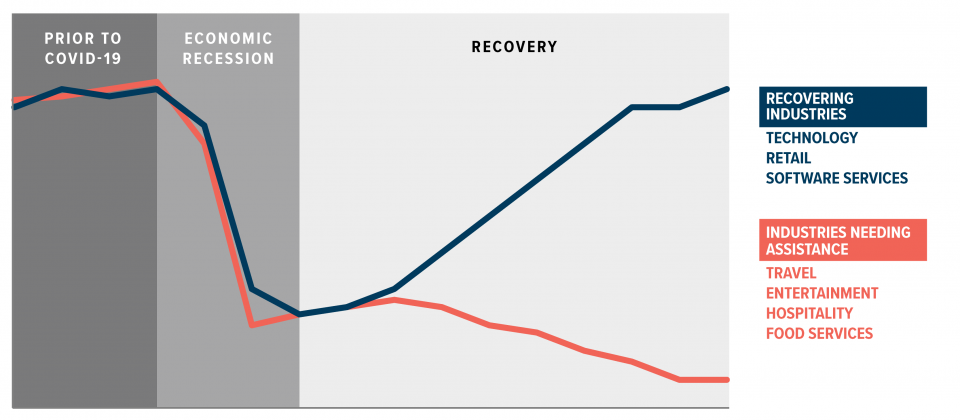
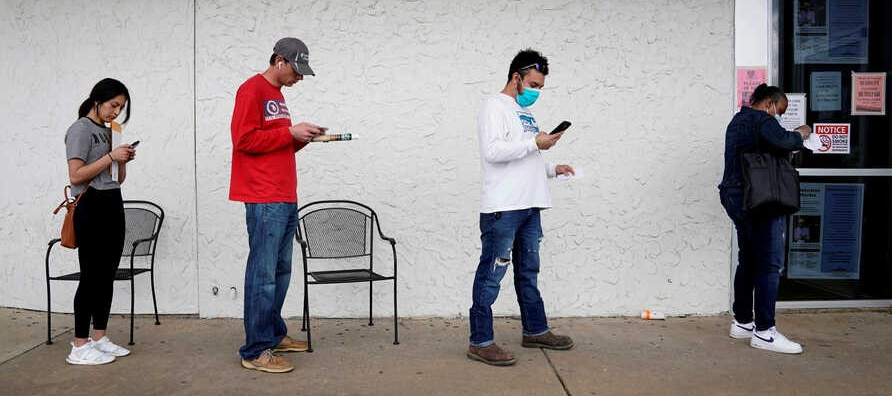
Earlier this year, after both individuals and companies in the U.S. began to grasp that North America is not immune to the lockdowns and distancing experienced overseas, and both groups took steps to protect and prolong their financial positions. Companies that had infrastructure plans to enhance operations or production put those orders on hold. Many withdrew from signing agreements for services such as marketing, investor relations, hiring, and hiring. Some went as far as suspending existing agreements. Individuals acted in a similar fashion. Plans that included financial commitments like buying a car, starting a small business, or changing jobs were paused while households waited for greater clarity.
Small signs have been emerging recently that companies in many industries are now cautiously open to investing in their future. Spending includes new hires, infrastructure, and marketing. The consumer has been slower to enter into commitments. New car sales are down 20%, retail sales seem contingent on stimulus pay, and overall frugality remains the trend. However, there is a recent indication that individuals are willing to play it less than safe. The indication isn’t in consumption or other retail sales; it’s in a section of the Bureau of Labor Statistics (BLS) report on unemployment. A table that usually gets little attention.
JOLTS
The job openings and labor turnover survey (JOLTS) is conducted monthly by the BLS to help measure job vacancies. The labor department’s definition of vacancies is positions that have become available, the companies are looking for candidates to fill the openings that could start within 30 days. A section of this monthly survey is at a five-month high as of July. This could indicate that U.S. workers feel renewed optimism and understanding to a large enough extent that they are willing to take risks with their financial stability.
The Numbers
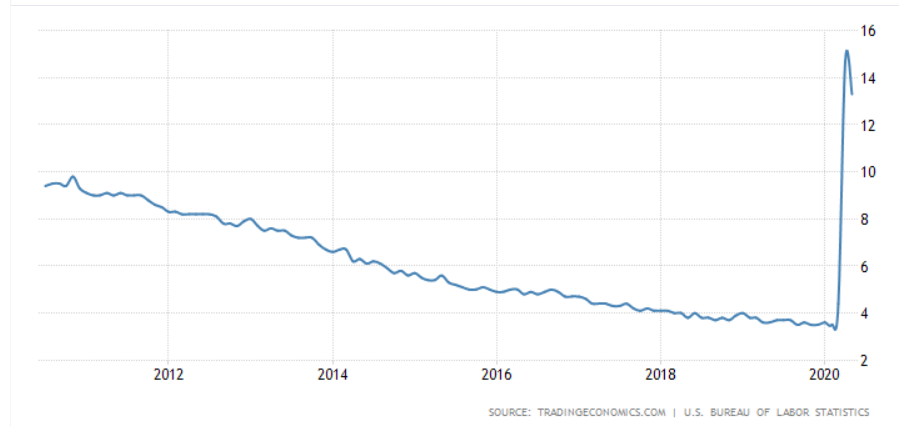
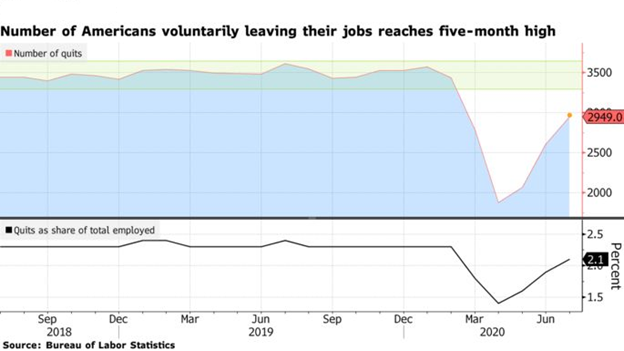
The report released on September 9 shows that nearly 3 million people quit their job in July. This is a large increase of 344,000 over June. What’s most impressive is the number of job leavers as a share of total U.S. employees rose to 2.1%; this is close, but still below, the 2.3% that was prevalent previously while the unemployment rate was near historic lows.
The improvement in confidence demonstrated by people’s willingness to resign is not the same across industries or regions. Those holding positions in mining, real estate, and business services were most likely to quit their jobs. Workers in positions in the fields of hospitality and manufacturing were less likely to resign compared to the prior month.
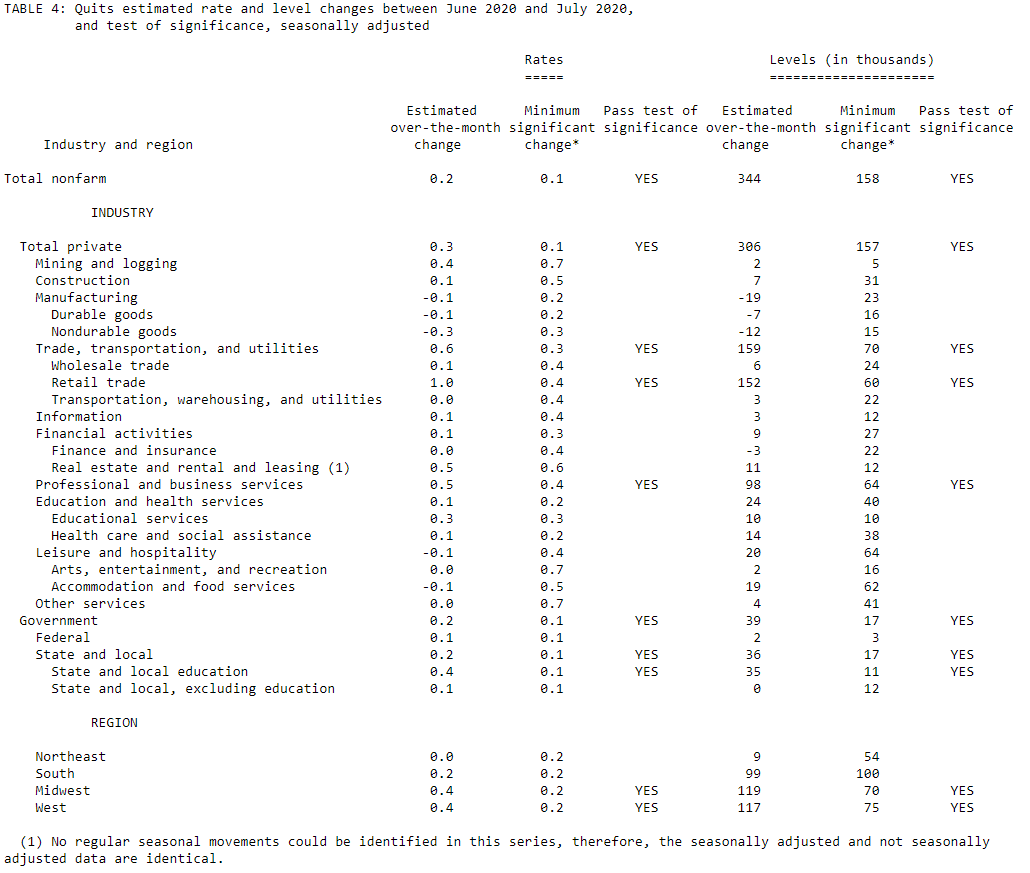
SOURCE: Bureau of Labor Statistics, Job Openings, and Labor Turnover Survey, September 9, 2020.
Devil’s Advocate
As with any set of economic statistics, a lot is impacting the number of quits each month. Certainly, there are many factors. During this year, when workers are perhaps more concerned about health risks in their work environments, or unrest in their towns, one would presume this would motivate and add to resignations. Digging into the data and reviewing the nature of the positions where resignations are highest, it suggests that health, civil unrest, and even childcare are not significant factors. Although an argument can be made that these concerns are motivators in retail quits, it doesn’t explain office professionals who are not likely to have higher childcare issues than they have most summers. Moreover, utility workers, those in retail, real estate professionals, and mine workers are in positions less likely to be impacted than those showing reduced quits such as manufacturing, finance, and food services.
In the past, an increase in resignations overall or in the industry suggested an increase in bargaining power (demand for positions increase or supply of workers decreased). This has not been the case for the industries with the greatest pickup in quits.
Peter Morici, an economist and professor emeritus at the University of Maryland, believes the quits should be viewed as a sign of progress in the job market; his reasoning is any concerns workers may hold are not new for July, yet resignations materially rose. He believes Americans are learning to live with the virus, so the increase in the rate of quitting foretells more career and personal confidence than prior months.
Take-Away
As individual workers and companies learn better to assess the current environment and the options available, they become more likely to make decisions. As with many other areas of life and business, postponing a decision or standing still should also be viewed as a decision. That decision should be given as much review as making a move. Doing nothing is often riskier than continuing to move in ways that will help your future. Individuals and or corporate management should always remain mindful that they’re continually in competition. Those they are in competition with are moving in ways that they believe will give them an advantage. There will be costs to those focusing too closely on those things already under better control and not opportunities that they have put on hold.
The next BLS report that will include JOLTS for the month of August will be released on October 6.
Paul Hoffman
Managing Editor, Channelchek
Suggested Reading:
The Risk of Economic Confidence Waning
Will There be an Explosion in New Acquisitions
Equity Markets Give a Lesson in Behavioral Psychology
 View our full schedule of Virtual Road Shows and sign up for one here.
Sources:
Consumer Sentiment Dropped as Stimulus Checks Ran Out
Amazon Update, How We’re Responding to the Crisis
March 21, 2020 email from Jeff Bezos
Picture: Wolf of Wall Street (quitting scene)