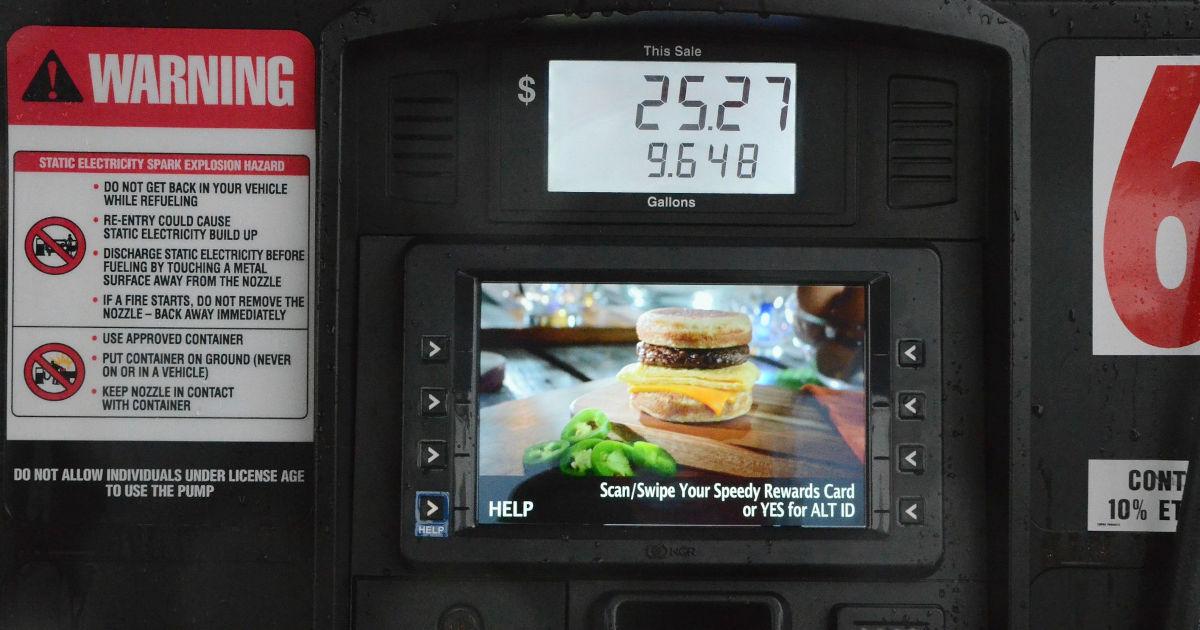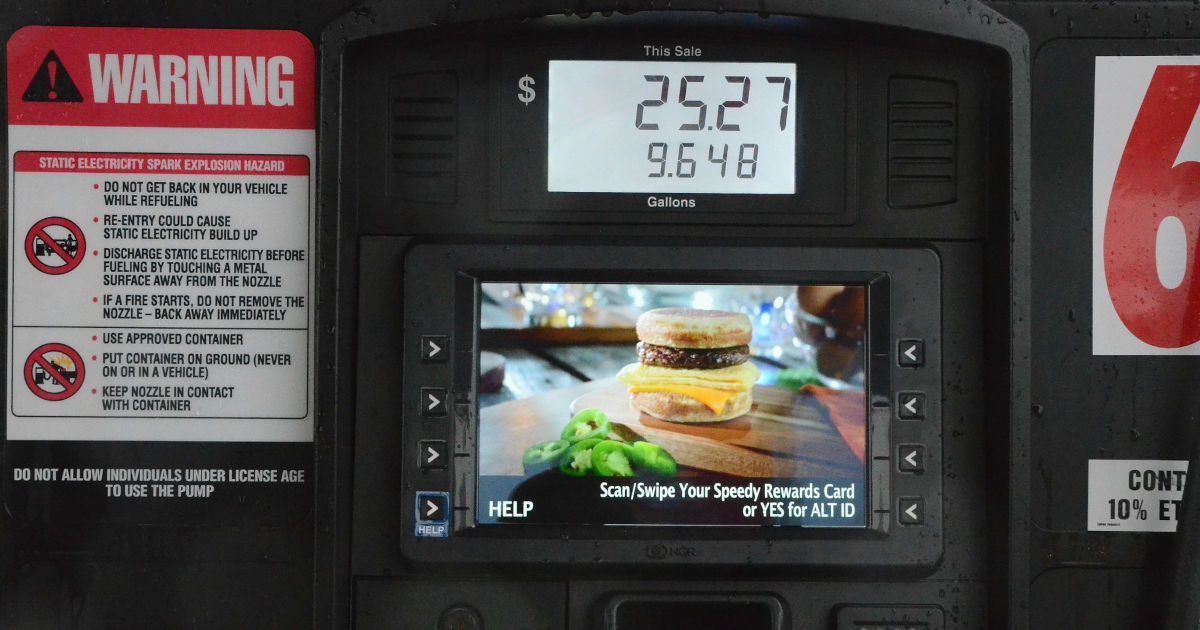
Image credit: Jazz Guy (Flickr)
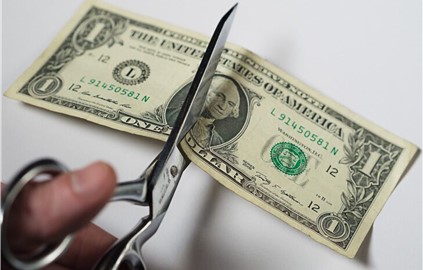
The Gas Tax’s History Shows How Hard it is to Fund Infrastructure Spending
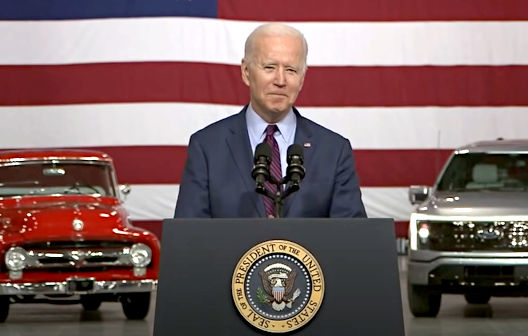
As the Biden administration and Republicans negotiate a possible infrastructure spending package, how to pay for it has been a key sticking point.
President Joe Biden and Democrats in Congress want to raise taxes on the rich, while some Republicans have been pushing for an increase in the gas tax – which would be the first in 28 years. A bipartisan group of senators recently crafted a compromise bill that would pay for just under US$1 trillion in spending on rail, roads and bridges over five years in part by indexing the gas tax to inflation. Democrats call this regressive because it would raise taxes on working Americans.
As the director of energy studies at the University of Florida’s Public Utility Research Center, I’ve studied both taxes on energy and how the government spends money on infrastructure.
Throughout the gas tax’s controversial history, leaders have frequently called upon this revenue source when serious infrastructure investment is needed.
The First 40 Years
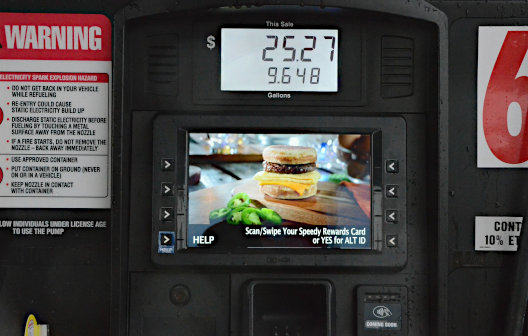
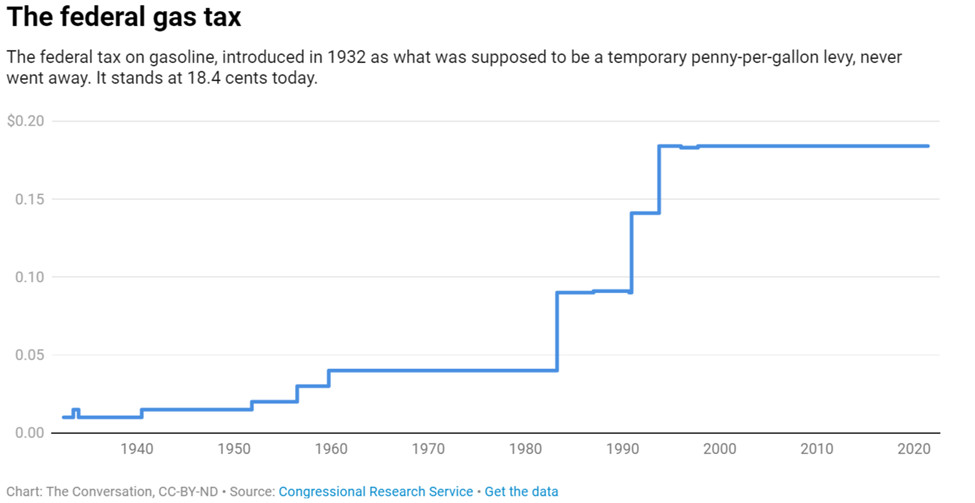
This resilient levy is a major source of U.S. funding for roads and transit today. It originated during the Great Depression as a “temporary” penny-per-gallon gasoline tax. At the time, a gallon cost about 18 cents, or about $2.90 in 2021 dollars.
As he signed the Revenue Act of 1932 into law, President Herbert Hoover lauded “the willingness of our people to accept this added burden in these times in order impregnably to establish the credit of the federal government.”
The original gas tax, an emergency measure intended to bolster the budget and fund national defense spending, not to meet transportation needs, was slated to expire in 1933. Instead, persistent budget deficits throughout the New Deal and World War II kept it in force throughout Franklin D. Roosevelt’s administration over the objections of the oil, automotive and travel industries. It became a permanent 1.5-cent levy in 1941.
Multiple efforts to do away with the gas tax ever since have failed.
For example, Congress again scheduled the tax’s repeal in 1951 when it increased it to 2 cents as a source of revenue related to the Korean War. Instead, lawmakers agreed to keep the tax on the books to help pay for one of President Dwight D. Eisenhower’s top priorities, the national interstate highway system.
In 1956 the levy rose once more, to 3 cents, when Americans were paying about 30 cents for a gallon of gas. At the same time, the government established the Highway Trust Fund to use the gas tax revenue to pay for building and maintaining the new interstates.
The tax rose to 4 cents per gallon in 1959 and froze at that level for more than two decades.
Running on Empty
Gas tax revenue stopped keeping up with the expenses it was supposed to cover in the early 1970s following a severe bout of inflation and OPEC’s oil embargo. U.S. gas prices soared from about 36 cents per gallon in 1972 to $1.31 in 1981.
Responding to what members of both major political parties saw as a transportation infrastructure crisis, Congress more than doubled the tax to 9 cents per gallon as part of the Surface Transportation Assistance Act of 1982. The same law split the Highway Trust Fund and its revenue stream into two parts: The first 8 cents would finance roadwork while the other penny would finance mass transit projects.
This hike may have struck drivers as a sharp increase, but public spending on transportation infrastructure would continue to fall as a percentage of all outlays.
In 1984, Congress increased spending on highways by funneling proceeds from fines and other penalties that businesses pay for safety violations, such as failing to label hazardous materials or forcing drivers to work too many hours in a row.
Congress boosted the tax twice more in the 1990s but primarily to reduce the then-ballooning federal deficit. Only half of a 5-cent increase in 1990 went to highways and transit, while a 4.3-cent lift three years later went entirely to lowering the deficit.
By 1997, the government had redirected all gas tax revenue reserved for deficit reduction to the Highway Trust Fund, where it still flows today.
Along the way, other federal fuel taxes arose, including a 24.4-cent-per-gallon diesel tax and taxes on methanol and compressed natural gas. And state fuel taxes, which in most cases began before the federal gas tax, range from as low as 8.95 cents per gallon in Alaska to as high as 57.6 cents per gallon in Pennsylvania.
Making Do
Since 1993, when the federal gas tax was first parked at 18.4 cents, inflation and rising construction costs have eroded its effectiveness as a transportation-related revenue source. In addition, U.S. vehicles have grown more fuel-efficient overall – which means Americans use less fuel for every mile they drive.
As a result, highway and transit spending has significantly outpaced the revenue collected from the gas tax and other sources. Since 2008, the government has transferred over $80 billion to the fund that it had to take from other sources.
But it’s still not enough. The American Society of Civil Engineers, which gives U.S. infrastructure a C-minus, is calling on the government and private sector to increase spending on roads and bridges by at least $2.5 trillion within a decade.
While it’s true the gas tax may be regressive because lower-income people pay the same rate as those who earn higher incomes, there are still advantages to this tax.
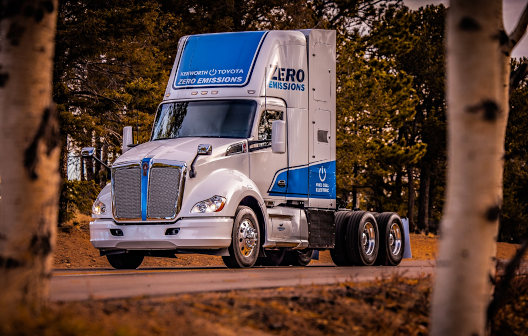
For one thing, it follows the “user pays” principle of providing government services. Under this principle, the people using the roads are held responsible for paying for their upkeep. As the number of motorists using electric vehicles increases, however, this may become less true over time.
Further, it would also create an incentive to at least marginally decrease the use of fossil fuels, accomplishing another goal of the administration.
Finally, the government could always subsidize the tax for the poor, perhaps through annual lump-sum payments, making it less regressive.
Clearly, U.S. infrastructure is in dire need of upgrading and investment. At the end of the day, Americans will pay for it one way or another – whether in taxes or through costs of unsafe and inadequate infrastructure, including in lost lives. How the government pays for investment may matter less than that it finally does it.
This article was republished with permission from The Conversation, a news site dedicated to sharing ideas from
academic experts. It was originally written in French by Theodore J. Kury, Director of Energy Studies, University of Florida.
Suggested Reading:

Stay up to date. Follow us:
Stay up to date. Follow us: