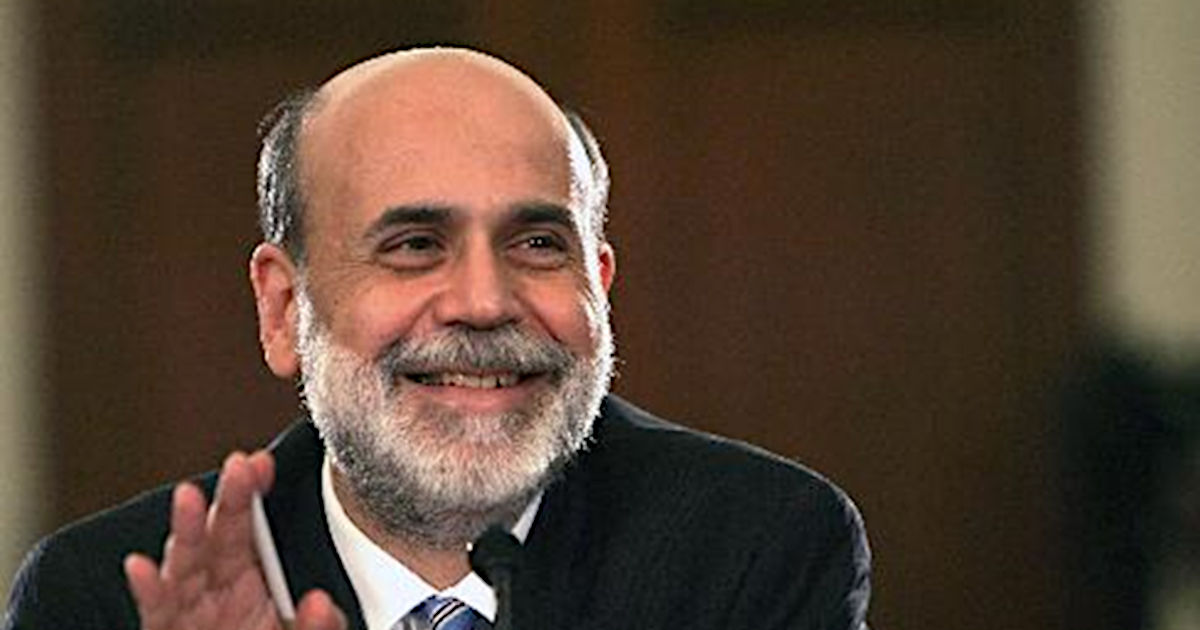
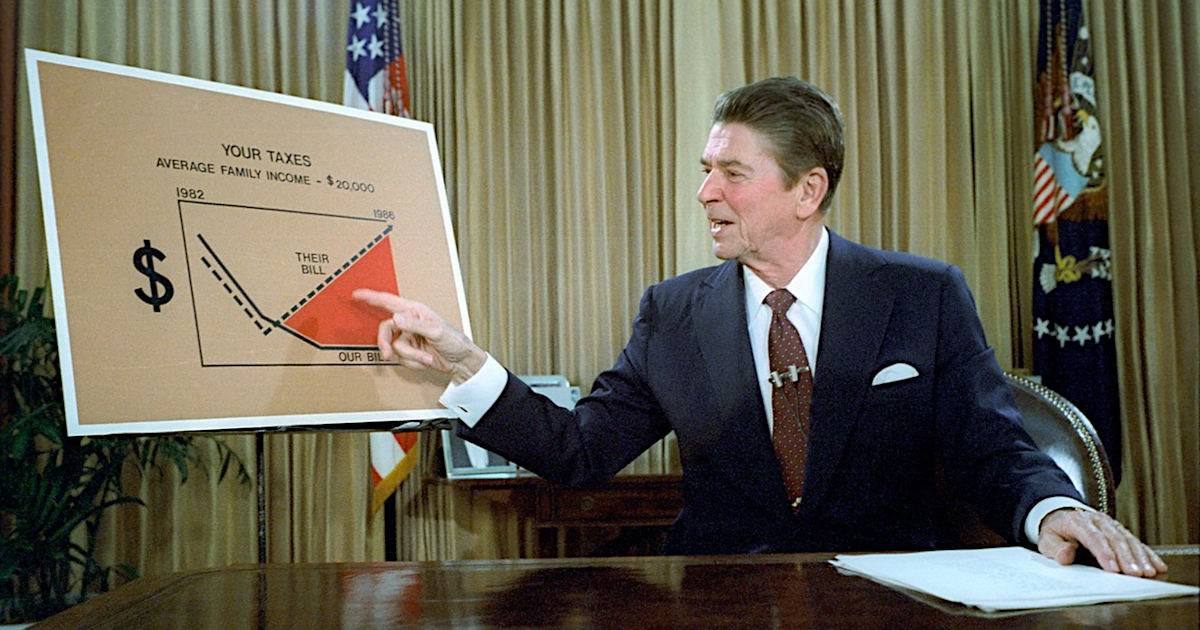
Image: President Reagan addresses the nation, July 1981 (Public Domain)
Lessons from How the Back of Inflation Finally Broke in 1982
by Tim Sablik – Federal Reserve Bank of Richmond
Prior to the 2007-09 recession, the 1981-82 recession was the worst economic downturn in the United States since the Great Depression. Indeed, the nearly 11 percent unemployment rate reached late in 1982 remains the apex of the post-World War II era (Federal Reserve Bank of St. Louis). Unemployment during the 1981-82 recession was widespread, but manufacturing, construction, and the auto industries were particularly affected. Although goods producers accounted for only 30 percent of total employment at the time, they suffered 90 percent of job losses in 1982. Three-fourths of all job losses in the goods-producing sector were in manufacturing, and the residential construction industry and auto manufacturers ended the year with 22 percent and 24 percent unemployment, respectively (Urquhart and Hewson 1983, 4-7).
The economy was already in weak shape coming into the downturn, as a recession in 1980 had left unemployment at about 7.5 percent. Both the 1980 and 1981-82 recessions were triggered by tight monetary policy in an effort to fight mounting inflation. During the 1960s and 1970s, economists and policymakers believed that they could lower unemployment through higher inflation, a tradeoff known as the Phillips Curve. In the 1970s, the Fed pursued what economists would call “stop-go” monetary policy, which alternated between fighting high unemployment and high inflation. During the “go” periods, the Fed lowered interest rates to loosen the money supply and target lower unemployment. During the “stop” periods, when inflation mounted, the Fed would raise interest rates to reduce inflationary pressure. However, the Phillips Curve tradeoff proved unstable in the long-run, as inflation and unemployment increased together in the mid-1970s. While unemployment trended down slightly by the end of the decade, inflation continued to rise, reaching 11 percent in June 1979 (Federal Reserve Bank of St. Louis).
Paul Volcker was appointed chairman of the Fed in August 1979 in large part because of his anti-inflation views. He had previously served as president of the New York Fed and had dissented from Fed policies he regarded as contributing to inflation expectations. He felt strongly that mounting inflation should be the primary concern for the Fed: “In terms of economic stability in the future, [inflation] is what is likely to give us the most problems and create the biggest recession” (FOMC transcript 1979, 16). He also believed that the Fed faced a credibility problem when it came to keeping inflation in check. During the previous decade, the Fed had demonstrated that it did not place much emphasis on maintaining low inflation, and public expectation of such continued behavior would make it increasingly difficult for the Fed to bring inflation down. “[F]ailure to carry through now in the fight on inflation will only make any subsequent effort more difficult,” he remarked (Volcker 1981b).
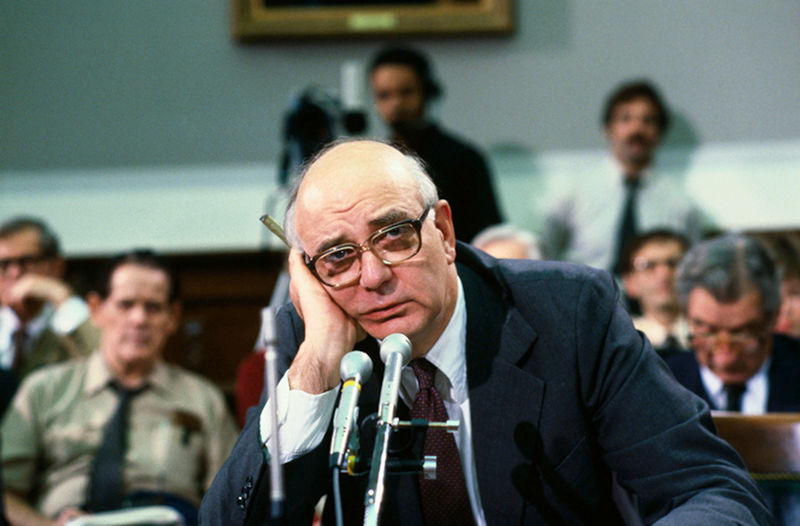
Chairman of the Federal Reserve Board of Governors Paul Volcker holds his head in his hand at a meeting in Washington, D.C.(Photo: Bettmann/Bettmann/Getty Images)
Volcker shifted Fed policy to aggressively target the money supply rather than interest rates. He took this approach for two reasons. First, mounting inflation made it difficult to know which interest rates targets were appropriately tight. While the nominal rates the Fed targeted could be quite high, the real interest rates (that is, the effective interest rates after adjusting for inflation) could still be quite low due to the expectation of inflation. Second, the new policy was meant to signal to the public that the Fed was serious about low inflation. The expectation of low inflation was important, as current inflation is driven in part by expectations of future inflation.
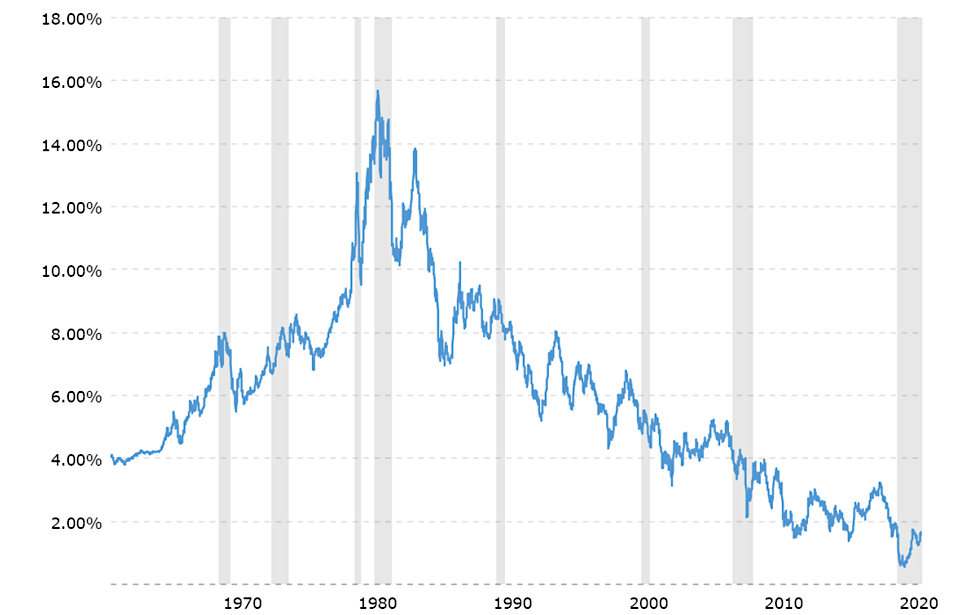
Volcker’s first attempt to lower inflation and inflationary expectations proved insufficient. The credit-control program initiated in March 1980 by the Carter administration precipitated a sharp recession (Schreft 1990). As unemployment mounted, the Fed eased up, an action reminiscent of the “stop-go” policies the public had come to expect. In late 1980 and early 1981, the Fed once again tightened the money supply, allowing the federal funds rate to approach 20 percent. Despite this, long-run interest rates continued to rise. The ten-year Treasury bond rate increased from about 11 percent in October 1980 to more than 15 percent a year later, possibly because the market believed the Fed would back down from its tight policy when unemployment rose (Goodfriend and King 2005). This time, however, Volcker was adamant that the Fed not back down: “We have set our course to restrain growth in money and credit. We mean to stick with it” (Volcker 1981a).
The economy officially entered a recession in the third quarter of 1981, as high interest rates put pressure on sectors of the economy reliant on borrowing, like manufacturing and construction. Unemployment grew from 7.4 percent at the start of the recession to nearly 10 percent a year later. As the recession worsened, Volcker faced repeated calls from Congress to loosen monetary policy, but he maintained that failing to bring down long-run inflation expectations now would result in “more serious economic circumstances over a much longer period of time” (Monetary Policy Report 1982, 67).
Ultimately, this persistence paid off. By October 1982, inflation had fallen to 5 percent and long-run interest rates began to decline. The Fed allowed the federal funds rate to fall back to 9 percent, and unemployment declined quickly from the peak of nearly 11 percent at the end to 1982 to 8 percent one year later (Federal Reserve Bank of St. Louis; Goodfriend and King 2005). The threat of inflation was not completely gone, as the Fed would face a number of “inflation scares” throughout the 1980s. However, the commitment of Volcker and his successors to aggressively targeting price stability helped ensure that the double-digit inflation of the 1970s would not return.
Suggested Reading:
 CPI and PPI Both Suggests Persistent Inflation
|
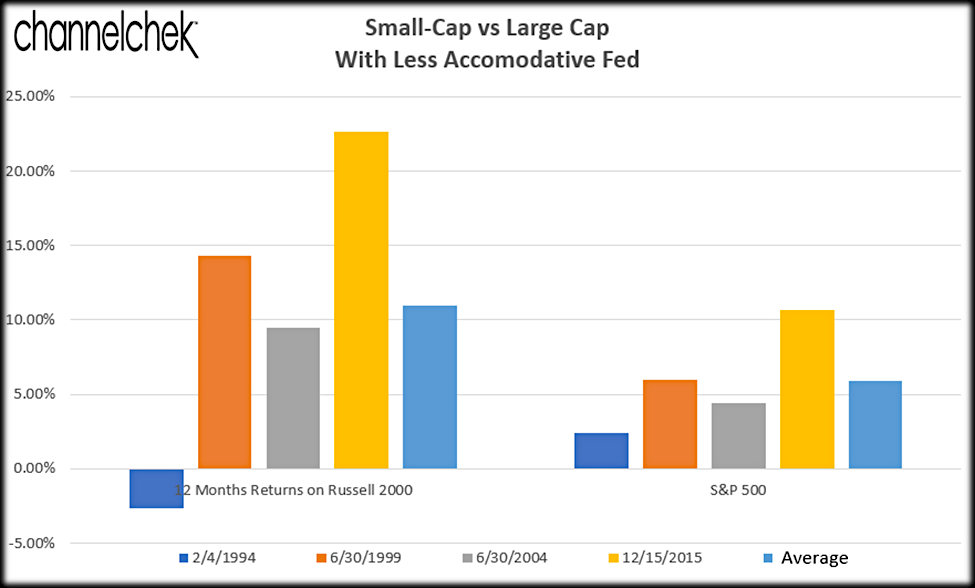
 Why the Most Conservative Investors Could Help Small Stock Performance
|

Sources:
https://www.federalreservehistory.org/essays/recession-of-1981-82
Stay up to date. Follow us:

|