
The Hows and Whys of a Tightening Federal Reserve
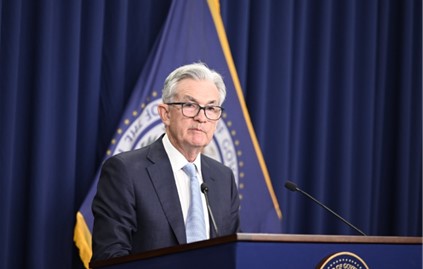
The Federal Reserve (the Fed) will be holding a two-day Federal Open Market Committee (FOMC) meeting next week that ends on September 21. After the FOMC meeting, it is the current practice for the Fed to announce what the target Fed Funds range will be. That is, make the public aware of what overnight bank loan rate the Federal Reserve will work to maintain through open market operations.
Open market operations is the Federal Reserve buying and selling securities on the open market. The purchases are restricted to debt or debt-backed securities so that interest rates are impacted. It’s through controlling interest rates that the Fed works to maintain a sound banking system, keep inflation under control, and help maximize employment. Purchasing securities through its account puts money into the economy, which lowers rates and helps stimulate economic activity. Selling securities takes cash out of circulation. This tightens money’s availability and can also be accomplished by letting the financial instrument mature and then not replacing them with an equal purchase.
Quantitative Easing
If the Federal Reserve hadn’t put money into the economy, they’d have nothing to sell or allow to mature (roll-off). With this in mind, the natural position of the Federal Reserve Bank is stimulative.
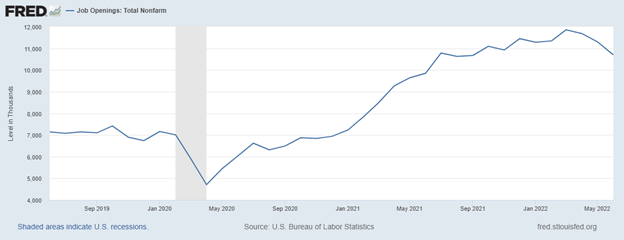
Currently, the Fed owns about a third of the U.S.Treasury and mortgage-backed-securities (MBS) that have been issued and are still outstanding. Much of these holdings are a result of its emergency asset-buying to prop up the U.S. economy during the Covid-19 efforts.
Two years of quantitative easing (QE) doubled the central bank’s holdings to $9 trillion. This amount approximates 40% of all the goods and services produced in the U.S. in a year (GDP). By putting so much money in the economy, the cost of the money went down (interest rates), and the excess money, without much of an increase in how many stocks, bonds, or houses there are, made it easier for people to bid prices up for investible assets. For non-investments, the combination of easy money while lockdowns slowed production became a recipe for inflation.
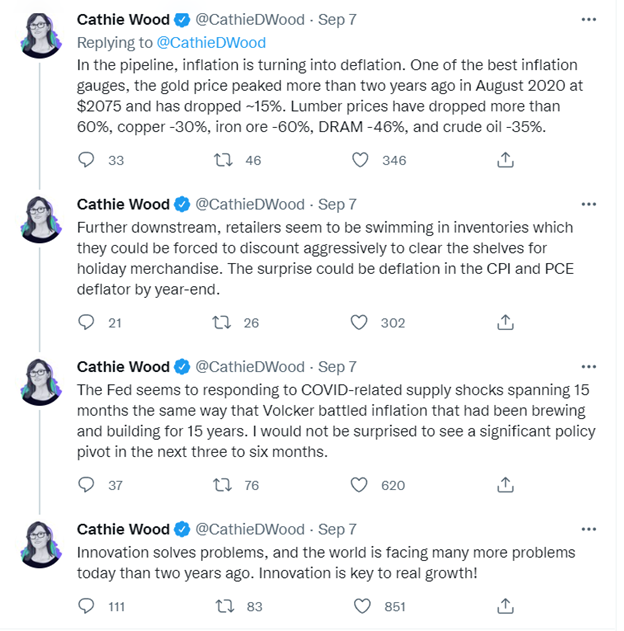
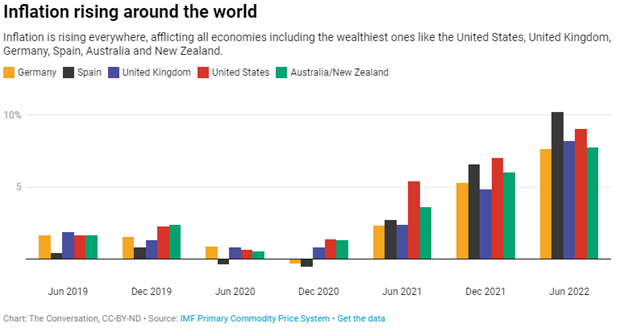
Inflation
Inflation is now a concern for the average household. The Fed, which is supposed to keep inflation slow and steady, needs to act, so they are changing the current mix. It is making these changes by taking out a key inflation ingredient, easy money. This same easy money has been a contributor to the ever-increasing market prices for stocks, bonds, and real estate.
The overnight lending rate the Fed is likely to alter next week is the policy that will create headlines. These headlines may cause kneejerk market reactions that are often short-lived. It is the extra trillions being methodically removed from the economy that will have a longer-term impact on markets. These don’t have much impact on overnight rates, their maturities average much longer, so they impact longer rates, and of course spendable and investible cash in circulation.
Quantitative Tightening
The central bank has only just started to shrink its holdings by letting no more than $30 billion of Treasuries and $17.5 billion of MBS, roll off (cash removed from circulation). They did this in July and again in August. The Fed then has plans to double the amount rolling off this month (most Treasuries mature on the 15th and month-end).
This pace is more aggressive than last time the Fed experimented with shrinking its balance sheet.
Will this lower the value of stocks, crash the economy, and make our homes worth the same as 2019? A lot depends on market expectations, which the Fed also helps control. If the markets, which knows the money that was quickly put in over two years, is now coming back out at a measured pace, and trusts the Fed to not hit the brake pedal too hard, the means exist to succeed without being overly disruptive. If instead the forward-looking stock market believes it sees disaster, an outcome that feels like a disaster increases in likelihood. For bonds, if the Fed does it correctly, rates will rise, which makes bonds cheaper. You’d rather not hold a bond that has gotten cheaper for the same reason that you don’t want to hold a stock that has gotten cheaper. However, buying a cheaper bond means you earn a higher interest rate. This is attractive to conservative investors but also serves as an improved alternative for those deciding to invest in stocks or bonds.
Houses are regional, don’t trade on an exchange and unlike securities, are each unique. They are often purchased with a long-term mortgage. Higher interest rates increase payment costs on the same amount of principal. In order to keep those payments affordable, home purchasers may demand a lower price, thereby causing real estate values to decline.
Take Away
The Fed has told us to expect tightening. They were honest when they promised to ease more than two years ago; there is no reason not to plan for higher rates and tighter money. The overnight rate increases get most of the attention. Further, out on the yield curve, the way quantitative tightening plays out depends on trust in the Fed and a lot of currently unknowns.
Managing Editor, Channelchek
Source