Can We Wave Goodbye to Recession Talk Now that Q3 GDP is Positive?
Gross Domestic Product (GDP), the “advance estimate,” has shown we were not in a recession during the third quarter; instead, the economy expanded. This is a dramatic turn-around from the final data for the previous first two quarters of 2022, which show the U.S. economy contracted during each. Since the Spring, in the stock market, bad economic news has been met with buying, and good news has been met with selling. This GDP report has the power to change that back to more normal investor behavior.
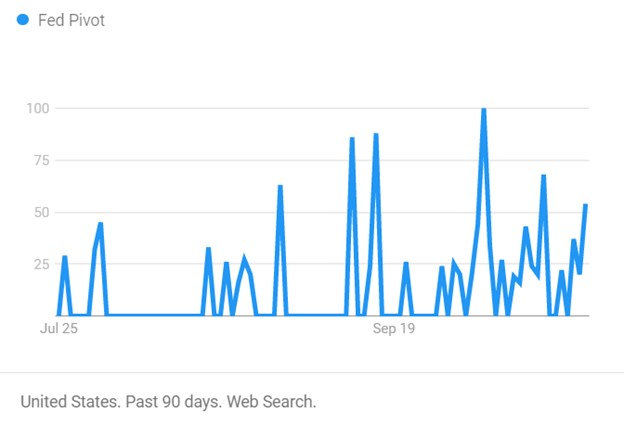
The third quarter production report shows the economy expanded at an annual rate of 2.6% despite nearly 325 basis points of Fed tightening from a base close to zero earlier this year. This report should be great news for the stock market as it shows that a large part of the economy is growing even while stimulus and easy money is being removed. In addition to the headline news related to overnight bank lending rates, each Thursday after the market closes, the Fed releases information on how large its balance sheet is. This balance sheet holdings report can be viewed as how much money they have at work in the system, effectively acting as stimulus. They have been pulling money out at a pace that many expected would also doom growth. It has not, this too should be taken as a positive sign for stock market investors.
This positive GDP report also helps veterans of the market that did not like playing word games by referring to two-quarters of economic recession (lower case “r”) as something other than a Recession (upper case “R”). This definition had in the past always been automatic, without needing the National Bureau of Economic Research (NBER) to decide when to put a light-shaded bar on our economic timeline charts. We expected that they had the same definition.
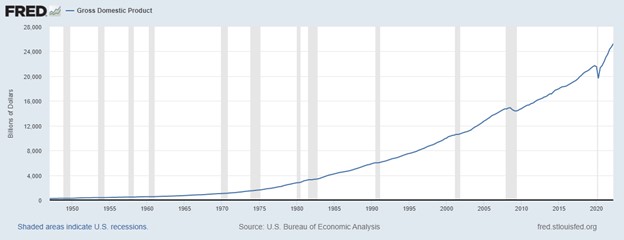
Image: Gross Domestic Product Product since 1947-Apris 2022. Gray bars indicate declared recessions.
In 2022 market watchers were all expected to say, “I don’t know what a recession is, I’m not an NBER economist.” This is because, for some reason,, the National Bureau of Economic Research decided not to use the standard metric and definition, it decided instead to be less scientific. The bureau, for the first time declared there is “no fixed rule about what measures contribute information to the process or how they are weighted in our decisions.” In other words, every set of economic conditions is different, and there is no specific threshold that must be met before a recession is declared. We no longer have to even talk about a recession until maybe next year.
Will they declare this quarter an Expansion (upper case “E”)? We’ll see.
Why this GDP Report is Important
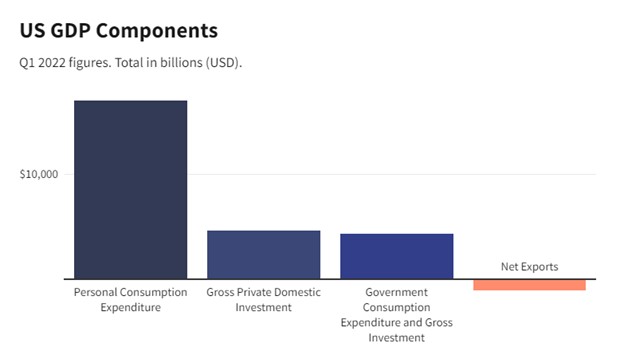
Economic growth of nations is measured as the cost of all goods and services sold and provided from domestic-based resources. After all, wealth comes from output, not increases in currency in circulation. GDP measures this output. As you might imagine, an entire economy’s worth of output is a lot of number crunching by the Bureau of Economic Analysis (BEA). So they do two preliminary numbers before the final. This allows them a couple of months to harvest all the needed data. The final GDP report for this quarter is unlikely to show 2.6% growth as it will have been revised twice, but it is likely to approximate this first look.
Take Away
Good news (economic strength) has been viewed harshly by the market this year as it has been looked at with an eye toward the Fed needing to be more aggressive. Bad news has been embraced and actually caused market rallies.
The most recent GDP report has the power to change this. Despite the historically aggressive Federal Reserve tightening, the economy has grown. Perhaps fears of a deeper recession will pass, and stocks will regain their historic trend of always reaching new highs.
Managing Editor, Channelchek
Sources