SVB’s Newfangled Failure Fits a Century-Old Pattern of Bank Runs, With a Social Media Twist
The history of bank failures all have a familiar pattern. Based on past history, problems may still bubble up over the coming months. The internet and the ability for online withdrawals could elevate risks to banks. Rodney Ramcharan a Professor of Finance and Business Economics, University of Southern California, points out the similarities, the new challenges and provides his thoughts in his article that has been reprinted with permission from The Conversation.
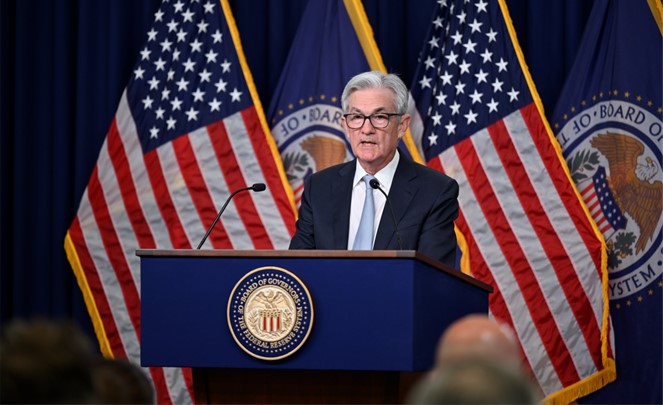
The failure of Silicon Valley Bank on March 10, 2023, came as a shock to most Americans. Even people like myself, a scholar of the U.S. banking system who has worked at the Federal Reserve, didn’t expect SVB’s collapse.
Usually banks, like all companies, fail after a prolonged period of lackluster performance. But SVB, the nation’s 16th-largest bank, had been stable and highly profitable just a few months before, having earned about US$1.5 billion in profits in the last quarter of 2022.
However, financial history is filled with examples of seemingly stable and profitable banks that unexpectedly failed.
The demise of Lehman Brothers and Bear Stearns, two prominent investment banks, and Countrywide Financial Corp., a subprime mortgage lender, during the 2008-2009 financial crisis; the Savings and Loan banking crisis in the 1980s; and the complete collapse of the U.S. banking system during the Great Depression didn’t unfold in exactly the same way. But they had something in common: An unexpected change in economic conditions created an initial bank failure or two, followed by general panic and then large-scale economic distress.
The main difference this time, in my view, is that modern innovations may have hastened SVB’s demise.
Great Depression
The Great Depression, which lasted from 1929 to 1941, epitomized the public harm that bank runs and financial panic can cause.
Following a rapid expansion of the “Roaring Twenties,” the U.S. economy began to slow in early 1929. The stock market crashed on Oct. 24, 1929 – a date known as “Black Tuesday.”
The massive losses investors suffered weakened the economy and led to distress at some banks. Fearing that they would lose all their money, customers began to withdraw their funds from the weaker banks. Those banks, in turn, began to rapidly sell their loans and other assets to pay their depositors. These rapid sales pushed prices down further.
As this financial crisis spread, depositors with accounts at nearby banks also began queuing up to withdraw all their money, in a quintessential bank run, culminating in the failure of thousands of banks by early 1933. Soon after President Franklin D. Roosevelt’s first inauguration, the federal government resorted to shutting all banks in the country for a whole week.
These failures meant that banks could no longer lend money, which led to more and more problems. The unemployment rate spiked to around 25%, and the economy shrank until the outbreak of World War II.
Determined to avoid a repeat of this debacle, the government tightened banking regulations with the Glass-Steagall Act of 1933. It prohibited commercial banks, which serve consumers and small and medium-size businesses, from engaging in investment banking and created the Federal Deposit Insurance Corporation, which insured deposits up to a certain threshold. That limit has risen sharply over the past 90 years, from $2,500 in 1933 to $250,000 in 2010 – the same limit in place today.
S&L Crisis
The nation’s new and improved banking regulations ushered in a period of relative stability in the banking system that lasted about 50 years.
But in the 1980s, hundreds of the small banks known as savings and loan associations failed. Savings and loans, also called “thrifts,” were generally small local banks that mainly made mortgage loans to households and collected deposits from their local communities.
Beginning in 1979, the Federal Reserve began to hike interest rates very aggressively to fight the high inflation rates that had become entrenched.
By the early 1980s, Congress began allowing banks to pay market interest rates on depositers’ accounts. As a result, the interest rate S&Ls had to pay their customers was much higher than the interest income they were earning on the loans they had made in prior years. That imbalance caused many of them to lose money.
Even though about 1 in 3 S&Ls failed from around 1986 through 1992 – somewhere around 750 banks – most depositors at small S&Ls were protected by the FDIC’s then-$100,000 insurance limit. Ultimately, resolving that crisis cost taxpayers the equivalent of about $250 billion in today’s dollars.
Because the savings and loans industry was not directly connected to the big banks of that era, their collapse did not cause runs at the bigger institutions. Nevertheless, the S&L collapse and the government’s regulatory response did reduce the supply of credit to the economy.
As a result, the U.S. economy underwent a mild recession in the latter half of 1990 and first quarter of 1991. But the banking system escaped further distress for nearly two decades.
Great Recession
Against this backdrop of relative stability, Congress repealed most of Glass-Steagall in 1999 – eliminating Depression-era regulations that restricted the scope of businesses that banks could engage in.
Those changes contributed to what happened when, at the start of a recession that began in December 2007, the entire financial sector suffered a panic.
At that time, large banks, freed from the Depression-era restrictions on securities trading, as well as investment banks, hedge funds and other institutions outside the traditional banking system, had heavily invested in mortgage-backed securities, a kind of bond backed by pooled mortgage payments from lots of homeowners. These bonds were highly profitable amid the housing boom of that era, and they helped many financial institutions reap record profits.
But the Federal Reserve had been increasing interest rates since 2004 to slow the economy. By 2007, many households with adjustable-rate mortgages could no longer afford to make their larger-than-expected home loan payments. That led investors to fear a rash of mortgage defaults, and the values of securities backed by mortgages plunged.
It wasn’t possible to know which investment banks owned a lot of these vulnerable securities. Rather than wait to find out and risk not getting paid, most of the depositors rushed to get their money out by late 2007. This stampede led to cascading failures in 2008 and 2009, and the federal government responded with a series of big bailouts.
The government even bailed out General Motors and Chrysler, two of the country’s three largest automakers, in December 2008 to keep the industry from going bankrupt. That happened because the major car companies relied on the financial system to provide potential car buyers with credit to purchase or lease new cars. But when the financial system collapsed, buyers could no longer obtain credit to finance or lease new vehicles.
The Great Recession lasted until June 2009. Stock prices plummeted by more than 50%, and unemployment peaked at around 10% – the highest rate since the early 1980s.
As with the Great Depression, the government responded to this financial crisis with significant new regulations, including a new law known as the Dodd-Frank Act of 2010. It imposed stringent new requirements on banks with assets above $50 billion.
Close-Knit Customers
Congress rolled back some of Dodd-Frank’s most significant changes only eight years after lawmakers approved the measure.
Notably, the most stringent requirements were now reserved for banks with more than $250 billion in assets, up from $50 billion. That change, which Congress passed in 2018, paved the way for regional banks like SVB to rapidly expand with much less regulatory oversight.
But still, how could SVB collapse so suddenly and without any warning?
Banks take deposits to make loans. But a loan is a long-term contract. Mortgages, for example, can last for 30 years. And deposits can be withdrawn at any time. To reduce their risks, banks can invest in bonds and other securities that they can quickly sell in case they need funds for their customers.
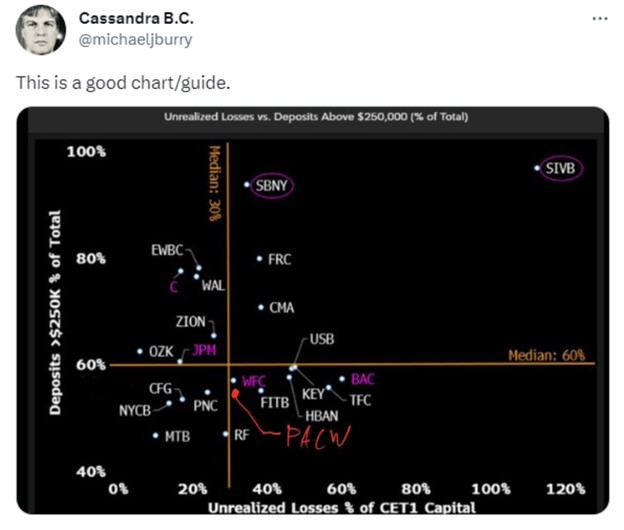
In the case of SVB, the bank invested heavily in U.S. Treasury bonds. Those bonds do not have any default risk, as they are debt issued by the federal government. But their value declines when interest rates rise, as newer bonds pay higher rates compared with the older bonds.
SVB bought a lot of Treasury bonds it had on hand when interest rates were close to zero, but the Fed has been steadily raising interest rates since March 2022, and the yields available for new Treasurys sharply increased over the next 12 months. Some depositors became concerned that SVB might not be able to sell these bonds at a high enough price to repay all its customers.
Unfortunately for SVB, these depositors were very close-knit, with most in the tech sector or startups. They turned to social media, group text messages and other modern forms of rapid communication to share their fears – which quickly went viral.
Many large depositors all rushed at the same time to get their funds out. Unlike what happened nearly a century earlier during the Great Depression, they generally tried to withdraw their money online – without forming chaotic lines at bank branches.
Will More Shoes Drop?
The government allowed SVB, which is being sold to First Citizens Bank, and Signature Bank, a smaller financial institution, to fail. But it agreed to repay all depositors – including those with deposits above the $250,000 limit.
While the authorities have not explicitly guaranteed all deposits in the banking system, I see the bailout of all SVB depositors as a clear signal that the government is prepared to take extraordinary steps to protect deposits in the banking system and prevent an overall panic.
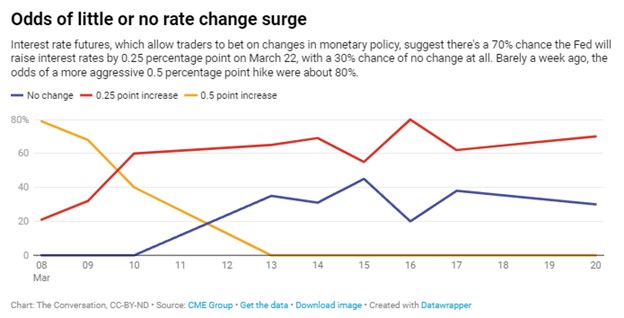
I believe that it is too soon to say whether these measures will work, especially as the Fed is still fighting inflation and raising interest rates. But at this point, major U.S. banks appear safe, though there are growing risks among the smaller regional banks.


