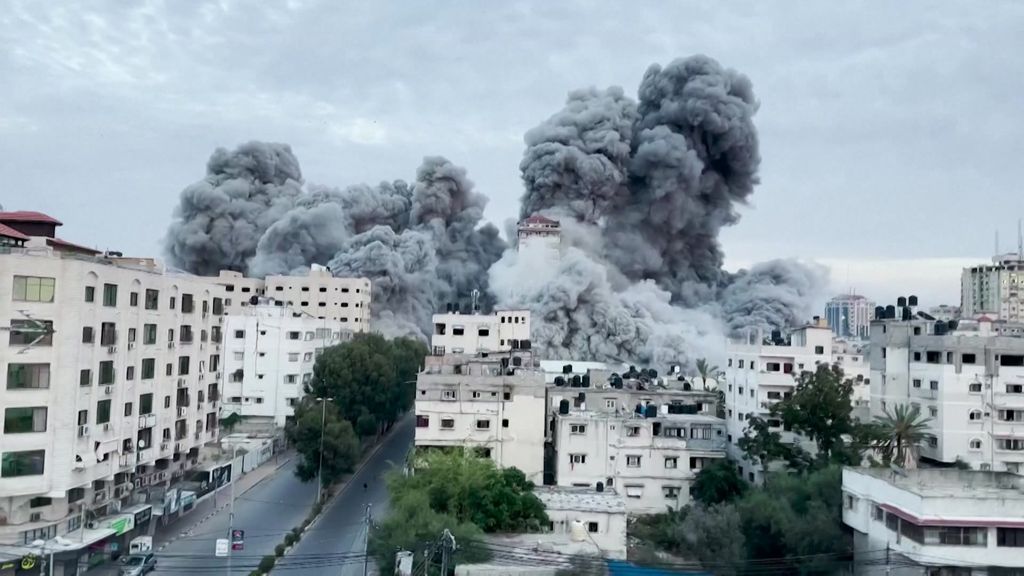
Calculating the Actual Cost of Higher Rates on the US Treasury Has a Surprising Result

Are Higher Interest Rates Going to Be Devastatingly Expensive to the US Treasury?

The Federal Open Market Committee (FOMC) has raised the overnight Fed Funds target rate from near zero to around 5% in less than a year and a half. That multiple from its starting point is huge and, as designed, driven up other rates, both savings and lending. Given the pace that rates have gone up, the cost of refinancing or rolling existing debt for the federal and municipal governments, businesses, and households, has obviously experienced a large cost increase. When treasury debt matures, the US government decides whether to “roll over” their debt by issuing new securities at the current rate—or find other resources to repay borrowers. When rolling, far more is required to be borrowed just to stay even and cover interest rate costs. Below we use numbers from  Federal Reserve branch to determine how much more it will cost.

The Federal Reserve Bank of St Louis (FRED), compiled data on the increased cost of US borrowing as a direct result of the Federal Reserve’s tighter monetary policy. The sheer magnitude of the amount borrowed, and the impact of interest rates make clear the US either will be increasing its borrowings, just to stay even with rollovers, or will need to cut back by spending. Cutting back spending removes economic stumulus. Below are the FRED numbers on how interest costs are expected to change.  

US Government Debt Breakdown

The total public debt, according to the US Treasury Department, is just over $31.4 trillion

Of the $31.4 trillion, about $7.5 trillion or 23.9% is nonmarketable debt—mainly consisting of the social security trust fund, military retirement funds, and the civil service retirement fund.

That leaves $23.9 trillion in marketable debt.  $2.5 trillion is in variable-rate debt and increases when rates rise. The variable category is made up of Treasury inflation-indexed notes (TIPS) and floating-rate notes (FRNs). TIPS make up 6% of the overall US debt, have original maturities of 5, 10, or 30 years. FRNs make up only 2% of US debt, have maturity of 2 years, and interest payments are based on a fixed spread and a variable index rate calculated weekly.

Then there are $21.4 trillion in fixed-rate marketable securities. This final category contains bills, notes, and bonds, which make up 11.8%, 43.6%, and 12.7% of the US debt, respectively. The only differences in these instruments is that bills are discounted to yield the rate, while notes and bonds have semiannual interest rate payments. “notes” is the term used from 2-10 year maturities, bonds are from 10-20 years

Focusing only on the 68.1% fixed-rate of marketable U.S. debt, consisting of bills, notes, and bonds and for ease, using end of the year December 2022 to use specific securities and their roll dates, this is what the St. Louis Federal Reserve laid out.  

The debt maturing each year has been broken down into different colors below by maturity. For example, the orange portion of the 2023 column represents two-year US Treasury debt maturing in the year 2023.

Notice about 30% of existing debt is maturing in 2023.  And nearly 62% of existing US debt is coming due in the nine years after 2023. Finally, 18% of existing Treasury debt is very long dated and will not come due for at least 10 years. So 82% will reset at current rates within the next nine years.

Maturity Dispersion

Aside from quantity and maturity, the calculations aren’t complete without factoring in the yield of the current debt. Remember, the current interest rate levels are not the first time visiting 4% or higher.

FRED used data on quantities and prices from December 2022 and compared it with the interest expense the US government would pay on the same quantity of debt using the new, higher interest rates in April 2023. Here, FRED assumed that the US government will keep the same debt schedule as in 2022. In other words, for any debt maturing during 2023, the government will issue another security with the same quantity and maturity—but at the new interest rate. They define short-term debt as any security with maturity less than or equal to one year and long-term debt as any security with maturity greater than one year.

Maturing Interest Rate, New Interest Rate

Short-term debt maturing in 2023 makes up about 17% of the outstanding. However, because this debt is short term, most of it had already been rolled over at higher interest rates in 2022. The December 2022 average rate on the short-term debt was already 3.8% and therefore increased only 0.9%—to 4.7%—in April. The long-term debt maturing in 2023 is almost 12% of debt, and the average rate increases from 1.3% to 3.6%, which is fairly large. Long-term debt maturing after 2024 will have the same interest rate, since the federal government is not rolling it over in 2023. Long-term debt makes up just over 70% of the existing debt.

To get some idea of the magnitude of $98 billion, the St. Louis Fed provided two examples: First, the Federal Reserve pays the Treasury Department revenue or remittances, which basically contain all remaining Fed revenue after operating expense. Fed remittances were $105 billion in 2021 and were negative $54 billion in 2022, in part due to the increases in interest rates. In 2021, this was an example of an inflow, or payment, to the government. Second, an example of an outflow, or expense incurred by the government, the US Department of Transportation spent $114 billion in 2022.

Bringing in the variable rate debt that we excluded earlier, the Congressional Budget Office (CBO) has forecasted for interest expense payments over GDP in the next 10 years. The CBO’s projections include variable-rate marketable securities—TIPS and FRNs—so they of course will of course be added to the fixed rate securities.

Take Away

What the US government spends, is generally stimulative. Money spent on interest would also seem to work its way into the system and be stimulative, but in the face of inflation, more goods or services is not necessarily attainable with the larger payments.

The US government had $21.4 trillion in outstanding US Treasury debt as of December 2022. Given large increases to interest rates over the past year, FRED estimated that it will cost the US government an additional $98 billion to pay interest on their debt in 2023.

The estimate is close to that made by the CBO as well.  While the number seems large, relative to flows in and out of the US Treasury it is in line and not by comparison large.

The report from the Federal Reserve Branch concluded if long-term rates remain high, servicing the debt will become a larger and larger portion of the overall government expense.

Paul Hoffman

Managing Editor, Channelchek

The Week Ahead –  Fed Chairman Jerome Powell Will Again be the Focus

This Week We’ll See if the Small-Cap Rally Continues, and Which Individual Stocks Move from the Russell Reconstitution

The FOMC interest rate pause at 5.00-5.25% last week created investor uncertainty as there was little forward guidance as the policymakers insist they remain data dependent. Chair Jerome Powell was emphatic in his comments to the press on Wednesday that getting inflation down to the 2 percent average inflation target is the FOMC’s unanimous goal – although there may be differences on the speed or level at which rates need to be adjusted.

Powell will have the spotlight again this week as he gives two testimony’s, the first on Wednesday before the House Financial Services Panel, and then on Thursday before the Senate Banking Committee.

While the mood of markets is still apprehensive, this did not stop the S&P 500 from rallying and reaching the highest weekly close since April 2022.

Monday 6/19

•             US Markets closed in celebration of the Juneteenth holiday.

Tuesday 6/20

•             8:30 PM ET, May Housing starts are expected to hold steady after experiencing a bounce in April. Exonomists expect May’s starts to have been 1.433 million, they were 1.416 million in April.

Wednesday 6/21

•             10:00 AM ET, Federal Reserve Chairman Powell will appear before House Financial Services Panel.

•             10:00 AM – 4:00 PM ET, While Fed Chair Powell will be getting the attention as he reads prepared remarks and answers question, the day will be filled with other FOMC members speaking and sharing their view and outlook for the first time since the June FOMC meeting concluded. This includes Lisa Cook at 10:00 AM ET, Philip Jefferson also at 10:00 AM ET, Austan Goolsbee at 12:25 PM ET, and Loretta Mester at 4:00 PM ET.

Thursday 6/22

•             8:30 AM ET, Jobless Claims for the June 17 week, is expected to remain near the previous weeks level. The consensus is 261,000 versus 262,000 last week.  

•             10:00 AM ET, Existing Home sales for May are expected to slip slightly to a 4.25 million rate. The National Association of Realtors described sales as “bouncing back and forth” but remaining “above recent cyclical lows.”

•             10:00 AM ET, Federal Reserve Chairman Powell will again be the focus as he appears before the Senate Banking Panel.

•             10:00 AM ET, The Index of Leading Indicators was down by 0.6 percent in April, for May it is expected to post a 14th straight decline, the consensus is down 0.7 percent. This index has been in sharp decline and has long been a trendline toward slow or no economic growth. signaling a pending recession.

•             4:30 PM ET, Factors Affecting Reserve Balances, otherwise known as The Fed’s Balance Sheet or the H.4.1 report is a weekly report of a consolidated balance sheet for all 12 Reserve Banks that lists factors supplying reserves into the banking system and factors absorbing reserves from the system. The report is officially named Factors Affecting Reserve Balances, otherwise known as the “H.4.1” report.

Friday 6/23

•             9:45 AM ET, The Purchasing Managers Index (PMI) is not expected to show significant change in June compared to May; manufacturing underperformed at 48.5 and services even though services were strong at 53.5.

What Else

On Friday the Russell Indexes will have new components beginning the moment the market closes. The following Monday morning the indexes will reflect these changes, and index funds that are designed to match the performance of the funds will hopefully have gotten their trades off in time. Expect some interesting moves of a few stocks on Friday as a result.  

Small-cap stocks have joined the stock market rally in June and, according to an article in Morningstar, “trouncing the larger indexes.”

Noble Capital Markets has been hosting road shows of interesting small-cap companies in various cities and towns throughout the US. This week features a very busy week with company’s speaking to potential investors in St. Louis and Florida. Also there will be two virtual events, so that no one is excluded by geography. Become informed here.

Paul Hoffman

Managing Editor, Channelchek

Sources

https://www.bing.com/search?q=small+cap+stocks+on+a+rolll&filters=ex1%3a%22ez2%22&pglt=41&cvid=480e1d5e96354e0f85be232f12f9721e&aqs=edge..69i57j0l8.5031j0j1&FORM=000017&PC=LCTS&qpvt=small+cap+stocks+on+a+rolll

https://www.zerohedge.com/economics/key-events-week-no-data-releases-fed-speakers-galore-including-powell-twice

https://us.econoday.com/byshoweventfull.aspx?fid=562858&cust=us&year=2023&lid=0&prev=/byweek.asp#top

Pause, Pivot, or Push Higher – What to Review After the FOMC Announcement

The FOMC Member’s Change in Sentiment is a Big Focus

Whether the Fed moves rates up after the June FOMC or not could mean little to whether there is additional drag on the economy. The short end of the yield curve, where savers benefit, has risen each time the Fed has raised rates. Out further, the 10-year T-Note, which is the benchmark for 30-year mortgages and from which corporate 10-year notes are spread, has been remarkably steady. Nine months ago, when Fed Funds were 3.00%- 3.25%, the 10-Year Treasury yielded 3.76%. Today the Fed Funds target rate is 5.00-5.25%, the 10-Year is still at 3.76%. This may be why the Fed has had a difficult time reeling in inflation, longer interest rates, where they impact the economy most, had reached 4.25% last October, the Fed has since tightened 200bp, and 10-year rates have traded around 50 bp lower     since the October high, despite the tightening. And for the same reason, mortgage rates are lower now than they were last October.

Summary Of Economic Projections

More meaningful for market participants might be the Summary of Economiuc Projections (SEP). Outside of a normal knee-jerk reaction after Wednesday’s policy announcement, or a quick trade that can be had off Powell’s press conference remarks, what the Fed members now expect by year-end is a better indication of any new mindset on monetary policy.  

The Summary of Economic Projections includes estimates from the FOMC members showing where they see rates at the end of 2023 (and beyond). At the March meeting (see below), most of the Fed policymakers saw rates staying at current levels, with a few signaling additional hikes may be coming. While Powell will answer questions at the press conference that may be indicative of what they are thinking, the change in the SEP numbers (released in the statement after the meeting) is a better indicator of whether the Fed is now more hawkish or dovish.

A big shift toward expectations of higher rates would indicate a more hawkish stance. It will be useful to note how projections have evolved compared to March – Chair Powell will, of course, provide further color through his press conference.

Pause, Pivot, or Push Higher

Has the view changed with recent economic data? Was the view in March skewed by what could have turned into a banking crisis? We’ll see in hard numbers, without reading between any lines. We can see in black and white what the aggregate thinking is of the members when behind closed doors, where the important discussions happen – inside the FOMC meeting room.

After the announcement, Channelchek subscribers will receive a summary in their email of the announcement, changes in language from previous meetings, and the new SEP to compare any change in sentiment (subscribe at no cost).

While the actual impact on the overall economy of a 25bp move compared to a Fed pause may have little impact on the economy, company earnings, or even Treasury Bonds, each time the Fed raises overnight rates, there are investors that are more comfortable with a larger allocation of cash. Depending on where “uninvested” assets are held, they may be earning near 5%. This is a risk to stock prices as some investors may find be comfortable with money market returns for a larger portion of their portfolios. Fewer assets in the stock market have a depressing effect on prices.

Take Away

While pre and post-Fed meeting investor conversations tend to swirl around words like, “pause”, “pivot”, and “tighten”, the Fed’s overall change in rate expectations, which they have the most control over, is more telling than any polished statement or press briefing. These numbers are on the SEP report.

Paul Hoffman

Managing Editor, Channelchek

Sources

https://ycharts.com/indicators/10_year_treasury_rate

The Week Ahead –  FOMC Meet, Quadruple Witching Hour, Consumer Inflation

This Week’s Events are Sure to Keep Investors on Their Toes

I wouldn’t want to be Fed Chair Jerome Powell this week. The June 13-14 FOMC meeting may be the first meeting of the Committee that sets monetary policy, since January 2022, when a tightening of monetary targets doesn’t occur. The decision will come down to the wire as very important inflation data won’t be released until the first day of the meeting on Tuesday. While most on the Committee have expressed seeing current inflation data as problematic, there usually is a delay between when the Fed first alters policy, and the impact it creates.


Whether the Fed again acts to slow the economy, or takes a breather, announced at 2:00 on Wednesday, Powell will face reporters having to explain the Fed’s action or inaction. With likely less personal conviction than at previous press briefings, his responses may be more general than usual.

Monday 6/12


• 2:00 PM ET, The Treasury Statement is the U.S. Treasury’s release of a monthly accounting of the surplus or deficit of the government. Changes in the budget balance reflect Federal policy on spending and taxation. Forecasters see a $205.0 billion deficit in May that would compare with a $66.2 billion deficit in May one year ago, and a surplus of $176.2 billion in April this year.

Tuesday 6/13


• The June FOMC Meeting begins day one of two.


• 6:00 AM ET, NFIB Small Business Optimism Index has been below the historical average of 98 for the past 16 months in a row. May’s consensus is for a decline to 88.4 versus 89.0 in April.


• 8:30 AM ET, The Consumer Price Index this month could move markets significantly if there is a significant change in the data from the previous month. Core price increases in May are not expected to have slowed. They are expected to keep their pace of April’s 0.4 percent monthly increase. The core’s year-over-year rate is seen easing to 5.3 from 5.5 percent. Overall price increases are expected to halve to 0.2 percent on the month from 0.4 percent and 4.1 percent on the year from 4.9 percent.

Wednesday 6/14

• 8:30 PM ET, The Producer Price Index – Final Demand number is another important inflation index that the FOMC members may want to peak at before voting Wednesday on any policy shift. After rising 0.2 percent in April, producer prices in May are expected to fall 0.1 percent. The annual rate in May is seen at 1.6 percent versus April’s plus 2.3 percent. May’s ex-food ex-energy rate is seen up 0.2 percent on the month and up 2.9 percent on the year, matching April’s 0.2 percent monthly rise and just below the month’s 3.2 percent yearly rate.


• 10:30 AM ET, The Energy Information Administration (EIA) will be providing its scheduled weekly information on petroleum inventories, whether produced in the US or abroad. The level of inventories helps determine prices for petroleum products.


• 2:00 PM ET, The FOMC Announcement is when the world gets to learn what the Fed decision is on interest rates, and why.


• 2:30 PM ET, The FOMC Chair press briefing provides additional context to the just announced direction of the FOMC’s policy decision. The questions and answers with the media can shed far more light of the intentions of the Committee than the carefully worded statement released at 2PM.

Thursday 6/15


• 8:30 AM ET, Jobless Claims for the June 10 week are expected to ease back to 250,000 versus the prior week’s large 28,000 jobs jump to 261,000. This has been a very closely watched report. If as expected, it would indicate the Fed has room to tighten further if other data remain strong.


• 8:30 AM ET, May Retail Sales are expected to be unchanged, matching April’s 0.4 percent rise.


• 8:30 PM ET, The Philadelphia Fed (Philly Fed) manufacturing index has been in contraction for the last ten reports. At minus 10.4 in May, with June’s consensus is at minus 13.2.


• 9:15 PM ET, Industrial Production is expected to push 0.1 percent higher in May after April’s 0.5 percent increase that was boosted by manufacturing output which jumped a surprising 1.0 percent. Manufacturing in May is seen up 0.2 percent.


• 4:30 PM ET, The Fed’s Balance Sheet is a weekly report presenting a consolidated balance sheet for all 12 Reserve Banks that lists factors supplying reserves into the banking system and factors absorbing reserves from the system. This has ben getting more attention as it indicates if the fed is on track with its announced quantitative tightening and if any bank borrowing has dramatically increased.

Friday 6/16


• 10:00 AM ET, Consumer Sentiment will be the first indication for June. It fell by 4.3 points to 59.2 last month, it is expected to inch up and report 60.5.


• Quadruple Witching is a phrase used to refer to the expiration of four different derivative contracts: Stock index futures, Stock index options, Single-stock options, Single-stock futures. Quadruple witching happens four times a year, on the third Friday of March, June, September, and December. It is a time of heightened volatility in the markets, as traders adjust their positions in anticipation of the expiration of these contracts.

What Else


The key factors that the Fed will consider when making its decision are the pace and trend of economic growth, the level of inflation, the strength of the labor market, and the risk of recession.
Additionally, the FOMC will have to determine if the moves to date will have a more substantial impact if allowed to have more time to have an impact.


While OPEC is cutting output and it seems like we are on a path of oil and natural gas prices again inching up, Alvopetro Energy (ALVOF), an enviable gas company, headquartered in Canada, operating in Brazil, will be conducting roadshows in New York and St. Louis. Learn more about attending here.
Paul Hoffman
Managing Editor, Channelchek

The Week Ahead –  Debt Limit Clouds Lift

This Week Will Feature Few Economic Releases and a Focus on Next Weeks FOMC

The week ahead is quiet on the economic release front. And there won’t be any market moving Fed president addresses to keep the market on its toes; the Fed members are in a blackout period leading up to next week’s June 13-14 FOMC meeting.

The markets can also stop talking about whether the US will default on debt as the short end of the fixed-income market will have to adjust to a sudden but short-lived increase in US Treasury bills.

Monday 6/5

  • 10:00 AM ET, Factory Orders are expected to have risen 0.8 percent in April versus March’s 0.9 percent rise. Durable Goods Orders for April, which have already been released and are one of two major components of this report, rose 1.1 percent on the month. Factory Orders are a leading indicator, it represents the dollar level of new orders for both durable and nondurable goods.
  • 10:00 AM ET, The Institute for Supply Management Services (ISM Services) is expected to be relatively steady at 52 for May after a 51.9 print in April.

Tuesday 6/6

  • Nothing Scheduled

Wednesday 6/7

  • 8:30 PM ET, International Trade in Goods and Services is expected to show a deficit of $75.4 billion for April for total goods and services trade which would compare with a $64.2 billion deficit in March. Advance data on the goods side of April’s report showed a very large $12.1 billion deepening in the deficit.
  • 10:30 AM ET, The Energy Information Administration (EIA) will be providing its scheduled weekly information on petroleum inventories, whether produced in the US or abroad. The level of inventories helps determine prices for petroleum products.
  • 3:00 PM ET, Consumer Credit is expected to have increased by $21.0 billion in April versus an increase of $26.5 billion in March. This report has surprised on the high side the last three months.

Thursday 6/8

  • 8:30 AM ET, Jobless claims for the week ending June 3 are expected to have increased to 240,000 versus 232,000 in the prior week. This has been a very closely watched report as it is expected it has indicated the Fed has room to tighten further if other data remain too strong.
  • 10:00 AM ET, Wholesale Inventories will be released as a second estimate before the final. The second estimate for April is expected to be a 0.2 percent decline, unchanged from the first estimate. Wholesale trade measures the dollar value of sales made and inventories held by merchant wholesalers. It is a component of business sales and inventories  Corporate Profits are pulled from the national income and product accounts (NIPA) and are presented in different forms.
  • 4:30 PM ET, The Federal Reserve’s  Balance Sheet has attracted additional attention as it is a good indicator of whether it is following its quantitative tightening plan, and whether there has been a significant change in banks looking to the Fed, which may mean trouble in the sector. For the week ending June 7, the Federal Reserve is expected to hold assets worth $8.386 trillion. This would be a week-on-week decline of $50.4 billion. All non-cash assets can be viewed as money that at one time was  injected into the economy as stimulation.            

Friday 6/9

  • 10:00 AM ET, The Quarterly Services Survey focuses on information and technology-related service industries. These include information; professional, scientific and technical services; administrative & support services; and waste management and remediation services. Services revenue is expected to have increased by 2.9%.

What Else

The key factors that the Fed will consider when making their decision next week at the FOMC meeting are the pace and trend of economic growth, the level of inflation, the strength of the labor market, and the risk of recession.

Additionally, the FOMC will have to determine if the moves to date will have a more substantial impact over time. Currently, inflation is not coming down, jobs are abundant relative to job seekers, and the risk of a recession over the next two quarters seems low. For these reasons, some believe the Fed will remain hawkish yet pause for this meeting. However, next week during the first day of the two-day meeting CPI (consumer inflation) will be released. It would be premature to forecast a Fed decision until the contents of that report are known.

Paul Hoffman

Managing Editor, Channelchek

What Investors Learned in May That They Can Use in June

Looking Back at the Markets in May and Forward to June

Conviction in the overall stock market was weak in May, while enthusiasm for specific sectors was strong. June investors may regain some clarity as markets may be relieved from the debt ceiling dark cloud that kept investors overly cautious. But a renewed fear that the Fed is losing ground to inflation may become the focal point until the coming FOMC meeting. In the meantime, any increase in the debt limit signed into law kicks the can down the road, ongoing increases in borrowing and spending may not haunt the overall market in June, but the path of escalating debt is unsustainable for a healthy U.S. economy.

The next scheduled FOMC meeting is June 13-14. We will have another look at consumer inflation numbers before the June 14 Fed monetary policy decision date CPI (June 13).

While the Fed is wrestling with stubborn inflation, it is keeping an eye on the strong labor markets, which provides leeway and perhaps even a strong reason fo it to continue riding the economic break pedal by being increasingly less accommodative. Although low unemployment is desirable, tight labor markets are helping to drive prices up. The Fed aims to find a better balance.

Image Credit: Koyfin

Look Back

Three broad stock market indices (S&P 500, Nasdaq 100, and Russell 2000) are positive on the month of May. The Dow Industrials spent the entire month in negative territory. The Nasdaq 100 was the big winner (+8.7%) on the back of tech stocks as many have been inspired by the earnings performance and stock price performance of Nvidia (NVDA). The S&P 500 (+1.46%) and Russell 2000 (+1.21%) had a good showing putting the Russell 2000 back in positive territory for 2023. The Dow Industrials is negative (-2.30%), leaving this NYSE index down (-.72%) on the year.

During June, inflation showed signs that it was not decelerating but instead could be building strength. While the Fed raised rates by .25% and continued on pace with quantitative tightening, the impact has been seen as a sharp decrease in money supply (M2), but the central banks’ intended effect has not been realized.

Monetary policy is seen as having a lagging effect; that is to say, when the Fed pushes rates up today, it may take a year to work its way into the system to cause slowing and less demand to reduce price increases. Whether the Fed has done enough can only be seen in the rearview mirror months from now.

Source: Koyfin

Market Sector Lookback

Of the 11 S&P market sectors (SPDRs), three were in positive territory as May came to a close. Technology, ticker XLK (+8.85%), was the only sector that showed an increase the previous month as well (.08%). That is followed by Communications Services, ticker XLC (3.92%), and Consumer Discretionary, ticker XLY, (+3.56%).

The S&P 500, which is comprised of the 11 market sectors, was barely positive during the month of May (+56%). 

Of the three worst performers are Industrials, ticker XLI (-3.67%), it faired the best as the industrial sector has been relatively flat on the year. The Materials, ticker XLB, (-6.87%) took a larger hit as commodities prices dropped during the month; this sector was positive on the year going into May. Energy, ticker XLE, (-11.73%) has been volatile during 2023. It is just off its low (-12%) that it reached in mid-March.

Looking Forward

The job market is strong, and inflation, at best, isn’t declining; this makes it more comfortable for the Fed to raise rates. Another way to look at it is it creates a need for them to continue to hammer away to reverse the inflationary trend – and the economic latitude in which to do it.

While the energy sector was the worst performer among S&P 500 sectors, there are factors suggesting the trend could hold until OPEC and Russia begin to work in synch again. Oil prices are near their lowest levels all year, reflecting a drop in global demand, on the output side, since October, OPEC+ was supposed to be reducing production by 3.5 million barrels a day. There are signs that a key country in the alliance isn’t adhering to the announced production cuts. Whether this causes additional “cheating”, or causes the cartel to force members to fall in line remains to be seen.

Technology stocks, particularly those that could possibly benefit from the artificial intelligence revolution, are likely to be among the focus for a while. The sudden broad awareness of what the technology can do has sent investors scrambling for exposure. Whether the potential (AI) is unleashed quickly or the promise of AI now takes a slower road remains to be seen.

The Russell Reconstitution will be complete as of the first Monday in June. The index will have its new components and the portfolio managers of indexed funds ought to own the stocks that were added to the indexes in their funds and sell out of those that are no longer in the funds index. This creates a lot of activity around June 24. When the market opens on June 27, the index with its new makeup will be set.

Take-Away

The market was full of uncertainty in May. Yet three of the four major market indexes were higher. The signing into law of an increased debt ceiling will make one of the most worrisome objections to being involved disappear. This may unleash buyers that were sidelined.

Technology, caused by high expectations of AI was the focus during May; often, hype causes investors to shoot first and aim later. There will be winners and losers in this technology segment, as with any investment; remove yourself from the hype, carefully evaluate the opportunity, and read the professional research, positive and negative, of those you trust.  

By the end of the month we will have two quarters of 2023 behind us, and there are no signs of a recession and little on the horizon to cause U.S. growth to falter quickly enough for there to be a recession this year. It is unlikely the Fed will ease in 2023. It is, however, likely a pause will eventually happen. There are reasons to believe that the pause won’t happen in June.

The axiom, sell in May and walk away is in question. Three of the four major indexes were up in May, so the jury is still out as to whether selling made sense for 2023.

Paul Hoffman

Managing Editor, Channelchek

Sources

https://www.clevelandfed.org/indicators-and-data/inflation-nowcasting

Koyfin | Advanced graphing and analytical tools for investors

Should Investors Expect Ongoing Monetary Policy Tightening Through 2023?

Is the Fed Falling Behind on Slowing the Economy?

Is the Federal Reserve’s monetary policy losing out to inflationary pressures? While supply chain costs have long been taken out of the inflation forecast, demand pressures have been stronger than hoped for by the Fed. One area of demand is the labor markets. While the Federal Reserve has a dual mandate to keep prices stable and maximize employment, the shortage of workers is adding to demand-pull inflation as wages are a large input cost in a service economy. As employment remains strong, they have room to raise rates, but if strong employment is a significant cause of price pressures, they may decide to keep the increases coming.

Background

The number of new jobs unfilled increased last month as US job openings rose unexpectedly in April. The total job openings stood at 10.1 million. Make no mistake, the members of the Fed trying to steer this huge economic ship would like to see everyone working. However, with the Bureau of Labor Statistics (BLS) reporting “unemployed persons” at 5.7 million in April as compared to 10.1 million job openings, creates far more demand than there are people to fill the positions. Those with the right skills will find their worth has climbed as they get bid up by employers that are still financially better off hiring more expensive talent rather than doing without.

This causes wage inflation as these increased business costs work their way down into the final cost of goods and services we consume, as inflation.

Where We’re At

The 10.1 million job openings employers posted is an increase from the 9.7 million in the prior month. It is also the most since January 2023. In contrast, economists had expected vacancies to slip below 9.5 million. The increase and big miss by economists’ forecasting increases in job opportunities is a clear sign of strength in the nation’s labor market. This complicates Chair Jerome Powell’s position, along with other Fed members. 

It isn’t popular to try to crush demand for new employees, but rising consumer costs at more than twice the Fed’s target will be viewed as too much.

The Fed says that it is data driven, this data is unsettling for those hoping for a pause or pivot.


The Investment Climate

These numbers and other strong economic numbers that were reported in April, create some uncertainty for investors as most would prefer to see the Fed stimulating rather than tightening conditions.

But the market has been resilient, despite the Feds’ resolve. The Fed has raised its benchmark interest rate ten times in the last 14 months. Yet jobs remain unfilled, and the stock market has gained quite a bit of ground in 2023. The concern has been that the Fed may overdo it and cause a recession. While even the Fed Chair admitted this is a risk he is willing to take, he also added that it is easier to start a stalled economy than it is to reel one in and the inflation that goes along with expansion.

So the strong labor market (along with other recent data releases) provides room for the Fed to tighten as there are still nearly two jobs for every job seeker. Additional tightening will eventually have the effect of simmering inflation to a more tolerable temperature. If the Fed overdoes it on the brake pedal, according to Powell, he knows where the gas pedal is.

Paul Hoffman

Managing Editor, Channelchek

Sources

https://www.bls.gov/news.release/pdf/empsit.pdf

The Week Ahead – Debt Ceiling, Beige Book, and Employment

The Holiday Shortened Trading Week Started with Positive Market News

It’s a four-day trading week in the US as the calendar changes from May to June. The US stock and bond markets will open on Tuesday knowing a government debt default is now likely averted as President Biden and House Speaker McCarthy reached an agreement Sunday on a deal to raise the nation’s debt ceiling. They have ensured the citizenry they have enough support in Congress to pass the measure this coming week. As far as economic reports, jobs and the labor market will be in the spotlight.

The market is focused on the labor market because Fed policymakers are paying attention to jobs numbers to determine if conditions are so strong they may indicate wage inflation or if they weakened and not strong enough to withstand another rate hike at the June 13-14 FOMC meeting.

Tuesday 5/30

•             9:00 AM ET, FHFA House Price Index. While interest rates have risen, housing prices have been flat to up. Continued demand caused prices to increase by .5% in February, it is expected prices rose again in March by a .3%.

•             10:00 AM ET, the Consumer Confidence index has been sinking and is expected to sink further in May to 100.0 from April’s 101.3. If you recall, April was much weaker than expected, reflecting a sharp decline in job and income expectations.

•             1:00 PM ET, Thomas Barkin is the CEO of the Richmond Federal Reserve district. In light of the PCE inflation indicator late last week and statements by Fed Chair Powell the Friday before, insight into thinking from FOMC members could move market sentiment.

Wednesday 5/31

•             8:50 AM ET, Susan Collins is the CEO of the Richmond Federal Reserve District. Comments by Fed district CEOs may get heightened attention this week as the market looks for clues as to what monetary policy changes may occur from the FOMC meeting in two weeks.

•             9:45 AM ET, The Chicago PMI is expected to fall in May to 47.0 versus 48.6 in April which was the eighth straight month of sub-50 contraction. Above 50 indicates economic expansion, and below 50 reflects a receding economy.

•             10:00 AM ET, Job Openings and Labor Turnover (JOLTS) have been declining. Forecasters put April’s openings at 9.35 million.

•             1:30 PM ET, Patrick Harker is the CEO of the Federal Reserve Bank of Philadelphia. He will be speaking. 

•             2:00 PM ET, If volatility sets in for the last two hours of trading on Wednesday, it may be because the Fed’s Beige Book is released. This report outlines the economic conditions in each of the Federal Reserve Districts. The FOMC uses the contents as a basis for its decision-making.

•             3:00 PM ET, Farm Prices may not be the most awaited for inflation indicator, but it is important as it is a leading inflation indicator. Agricultural prices for April are expected to have risen by 1.3% month-over-month. These increases will work their way into the Producer Price Index (PPI) and the Consumer Price Index (CPI).

Thursday 6/1

•            8:30 AM ET, Jobless claims for the May 27 week are expected to come in at 235,000 versus 229,000 in the May 20 week, which was lower than expected but followed 248,000 in the prior week.•             

•             8:30 AM ET, Released will be the second estimate for first-quarter Nonfarm Productivity. It is expected to remain the same as the first estimate, at minus 2.7 percent.

•             10:00 AM ET, The Institute for Supply Management (ISM) Manufacturing Index has been contracting over the last six months. May’s consensus is 47.0 versus April’s 47.1.

•             11:00 AM ET, The Energy Information Administration’s weekly update on petroleum inventories in the US is expected to show a decline of 12.5 million barrels.

•             1:00 PM ET, Patrick Harker is the CEO of the Federal Reserve Bank of Philadelphia. He will be speaking. 

•             4:30 PM ET, The Fed’s Balance Sheet report tells unveils if the Fed has been on track with monetary policy initiatives like quantitative Tightening (QT) and if the troubled bank outlets are getting more or less use. Obviously, this has been getting much more scrutiny by investors.

Friday 6/2

•             8:30 AM ET, The Employment Situation report is supposed to show a 180,000 rise is the call for nonfarm payroll growth in May versus 253,000 in April. Average hourly earnings in May are expected to rise 0.3 percent on the month for a year-over-year rate of 4.4 percent; these would compare with 0.5 and 4.4 percent in April, which were higher than expected. May’s unemployment rate is expected to edge higher to 3.5 percent versus April’s 3.4 percent, which was two-tenths lower than expected.

What Else

Look for a vote on the debt ceiling that is likely to pass both houses of Congress and be signed into law quickly this week.

Artificial intelligence, or AI, has been in the news at an escalating pace. While most agree it can make life better, there are also fears that if not governed, it can cause devastating problems. The White House is asking for input and comments before 5pm July 7. Get more information here.

On Tuesday May 30th and Wednesday May 31st, Tonix Pharmaceutical Holdings will be in South Florida presenting to investors as part of our Meet the Management Series. If you’d like to attend one of these roadshows, presented by Senior Management of Tonix, go here for more information.

Paul Hoffman

Managing Editor, Channelchek

Sources:

https://us.econoday.com/byweek.asp?cust=us

https://www.whitehouse.gov/wp-content/uploads/2023/05/OSTP-Request-for-Information-National-Priorities-for-Artificial-Intelligence.pdf

Noble/Channelchek  “Meet the Management” Roadshow Schedule

Details of the United States Credit Watch and Downgrade Status

Fitch Has Placed the United States and Some of its Debt on Credit Watch

What does it mean that rating agency Fitch has put the US debt on credit watch?

According to Fitch Ratings, a rating service that is one of the top three Nationally Recognized Statistical Rating Agencies (NRSRO), has placed the United States AAA Long-Term, Issuer Default Rating (IDR) on rating watch and at risk of a downgrade. The primary reason for the rating agency warning is the apparent standstill of negotiations related to the US borrowing limit along with the approaching day that the US may not be able to refinance the interest portion of approaching US Treasury Bills (T-Bills), US Treasury Notes (T-Notes), and US Treasury Bonds (T-Bonds).

Implications

When a top credit rating agency places a country’s debt on credit watch, it means that the agency is considering lowering that country’s credit rating if conditions remain unchanged or worsen. This would have a number of negative consequences for the country, and could negatively impact those that operate within its economy, this could include:

  • Higher interest rates on government borrowing
  • Higher rates on corporate debt priced off of US Treasuries
  • Higher mortgage rates spread to US Treasuries
  • A decline in the value of the country’s currency
  • Increased difficulty in attracting foreign investment

A downgrade of the US government credit rating below AAA would be a major event with far-reaching consequences above and beyond the immediate impacts bullet-pointed above.

Wording of the Fitch Ratings Warning

Rating agencies like Fitch, Moody’s, and S&P are private companies. Debt issuers pay to have their debt issues rated to provide investors with information and a framework of value. These rating agencies or NRSROs are somewhat akin to providers of equity research to stock market participants via company-sponsored research.

Some of the main categories listed by Fitch titled, KEY RATING DRIVERS, are “Debt Ceiling Brinkmanship”, “Debt Limit Reached”, “X-Date Approaching”, “Debt Default Rating Implication”, “Potential Post Default Ratings”, and “High and Rising Public Debt Burden”.

The concern with debt ceiling brinkmanship according to Fitch is the “increased political partisanship that is hindering reaching a resolution to raise or suspend the debt limit despite the fast-approaching x-date (when the U.S. Treasury exhausts its cash position and capacity for extraordinary measures without incurring new debt).”

Fitch’s warning indicates it still expects a resolution to the debt limit before the x-date. However, it believes risks have risen that the debt limit will not be raised or suspended before the x-date and that the government could begin to miss payments on some of its obligations.

Fitch pointed out that the US reached its $31.4 trillion debt ceiling on Jan. 19, 2023. While the US Treasury has taken what Janet Yellen called “extraordinary measures” she also expects the measures could be exhausted as early as June 1, 2023. The cash balance of the Treasury reached USD76.5 billion as of May 23, and sizeable payments are due June 1-2.

The x-date has been defined as the day the US can’t meet its obligations without borrowing above the current Congressional debt limit. Failure to reach a deal “to raise or suspend the debt limit by the x-date would be a negative signal of the broader governance and willingness of the U.S. to honor its obligations in a timely fashion,” Fitch warned. The rating agency indicated this “would be unlikely to be consistent with a ‘AAA’ rating”   

Fitch also addressed the 14th amendment discussions and other unconventional solutions, “avoiding default by non-conventional means such as minting a trillion-dollar coin or invoking the 14th amendment is unlikely to be consistent with a ‘AAA’ rating and could also be subject to legal challenges,” Fitch advised.

The debt default rating warning comes from basic understanding of the role of a rating agency. However, Fitch did offer an opinion on the likelihood. “We believe that failing to make full and timely payments on debt securities is less likely than reaching the x-date, and is a very low probability event.

If a default did occur, Fitch indicated it would be more than one level adjustment to some debt affected. Fitch’s sovereign rating criteria would lead it to downgrade the sovereign rating (IDR) to Restricted Default (RD). Actual affected securities would be downgraded to ‘D’. Additionally, other LT debt securities with payments due within 30 days could be expected to be downgraded to ‘CCC’, and ST T-Bills maturing within the following 30 days could be expected to be downgraded to ‘C’.

“Other debt securities with payments due beyond 30 days would likely be downgraded to the expected post-default rating of the IDR,” Fitch wrote.

The US has a high and rising public debt burden, according to the rating agency. It points out that government debt fell to 112.5% of GDP at year-end 2022 (compared to 36.1% for the ‘AAA’ median). It peaked during the pandemic at 122.3%. Fitch forecasts debt to increase to 117% by end-2024. Debt dynamics under the baseline Congressional Budget Office (CBO) assumptions project that the ratio of federal debt held by the public to GDP will approach 119% within a decade under the current policy setting, a rise of over 20 pp. Fitch also recognizes the added cost of financing, adding, “interest rates have risen significantly over the last year with the 10-year Treasury yield at close to 3.7% (compared to 2.8% a year ago).”

Take Away

The decision to put a country’s debt on credit watch is not made lightly. One company announcement such as this can have an impact felt across the globe. It’s important for them to get this right. NRSROs typically would only put a sovereign nation, especially the US, where its debt is often called “the risk free rate,” and the US dollar serves as fiat currency. Firch did this because they view it as responsible and in line with what securities analysts and the rating services they work for are expected to watch out for.

In the current case of the United States debt ratings, the main concern is the political gridlock in Washington, which has made it difficult to reach an agreement on raising the debt ceiling. If the debt ceiling is not raised, the United States will eventually run out of money to pay its bills, which would trigger a default. Fitch would be embarrassed (and arguably irresponsible) if they maintained a AAA rating just one week before the US Treasury Secretary indicated the nation couldn’t roll its debt.

Paul Hoffman

Managing Editor, Channelchek

Sources

https://www.fitchratings.com/research/sovereigns/fitch-places-united-states-aaa-on-rating-watch-negative-24-05-2023

The FOMC Minutes Define Two Determinants of Future Policy

Image Credit: Federal Reserve (Flickr)

Federal Open Market Committee Minutes Reveal Uncertainty

The Federal Reserve released the minutes of its last Federal Open Market Committee (FOMC) meeting. They show the Fed, as a whole, at the May 2-3 meeting as less than clear as to the near-term direction of monetary policy. The U.S. central bank officials are best described as believing they need to be nimble and react, keeping their options open rather than have a plan to continue raising interest rates or hold them steady after future meetings.

Fed officials remained concerned about inflation. Conversations and debates centered on the impact of tighter financial conditions and the degree of lag with which monetary policy would have an impact. According to the meeting minutes, the expected lag could mean their tightening campaign is nearly finished.

This release provided long-awaited insight and shed a modicum of light on how seriously Fed officials were considering changing course or holding interest rates steady when they met last month.

Actual Decision

Federal Reserve officials moved unanimously to raise interest rates at the central bank’s meeting on monetary policy in May despite significant debate at the time over whether pausing tightening efforts would instead be the more prudent move.

The minutes from the Fed’s May 2-3 meeting show concerns and offer clues as to what is important to various factions of the FOMC.

Key Language in Minutes

Banking

“Participants noted that risks associated with the recent banking stress had led them to raise their already high assessment of uncertainty around their economic outlooks. Participants judged that risks to the outlook for economic activity were weighted to the downside, al­though a few noted the risks were two-sided.”

In their discussion, various participants commented on developments in banking, noting that the banking system was sound and resilient. They also patted themselves on the back, saying that, “actions taken by the Federal Reserve in coordination with other government agencies had served to calm conditions in that sector, but that stresses remained.”

 Some participants noted that the banking sector was well-capitalized overall. The belief is that “the most significant issues in the banking system appeared to be limited to a small number of banks with poor risk-management practices or substantial exposure to specific vulnerabilities.”

U.S. Debt Ceiling

“Some participants also noted concerns that the statutory limit on federal debt might not be raised in a timely manner, threatening significant disruptions to the financial system and tighter financial conditions that weaken the economy.”

Inflation

“Regarding risks to inflation, participants cited the possibility that price pressures could prove more persistent than anticipated because of, for example, stronger-than-expected consumer spending and a tight labor market, especially if the effect of bank stress on economic activity proved modest.”

A few members felt further tightening could bring supply and demand imbalances more in line and reduce inflation pressures.

“Some participants cited the possibility that further tightening of credit conditions could slow household spending and reduce business investment and hiring, all of which would support the ongoing rebalancing of supply and demand in product and labor markets and reduce inflation pressures.”

Lag of Policy on Economy

A number of members saw evidence that policy was on track to rebalance price pressures and having its desired effect.

“In discussing the policy outlook, participants generally agreed that in light of the lagged effects of cumulative tightening in monetary policy and the potential effects on the economy of a further tightening in credit conditions, the extent to which additional increases in the target range may be appropriate after this meeting had become less certain.”

“Participants agreed that it would be important to closely monitor incoming information and assess the implications for monetary policy.”

There are two factors that the FOMC minutes noted would be determinants to whether additional policy actions would be needed, they are:

“…the degree and timing with which cumulative policy tightening restrained economic activity and reduced inflation, with some participants commenting that they saw evidence that the past years’ tightening was beginning to have its intended effect.”

“… the degree to which tighter credit conditions for households and businesses resulting from events in the banking sector would weigh on activity and reduce inflation, which participants agreed was very uncertain.”

“Some participants commented that, based on their expectations that progress in returning inflation to 2 percent could continue to be unacceptably slow, additional policy firming would likely be warranted at future meetings.”

“Several participants noted that if the economy evolved along the lines of their current outlooks, then further policy firming after this meeting may not be necessary.”

“Almost all participants stated that, with inflation still well above the Committee’s longer-run goal and the labor market remaining tight, upside risks to the inflation outlook remained a key factor shaping the policy outlook. A few participants noted that they also saw some downside risks to inflation.”

Uncertainty

Some participants commented at the meeting that they, “saw evidence that the past years’ tightening was beginning to have its intended effect.”

The members seemed to not have a handle on the impact of the health of the banking industry’s impact, the minutes read, “the degree to which tighter credit conditions for households and businesses resulting from events in the banking sector would weigh on activity and reduce inflation, which participants agreed was very uncertain.”

 Take Away

The path forward for monetary policy is, as the Federal Reserve has continually stated, data dependent. The clarity of trends of the data is unclear in part because of any expected lag, the health of banking, and the stickiness of inflation.

Paul Hoffman

Managing Editor, Channelchek

Sources

https://www.federalreserve.gov/monetarypolicy/fomcminutes20230503.htm

Solid Evidence a Recession is Unlikely this Year

Reliable Data, Not Emotions, are Pointing to a Growing U.S. Economy

In roughly one month, we will be halfway through 2023. While many point to the Fed’s pace of tightening and the downward sloping yield curve, as a reason to run around like Chicken Little warning of a coming recession, a fresh read of the economic tea leaves tells a different story. Just today, May 23, the PMI Output Index (PMI) rose to its highest reading in over a year. Home sales figures were also reported to show that new homes in May sold at the highest rate in over a year. These are both reliable leading indicators that point to growth in both services and manufacturing.

U.S. Composite PMI Output Index

Business activity in the U.S. increased to a 13-month high in May due in large part to strong growth in the services sector. This is a reliable indication that economic expansion has growing momentum. Despite the negative talk of those that are concerned that the Fed has lifted interest rates closer to historical norms and that the yield curve is still inverted, in part due to Covid era Fed yield-curve-control, the numbers suggest less caution might be warranted.

S&P Global said on Tuesday (May 23) its flash U.S. Composite PMI Output Index, which tracks the manufacturing and services sectors, rose to a reading of 54.5 this month. It indicates the highest level since April 2022 and is up from a reading of 53.4 in April. A reading above 50 indicates growth, this is the fourth consecutive month it has been above 50. The consensus among economists was only 52.6.

Home Sales

One sector that is directly impacted by interest rates is real estate. However, new home sales rose in April, this is a clear sign that prospective buyers are making deals with builders.

New homes in April were sold at a seasonally-adjusted annual rate of 683,000, Its the highest rate since March 2022. The April data represents a 4.1% gain from March’s revised rate of 656,000,. The report was from the Census and Department of Housing and Urban Development and was reported Tuesday May 23. Economists had expected new home sales to decline to 670,000 from a March rate of 683,000. It was the largest month-over-month increase since December 2022.

Leading Indicators

PMI is forward-looking as it surveys purchasing managers’ expectations and intentions for the coming months. By capturing their sentiment on future orders, production plans, and hiring intentions, PMI offers insights into economic trends that have yet to be reflected in other after-the-fact indicators.

Home sales are considered a leading indicator because they can serve as a measure of other needs and broader economic trends. Home sales have a significant impact on related sectors, such as construction, home improvement, finance, and consumer spending. Changes in home sales can influence economic activity and indicate shifts in consumer confidence, employment levels, and overall economic health.

While many economic reports offer rear-view mirror data, these reports are true indicators of business behavior as it plans for future expectations, and consumer behavior as it is confident that it will have the resources available to purchase and outfit a new home.

The upbeat reports prompted the Atlanta Federal Reserve to raise its second-quarter gross domestic product estimate to a 2.9% annualized rate from a 2.6% pace. The economy grew at a 1.1% rate in the first quarter.

Take Away

Many economists are negative about the economic outlook later this year. Market participants have been positioning themselves with the notion that there may be a late year recession. Is the notion misguided? Recent data suggests there may be buying opportunities for those willing to go against the tide of pundits preaching recession.

No one has a crystal ball. In good markets and bad, there is no replacement for good research before you put on a position, and then for as long as the position remains in your portfolio.

Channelchek is a great resource for information to follow the companies not likely being reported in traditional outlets. Turn to this online free resource as you evaluate small and microcap stocks.

Paul Hoffman

Managing Editor, Channelchek

Sources

World Economic Outlook

Barron’s (May 23, 2023)

Reuters (May 23, 2023)

We May Soon Know if Yellen’s “Extraordinary Measures” are Extraordinary Enough

The Pace of the U.S. Treasury Burn Rate Toward a $0.00 Balance

The US Treasury Department is nearing its last ounce of blood as it has been bleeding operating funds. All parties know that the debt ceiling has to be raised if the country is to avoid a financial catastrophe. Still, an impasse on debt ceiling negotiations continues. While the House of Representatives has passed a borrowing cap plan, it is not expected that the Senate would agree on the spending reductions, and President Biden made clear he would not sign it.

The markets, of course, have been paying attention, but for the most part, they have chosen to ignore the drama. Anyone that has been involved in the markets for a few years knows that in the past, there have been stop-gap measures or 11th hour decisions that have avoided a US debt default.

It is Getting Close

The US Treasury reported last Thursday that it had $57.3 billion in cash on hand. As with any ongoing entity, each week, it receives revenue and pays expenses. So the daily balance runoff fluctuates by different amounts each day. A snapshot is reported each Thursday along with other US financial data. The current pace, while not a precise rate to gauge the net burn rate, is useful.

The operating balance used to pay our bills as a nation has declined from $238.5 billion at the start of May, when tax collections helped boost balances. That’s a $181.2 billion decline over 18 days, or $10 billion per day. If the pace holds, the United States balance sheet reaches zero before the June 1 date previously estimated by US Treasury Secretary Janet Yellen.

Image: @GRDector (Twitter)

How are Officials Reacting?

The US reached its Congressionally imposed borrowing cap in January. Since then, there has been a cutting back on spending, as had been announced in January by Janet Yellen. The Treasury has since been operating under an “Extraordinary Measures” plan, reducing less than critical spending to pay obligations that can not be ignored without great consequence. This bandaid approach will go on and, at this point, can only be “fixed” if the debt ceiling is raised once again by Congress.

Treasury Secretary Janet Yellen has been clear in warning lawmakers that the Treasury’s ability to avoid default could end as soon as June 1. The nation has to increase its ability to legally borrow to make its payments while its obligations exceed its revenue.

Averting a June Crisis Without Congress

While most US citizens are aware of the mid-April individual tax date, corporate tax dates are quarterly. The next time most corporations pay their estimated taxes is June 15th. If Secretary Yellen can squeeze the Treasury balances until June 15th, she will no longer be driving on fumes – instead, she will have added a little more gas, not enough to get her to the next corporate tax date.  

Another thought depends on one’s interpretation of the 14th Amendment. This amendment of the US Constitution contains several provisions, one of which is Section 4. This section states that “the validity of the public debt of the United States, authorized by law… shall not be questioned.” While the exact interpretation of this provision is a matter of legal debate, it has been suggested that it could potentially provide a legal basis for the government to continue meeting its financial obligations, even if the debt ceiling is reached.

Some argue that the 14th Amendment could empower the President to bypass the debt ceiling and ensure that the government continues to pay its debts on time, based on the principle that the United States must honor its financial obligations.

Stalled Talks

Although the date of $zero balance is not far off if the President and Senate doesn’t agree to the House plan, or if the House is inflexible, negotiations have moved in fits and starts with Congressional leaders meeting on and off with each other and with the Executive branch.  

If the nation does default, it will unleash global economic and financial upheaval. The full consequences are not known since it’s never happened before. Those likely to see funds come to a crawl or be turned off are:

  • Interest on the debt: While the debt itself would continue to be serviced, a stringent austerity plan could potentially result in reduced payments towards interest on the national debt.
  • Government programs and agencies: Funding for discretionary programs, such as infrastructure projects, education initiatives, environmental programs, or research grants, could be reduced or eliminated.
  • Social welfare programs: Payments for social welfare programs, such as unemployment benefits, food assistance, housing subsidies, or healthcare subsidies, may be reduced or scaled back.
  • Defense spending: Military expenditures and defense contracts may face cuts, impacting payments to defense contractors and the procurement of military equipment and services.
  • Government salaries and benefits: Austerity measures could involve salary freezes, reductions, or furloughs for government employees, including civil servants, military personnel, or elected officials.
  • Infrastructure projects: Funding for infrastructure development and maintenance, including transportation systems, highways, bridges, and public facilities, may face reductions or delays.
  • Grants to states and local governments: Payments to states and local governments for various programs, such as education, healthcare, or community development, could be reduced.

The above are not set in stone, it’s important to note that the specific impacts of an austerity plan would depend on the policies and priorities set by the government, and different austerity measures are also a matter of negotiation.

While Yellen, the Congressional Budget Office, and multiple other forecasters think the $Zero date is likely during the first two weeks of June, it’s possible that the Treasury will have enough funds to carry it through the middle of the month, which would add more time.

However, as it looks now, the US Government is running on fumes; in the past, it has not allowed itself to completely run out of gas. If today’s situation follows past history, the markets will get scared a few more times before the US leaders agree and the country is back to business as usual.

Paul Hoffman

Managing Editor, Channelchek

Sources

https://fiscaldata.treasury.gov/datasets/daily-treasury-statement/operating-cash-balance

https://home.treasury.gov/news/press-releases/jy1483

The Week Ahead – FOMC Minutes, M2, and Early Close

The Market Hurdles Before the Holiday

The FOMC minutes on Wednesday detailing the debate at the Federal Reserve’s May 2-3 meeting could be an eye-opener for investors. Expectations for many had been that the Fed would pause tightening. The Fed has publicly insisted that the interest rate moves are data dependent and there isn’t a scheduled plan extending through the rest of the year. If the minutes suggest pausing, markets shouldn’t react severely, if instead, the minutes suggest the Fed is panicking at the pace of the economy and persistence of inflation, the stock market may itself pause the recent bullish moves. Inflation data in the form of the PCE report Friday is not expected to show much improvement.

Friday is one of the bigger days for economic reports as Consumer Sentiment is released in the morning. On Friday afternoon, SIFMA recommends an early close before the Memorial Day weekend.

Monday 5/22

  • 8:30 AM ET, James Bullard will be speaking. Bullard is the President and CEO of the Federal Reserve Bank of St. Louis. Bullard is an FOMC member and has been very vocal in his support for higher interest rates.
  • 10:50 AM ET, Thoms Barkin will be speaking. Barkin is the President and CEO of the Federal Reserve Bank of Richmond. He is a member of the FOMC Committee.
  • 11:05 AM ET, Mary Daly will be speaking. Daly is the President and CEO of the Federal Reserve Bank of San Francisco. She is a member of the Federal Open Market Committee (FOMC).

Tuesday 5/23

  • 9:00 AM ET, Lorie Logan, CEO of the Federal Reserve Bank of Dallas will be speaking. She represents her district on the FOMC.
  • 9:45 AM ET, The Purchasing Managers Report (PMI) has been signaling higher output for the last three releases. A number above 50 indicates an increase; the consensus for May is 52.6 versus April’s 55.9.
  • 10:00 AM ET, New Home Sales, after a decent jump to a 683,000 annualized rate in March, new home sales in April are expected to have declined to 670,000.
  • 1:00 PM ET, Money Supply numbers will be released. M2 is expected to have declined by 257.3 billion to a level of $20,818 billion.

Wednesday 5/24

  • 10:30 AM ET, The Energy Information Administration (EIA) will be providing its scheduled weekly information on petr
  • oleum inventories, whether produced in the US or abroad. The level of inventories helps determine prices for petroleum products.
  • 2:00 PM ET, The Minutes of the FOMC meeting held on May2-3 will be released. The minutes detail the issues, discussions, and positions among policymakers; the Federal Open Market Committee issues minutes of its latest meeting three weeks after the meeting.

Thursday 5/25

  • 8:30 AM ET, Jobless claims for the week May 20, are expected to rise 6,000 to 248,000 following a 22,000 swing lower to 242,000 in the prior week.
  • 8:30 AM ET, Corporate Profits are pulled from the national income and product accounts (NIPA) and are presented in different forms.
  • 10:00 AM ET, Pending Home Sales data from April are expected to have risen 1.1%.
  • 10:30 AM ET, Susan Collins is the President and CEO of the Federal Reserve Bank of Boston.

Friday 5/26

  • 8:30 AM ET, Durable Goods Orders are expected to have fallen 1.1% in April following March’s 3.2% rise. Ex-transportation orders are seen down 0.1 percent.
  • 8:30 AM ET, Personal Income and Outlays. Personal Income is expected to have increased 0.4% in April with consumption expenditures also expected to increase 0.4%. These would compare with March’s 0.3 percent for income and no change for consumption.
  • 8:30 AM ET, Retail Inventories are expected to have risen by .73%.
  • 8:30 AM ET, Wholesale Inventories are expected to have been flat in April risen by.
  • 8:30 AM ET, International Trade numbers are expected to show the US goods deficit is expected to widen marginally to $85.6 billion in May after narrowing by $6.5 billion in April to $85.5 billion.
  • 10:00 AM ET, Consumer Sentiment is expected to end May at 58.0, nearly 6 points below April but shigher by .30% from May’s mid-month 57.7 flash.International Trade numbers are expected to show the US goods deficit is expected to widen marginally to $85.6 billion in May after narrowing by $6.5 billion in April to $85.5 billion.
  • 2:00 PM ET, SIFMA Recommends an Early Market Close on May 26  (2PM) and a Full Market Close on May 29 in the US in Observance of the Memorial Day Holiday. 

What Else

Investment roadshows on company’s you own or have an interest in can lead to insights you’d never get anyplace else.

A stock that has the distinction of being Michael Burry’s longest held position (a long position) is a company named GEO Group (GEO).

On May 23rd and May 24th you may be able to attend a roadshow in South Florida presented by Senior Management of Geo Group.

Paul Hoffman

Managing Editor, Channelchek

Sources:

https://us.econoday.com/byweek.asp?cust=us