For more than 45 years, 1-800-Flowers.com has offered truly original floral arrangements, plants and unique gifts to celebrate birthdays, anniversaries, everyday occasions, and seasonal holidays, and to deliver comfort during times of grief. Backed by a caring team obsessed with service, 1-800-Flowers.com provides customers thoughtful ways to express themselves and connect with the most important people in their lives. 1-800-Flowers.com is part of the 1-800-FLOWERS.COM, Inc. family of brands. Shares in 1-800-FLOWERS.COM, Inc. are traded on the NASDAQ Global Select Market, ticker symbol: FLWS.
Michael Kupinski, Director of Research, Noble Capital Markets, Inc.
Jacob Mutchler, Research Associate, Noble Capital Markets, Inc.
Refer to the full report for the price target, fundamental analysis, and rating.
Highlights from recent NDR. This report highlights investor meetings hosted in Southern Florida last week by Chris McCann, CEO; Tom Hartnett, President; Bill Shea, CFO; and Andy Milevoj, Sr. VP Investor Relations.
On the hunt for acquisitions. The company has made successful acquisitions during uncertain economic times, such as the acquisition of Harry & David in 2014, a year of sluggish economic growth. Management indicated that acquisitions is the best use of cash at this time, which may position the company for enhanced revenue and cash flow growth. Notably, the company indicated that it has always acquired for cash.
Equity Research is available at no cost to Registered users of Channelchek. Not a Member? Click ‘Join’ to join the Channelchek Community. There is no cost to register, and we never collect credit card information.
This Company Sponsored Research is provided by Noble Capital Markets, Inc., a FINRA and S.E.C. registered broker-dealer (B/D).
*Analyst certification and important disclosures included in the full report. NOTE: investment decisions should not be based upon the content of this research summary. Proper due diligence is required before making any investment decision.
Joe Gomes, Managing Director – Generalist Analyst, Noble Capital Markets, Inc.
Joshua Zoepfel, Research Associate, Noble Capital Markets, Inc.
Refer to the full report for the price target, fundamental analysis, and rating.
4QFY23 Results. Net revenue of $147.1 million came in above guidance of $136-$141 million, and our $138 million estimate. Expanded promotional activity negatively impacted adjusted gross margin, which declined 240bp y-o-y. GAAP EPS loss was $0.91, while adjusted EPS was $0.16, compared to EPS of $0.15 and $0.17, respectively, in 4QFY22, and our $0.15 estimate.
Improving Sales Trends. In the fourth quarter, sales trends at both Vera Bradley and Pura Vida improved over prior quarters, with Vera Bradley total sales down just 1% and Pura Vida sales down less than 5% on a year-over-year basis. Targeted customer retention efforts led to increased Vera Bradley e-commerce revenues, while Full-Line and Factory store revenues continued to be negatively affected by traffic levels. At Pura Vida, e-commerce trends improved over previous quarters due to strategic promotions.
Equity Research is available at no cost to Registered users of Channelchek. Not a Member? Click ‘Join’ to join the Channelchek Community. There is no cost to register, and we never collect credit card information.
This Company Sponsored Research is provided by Noble Capital Markets, Inc., a FINRA and S.E.C. registered broker-dealer (B/D).
*Analyst certification and important disclosures included in the full report. NOTE: investment decisions should not be based upon the content of this research summary. Proper due diligence is required before making any investment decision.
Joe Gomes, Managing Director – Generalist Analyst, Noble Capital Markets, Inc.
Joshua Zoepfel, Research Associate, Noble Capital Markets, Inc.
Refer to the full report for the price target, fundamental analysis, and rating.
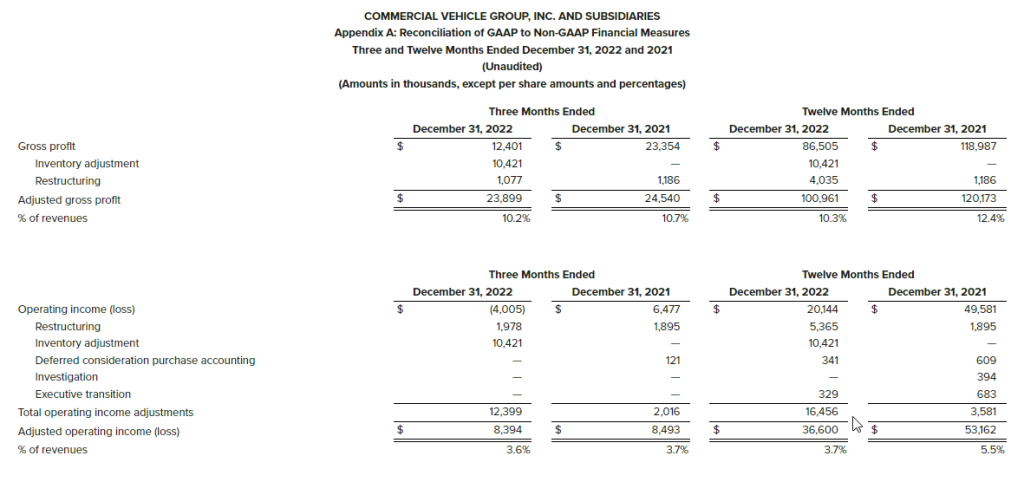
4Q22 Bottom Line Impacted By Special Items. CVG reported GAAP EPS of a loss of $0.98. Adjusting for one-time items, adjusted EPS was $0.04. Further adjusting for special items, high program start-up costs and foreign exchange, special item adjusted EPS was $0.14, or much more in-line with our $0.17 forecast, which did not include any of the above.
A Refined Long-term Roadmap. Management put out a more refined long-term roadmap with a goal of $1.5 billion of revenue and a 9.0% adjusted EBITDA margin for 2027. While the new revenue goal is below the previous $1.9 billion goal, the adjusted EBITDA margin rises from a prior 8.5%. We believe the updated road map reflects management’s goal of focusing on adding only higher margin growth and not just growth for growth’s sake.
Equity Research is available at no cost to Registered users of Channelchek. Not a Member? Click ‘Join’ to join the Channelchek Community. There is no cost to register, and we never collect credit card information.
This Company Sponsored Research is provided by Noble Capital Markets, Inc., a FINRA and S.E.C. registered broker-dealer (B/D).
*Analyst certification and important disclosures included in the full report. NOTE: investment decisions should not be based upon the content of this research summary. Proper due diligence is required before making any investment decision.
FAT Brands (NASDAQ: FAT) is a leading global franchising company that strategically acquires, markets, and develops fast casual, quick-service, casual dining, and polished casual dining concepts around the world. The Company currently owns 17 restaurant brands: Round Table Pizza, Fatburger, Marble Slab Creamery, Johnny Rockets, Fazoli’s, Twin Peaks, Great American Cookies, Hot Dog on a Stick, Buffalo’s Cafe & Express, Hurricane Grill & Wings, Pretzelmaker, Elevation Burger, Native Grill & Wings, Yalla Mediterranean and Ponderosa and Bonanza Steakhouses, and franchises and owns over 2,300 units worldwide. For more information on FAT Brands, please visit www.fatbrands.com.
Joe Gomes, Managing Director – Generalist Analyst, Noble Capital Markets, Inc.
Joshua Zoepfel, Research Associate, Noble Capital Markets, Inc.
Refer to the full report for the price target, fundamental analysis, and rating.
Management Change. Yesterday after the market close, FAT Brands announced that its founder and CEO, Andy Wiederhorn, will transition to a new role as an outside consultant and strategic advisor to the Company effective May 5, 2023. Mr. Wiederhorn will remain a FAT Brands Board member and his family office, Fog Cutter Holdings LLC, will continue as the controlling shareholder of FAT Brands. The appointment of an interim CEO will be announced prior to the transition date, and Mr. Wiederhorn will continue as CEO until then.
Drivers. According to the Company, in transitioning from his role as CEO, Mr. Wiederhorn seeks to eliminate the distraction of the previously announced government investigation tied to him, and allow senior management to focus on continuing to drive shareholder value.
Equity Research is available at no cost to Registered users of Channelchek. Not a Member? Click ‘Join’ to join the Channelchek Community. There is no cost to register, and we never collect credit card information.
This Company Sponsored Research is provided by Noble Capital Markets, Inc., a FINRA and S.E.C. registered broker-dealer (B/D).
*Analyst certification and important disclosures included in the full report. NOTE: investment decisions should not be based upon the content of this research summary. Proper due diligence is required before making any investment decision.
Joe Gomes, Managing Director – Generalist Analyst, Noble Capital Markets, Inc.
Joshua Zoepfel, Research Associate, Noble Capital Markets, Inc.
Refer to the full report for the price target, fundamental analysis, and rating.
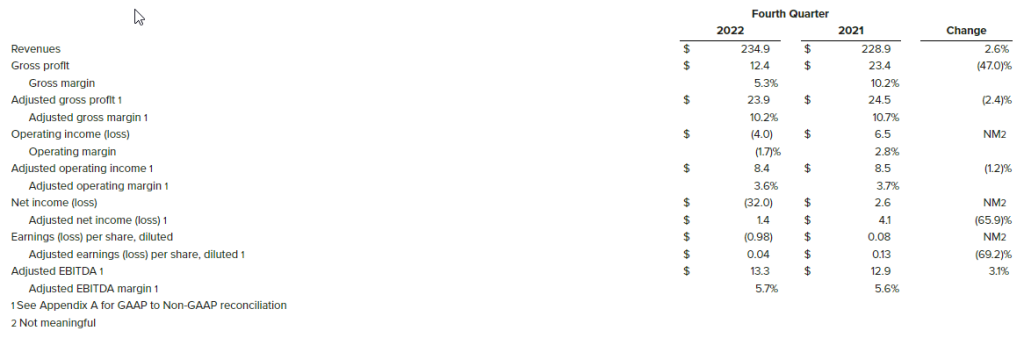
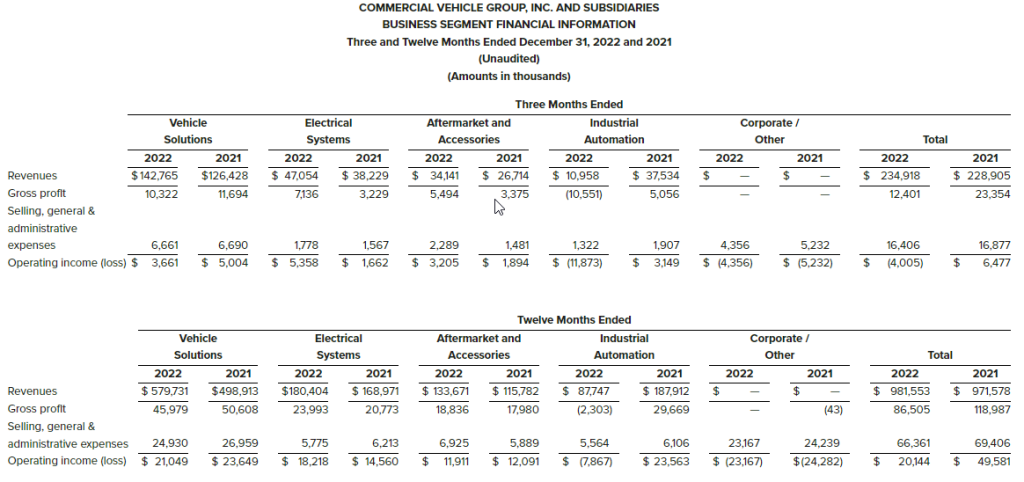
4Q22 Top Line. Revenues were $234.9 million compared to $228.9 million in the prior year period, an increase of 2.6%. The increase in revenues is due to increased pricing to offset material cost increases. Foreign currency translation unfavorably impacted fourth quarter 2022 revenues by $6.3 million, or by 2.7%. New business revenue was approximately $20 million in the quarter, offsetting ongoing softness in the Industrial Automation segment. We had forecast revenue of $249 million.
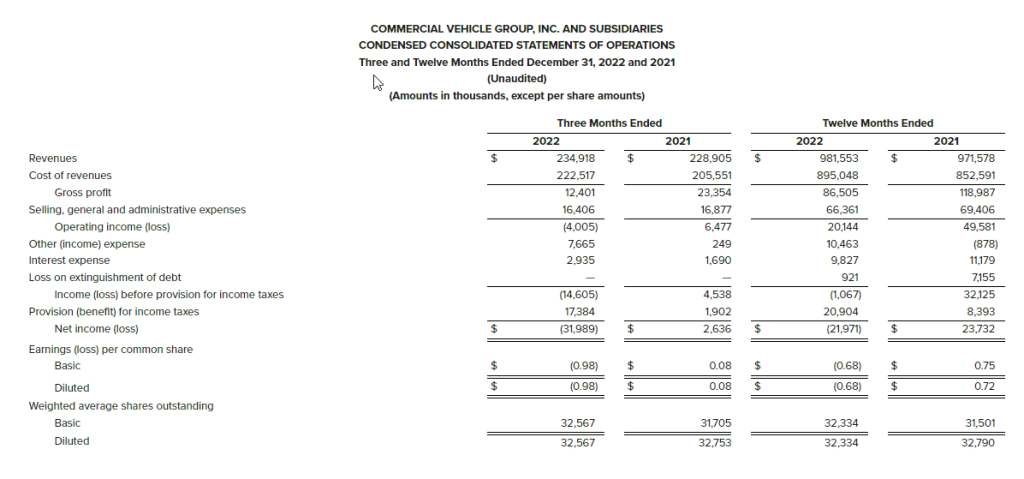
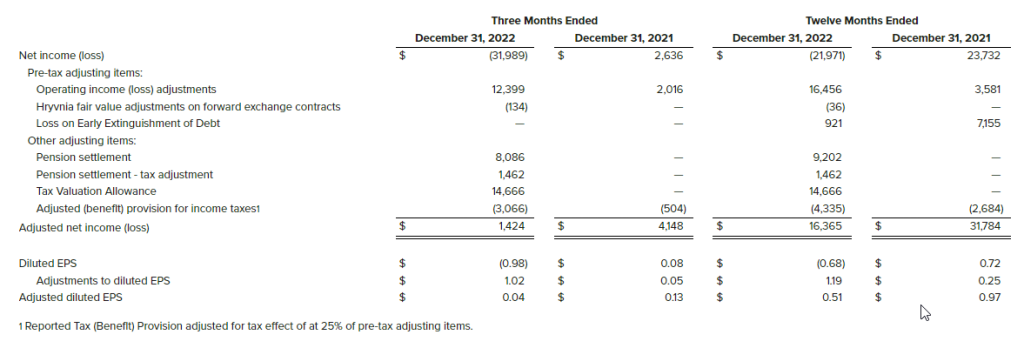
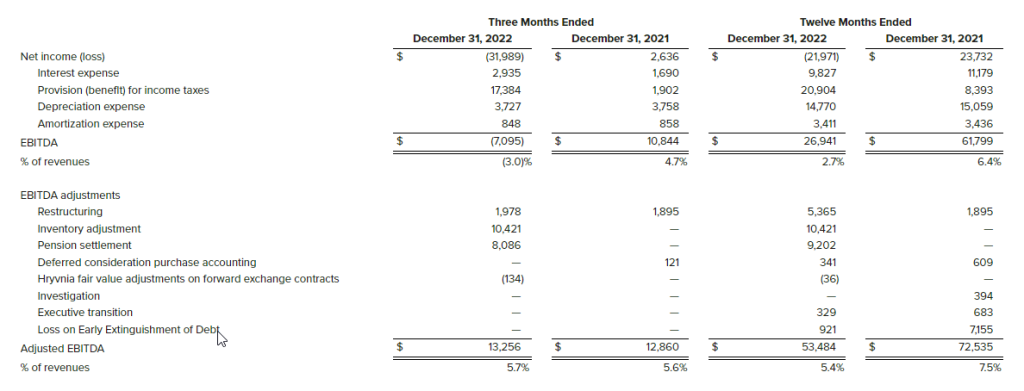
4Q22 Bottom Line. CVGI reported a net loss of $32.0 million, or $0.98 per diluted share for the quarter, caused by non-cash charges related to tax valuation allowance changes, a pension settlement to terminate the Company’s U.S. legacy pension plan, and a $10.4 million non-cash charge in the Industrial Automation segment due to the modest outlook for the business. Adjusted EPS was $0.04, short of our $0.17 projection. Adjusted EBITDA was $13.3 million, up $0.4 million or 3.1%.
Equity Research is available at no cost to Registered users of Channelchek. Not a Member? Click ‘Join’ to join the Channelchek Community. There is no cost to register, and we never collect credit card information.
This Company Sponsored Research is provided by Noble Capital Markets, Inc., a FINRA and S.E.C. registered broker-dealer (B/D).
*Analyst certification and important disclosures included in the full report. NOTE: investment decisions should not be based upon the content of this research summary. Proper due diligence is required before making any investment decision.
Veteran Restaurant Executive Will Assume New Position as Outside Consultant and Strategic Advisor
LOS ANGELES, March 06, 2023 (GLOBE NEWSWIRE) — FAT (Fresh. Authentic. Tasty.) Brands Inc. announces that its founder and CEO, Andy Wiederhorn, will transition to a new role as an outside consultant and strategic advisor to the Company effective May 5, 2023. Mr. Wiederhorn will remain a FAT Brands Board member and his family office, Fog Cutter Holdings LLC, will continue as the controlling shareholder of FAT Brands. The appointment of an interim CEO will be announced prior to the transition date, and Mr. Wiederhorn will continue as CEO until then.
In his strategic advisory role, Mr. Wiederhorn will continue to support the management team and the Company while focusing his time on the Company’s long-term strategy and capital allocation plans. In transitioning from his role as CEO, Mr. Wiederhorn seeks to eliminate the distraction of the previously announced government investigation tied to him, and allow senior management to focus on continuing to drive shareholder value.
“While I will be stepping aside as CEO, I will continue to support the growth and evolution of FAT Brands, including championing our talented executive team, which has over the past five years taken the Company from two brands to 17 iconic restaurant brands with over 2,300 units and systemwide sales of $2.2 billion annually,” said FAT Brands CEO Andy Wiederhorn. “In 2022 we were named Public Company of the Year by the Los Angeles Business Journal, due in large part to the hard work and dedication of our corporate teams and franchise partners.”
About FAT (Fresh. Authentic. Tasty.) Brands FAT Brands (NASDAQ: FAT) is a leading global franchising company that strategically acquires, markets, and develops fast casual, quick-service, casual dining, and polished casual dining concepts around the world. The Company currently owns 17 restaurant brands: Round Table Pizza, Fatburger, Marble Slab Creamery, Johnny Rockets, Fazoli’s, Twin Peaks, Great American Cookies, Hot Dog on a Stick, Buffalo’s Cafe & Express, Hurricane Grill & Wings, Pretzelmaker, Elevation Burger, Native Grill & Wings, Yalla Mediterranean and Ponderosa and Bonanza Steakhouses, and franchises and owns over 2,300 units worldwide. For more information on FAT Brands, please visit www.fatbrands.com.
Fourth quarter sales of $235 million, a 2.6% increase year-over-year Net loss $32.0 million,adjusted EBITDA of $13.3 million, a 3.1% increase in adjusted EBITDA Continued price realization to offset inflation
Business transformation continues, record annual sales of $982 million In 2023, Company expects to realize ~$150 million in new business revenue Strong free cash flow and debt paydown exceeded target at ~$43 million
NEW ALBANY, Ohio, March 06, 2023 (GLOBE NEWSWIRE) — CVG (NASDAQ: CVGI), a diversified industrial products and services company, today announced financial results for its fourth quarter and full year ended December 31, 2022.
Fourth Quarter 2022Highlights(Compared with prior-year period, where comparisons are noted)
Revenue of $234.9 million, up 2.6% as demand and price increases came through as expected. New business revenues fully offsetting softness in Industrial Automation (formerly known as Warehouse Automation). New business revenue was approximately $20 million in the quarter and $130 million for the full year.
Net loss of $32.0 million, or $0.98 per diluted share was caused by non-cash charges related to tax valuation allowance changes, a pension settlement to terminate the Company’s U.S. legacy pension plan, and a $10.4 million non-cash charge in Industrial Automation segment due to modest outlook for the business. The Company no longer has a pension liability in the United States.
Adjusted EBITDA of $13.3 million, up $0.4 million or 3.1%. Our pricing actions, solid demand, and new business revenues in our three vehicle-related segments are fully offsetting slowdown in the Industrial Automation segment. Startup expenses on new business ramp-ups were high at $3.3 million in the quarter, but set the stage for a much improved 2023.
Price negotiations during the quarter secured further increases beginning January 2023.
Full Year 2022Highlights(Compared with prior-year period, where comparisons are noted)
Revenue of $981.6 million, an annual record for the Company driven by the three vehicle segments, current year contribution of new business revenue, and higher prices to offset inflation.
Continued to gain new business on a wider spectrum of Non-Class 8 vehicles, with a wider set of customers, and new products. The Company secured an additional $150 million of new business wins during the year; these wins are concentrated in our Electrical Systems product lines. One-time startup costs were expensed as incurred and were $12.3 million in 2022 vs. $6.1 million in 2021.
Operating income of $20.1 million, down $29.4 million, and adjusted operating income of $36.6 million, down $16.6 million. The decrease in operating income was due to the lag effect of price recovery on ongoing business and funding a bigger startup program (approximately $6 million higher). The Company’s price recovery efforts are fully offsetting the cost of inflation and have curtailed growth programs tied to high-cost startups.
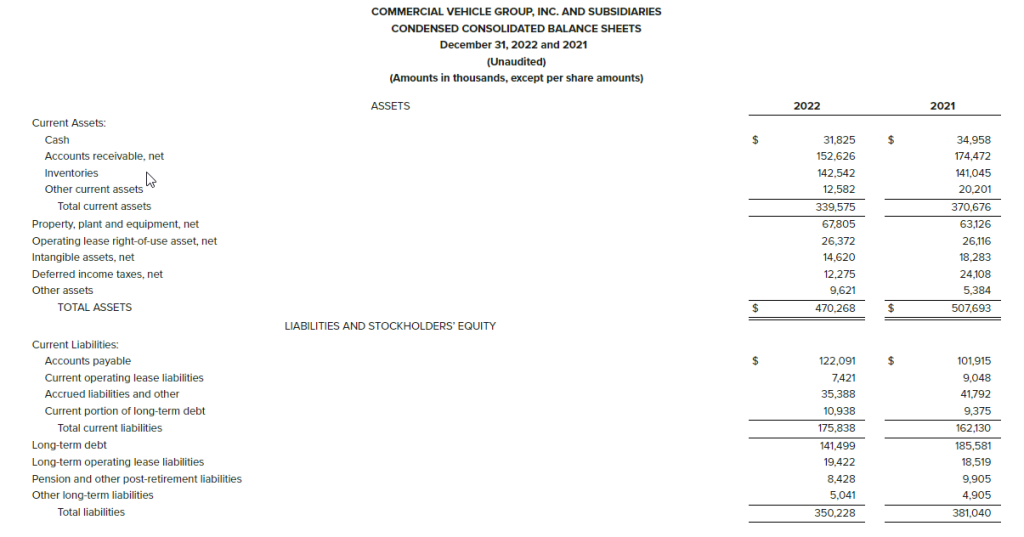
Full-year 2022 debt paydown was $43.2 million, and net debt declined to $120.6 million.
Harold Bevis, President and Chief Executive Officer of CVG, said, “We had a busy quarter of completing a good amount of new business startups, and negotiating substantial improvements in our price recovery program. The Industrial Automation business remains small with a modest outlook, so we took the opportunity to close a plant, right-size our payroll, and right-size our inventory profile.”
“In 2022, we delivered record revenues, had a record amount of new vehicle platform startups, and secured another approximately $150 million of new business wins on an ever-expanding lineup of vehicles. We believe that we can continue to add greater than $100 million of new business wins per year. In 2022, we also exceeded our goal of paying down debt, reduced debt by $43 million and ended the year with $121 million of net debt. We remain focused on higher levels of EBITDA, lower working capital, strategic capex, and lower debt levels.”
“We have already doubled the size of the Electrical Systems business on a pro-forma basis. The secular growth of the Electric Vehicle market is helping us as there is a lot of vehicle development activity globally and we are in an opportunity-rich environment. Our goal is to be known as a nimble, high-service growth company and progressively add new targeted business, concentrated in Electrical Systems.”
“Our transformation plan is working and we are increasing the proportion of our revenues and earnings coming from our Electrical Systems business. Cumulatively, in the last three years, we have secured new growth with 300+ new programs and 115+ new and existing customers.”
“The 2023 cost reduction program is over $30 million, comprised of approximately 350 projects globally. We are committed to lowering our cost structure, mainly in the non-growth areas, and mainly away from high-cost countries. We believe we can accomplish $90 million of cost-outs over the next three years. The Company is also announcing an ESG program of which a primary goal is to reduce its carbon footprint by 50% over the next 10 years.”
“We are expecting 2023 to be a year of record revenue, higher EBITDA, continued free cash flow and debt paydown, $30 million of cost-out, and at least $100 million of targeted new business wins, concentrated in Electrical Systems.”
Andy Cheung, Chief Financial Officer, added, “We delivered another quarter of strong top-line growth and, we have taken major actions to position the Company for strong 2023 performance. We have incurred additional startup costs to support the ramp up of our biggest platforms. Additionally, we made several non-cash GAAP balance sheet adjustments in the quarter, exceeded the high end of our target debt paydown range, and achieved our working capital reduction targets for the year.”
We recorded the following special items during the quarter:
We completed the restructuring of the industrial automation business and as a result recognized a non-cash write-down of $10.4 million in industrial automation inventory.
As a result of evaluating our global deferred tax assets, we took a net non-cash charge of $14.7 million.
We recorded a charge of $8.1 million related to the termination of the Company’s U.S. legacy pension plan.
“Giving effect to the tax adjustments noted above, our actual cash taxes were flat in 2022 versus 2021 at approximately $4.0 million.”
Financial Results (amounts in millions except per share data and percentages)
Consolidated Results
Fourth Quarter 2022 Results
Fourth quarter 2022 revenues were $234.9 million compared to $228.9 million in the prior year period, an increase of 2.6%. The increase in revenues is due to increased pricing to offset material cost increases. Foreign currency translation unfavorably impacted fourth quarter 2022 revenues by $6.3 million, or by 2.7%.
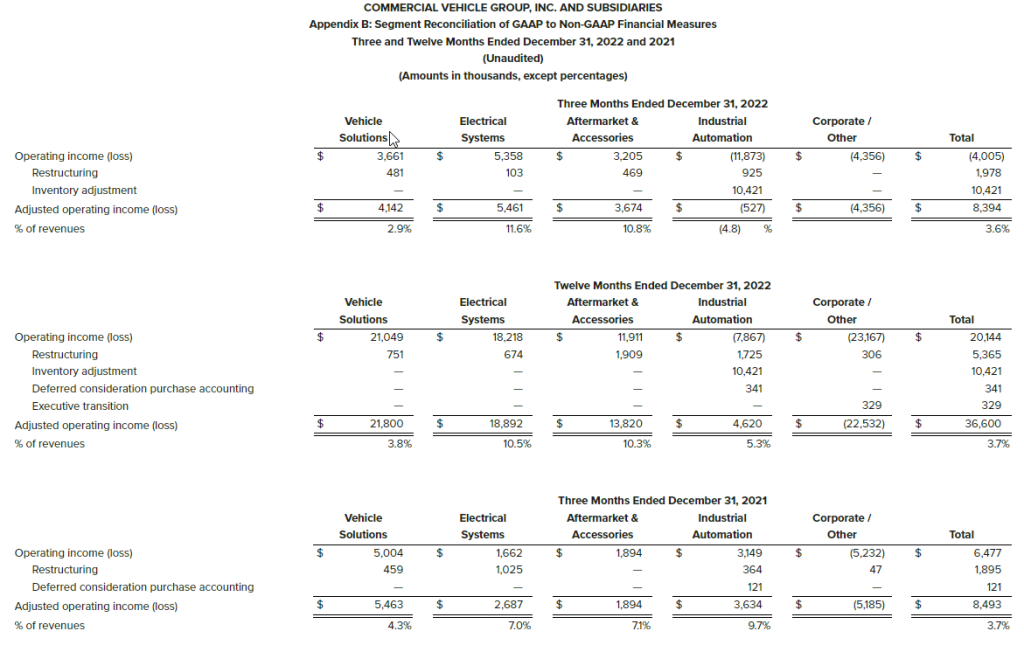
Operating loss for the fourth quarter 2022 was $4.0 million compared to operating income of $6.5 million in the prior year period. The decrease in operating income was primarily due to special costs, including restructuring and an inventory write-down due to decreased demand in the Industrial Automation segment. Foreign currency translation also unfavorably impacted fourth quarter 2022 operating loss by $0.9 million. Excluding special costs, the fourth quarter of 2022 adjusted operating income was $8.4 million, down 1.2%. Adjusted operating income includes $1.8 million of higher than expected startup costs on programs which will benefit future periods.
Interest expense was $2.9 million and $1.7 million for the fourth quarter ended December 31, 2022 and 2021, respectively. The increase in interest expense was due to higher interest rates, and a higher average debt balance during the fourth quarter 2022 compared to fourth quarter 2021.
Net loss was $32.0 million, or $(0.98) per diluted share, for the fourth quarter 2022 compared to net income of $2.6 million, or $0.08 per diluted share, in the prior year period.
At December 31, 2022, the Company had no outstanding borrowings on its revolving credit facility, $31.8 million of cash and $148.8 million availability from the revolving credit facility, resulting in total liquidity of $180.6 million.
Segment Results
Fourth Quarter 2022 Results (Compared with prior-year period, where comparisons are noted)
Vehicle Solutions Segment
Revenues were $142.8 million, an increase of 12.9% primarily resulting from material cost pass-through and increased sales volume.
Operating income for the fourth quarter 2022 was $3.7 million, a decrease of 26.8%. Primarily due to a lag in price recovery versus cost inflation and higher than planned start up costs. Excluding special costs, the fourth quarter of 2022 adjusted operating income decreased to $4.1 million, or 24.2%, as compared to the fourth quarter 2021.
Electrical Systems Segment
Revenues were $47.1 million, an increase of 23.1%, primarily resulting from material cost pass-through and contributions from new business wins.
Operating income was $5.4 million, an increase of $3.7 million primarily attributable to material cost pass-through and favorable volume. Adjusted operating income was $5.5 million, an increase of 103.2%, excluding special costs.
Aftermarket and Accessories Segment
Revenues were $34.1 million, an increase of 27.8%, primarily resulting from increased sales volume and increased pricing to offset material cost pass-through.
Operating income was $3.2 million, an increase of 69.2%. The increase in operating income was primarily attributable to the increase in pricing to offset material cost pass-through.
Industrial Automation Segment
Revenues were $11.0 million, a decrease of 70.8%, due to lower demand levels. Operating loss was $11.9 million, compared to operating income of $3.1 million in the prior year. The operating loss was primarily attributable to lower sales volumes and an inventory charge of $10.4 million. Adjusted operating loss was $0.5 million, a decrease of 114.5%. The business restructuring was primarily completed during the quarter.
2023 Outlook
According to ACT Research, 2023 North American Class 8 truck production levels are expected to be at 305,000 units and Class 5-7 production are expected to be at 242,000 units. Estimates from FTR for 2023 are 322,000 units, slightly higher than ACT Research for Class 8 truck builds. The 2022 actual Class 8 truck builds according to the ACT Research was 315,128 units.
According to Interact Analysis, the Global Off-Highway vehicle market is expected to increase approximately 4% to 6.2 million units in 2023 from 5.9 million units in 2022. Beyond 2023, the Off-Highway vehicle market is expected to grow in the 4-5% range. We expect our legacy business growth rates to be in line with this outlook.
Industry forecasts are expecting a 4% growth in 2023 for North American aftermarket truck parts. Compounded annual growth of 4.1% is forecasted for 2023-2027.
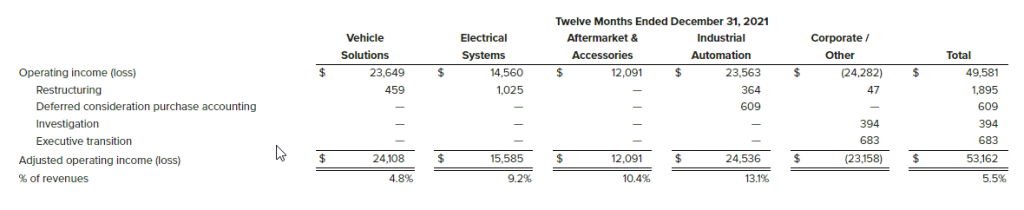
GAAP to Non-GAAP Reconciliation
A reconciliation of GAAP to non-GAAP financial measures referenced in this release is included as Appendix A to this release.
Conference Call
A conference call to discuss this press release is scheduled for Tuesday, March 7, 2023, at 10:00 a.m. ET. Management intends to reference the Q4 2022 Earnings Call Presentation during the conference call. To participate, dial (888) 396-8049 using conference code 33489158. International participants dial (416) 764-8646 using conference code 33489158.
This call is being webcast and can be accessed through the “Investors” section of CVG’s website at www.cvgrp.com, where it will be archived for one year.
A telephonic replay of the conference call will be available for a period of two weeks following the call. To access the replay, dial (877) 674-7070 using access code 489158 and international callers can dial (416) 764-8692 using access code 489158.
Company Contact
Andy Cheung Chief Financial Officer CVG IR@cvgrp.com
At CVG we deliver real solutions to complex design, engineering and manufacturing problems while creating positive change for our customers, industries, and communities we serve. Information about the Company and its products is available on the internet at www.cvgrp.com.
Forward-Looking Statements
This press release contains forward-looking statements that are subject to risks and uncertainties. These statements often include words such as “believe”, “anticipate”, “plan”, “expect”, “intend”, “will”, “should”, “could”, “would”, “project”, “continue”, “likely”, and similar expressions. In particular, this press release may contain forward-looking statements about the Company’s expectations for future periods with respect to its plans to improve financial results, the future of the Company’s end markets, including the short-term and long-term impact of the COVID-19 pandemic on our business and the global supply chain, changes in the Class 8 and Class 5-7 North America truck build rates, performance of the global construction equipment business, the Company’s prospects in the wire harness, industrial automation and electric vehicle markets, the Company’s initiatives to address customer needs, organic growth, the Company’s strategic plans and plans to focus on certain segments, competition faced by the Company, volatility in and disruption to the global economic environment, including inflation and labor shortages and the Company’s financial position or other financial information. These statements are based on certain assumptions that the Company has made in light of its experience as well as its perspective on historical trends, current conditions, expected future developments and other factors it believes are appropriate under the circumstances. Actual results may differ materially from the anticipated results because of certain risks and uncertainties, including those included in the Company’s filings with the SEC. There can be no assurance that statements made in this press release relating to future events will be achieved. The Company undertakes no obligation to update or revise forward-looking statements to reflect changed assumptions, the occurrence of unanticipated events or changes to future operating results over time. All subsequent written and oral forward-looking statements attributable to the Company or persons acting on behalf of the Company are expressly qualified in their entirety by such cautionary statements.
Use of Non-GAAP Measures
This earnings release contains financial measures that are not calculated in accordance with U.S. generally accepted accounting principles (“GAAP”). In general, the non-GAAP measures exclude items that (i) management believes reflect the Company’s multi-year corporate activities; or (ii) relate to activities or actions that may have occurred over multiple or in prior periods without predictable trends. Management uses these non-GAAP financial measures internally to evaluate the Company’s performance, engage in financial and operational planning and to determine incentive compensation.
Management provides these non-GAAP financial measures to investors as supplemental metrics to assist readers in assessing the effects of items and events on the Company’s financial and operating results and in comparing the Company’s performance to that of its competitors and to comparable reporting periods. The non-GAAP financial measures used by the Company may be calculated differently from, and therefore may not be comparable to, similarly titled measures used by other companies.
The non-GAAP financial measures disclosed by the Company should not be considered a substitute for, or superior to, financial measures calculated in accordance with GAAP. The financial results calculated in accordance with GAAP and reconciliations to those financial statements set forth above should be carefully evaluated.
Money Supply Numbers Show the Fed is Making Headway
Money Supply, as reported by the Federal Reserve, fell by the largest amount ever recorded. This significant year-on-year drop shows the Fed’s tight monetary policy at work. However, despite the dramatic decline of cash available to consumers, the pace of increase that led up to the twelve-month period was even more dramatic. This indicates the Fed is not even close to finished draining liquidity from the economy, which serves to push up the cost of money (interest rates).
What is M2, how does it impact spending, and how much lower can the money supply go to reach “normal”? Let’s explore.
The M2 Report
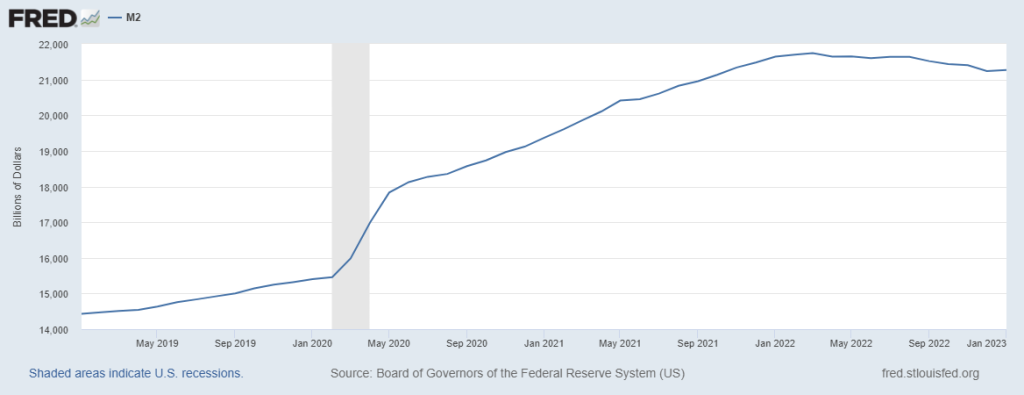
Data for January, released on February 28th, showed a negative growth rate of 1.7% versus a year ago. This is both the biggest yearly decline and also the first time ever it has contracted in consecutive months. The monthly rate of change has been falling consistently since mid-2021. As indicated on the chart below, it follows a historic peak of 27% growth in February 2021.
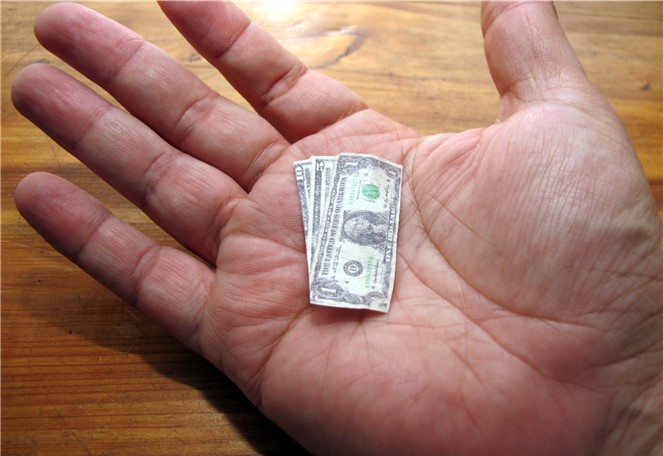
Money Supply is a measure of household liquidity, it includes household cash on hand, savings and checking deposits, and money market mutual funds. The level had been growing slowly, keeping pace with low inflation until 2020. In response to pandemic-related economic risks, the economy was then flooded with cash by the Fed. Like any other oversupply, this oversupply causes money’s value to decline – a recipe for inflation.
For almost a year, the Fed has been draining liquidity from the US economy. This includes the well-publicized retargeting of overnight bank lending rates which are accomplished by contracting the aggregate amount of cash banks hold in reserves. Draining liquidity also includes quantitative tightening by the Fed, not repurchasing maturing securities.
The Fed’s tightening is having an impact on savings and cash available to households. Although the consumer is still spending, the decline in savings makes the spending pace unsustainable. Unrelated to M2, but as important, is that consumer borrowing is up, and this, too, can not stay on an upward trajectory forever. The Fed’s actions have a lag time, but it is becoming obvious that there will come a point when consumers will need to change their spending habits downward. This is how inflation is expected to be reeled in, but it isn’t certain whether it is being reeled in at a pace where the Fed can succeed at reaching the 2% inflation rate goal – particularly in light of the last inflation number actually being higher than the previous month.
Where We Are Now
Although M2 growth rates declined at a pace shattering all records, levels are still abnormally high. To put numbers on it, Money Supply remains 39% higher than it was before the Covid-19 pandemic, just three years ago. In other words, the amount of liquidity in the economy is still significant, and too much money chasing too few goods and services lead to rising prices.
The current M2 of $21.27 trillion is nearly $6 trillion higher than the pre-pandemic level. At this point, money in the economy has surpassed real gross domestic product levels, a momentous shift that first happened in 2020 when the Fed flooded the economy with cash as the pandemic hit.
All of this indicates the Fed is actually being patient despite the dramatic tightening over the past year. It also makes it clear that they are not done mopping up the Covid-19 monetary mess. And investors shouldn’t be surprised to see their resolve continue until balances are more in-line with moderate inflation rates.
Take Away
The still elevated M2, despite its record yearly decline, is feeding inflation. The Fed is making headway removing fuel to the inflation fire.
However, consumers that historically have continued to spend at near unchanged levels, even when their disposable income no longer supports it, do eventually adjust. When this adjustment occurs, economic activity will slow. That’s when the Fed will be on the path to winning its inflation fight. Then perhaps we may actually get a pivot in monetary policy.
ACCO Brands Corporation is one of the world’s largest designers, marketers and manufacturers of branded academic, consumer and business products. Our widely recognized brands include AT-A-GLANCE®, Esselte®, Five Star®, GBC®, Kensington®, Leitz®, Mead®, PowerA®, Quartet®, Rapid®, Rexel®, Swingline®, Tilibra®, and many others. Our products are sold in more than 100 countries around the world. More information about ACCO Brands, the Home of Great Brands Built by Great People, can be found at www.accobrands.com.
Joe Gomes, Managing Director – Generalist Analyst, Noble Capital Markets, Inc.
Joshua Zoepfel, Research Associate, Noble Capital Markets, Inc.
Refer to the full report for the price target, fundamental analysis, and rating.
Challenging Current Environment, But Future Remains Bright. In spite of a challenging 2022, ACCO delivered 1% comparable sales growth in 2022 as the Company continued to execute its strategic transformation, including expanding product categories, broadening geographic reach, and bringing innovative new consumer-centric products to market. This enabled ACCO to achieve market share gains with many of its brands.
Taking Action. For 2023, management’s top priority is to restore the margin profile through incremental pricing actions implemented in January of 2023, the restructuring initiatives undertaken during the fourth quarter of 2022, and the additional productivity programs that will be implemented in 2023. We expect these actions will drive margin expansion and profit growth for the full year of 2023.
Equity Research is available at no cost to Registered users of Channelchek. Not a Member? Click ‘Join’ to join the Channelchek Community. There is no cost to register, and we never collect credit card information.
This Company Sponsored Research is provided by Noble Capital Markets, Inc., a FINRA and S.E.C. registered broker-dealer (B/D).
*Analyst certification and important disclosures included in the full report. NOTE: investment decisions should not be based upon the content of this research summary. Proper due diligence is required before making any investment decision.
FAT Brands (NASDAQ: FAT) is a leading global franchising company that strategically acquires, markets, and develops fast casual, quick-service, casual dining, and polished casual dining concepts around the world. The Company currently owns 17 restaurant brands: Round Table Pizza, Fatburger, Marble Slab Creamery, Johnny Rockets, Fazoli’s, Twin Peaks, Great American Cookies, Hot Dog on a Stick, Buffalo’s Cafe & Express, Hurricane Grill & Wings, Pretzelmaker, Elevation Burger, Native Grill & Wings, Yalla Mediterranean and Ponderosa and Bonanza Steakhouses, and franchises and owns over 2,300 units worldwide. For more information on FAT Brands, please visit www.fatbrands.com.
Joe Gomes, Managing Director – Generalist Analyst, Noble Capital Markets, Inc.
Joshua Zoepfel, Research Associate, Noble Capital Markets, Inc.
Refer to the full report for the price target, fundamental analysis, and rating.
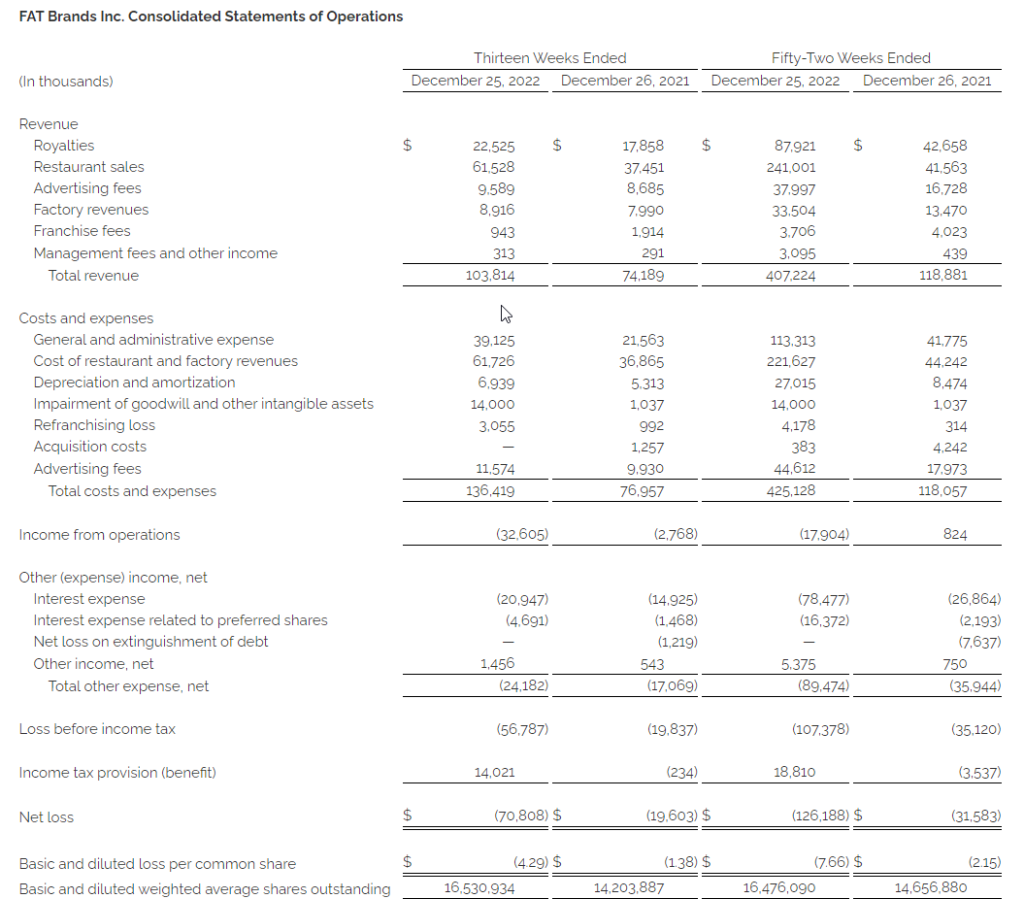
4Q22 Results. FAT Brands reported 4Q22 revenue of $103.8 million, up 39.9% y-o-y from $74.2 million in the year ago quarter. The increased revenue reflects the 2021 acquisitions and ongoing recovery from COVID impacts as SSS was up 2.7%. FAT reported adjusted EBITDA of $19.6 million in the quarter, down from $24.6 million in 3Q22. Net loss for the quarter was $70.8 million, or a loss of $4.29 per share, compared to a net loss of $19.6 million, or a loss of $1.38 per share, last year. We had projected revenue of $104.8 million and a net loss of $16.5 million, or a loss of $0.99 per share.
One-Time Items Impact. The quarter’s results were impacted by a number of one-time non-cash charges, including a $16.1 million non-cash reserve on employee retention credits, a $14 million non-cash trademark impairment charge, and a $20.4 million valuation allowance.
Equity Research is available at no cost to Registered users of Channelchek. Not a Member? Click ‘Join’ to join the Channelchek Community. There is no cost to register, and we never collect credit card information.
This Company Sponsored Research is provided by Noble Capital Markets, Inc., a FINRA and S.E.C. registered broker-dealer (B/D).
*Analyst certification and important disclosures included in the full report. NOTE: investment decisions should not be based upon the content of this research summary. Proper due diligence is required before making any investment decision.
ACCO Brands Corporation is one of the world’s largest designers, marketers and manufacturers of branded academic, consumer and business products. Our widely recognized brands include AT-A-GLANCE®, Esselte®, Five Star®, GBC®, Kensington®, Leitz®, Mead®, PowerA®, Quartet®, Rapid®, Rexel®, Swingline®, Tilibra®, and many others. Our products are sold in more than 100 countries around the world. More information about ACCO Brands, the Home of Great Brands Built by Great People, can be found at www.accobrands.com.
Joe Gomes, Managing Director – Generalist Analyst, Noble Capital Markets, Inc.
Joshua Zoepfel, Research Associate, Noble Capital Markets, Inc.
Refer to the full report for the price target, fundamental analysis, and rating.
4Q Results. ACCO Brands posted net sales of $499.4 million, a decrease of 12.4% from the prior year’s $570.3 million. Operating income for the quarter was at $35.6 million versus $63.6 million the prior year due to lower sales volumes and higher inflation. Net income was reported at $18.8 million, or $0.20 per diluted share, compared to $53.5 million, or $0.55/sh, last year. We estimated revenue of $510.0 million, operating income of $47 million, net income of $26 million, and EPS of $0.28.
Revenue Segments. North America saw a decrease in sales to $225.7 million versus $271.0 million the prior year with operating income of $8.9 million versus $34.2 million a year ago. EMEA sales were $156.0 million versus $187.9 million the year prior, with operating income of $12.7 million versus $21.6 million. Lastly, International had sales of $117.7 million, an increase from last year’s $111.4 million, with operating income of $22.7 million, an increase over last year’s $20.9 million.
Equity Research is available at no cost to Registered users of Channelchek. Not a Member? Click ‘Join’ to join the Channelchek Community. There is no cost to register, and we never collect credit card information.
This Company Sponsored Research is provided by Noble Capital Markets, Inc., a FINRA and S.E.C. registered broker-dealer (B/D).
*Analyst certification and important disclosures included in the full report. NOTE: investment decisions should not be based upon the content of this research summary. Proper due diligence is required before making any investment decision.
LOS ANGELES, Feb. 22, 2023 (GLOBE NEWSWIRE) — FAT (Fresh. Authentic. Tasty.) Brands Inc. (NASDAQ: FAT) (“FAT Brands” or the “Company”) today reported fourth quarter and full year 2022 financial results for the fiscal year ended December 25, 2022.
Andy Wiederhorn, President and CEO of FAT Brands, commented, “The fourth quarter marked yet another strong performance for FAT Brands, as evidenced by our robust unit development and profitable revenue growth. After a very active acquisition strategy in 2021, I am particularly pleased with the momentum of our organic growth strategy during 2022.”
“With over 140 store openings during 2022, we achieved a new milestone for FAT Brands, including 44 that opened in the fourth quarter. We plan to continue this robust unit growth with between 150 and 175 units slated to open in 2023. We are seeing strong new franchisee activity as well as continued demand from existing franchise partners to develop other brands within our portfolio, which is very encouraging as we look beyond our current unit development pipeline of over 1,000 locations representing 60% EBITDA growth over the next several years.”
“We are extremely impressed with how our 2021 acquisitions have seamlessly fit into our portfolio and the demand we are experiencing for them from our franchisee base. In addition to our organic growth momentum, we will lean into the expansion of our high-growth brands, particularly our sports lodge category, and continue to expand our factory business.”
“We also continue to work on reducing our cost of capital and are pursuing strategies to significantly reduce our leverage ratio over the next 24 to 36 months.”
Fiscal FourthQuarter 2022Highlights
Total revenue improved 39.9% to $103.8 million compared to $74.2 million in the fourth quarter of 2021
System-wide sales growth of 22.1% in the fourth quarter of 2022 compared to the prior year quarter
Year-to-date system-wide same-store sales growth of 2.7% in the fourth quarter of 2022 compared to the prior year
44 new store openings during the fourth quarter of 2022 and over 140 openings during the year
Net loss of $70.8 million, or $4.29 per diluted share, compared to $19.6 million, or $1.38 per diluted share, in the fourth quarter of 2021
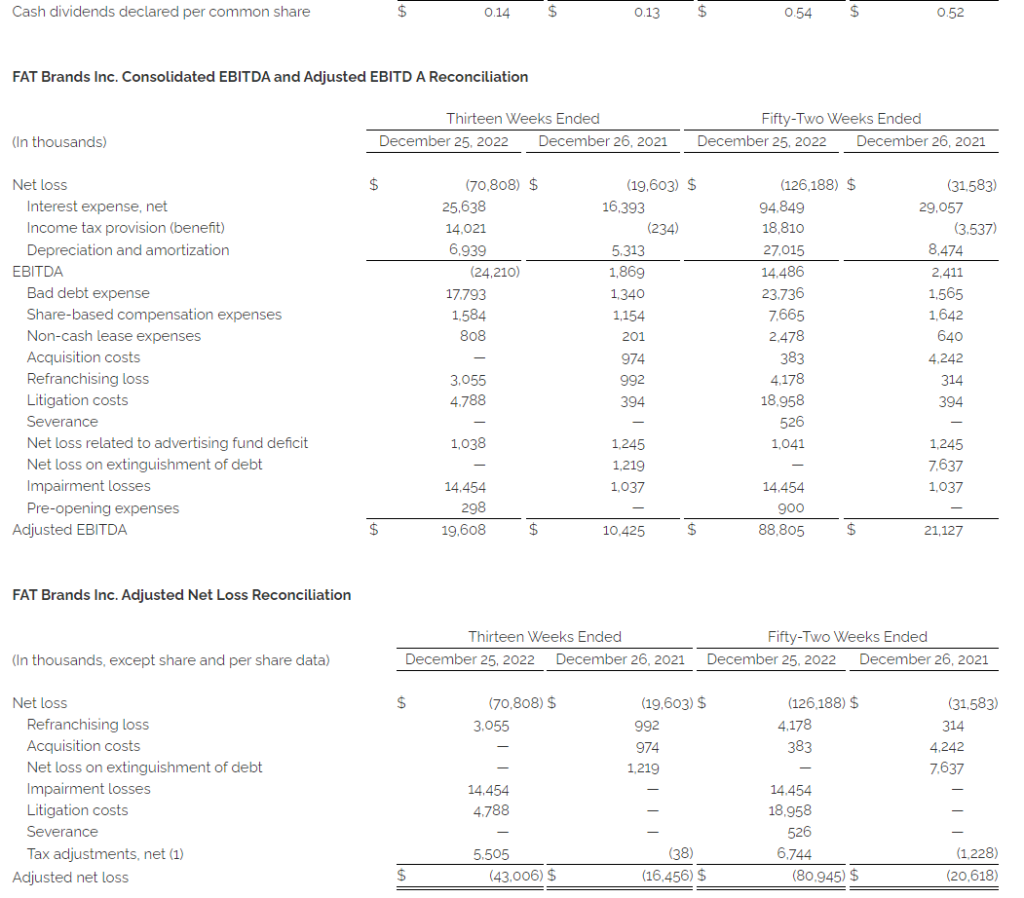
Adjusted EBITDA(1) of $19.6 million compared to $10.4 million in the fourth quarter of 2021
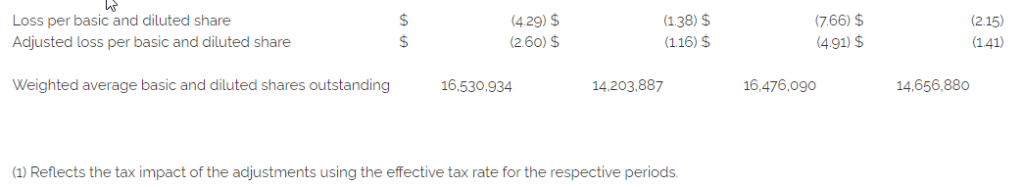
Adjusted net loss(1) of $43.0 million, or $2.60 per diluted share, compared to $16.5 million, or $1.16 per diluted share, in the fourth quarter of 2021
Fiscal Year 2022 Highlights
Total revenue increased 242.5% to $407.2 million compared to $118.9 million in 2021
System-wide sales growth of 108.0% compared to 2021
Year-to-date system-wide same-store sales growth of 6.0% in 2022 compared to 2021
Over 140 new store openings during 2022
Net loss of $126.2 million, or $7.66 per diluted share, compared to $31.6 million, or $2.15 per diluted share, in 2021
Adjusted EBITDA(1) of $88.8 million compared to $21.1 million 2021
Adjusted net loss(1) of $80.9 million, or $4.91 per diluted share, compared to $20.6 million, or $1.41 per diluted share, in 2021
(1) EBITDA, Adjusted EBITDA and adjusted net loss are non-GAAP measures defined below, under “Non-GAAP Measures”. Reconciliation of GAAP net loss to EBITDA, adjusted EBITDA and adjusted net loss are included in the accompanying financial tables.
Summary of Fourth Quarter 2022 Financial Results
Total revenue increased $29.6 million, or 39.9%, in the fourth quarter of 2022, to $103.8 million compared to $74.2 million in the same period of 2021. The increase reflects revenue from the acquisition of Twin Peaks in October 2021, the acquisitions of Fazoli’s and Native Grill & Wings in December 2021 (collectively, the “2021 Acquisitions”) and the continuing recovery from the negative effects of the COVID-19 pandemic on royalties from restaurant sales.
Costs and expenses increased $59.5 million, or 77.3%, in the fourth quarter of 2022 to $136.4 million compared to $77.0 million in the same period in the prior year, primarily due to the 2021 Acquisitions.
General and administrative expense increased $17.6 million, or 81.4%, in the fourth quarter of 2022 compared to the same period in the prior year, primarily due to the 2021 Acquisitions, increased compensation costs, professional fees related to pending litigation and government investigations, and travel, reflecting the significant expansion of the organization.
Cost of restaurant and factory revenues totaled $61.7 million in the fourth quarter of 2022 and was related to the operations of the company-owned restaurant locations and our dough factory associated with the 2021 Acquisitions.
Depreciation and amortization increased $1.6 million, or 30.6% in the fourth quarter of 2022 compared to the same period in the prior year, primarily due to depreciation of company-owned restaurant property and equipment and amortizing intangible assets related to the 2021 Acquisitions.
Refranchising losses in the fourth quarter of 2022 were $3.1 million and were comprised of restaurant costs and expenses, net of food sales. Refranchising losses in the fourth quarter of 2021 were $1.0 million and were comprised of $2.1 million restaurant operating costs, net of food sales, partially offset by $1.1 million in net gains related to refranchised restaurants.
Advertising expenses increased $1.6 million in the fourth quarter of 2022 compared to the prior year period. These expenses vary in relation to advertising revenues and reflect advertising expenses related to the 2021 Acquisitions and the increase in customer activity as the recovery from COVID continues.
Total other expense, net for the fourth quarters of 2022 and 2021 was $24.2 million and $17.1 million, respectively, primarily comprised of net interest expense of $25.6 million and $16.4 million, respectively.
Adjusted net loss was $43.0 million, or $2.60 per diluted share, in the fourth quarter of 2022 compared to $16.5 million, or $1.16 per diluted share, in the fourth quarter of 2021.
Key Financial Definitions
New store openings – The number of new store openings reflects the number of stores opened during a particular reporting period. The total number of new stores per reporting period and the timing of stores openings has, and will continue to have, an impact on our results.
Same-store sales growth – Same-store sales growth reflects the change in year-over-year sales for the comparable store base, which we define as the number of stores open and in the FAT Brands system for at least one full fiscal year. For stores that were temporarily closed, sales in the current and prior period are adjusted accordingly. Given our focused marketing efforts and public excitement surrounding each opening, new stores often experience an initial start-up period with considerably higher than average sales volumes, which subsequently decrease to stabilized levels after three to six months. Additionally, when we acquire a brand, it may take several months to integrate fully each location of said brand into the FAT Brands platform. Thus, we do not include stores in the comparable base until they have been open and in the FAT Brands system for at least one full fiscal year. For 2022, the comparable store base does not include concepts acquired during the fourth quarter of 2021.
System-wide sales growth – System wide sales growth reflects the percentage change in sales in any given fiscal period compared to the prior fiscal period for all stores in that brand only when the brand is owned by FAT Brands. Because of acquisitions, new store openings and store closures, the stores open throughout both fiscal periods being compared may be different from period to period.
Conference Call and Webcast
FAT Brands will host a conference call and webcast to discuss its fiscal fourth quarter 2022 financial results today at 5:00 PM ET. Hosting the conference call and webcast will be Andy Wiederhorn, President and Chief Executive Officer, and Ken Kuick, Chief Financial Officer.
The conference call can be accessed live over the phone by dialing 1-877-704-4453 from the U.S. or 1-201-389-0920 internationally. A replay will be available after the call until Wednesday, March 1, 2023, and can be accessed by dialing 1-844-512-2921 from the U.S. or 1-412-317-6671 internationally. The passcode is 13735781. The webcast will be available at www.fatbrands.com under the “Investors” section and will be archived on the site shortly after the call has concluded.
About FAT (Fresh. Authentic. Tasty.) Brands
FAT Brands (NASDAQ: FAT) is a leading global franchising company that strategically acquires, markets, and develops fast casual, quick-service, casual dining, and polished casual dining concepts around the world. The Company currently owns 17 restaurant brands: Round Table Pizza, Fatburger, Marble Slab Creamery, Johnny Rockets, Fazoli’s, Twin Peaks, Great American Cookies, Hot Dog on a Stick, Buffalo’s Cafe & Express, Hurricane Grill & Wings, Pretzelmaker, Elevation Burger, Native Grill & Wings, Yalla Mediterranean and Ponderosa and Bonanza Steakhouses and franchises and owns approximately 2,300 units worldwide. For more information, please visit www.fatbrands.com.
Forward-Looking Statements
This press release contains forward-looking statements within the meaning of the Private Securities Litigation Reform Act of 1995, including statements relating to the future financial and operating results of the Company, estimates of future EBITDA, the timing and performance of new store openings, future reductions in cost of capital and leverage ratio, our ability to conduct future accretive acquisitions, our pipeline of new store locations, and the recovery of our business from the COVID-19 pandemic. Forward-looking statements generally use words such as “expect,” “foresee,” “anticipate,” “believe,” “project,” “should,” “estimate,” “will,” “plans,” “forecast,” and similar expressions, and reflect our expectations concerning the future. Forward-looking statements are subject to significant business, economic and competitive risks, uncertainties and contingencies, many of which are difficult to predict and beyond our control, which could cause our actual results to differ materially from the results expressed or implied in such forward-looking statements. We refer you to the documents that we file from time to time with the Securities and Exchange Commission, such as our reports on Form 10-K, Form 10-Q and Form 8-K, for a discussion of these and other risks and uncertainties that could cause our actual results to differ materially from our current expectations and from the forward-looking statements contained in this press release. We undertake no obligation to update any forward-looking statements to reflect events or circumstances occurring after the date of this press release.
Non-GAAP Measures (Unaudited)
This press release includes the non-GAAP financial measures of EBITDA, adjusted EBITDA and adjusted net loss.
EBITDA is defined as earnings before interest, taxes, and depreciation and amortization. We use the term EBITDA, as opposed to income from operations, as it is widely used by analysts, investors, and other interested parties to evaluate companies in our industry. We believe that EBITDA is an appropriate measure of operating performance because it eliminates the impact of expenses that do not relate to business performance. EBITDA is not a measure of our financial performance or liquidity that is determined in accordance with generally accepted accounting principles (“GAAP”), and should not be considered as an alternative to net income (loss) as a measure of financial performance or cash flows from operations as measures of liquidity, or any other performance measure derived in accordance with GAAP.
Adjusted EBITDA is defined as EBITDA (as defined above), excluding expenses related to acquisitions, refranchising gain or losses, impairment charges, and certain non-recurring or non-cash items that the Company does not believe directly reflect its core operations and may not be indicative of the Company’s recurring business operations.
Adjusted net loss is a supplemental measure of financial performance that is not required by or presented in accordance with GAAP. Adjusted net loss is defined as net loss plus the impact of adjustments and the tax effects of such adjustments. Adjusted net loss is presented because we believe it helps convey supplemental information to investors regarding our performance, excluding the impact of special items that affect the comparability of results in past quarters to expected results in future quarters. Adjusted net loss as presented may not be comparable to other similarly titled measures of other companies, and our presentation of adjusted net loss should not be construed as an inference that our future results will be unaffected by excluded or unusual items. Our management uses this non-GAAP financial measure to analyze changes in our underlying business from quarter to quarter based on comparable financial results.
Reconciliations of net loss presented in accordance with GAAP to EBITDA, adjusted EBITDA and adjusted net loss are set forth in the tables below.
NEW ALBANY, Ohio, Feb. 22, 2023 (GLOBE NEWSWIRE) — CVG (NASDAQ: CVGI) will hold its quarterly conference call on Tuesday, March 7, 2023, at 10:00 a.m. ET, to discuss fourth quarter and full year 2022 financial results. CVG will issue a press release and presentation prior to the conference call.
Toll-free participants dial (888) 396-8049 using conference code 33489158. International participants dial (416) 764-8646 using conference code 33489158. This call is being webcast and can be accessed through the “Investors” section of CVG’s website at ir.cvgrp.com where it will be archived for one year.
A telephonic replay of the conference call will be available until March 21, 2023. To access the replay, toll-free callers can dial (877) 674-7070 using access code 489158.
About CVG
At CVG, we deliver real solutions to complex design, engineering and manufacturing problems while creating positive change for our customers, industries, and communities we serve. Information about the Company and its products is available on the internet at www.cvgrp.com.
Investor Relations Contact: Ross Collins or Stephen Poe Alpha IR Group CVGI@alpha-ir.com