LOS ANGELES, July 13, 2023 (GLOBE NEWSWIRE) — FAT (Fresh. Authentic. Tasty.) Brands Inc. (NASDAQ: FAT), a leading global franchising company and parent company of iconic brands including Round Table Pizza, Fatburger, Marble Slab Creamery, Johnny Rockets, Twin Peaks, Fazoli’s and 11 other restaurant concepts, announced today that its Board of Directors has declared the Company’s fiscal 2023 third quarter cash dividend of $0.14 per share on each outstanding share of Class A common stock and Class B common stock. The dividend is payable on September 1, 2023 to holders of record of Class A common stock and Class B common stock as of the close of business on August 15, 2023.
The declaration and payment of future dividends, as well as the amounts thereof, are subject to the discretion of the Company’s Board of Directors. The amount and size of any future dividends will depend upon the Company’s future results of operations, financial condition, capital levels, cash requirements and other factors. There can be no assurance that the Company will declare and pay dividends in future periods.
About FAT (Fresh. Authentic. Tasty.) Brands
FAT Brands Inc. (NASDAQ: FAT) (the Company) is a leading global franchising company that strategically acquires, markets and develops quick service, fast casual and casual dining restaurant concepts around the world. The Company currently owns seventeen restaurant brands: Round Table Pizza, Fatburger, Marble Slab Creamery, Johnny Rockets, Fazoli’s, Twin Peaks, Great American Cookies, Hot Dog on a Stick, Buffalo’s Cafe & Express, Hurricane Grill & Wings, Pretzelmaker, Elevation Burger, Native Grill & Wings, Yalla Mediterranean, Ponderosa and Bonanza Steakhouses and franchises and owns over 2,300 units worldwide. For more information, please visit www.fatbrands.com.
Forward Looking Statements This press release contains forward-looking statements within the meaning of the Private Securities Litigation Reform Act of 1995. Forward-looking statements are subject to significant business, economic and competitive risks, uncertainties and contingencies including, but not limited to, uncertainties surrounding the severity, duration and effects of the COVID-19 pandemic, many of which are difficult to predict and beyond our control, which could cause our actual results to differ materially from the results expressed or implied in such forward-looking statements. We refer you to the documents we file from time to time with the Securities and Exchange Commission, such as our reports on Form 10-K, Form 10-Q and Form 8-K, for a discussion of these and other risks, uncertainties and contingencies. We undertake no obligation to update any forward-looking statement to reflect events or circumstances occurring after the date of this press release.
Ice Cream Franchise Scoops Up2023 10Best Readers’ Choice Award
LOS ANGELES, July 11, 2023 (GLOBE NEWSWIRE) — Marble Slab Creamery, the imaginative small-batch ice cream franchise that never fails to dream up the ultimate flavor combinations, is pleased to announce its recent recognition as one of the top five dessert/treat chains in the country, as named by USA Today! Coming in at number four, Marble Slab came away with a top spot after being nominated by an expert panel, then voted on by the public.
For 40 years, Marble Slab Creamery has been an innovator in the ice cream space, creating the frozen slab technique and offering homemade, small-batch Ice Cream with always free Mix-Ins, Shakes in a variety of flavors, and Ice Cream Cakes. The leading chain boasts over 375 locations and continues to expand across the globe, most notably with its cookie sister brand, Great American Cookies, providing guests with the ultimate treat spot.
“At Marble Slab, we’re incredibly proud of the original technique and innovation that we continue to bring to the table, year after year,” said Allison Lauenstein, President at Marble Slab Creamery. “As we celebrate our 40th anniversary this month, we couldn’t be more humbled to be recognized by the public for the hard work we’ve put into each Ice Cream, Shake, and Cake we dream up.”
FAT Brands (NASDAQ: FAT) is a leading global franchising company that strategically acquires, markets and develops fast casual, casual and polished casual dining restaurant concepts around the world. The Company currently owns 17 restaurant brands: Round Table Pizza, Fatburger, Marble Slab Creamery, Johnny Rockets, Fazoli’s, Twin Peaks, Great American Cookies, Hot Dog on a Stick, Buffalo’s Cafe & Express, Hurricane Grill & Wings, Native Grill & Wings, Pretzelmaker, Elevation Burger, Yalla Mediterranean and Ponderosa and Bonanza Steakhouses, and franchises and owns over 2,300 units worldwide. For more information on FAT Brands, please visit http://www.fatbrands.com.
About Marble Slab Creamery
Since dreaming up the frozen slab technique and serving fresh homemade, small-batch Ice Cream in-store since 1983, Marble Slab Creamery has always known how to dream big. We sprinkle our customers with imagination and promise to inspire with infinite Ice Cream possibilities to feed your curiosity and capture cravings. With our always free mix-in philosophy, delicious Ice Cream and Shakes in a variety of flavors, hand-rolled waffle cones, and Ice Cream Cakes, imagination has no limits. Today, Marble Slab Creamery is enjoyed by consumers across the globe with locations in Bahrain, Bangladesh, Canada, Kuwait, Pakistan, Saudi Arabia, Guam, Puerto Rico, and the United States. For more information, visit www.marbleslab.com.
Bassett Furniture Industries, Incorporated manufactures, markets, and retails home furnishings in the United States. The company operates in three segments: Wholesale, Retail, and Logistical Services. It is involved in the design, manufacture, sourcing, sale, and distribution of furniture products to a network of company-owned and licensee-owned Bassett Home Furnishings (BHF) retail stores, as well as independent furniture retailers; and wood and upholstery operations. As of September 16, 2017, the company operated a network of 91 company-and licensee-owned stores. It also provides shipping, delivery, and warehousing services to customers in the furniture industry. In addition, the company owns and leases retail store properties. It also distributes its products through other multi-line furniture stores, Bassett galleries or design centers, specialty stores, and mass merchants. Bassett Furniture Industries was founded in 1902 and is based in Bassett, Virginia.
Joe Gomes, Managing Director, Equity Research Analyst, Generalist , Noble Capital Markets, Inc.
Joshua Zoepfel, Research Associate, Noble Capital Markets, Inc.
Refer to the full report for the price target, fundamental analysis, and rating.
Management Call. We had an opportunity to speak with Bassett management at the end of last week. While the Company continues to work through COVID-related headwinds, such as excess and higher cost certain inventory, management remains optimistic regarding the new stores opening in 2H23, as well as the launch of the new website. All of which should help drive top line going forward, in our view.
Environment. The longer-term outlook for furniture sales remains positive, in our view. The Millennial cohort is entering its prime household formation and home buying phase, which augurs well for future home and furniture demand. Consumer confidence is improving, while expectations for employment and future interest rates remain positive for the industry, in our view. Bassett is well positioned to capture additional demand for furniture from consumers in the coming years.
Equity Research is available at no cost to Registered users of Channelchek. Not a Member? Click ‘Join’ to join the Channelchek Community. There is no cost to register, and we never collect credit card information.
This Company Sponsored Research is provided by Noble Capital Markets, Inc., a FINRA and S.E.C. registered broker-dealer (B/D).
*Analyst certification and important disclosures included in the full report. NOTE: investment decisions should not be based upon the content of this research summary. Proper due diligence is required before making any investment decision.
Bassett Furniture Industries, Incorporated manufactures, markets, and retails home furnishings in the United States. The company operates in three segments: Wholesale, Retail, and Logistical Services. It is involved in the design, manufacture, sourcing, sale, and distribution of furniture products to a network of company-owned and licensee-owned Bassett Home Furnishings (BHF) retail stores, as well as independent furniture retailers; and wood and upholstery operations. As of September 16, 2017, the company operated a network of 91 company-and licensee-owned stores. It also provides shipping, delivery, and warehousing services to customers in the furniture industry. In addition, the company owns and leases retail store properties. It also distributes its products through other multi-line furniture stores, Bassett galleries or design centers, specialty stores, and mass merchants. Bassett Furniture Industries was founded in 1902 and is based in Bassett, Virginia.
Joe Gomes, Managing Director, Equity Research Analyst, Generalist , Noble Capital Markets, Inc.
Joshua Zoepfel, Research Associate, Noble Capital Markets, Inc.
Refer to the full report for the price target, fundamental analysis, and rating.
Mixed 2Q Results. Bassett missed our top line projections, with revenue of $100.5 million compared to our estimate of $102 million and down 22% y-o-y from $128.7 million. Operating income for the quarter was $2.7 million compared to $11.0 million last year. The Company beat our bottom line projection, however, with net income reported at $2.1 million compared to our estimate of $0.3 million, but down from last year’s $47.1 million. Excluding $39.4 million from discontinued operations, however, net income for last year would be $7.7 million.
Still a Challenging Environment. Higher cost inventory and soft demand is continuing to plague the environment for Bassett, as wholesale orders were down 18% y-o-y and written orders declined 17%. The Company did a price cut strategy on its Club Level motion inventories at the end of the first quarter to move inventory and are not expecting any further cuts.
Equity Research is available at no cost to Registered users of Channelchek. Not a Member? Click ‘Join’ to join the Channelchek Community. There is no cost to register, and we never collect credit card information.
This Company Sponsored Research is provided by Noble Capital Markets, Inc., a FINRA and S.E.C. registered broker-dealer (B/D).
*Analyst certification and important disclosures included in the full report. NOTE: investment decisions should not be based upon the content of this research summary. Proper due diligence is required before making any investment decision.
For more than 45 years, 1-800-Flowers.com has offered truly original floral arrangements, plants and unique gifts to celebrate birthdays, anniversaries, everyday occasions, and seasonal holidays, and to deliver comfort during times of grief. Backed by a caring team obsessed with service, 1-800-Flowers.com provides customers thoughtful ways to express themselves and connect with the most important people in their lives. 1-800-Flowers.com is part of the 1-800-FLOWERS.COM, Inc. family of brands. Shares in 1-800-FLOWERS.COM, Inc. are traded on the NASDAQ Global Select Market, ticker symbol: FLWS.
Michael Kupinski, Director of Research, Equity Research Analyst, Digital, Media & Technology , Noble Capital Markets, Inc.
Jacob Mutchler, Research Associate, Noble Capital Markets, Inc.
Refer to the full report for the price target, fundamental analysis, and rating.
Enters into a new credit agreement. The amended credit agreement increases the outstanding term loan from $150 million to $200 million, and reduces its revolving credit facility from $250 million to $225 million. The agreement extends the maturities of both the revolving credit facility and term loan until June 27, 2028, which we view favorably.
Terms of the agreement. The conditions of the term loan stipulate that once optional and mandatory prepayments of the loan are made, the funds may not be reborrowed. Notably, the amended revolving credit facility is subject to an aggregate seasonal borrowing limit of $125 million from January 1 to August 1. However, the revolving credit facility allows for prepaid funds to be reborrowed. The term loan and revolving credit facility mature on June 27, 2028.
Equity Research is available at no cost to Registered users of Channelchek. Not a Member? Click ‘Join’ to join the Channelchek Community. There is no cost to register, and we never collect credit card information.
This Company Sponsored Research is provided by Noble Capital Markets, Inc., a FINRA and S.E.C. registered broker-dealer (B/D).
*Analyst certification and important disclosures included in the full report. NOTE: investment decisions should not be based upon the content of this research summary. Proper due diligence is required before making any investment decision.
JERICHO, N.Y.–(BUSINESS WIRE)– 1-800-FLOWERS.COM, Inc. (NASDAQ: FLWS), a leading provider of gifts designed to help inspire customers to give more, connect more, and build more and better relationships, today announced CEO Christopher McCann will be stepping down for personal health reasons, effective July 3, 2023. To ensure continuity going forward, Jim McCann will resume his role as CEO and remain Chairman. Jim McCann served as CEO for the organization from inception through 2016. Christopher McCann will remain on the Company’s Board of Directors and continue to serve on the board and as an officer of various subsidiaries of the Company as he now serves.
“I want to thank Chris for all of his contributions to the company over the many years, as he played an integral role in overseeing our rapid growth and enhancing our market-leading position in the industry,” said Jim McCann, Chairman and Chief Executive Officer of 1-800-FLOWERS.COM, Inc.
Jim McCann continued, “Our rich history of innovation and embracing new technology will continue to play a vital role in solving the gifting needs of our millions of customers. As we look ahead, we have a talented management team and I look forward to working with them as we continue to execute our strategy to be a top destination for our customers’ celebratory and gifting occasions.”
Since its founding, 1-800-FLOWERS.COM, Inc. has continuously evolved its business. More recently it has transformed from a floral-based specialty retailer with multiple-brand add-ons into an Ecommerce gifting platform built for growth. From Fiscal 2019 through Fiscal 2022, the Company grew revenue by more than 75%, and it has a demonstrated ability to grow the company both organically and through acquisitions. 1-800-FLOWERS.COM, Inc. will continue to execute on its strategic plan that is centered on helping its customers build more and better relationships with all the important people in their lives.
About 1-800-FLOWERS.COM, Inc.
1-800-FLOWERS.COM, Inc. is a leading provider of gifts designed to help inspire customers to give more, connect more, and build more and better relationships. The Company’s e-commerce business platform features an all-star family of brands, including: 1-800-Flowers.com®, 1-800-Baskets.com®, Cheryl’s Cookies®, Harry & David®, PersonalizationMall.com®, Shari’s Berries®, FruitBouquets.com®, Things Remembered®, Moose Munch®, The Popcorn Factory®, Wolferman’s Bakery®, Vital Choice®, Stock Yards® and Simply Chocolate®. Through the Celebrations Passport® loyalty program, which provides members with free standard shipping and no service charge across our portfolio of brands, 1-800-FLOWERS.COM, Inc. strives to deepen relationships with customers. The Company also operates BloomNet®, an international floral and gift industry service provider offering a broad-range of products and services designed to help members grow their businesses profitably; Napco℠, a resource for floral gifts and seasonal décor; DesignPac Gifts, LLC, a manufacturer of gift baskets and towers; and Alice’s Table®, a lifestyle business offering fully digital livestreaming and on demand floral, culinary and other experiences to guests across the country. 1-800-FLOWERS.COM, Inc. was recognized among the top 5 on the National Retail Federation’s 2021 Hot 25 Retailers list, which ranks the nation’s fastest-growing retail companies, and was named to the Fortune 1000 list in 2022. Shares in 1-800-FLOWERS.COM, Inc. are traded on the NASDAQ Global Select Market, ticker symbol: FLWS. For more information, visit 1800flowersinc.com or follow @1800FLOWERSInc on Twitter.
Iconic Burger Franchise Opens New Location in Riverview, FL
LOS ANGELES, June 22, 2023 (GLOBE NEWSWIRE) — FAT (Fresh. Authentic. Tasty.) Brands Inc., parent company of Fatburger and 16 other restaurant concepts, announces Fatburger’s return to the Tampa area. Located in Riverview, FL, the new restaurant marks the first location in the state in approximately 20 years. The opening is just the start of a new wave of locations arriving in Florida for the all-American burger brand -three more locations will be opening in Tampa in the next five years, in addition to 10 locations in Orlando within the next seven years.
“We are heavily invested in growing the Fatburger brand in Florida,” said Jake Berchtold, COO of FAT Brands’ Fast Casual Division. “Making our return to the state after two decades is incredibly rewarding, especially with a committed, experienced partner like Whole Factor Inc., who will be opening 13 more units in Florida. Fans have been eagerly waiting for us and the time has finally come for them to grab their favorite burgers, fries, and milkshakes!”
Ever since the first Fatburger opened in Los Angeles 70 years ago, the chain has been known for its delicious, grilled-to-perfection and cooked to order burgers. Founder Lovie Yancey believed that a big burger with everything on it is a meal in itself; at Fatburger “everything” is not just the usual roster of toppings. Burgers can be customized with everything from bacon and eggs to chili and onion rings. In addition to its famous burgers, the Fatburger menu also includes Fat and Skinny Fries, sweet potato fries, scratch-made onion rings, Impossible™ Burgers, turkeyburgers, hand-breaded crispy chicken sandwiches, and hand-scooped milkshakes made from 100% real ice cream.
To celebrate the new restaurant, the Riverview location will be hosting a grand opening celebration on June 24, with the first 100 customers receiving a free Original Fatburger. Additionally, fans can score a free drink with any purchase throughout the day.
The new Fatburger Riverview restaurant is located at 9950 Upper Alafia Court, Riverview, FL33578. The location is open Sunday through Wednesday, 10 a.m. to 11 p.m., and Thursday through Saturday, 10 a.m. to 2 a.m.
For more information or to find a Fatburger near you, please visit www.fatburger.com.
About FAT (Fresh. Authentic. Tasty.) Brands
FAT Brands (NASDAQ: FAT) is a leading global franchising company that strategically acquires, markets, and develops fast casual, quick-service, casual dining, and polished casual dining concepts around the world. The Company currently owns 17 restaurant brands: Round Table Pizza, Fatburger, Marble Slab Creamery, Johnny Rockets, Fazoli’s, Twin Peaks, Great American Cookies, Hot Dog on a Stick, Buffalo’s Cafe & Express, Hurricane Grill & Wings, Pretzelmaker, Elevation Burger, Native Grill & Wings, Yalla Mediterranean and Ponderosa and Bonanza Steakhouses, and franchises and owns over 2,300 units worldwide. For more information on FAT Brands, please visit www.fatbrands.com.
AboutFatburger
An all-American, Hollywood favorite, Fatburger is a fast-casual restaurant serving big, juicy, tasty burgers, crafted specifically to each customer’s liking. With a legacy spanning 70 years, Fatburger’s extraordinary quality and taste inspire fierce loyalty amongst its fan base, which includes a number of A-list celebrities and athletes. Featuring a contemporary design and ambiance, Fatburger offers an unparalleled dining experience, demonstrating the same dedication to serving gourmet, homemade, custom-built burgers as it has since 1952 – The Last Great Hamburger Stand™. For more information, visit www.fatburger.com.
Forward Looking Statements
This press release contains forward-looking statements within the meaning of the Private Securities Litigation Reform Act of 1995, including statements relating to the timing and performance of new store openings. Forward-looking statements reflect expectations of FAT Brands Inc. (“we”, “our” or the “Company”) concerning the future and are subject to significant business, economic and competitive risks, uncertainties and contingencies, including but not limited to uncertainties surrounding the severity, duration and effects of the COVID-19 pandemic. These factors are difficult to predict and beyond our control, and could cause our actual results to differ materially from those expressed or implied in such forward-looking statements. We refer you to the documents that we file from time to time with the Securities and Exchange Commission, such as our reports on Form 10-K, Form 10-Q and Form 8-K, for a discussion of these and other factors. We undertake no obligation to update any forward-looking statement to reflect events or circumstances occurring after the date of this press release.
Joe Gomes, Managing Director, Equity Research Analyst, Generalist , Noble Capital Markets, Inc.
Joshua Zoepfel, Research Associate, Noble Capital Markets, Inc.
Refer to the full report for the price target, fundamental analysis, and rating.
A Response. On Friday, Lifeway’s Board responded to the recent letter released by Kanen Wealth Management (KWM). As one would expect, the Board disagrees with the points laid out by KWM. From a governance standpoint, the Board noted its belief the executive team is successfully executing the Lifeway 2.0 strategy, has aligned interests with shareholders given insiders’ 18% ownership stake, and has consistently engaged with shareholders.
Operating Highlights. The Board goes on to point out a number of operating highlights, including: (i) 14 consecutive quarters of strong year-over-year net sales growth, (ii) growth into the 9th largest U.S. yogurt manufacturer, (iii) a growing customer base, (iv) positioned to capitalize on macro trends as customer demand for kefir grows, and (v) total shareholder return of 44% over the last year and 191% over the past three years, among other points.
Equity Research is available at no cost to Registered users of Channelchek. Not a Member? Click ‘Join’ to join the Channelchek Community. There is no cost to register, and we never collect credit card information.
This Company Sponsored Research is provided by Noble Capital Markets, Inc., a FINRA and S.E.C. registered broker-dealer (B/D).
*Analyst certification and important disclosures included in the full report. NOTE: investment decisions should not be based upon the content of this research summary. Proper due diligence is required before making any investment decision.
Original Cookie Cake Franchise Now Open in Anchorage
LOS ANGELES, June 15, 2023 (GLOBE NEWSWIRE) — Great American Cookies, the Original Cookie Cake franchise, announces its first location in the state of Alaska. Located in Anchorage, the new store serves as the ultimate sweet spot for locals with desserts including Custom Cookie Cakes, fresh, soft-baked cookies, brownies, and more.
“This year, Great American Cookies arrived in Arizona, New Mexico, and Illinois,” said Allison Lauenstein, President of Great American Cookies. “Growing domestically has been a key growth pillar for us so we are pleased to be able to expand our footprint to four new states, including Alaska, in just a few months. We see Anchorage as a great market to make our Alaska debut in, providing a perfect spot for family nights, birthdays, and beyond.”
Since 1977, Great American Cookies has baked up a reputation for not only being the creator of the Original Cookie Cake, but also for its famous chocolate chip cookie recipe. Other crave-able menu items include brownies and Double Doozies™, delectable icing sandwiched between two cookies.
The Anchorage Great American Cookies is located at 800 E Dimond Blvd, Suite 183, Anchorage, AK 99515, and is open Monday through Saturday, 10 a.m. to 9 p.m., and Sunday, 12 p.m. to 7 p.m.
About FAT (Fresh. Authentic. Tasty.) Brands FAT Brands (NASDAQ: FAT) is a leading global franchising company that strategically acquires, markets, and develops fast-casual, quick-service, casual dining, and polished casual dining concepts around the world. The Company currently owns 17 restaurant brands: Round Table Pizza, Fatburger, Marble Slab Creamery, Johnny Rockets, Fazoli’s, Twin Peaks, Great American Cookies, Hot Dog on a Stick, Buffalo’s Cafe & Express, Hurricane Grill & Wings, Pretzelmaker, Elevation Burger, Native Grill & Wings, Yalla Mediterranean and Ponderosa and Bonanza Steakhouses, and franchises and owns over 2,300 units worldwide. For more information on FAT Brands, please visit www.fatbrands.com.
About Great American Cookies Founded on a family chocolate chip cookie recipe in 1977, Great American Cookies believes that pure, simple delight is part of living a full life. Serving the Original Cookie Cake, fresh baked cookies in a variety of flavors, brownies, and Double Doozies™, we promise to treat you to bites of bliss that prove how sweet life can be. With more than 370 bakeries across the country and internationally in Bahrain, Guam, and Saudi Arabia, and treats available to ship right to your door, the sweet spot is always close to home. For more information, visit www.greatamericancookies.com.
Joe Gomes, Managing Director, Equity Research Analyst, Generalist , Noble Capital Markets, Inc.
Joshua Zoepfel, Research Associate, Noble Capital Markets, Inc.
Refer to the full report for the price target, fundamental analysis, and rating.
A Chat. We had an opportunity to speak with David Kanen about his Lifeway investment and letter to the Board. Mr. Kanen reiterated a number of points he brought up in his letter, which we encourage investors to read. Mr. Kanen noted his desire to see other investors become familiar with the Lifeway opportunity.
What About the Proxy Contest? Mr. Kanen observed that, in his opinion, even if Edward and Ludmila Smolyansky are unable to mount a proxy contest this year, the terms of the settlement agreement would enable Edward and Ludmila to renew their quest at the 2024 annual meeting.
Equity Research is available at no cost to Registered users of Channelchek. Not a Member? Click ‘Join’ to join the Channelchek Community. There is no cost to register, and we never collect credit card information.
This Company Sponsored Research is provided by Noble Capital Markets, Inc., a FINRA and S.E.C. registered broker-dealer (B/D).
*Analyst certification and important disclosures included in the full report. NOTE: investment decisions should not be based upon the content of this research summary. Proper due diligence is required before making any investment decision.
Joe Gomes, Managing Director, Equity Research Analyst, Generalist , Noble Capital Markets, Inc.
Joshua Zoepfel, Research Associate, Noble Capital Markets, Inc.
Refer to the full report for the price target, fundamental analysis, and rating.
Family. The saga between Lifeway CEO Julie Smolyansky and her brother, Edward, and mother, Ludmila, continues, with each side claiming the other breached the Proxy settlement reached last July. While the legal battle continues to unfold, the most recent Court decisions determined, “… no basis in law or fact that remains as to the invalidity of Mr. Smolyansky’s nomination of an alternate slate of directors and such nomination is void ab initio and is not a valid solicitation,” according to the Company.
The Twist. In a twist, David Kanen of Kanen Wealth Management issued a letter sent to Julie Smolyansky and the Board of Directors. According to the letter, Mr. Kanen owns approximately 4.1% of the outstanding LWAY shares and intends to vote his shares in support of the recent slate nominated by Edward and Ludmila Smolyansky.
Equity Research is available at no cost to Registered users of Channelchek. Not a Member? Click ‘Join’ to join the Channelchek Community. There is no cost to register, and we never collect credit card information.
This Company Sponsored Research is provided by Noble Capital Markets, Inc., a FINRA and S.E.C. registered broker-dealer (B/D).
*Analyst certification and important disclosures included in the full report. NOTE: investment decisions should not be based upon the content of this research summary. Proper due diligence is required before making any investment decision.
Joe Gomes, Managing Director, Equity Research Analyst, Generalist , Noble Capital Markets, Inc.
Joshua Zoepfel, Research Associate, Noble Capital Markets, Inc.
Refer to the full report for the price target, fundamental analysis, and rating.
1QFY24 Revenue Light. Net revenue of $94.4 million was below our and consensus estimates of $99 million and $99.7 million, respectively. The revenue miss was driven by some traffic weakness at factory stores during March, although subsequent months have shown improvement. However, Pura Vida showed its first y-o-y sales improvement in five quarters, while Vera Bradley full line and e-comm produced solid results.
But Margins Improved. Gross margin expanded 150 basis points to 54.8% reflecting lower freight costs and inventory sell through while SG&A fell to 58.9% of revenue from 60.3% (both non-GAAP) last year reflecting strong cost control. GAAP EPS loss was $0.15, while adjusted EPS loss was $0.09, compared to EPS loss of $0.21 and $0.18, respectively, in 1QFY23, and our $0.19 EPS loss estimate.
Equity Research is available at no cost to Registered users of Channelchek. Not a Member? Click ‘Join’ to join the Channelchek Community. There is no cost to register, and we never collect credit card information.
This Company Sponsored Research is provided by Noble Capital Markets, Inc., a FINRA and S.E.C. registered broker-dealer (B/D).
*Analyst certification and important disclosures included in the full report. NOTE: investment decisions should not be based upon the content of this research summary. Proper due diligence is required before making any investment decision.
Net loss totaled ($4.7) million, or ($0.15) per diluted share; non-GAAP net loss totaled ($2.6) million, or ($0.09) per diluted share
Balance sheet remains strong, with cash and cash equivalents of $25.3 million, no debt, and year-over-year inventories down 11.8%
Management increases guidance for fiscal year
FORT WAYNE, Ind., June 07, 2023 (GLOBE NEWSWIRE) — Vera Bradley, Inc. (Nasdaq: VRA) today announced its financial results for the first quarter ended April 29, 2023.
In this release, Vera Bradley, Inc. or “the Company” refers to the entire enterprise and includes both the Vera Bradley and Pura Vida brands. Vera Bradley on a stand-alone basis refers to the Vera Bradley brand.
First Quarter Comments
Jackie Ardrey, Chief Executive Officer of the Company, noted, “We are pleased that meaningful gross margin expansion and diligent expense control led to significant year-over-year improvement in bottom-line performance for the quarter.
“On the revenue side, Vera Bradley factory stores experienced challenging traffic trends in March and April that led to weaker-than-expected performance for the quarter. This was partially offset, however, by several positive highlights in other areas of our business.
“First, we experienced our first positive quarterly revenue performance in five quarters at Pura Vida, primarily driven by non-comparable retail store sales. We also saw improved year-over-year sales trends in both our Pura Vida wholesale and e-commerce channels. Second, we delivered strong Vera Bradley e-commerce performance and solid Vera Bradley full-line store revenues. Vera Bradley Indirect revenues declined, as expected, due to a non-recurring key account order that took place in last year’s first quarter, but the underlying business remains healthy.”
“We are building a collaborative team with the mindset of generating long-term revenue increases, expanding gross margin, and ensuring strong financial discipline and cost control, which we expect will drive long-term profitable growth,” Ardrey continued. “The team is working hard and taking strategic, proactive steps to steadily grow Pura Vida’s revenues and to reverse the trends in Vera Bradley’s factory channel through the expansion of successfully tested targeted marketing programs designed to drive traffic and average order size.”
Ardrey added, “The hard work on Project Restoration began in the first quarter, which is focused on four key pillars of the business for each brand – Consumer, Brand, Product, and Channel – to drive this long-term profitable growth. To support Project Restoration and lay the foundation for our success, we made additional corporate changes and announced $12 million in incremental annualized cost reductions, including the elimination of approximately 25 corporate positions as part of an overall plan to further right-size the expense structure of the Company.”
Michael Schwindle joined the Company as Chief Financial Officer on May 8, 2023. “His track record of driving profitable growth, along with his passion for retail and operational excellence, will be instrumental as the Company executes Project Restoration and in the years beyond,” Ardrey noted. The Company also made several organizational changes in the Marketing, E-commerce, Product Design, and Product Development areas that flattened and streamlined the organizational structure to improve execution; make faster decisions; and provide support for the four pillars of Project Restoration. These most recent organizational changes and non-payroll expense reductions are expected to produce annualized savings of approximately $12 million, on top of the Company’s Fiscal 2023 cost reductions.
“We are committed to delivering improved value to our shareholders,” Ardrey continued. “These efforts will allow us to simplify our structure, be a more agile organization, and reset our expense base, so we can focus fully on Project Restoration and on delivering both healthy top- and bottom-line growth in the future.”
Summary of Financial Performance for the First Quarter
Consolidated net revenues totaled $94.4 million compared to $98.5 million in the prior year first quarter ended April 30, 2022.
For the current year first quarter, Vera Bradley, Inc.’s consolidated net loss totaled ($4.7) million, or ($0.15) per diluted share. These results included $2.0 million of net after tax charges, comprised of $1.4 million of severance charges, $0.5 million for the amortization of definite-lived intangible assets, and $0.1 million of consulting and professional fees primarily associated with cost saving and strategic initiatives. On a non-GAAP basis, Vera Bradley, Inc.’s consolidated first quarter net loss totaled ($2.6) million, or ($0.09) per diluted share.
For the prior year first quarter, Vera Bradley, Inc.’s consolidated net loss totaled ($7.0) million, or ($0.21) per diluted share. These results included $0.9 million of net after tax charges, comprised of $0.4 million of intangible asset amortization and $0.4 million of impairment charges, and $0.1 million of consulting fees associated with cost savings initiatives. On a non-GAAP basis, Vera Bradley, Inc.’s consolidated first quarter net loss totaled ($6.0) million, or ($0.18) per diluted share.
Non-GAAP Numbers
The current year non-GAAP first quarter income statement numbers referenced below exclude the previously outlined severance charges, intangible asset amortization, and consulting and professional fees. The prior year non-GAAP first quarter income statement numbers referenced below exclude the previously outlined intangible asset amortization, impairment charges, and consulting fees.
First Quarter Details
Current year first quarter Vera Bradley Direct segment revenues totaled $58.9 million, a 4.4% decrease from $61.6 million in the prior year first quarter. Comparable sales declined 3.3% in the first quarter, primarily due to weakness in the factory channel. The Company permanently closed 19 full-line and two factory outlet stores and opened five factory outlet stores over the last twelve months.
Vera Bradley Indirect segment revenues totaled $15.4 million, a 9.4% decrease from $17.0 million in the prior year first quarter. Prior year revenues reflected a large one-time key account order that was not repeated in the current year.
Pura Vida segment revenues totaled $20.1 million, a 1.2% increase over $19.8 million in the prior year first quarter, primarily driven by new store growth resulting in non-comparable retail store sales.
First quarter consolidated gross profit totaled $51.7 million, or 54.8% of net revenues, compared to $52.5 million, or 53.3% of net revenues, in the prior year first quarter. The current year gross profit rate was favorably impacted by lower year-over-year inbound and outbound freight expense and the sell-through of previously-reserved inventory, partially offset by an increase in promotional activity.
Consolidated SG&A expense totaled $58.5 million, or 62.0% of net revenues, for the quarter, compared to $60.9 million, or 61.9% of net revenues, for the prior year first quarter. On a non-GAAP basis, consolidated SG&A expense totaled $55.6 million, or 58.9% of net revenues, for the current quarter, compared to $59.4 million, or 60.3% of net revenues, for the prior year first quarter. Vera Bradley’s current year non-GAAP SG&A expenses were lower than the prior year primarily due to cost reduction initiatives and a reduction in variable-related expenses related to lower sales volume.
The Company’s first quarter consolidated operating loss totaled ($6.4) million, or (6.8%) of net revenues, compared to an operating loss of ($8.2) million, or (8.4%) of net revenues, in the prior year first quarter. On a non-GAAP basis, the consolidated operating loss totaled ($3.5) million, or (3.7%) of net revenues, compared to ($6.7) million, or (6.8%) of net revenues, in the prior year.
By segment:
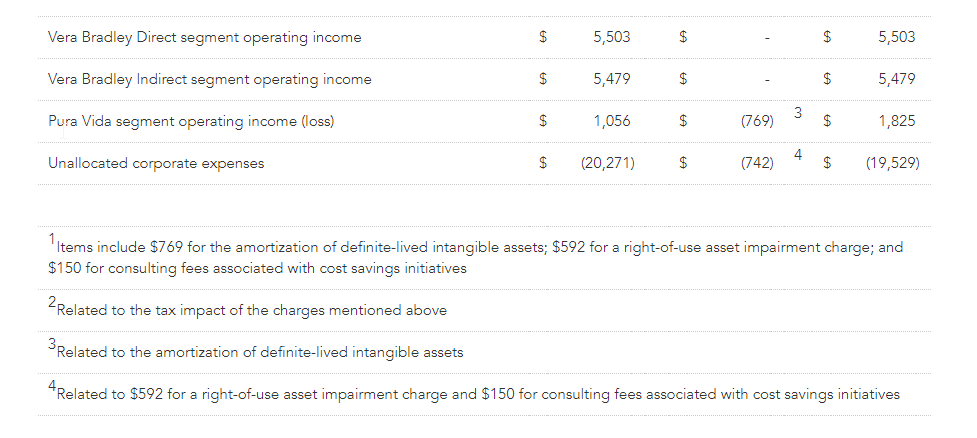
Vera Bradley Direct’s first quarter operating income was $7.3 million, or 12.5% of Direct net revenues, compared to operating income of $5.5 million, or 8.9% of Direct net revenues, in the prior year. On a non-GAAP basis, Vera Bradley Direct’s current year first quarter operating income was $7.7 million, or 13.0% of Direct net revenues, compared to $5.5 million, or 8.9% of Direct net revenues, in the prior year.
Vera Bradley Indirect’s first quarter operating income was $4.7 million, or 30.6% of Indirect net revenues, compared to $5.5 million, or 32.3% of Indirect net revenues, in the prior year.
Pura Vida’s first quarter operating income was $1.6 million, or 7.8% of Pura Vida net revenues, compared to $1.1 million, or 5.3% of Pura Vida net revenues, in the prior year. On a non-GAAP basis, Pura Vida’s current year first quarter operating income was $2.3 million, or 11.4% of Pura Vida net revenues, compared to $1.8 million, or 9.2% of Pura Vida net revenues, in the prior year.
Balance Sheet
Net capital spending for the first quarter totaled $0.8 million compared to $1.7 million in the prior year.
Cash and cash equivalents as of April 29, 2023 totaled $25.3 million compared to $46.6 million at fiscal year end. The Company had no borrowings on its $75 million ABL credit facility at quarter end.
Total quarter-end inventory was $142.7 million, compared to $161.8 million at the end of the first quarter last year.
During the first quarter, the Company repurchased approximately $0.7 million of its common stock (approximately 0.1 million shares at an average price of $5.71). $27.0 million remains under the Company’s $50.0 million repurchase authorization that expires in December 2024.
Forward Outlook
Management is updating guidance for the fiscal year ending February 3, 2024 (“Fiscal 2024”) based on first quarter performance, Company initiatives underway, and current macroeconomic trends and expectations.
Excluding net revenues, all forward-looking guidance numbers referenced below are non-GAAP. The prior year income statement numbers exclude the previously disclosed charges for goodwill and intangible asset impairment; net inventory and purchase order-related adjustments; severance, retention, and stock-based retirement compensation; consulting and professional fees primarily associated with cost savings initiatives, the CEO search, and strategic initiatives; amortization of definite-lived intangible assets; store and right-of-use asset impairment charges; new CEO sign-on bonus and relocation; and goodMRKT exit costs. Current year guidance excludes any similar charges.
For Fiscal 2024, the Company’s expectations are as follows:
Consolidated net revenues of $490 to $510 million. Net revenues totaled $500.0 million in Fiscal 2023. Both Vera Bradley and Pura Vida revenues are expected to be approximately flat on a year-over-year basis.
A consolidated gross profit percentage of 52.8% to 53.8% compared to 51.4% in Fiscal 2023. The Fiscal 2024 gross margin rate is expected to be favorably impacted by lower year-over-year freight expense, cost reduction initiatives, and the sell-through of previously-reserved inventory, partially offset by an increase in promotional activity.
Consolidated SG&A expense of $237 to $247 million compared to $245.3 million in Fiscal 2023. An expected decline in SG&A expense is being driven by Company-wide cost reduction initiatives, partially offset by restoring short-term and long-term incentive compensation to more normalized levels and incremental marketing investment intended to accelerate customer file growth.
Consolidated operating income of $24 to $28 million compared to $12.3 million in Fiscal 2023.
Free cash flow of between $35 and $40 million compared to a cash usage of $21.7 million in Fiscal 2023.
Consolidated diluted EPS of $0.57 to $0.67 based on diluted weighted-average shares outstanding of 30.7 million and an effective tax rate of approximately 28%. Diluted EPS totaled $0.24 last year.
Net capital spending of approximately $5 million compared to $8.2 million in the prior year, reflecting investments associated with new Vera Bradley Factory stores and technology and logistics enhancements.
Disclosure Regarding Non-GAAP Measures
The Company’s management does not, nor does it suggest that investors should, consider the supplemental non-GAAP financial measures in isolation from, or as a substitute for, financial information prepared in accordance with accounting principles generally accepted in the United States (“GAAP”). Further, the non-GAAP measures utilized by the Company may be unique to the Company, as they may be different from non-GAAP measures used by other companies.
The Company believes that the non-GAAP measures presented in this earnings release, including (cash usage) free cash flow; gross profit; selling, general, and administrative expenses; operating loss; net loss; net loss attributable and available to Vera Bradley, Inc.; and diluted net loss per share available to Vera Bradley, Inc. common shareholders, along with the associated percentages of net revenues, are helpful to investors because they allow for a more direct comparison of the Company’s year-over-year performance and are consistent with management’s evaluation of business performance. A reconciliation of the non-GAAP measures to the most directly comparable GAAP measures can be found in the Company’s supplemental schedules included in this earnings release.
Call Information
A conference call to discuss results for the first quarter is scheduled for today, Wednesday, June 7, 2023, at 9:30 a.m. Eastern Time. A broadcast of the call will be available via Vera Bradley’s Investor Relations section of its website, www.verabradley.com. Alternatively, interested parties may dial into the call at (888) 394-8218, and enter the access code 9903988. A replay will be available shortly after the conclusion of the call and remain available through June 21, 2023. To access the recording, listeners should dial (844) 512-2921, and enter the access code 9903988.
About Vera Bradley, Inc.
Vera Bradley, Inc. operates two unique lifestyle brands – Vera Bradley and Pura Vida. Vera Bradley and Pura Vida are complementary businesses, both with devoted, emotionally-connected, and multi-generational female customer bases; alignment as casual, comfortable, affordable, and fun brands; positioning as “gifting” and socially-connected brands; strong, entrepreneurial cultures; a keen focus on community, charity, and social consciousness; multi-channel distribution strategies; and talented leadership teams aligned and committed to the long-term success of their brands.
Vera Bradley, based in Fort Wayne, Indiana, is a leading designer of women’s handbags, luggage and other travel items, fashion and home accessories, and unique gifts. Founded in 1982 by friends Barbara Bradley Baekgaard and Patricia R. Miller, the brand is known for its innovative designs, iconic patterns, and brilliant colors that inspire and connect women unlike any other brand in the global marketplace.
In July 2019, Vera Bradley, Inc. acquired a 75% interest in Creative Genius, Inc., which also operates under the name Pura Vida Bracelets (“Pura Vida”). Pura Vida, based in La Jolla, California, is a digitally native, highly-engaging lifestyle brand founded in 2010 by friends Paul Goodman and Griffin Thall. Pura Vida has a differentiated and expanding offering of bracelets, jewelry, and other lifestyle accessories. The Company acquired the remaining 25% of Pura Vida in January 2023.
The Company has three reportable segments: Vera Bradley Direct (“VB Direct”), Vera Bradley Indirect (“VB Indirect”), and Pura Vida. The VB Direct business consists of sales of Vera Bradley products through Vera Bradley Full-Line and Factory stores in the United States, www.verabradley.com, www.verabradley.ca, Vera Bradley’s online outlet site, and the Vera Bradley annual outlet sale in Fort Wayne, Indiana. The VB Indirect business consists of sales of Vera Bradley products to approximately 1,700 specialty retail locations throughout the United States, as well as select department stores, national accounts, third party e-commerce sites, and third-party inventory liquidators, and royalties recognized through licensing agreements related to the Vera Bradley brand. The Pura Vida segment consists of sales of Pura Vida products through the Pura Vida websites, www.puravidabracelets.com, www.puravidabracelets.eu, and www.puravidabracelets.ca; through the distribution of its products to wholesale retailers and department stores; and through its Pura Vida retail stores.
Website Information
We routinely post important information for investors on our website www.verabradley.com in the “Investor Relations” section. We intend to use this webpage as a means of disclosing material, non-public information and for complying with our disclosure obligations under Regulation FD. Accordingly, investors should monitor the Investor Relations section of our website, in addition to following our press releases, SEC filings, public conference calls, presentations and webcasts. The information contained on, or that may be accessed through, our webpage is not incorporated by reference into, and is not a part of, this document.
Investors and other interested parties may also access the Company’s most recent Corporate Responsibility and Sustainability Report outlining its ESG (Environmental, Social, and Governance) initiatives at https://verabradley.com/pages/corporate-responsibility.
Vera Bradley Safe Harbor Statement
Certain statements in this release are “forward-looking statements” made pursuant to the safe-harbor provisions of the Private Securities Litigation Reform Act of 1995. Such forward-looking statements reflect the Company’s current expectations or beliefs concerning future events and are subject to various risks and uncertainties that may cause actual results to differ materially from those that we expected, including: possible adverse changes in general economic conditions and their impact on consumer confidence and spending; possible inability to predict and respond in a timely manner to changes in consumer demand; possible loss of key management or design associates or inability to attract and retain the talent required for our business; possible inability to maintain and enhance our brands; possible inability to successfully implement the Company’s long-term strategic plans; possible inability to successfully open new stores, close targeted stores, and/or operate current stores as planned; incremental tariffs or adverse changes in the cost of raw materials and labor used to manufacture our products; possible adverse effects resulting from a significant disruption in our distribution facilities; or business disruption caused by pandemics. Risks, uncertainties, and assumptions also include the possibility that Pura Vida acquisition benefits may not materialize as expected and that Pura Vida’s business may not perform as expected. More information on potential factors that could affect the Company’s financial results is included from time to time in the “Risk Factors” and “Management’s Discussion and Analysis of Financial Condition and Results of Operations” sections of the Company’s public reports filed with the SEC, including the Company’s Form 10-K for the fiscal year ended January 28, 2023. We undertake no obligation to publicly update or revise any forward-looking statement. Financial schedules are attached to this release.