Image Credit: Kampus (Pexels)
Why it May be Prudent in a Down-Market to Allocate to Individual SPACs
When the markets were roaring upwards in 2020 investment capital was abundant, the number of Special Purpose Acquisition Companies (SPACs) going public broke records. Competition to find ideal companies to merge with to fulfill the SPAC’s mission, intensified. Almost two years have passed since SPAC IPOs’ popularity emerged following a much quieter period for these equities. The 2020 vintage SPACs are now nearing their deadlines to find acquisitions or disseminate the money held in escrow back to shareholders. What does this mean to stock market investors?
Background
IPOs offered as SPACs in 2020 broke all previous records, in terms of the number of offerings, and gross proceeds. In 2021 there was even more issuance. SPACs are not new; they have existed for decades, they are sometimes referred to as blank check companies and shell companies. They have also been called “backdoor IPOs” because it allows a private company to go public without the normal process of filing and disclosures through the regular IPO filing process. Filing for an IPO with a SPAC is much quicker for private companies than going the traditional IPO route.
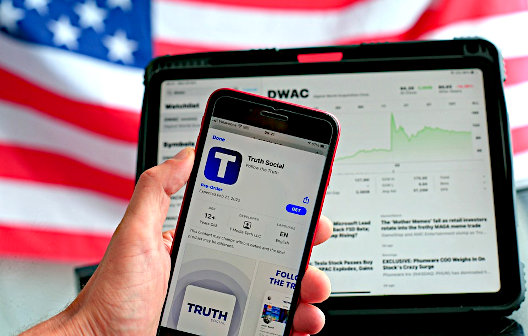
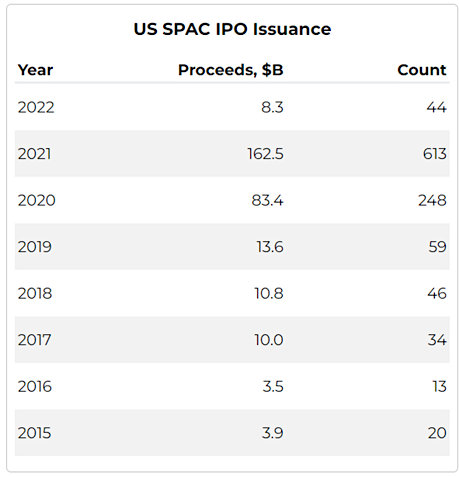 Currently, there are 602 SPACs with 162.4 billion in combined funds looking to find acquisitions. There are SPACs succeeding in finding acquisition targets, tickers like BOWL, DWAC, CPSR have recently either merged or are in a deSPAC phase, headed toward merging. But it is unlikely that there are 600 well-suited, private companies looking to go public via SPAC acquisition. This isn’t necessarily bad for the investors in the stock, if there is a downside it is to the finance entities that went through the expense and management of the SPAC for two years.
Investors lose little more than opportunity while their funds were tied up. This is because when a SPAC fails to merge, the funds from the IPO, less expenses, plus accrued interest, are then all returned to the current holder of shares.
Performance
So far this year SPACs have outperformed the market significantly. This may be because SPACs don’t have as much downside, as mentioned, the initial investment is held in an escrow account that typically earns interest. Should the SPAC not merge after 24 months, investors have a fairly good idea of what they can expect to be returned to them. They may not make money, but depending on their purchase price they shouldn’t lose much. The returned cash is most often just below the initial $10 offering price. This protection prevents the SPAC from decreasing in value greatly from its offering price, while still maintaining the potential to find a target that could drive the price significantly upward. The structure demonstrates a level of safety that is not shared by other common stocks.
There is an enhanced benefit to SPAC owners in 2022 that barely existed in 2020 and early 2021 when so many of the SPACs came to market, interest rates are now averaging 3% in the escrow accounts. This is up from when rates approximated 0% when the older SPACs came to market.
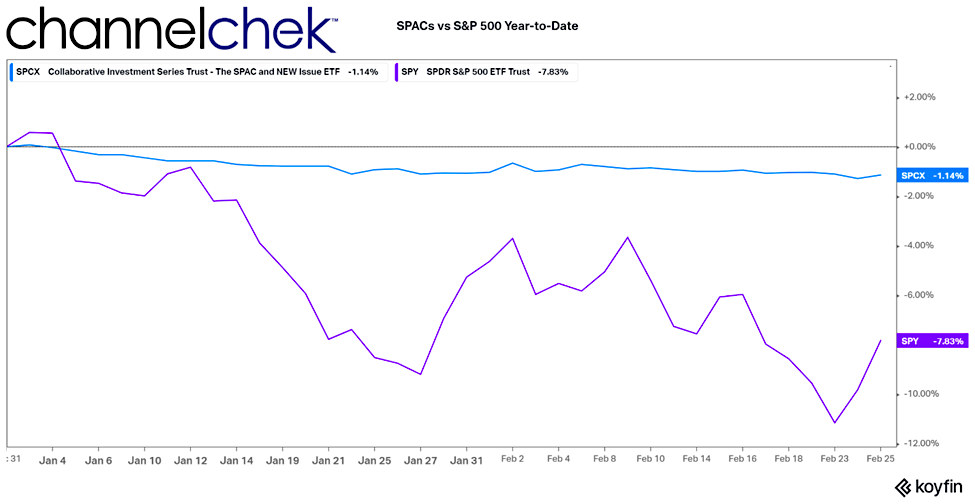
SPCX used in the chart above is an actively managed ETF comprised of SPAC IPOs. Using it as a proxy for the SPAC market and comparing its performance to the S&P 500 YTD, it’s clear that SPAC stocks are a diversifier in a portfolio – they trade off their own fundamentals. The very big risk-flattening mechanism is that they effectively have a price floor for each individual SPAC.
Portfolios looking to reduce downside risk yet maintain upside potential may want to allocate into well-selected individual SPACs. To do this some investors research by evaluating the market value of the issuance and comparing it to escrow trust account value balance. What they are looking for is pre-deal shell companies that are worth more than their market price. These situations where one pays less in cash than the cash the company holds is a strategy that is gaining popularity as all markets weaken.
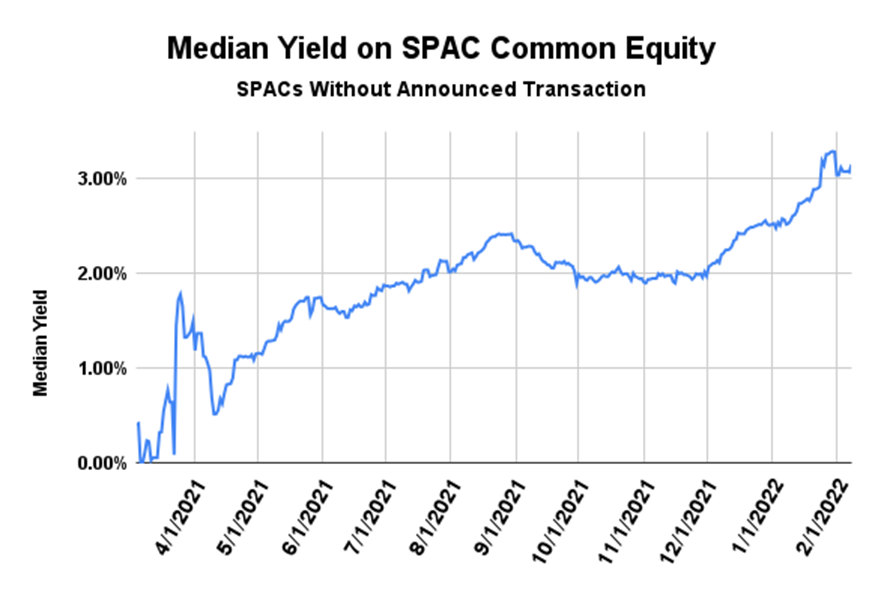
Source: SPAC Research
Take-Away
Competition to find perfect merger candidates intensified to an extreme never before seen for SPACs as issuance rose from 59 deals in 2019, to 248 in 2020, and 613 in 2021. A failed SPAC (one that doesn’t find a target in 24 months) is unfortunate for the finance company issuer, but it is not necessarily bad for the stockholder. Stockholders have the option if the company finds a target, of opting out and collecting their pro-rata share of the trust or retaining the stock and owning the company it acquires. If there is no acquisition within the specified period, the stockholder is cashed out at their pro-rata share of the trust. There are stocks that are trading for less than their escrow value, some investors seek these out.
For updates on small and microcap stocks, including SPACS, sign-up to receive Channelchek daily research and information.
Paul Hoffman
Managing Editor, Channelchek
Suggested Reading
Sources
https://www.spcxetf.com/the-fund/
https://www.spacresearch.com/

Stay up to date. Follow us: