PTSD MDMA and Psilocybin


Image Credit: Peter Murphy (Flickr)


Latest Trials Confirm the Benefits of MDMA – the Drug in Ecstasy – for Treating PTSD


For people with post-traumatic stress disorder, recalling memories of physical or sexual assault, combat or disaster-related events can induce intense anxiety or panic attacks as well as debilitating flashbacks.

In the U.S., about 7% of people suffer from PTSD and lose an average of about four working days each month as a result. Trauma-specific psychotherapy, like cognitive processing or “talk” therapy, is the cornerstone of treatment for PTSD. But for approximately half of people, these traditional approaches are ineffective at fully addressing PTSD symptoms over the long term. Antidepressant drugs are frequently used if psychotherapy fails, or in combination with it, but the effects are usually modest.

MDMA (3,4-methylenedioxymethamphetamine) is an active ingredient in the illicit street drug known as ecstasy or molly. People in dance clubs and raves use illicit MDMA because it elevates mood and energy levels, induces a feeling of bonding with others and produces a surreal psychedelic effect. These same effects have been hypothesized to support people with PTSD during psychotherapy sessions, since they can make people more willing and able to share and explore their traumatic experiences. Our new meta-analysis of clinical trials confirms the benefits of MDMA-assisted psychotherapy in the treatment of PTSD.


This article was republished with permission from The Conversation, a news site dedicated to sharing ideas from academic experts. It was written by and represents the research-based opinions of C. Michael White, Distinguished Professor and Head of the Department of Pharmacy Practice, University of Connecticut. Adrian V. Hernandez, Associate Professor of Comparative Effectiveness and Outcomes Research, University of Connecticut.


We are a pharmacist and physician team who investigate the benefits and harms associated with substances of abuse like bath salts, phenibut, cannabis and synthetic marijuana. Through this work we have become intrigued about the therapeutic potential for some psychedelic drugs in the treatment of myriad psychiatric disorders, from PTSD to major depression, especially MDMA and psilocybin (hallucinogenic mushrooms).

It is important to state that using ecstasy or molly products from the street would not help PTSD symptoms because the MDMA needs be used along with carefully crafted psychotherapy in a safe, controlled environment. Ecstasy or molly products purchased illicitly never specify the exact amount of MDMA they contain, so it is impossible to dose it properly for PTSD. Taking too much MDMA or exercising while taking MDMA can cause heart attacks, strokes, seizures and arrhythmias and can damage muscles and kidneys.


What is MDMA-Assisted Psychotherapy?

In an MDMA-assisted psychotherapy session, patients take MDMA as a pill upon entering a psychiatrist’s office and then work with a team of therapists who help them divulge traumatic events or discuss aspects of those events over the course of several hours. They usually have non-MDMA sessions before the first MDMA session so they know what to expect. And they have at least one non-MDMA session after each MDMA one to work through the traumatic memories that were revealed and to learn coping strategies. A standard treatment course includes two or three multi-hour MDMA-assisted psychotherapy sessions and several non-MDMA sessions.

The MDMA products used in these sessions are pharmaceutical grade. This means that, unlike illicitly obtained street products, they do not contain other substances of abuse, such as methamphetamine, or contaminants like heavy metals, bacteria or mold. People with hypertension or those at high risk of heart attacks, strokes or arrhythmias should not participate, because they can have unsafe elevations in blood pressure and heart rate. In addition, patients are not allowed to leave for eight hours, until the effects of MDMA have fully worn off.


Assessing the Effectiveness of MDMA-Assisted Psychotherapy

In 2014, we reviewed the available animal data and the few preliminary human studies of MDMA-assisted psychotherapy, but at the time, higher-quality clinical trials had not yet been completed. But in the past few years, larger and higher-quality trials have been published, warranting an in-depth assessment.

So we recently reviewed the data comparing antidepressant use to placebos for patients with PTSD and performed a meta-analysis study of the six different clinical trials that assessed the usefulness of MDMA-assisted psychotherapy versus psychotherapy alone. All of the trials we analyzed included both men and women who had experienced a multitude of traumatic events that led to PTSD. The studies used the same points scale to determine the effectiveness of therapy, making it easier to compare data across studies. Scores above approximately 50 points mean a patient has severe PTSD, and scores reduced by more than 10 points from baseline are clinically meaningful.

We found that daily antidepressant therapy reduced PTSD by 6 to 14 points compared with the placebo, but a range of 27% to 47% of patients across the studies withdrew before the end of the trials. In contrast, MDMA-assisted psychotherapy reduced the scores by 22 points compared with those receiving psychotherapy with placebo, and patients were twice as likely to no longer meet the criteria for PTSD diagnosis by the end of the trials. In addition, only 8% of patients withdrew from MDMA-assisted psychotherapy trials. The main adverse effects included teeth grinding, jitteriness, headache and nausea. One of these MDMA trials found that participants’ blood pressure and heart rate were elevated in the course of MDMA therapy, but not to a concerning extent.

For several of the trials in our meta-analysis, investigators sent a questionnaire to participants 12 months after their last MDMA session to assess the long-term impact. Overall, 86% of participants said they received substantial benefits from the combined MDMA-assisted psychotherapy. Eighty-four percent of participants reported having improved feelings of well-being, 71% had fewer nightmares, 69% had less anxiety and 66% had improved sleep. The results from across all of the studies suggested that MDMA-assisted therapy was helping to alleviate the PTSD itself, not simply suppressing symptoms.


Looking Ahead

The U.S. Drug Enforcement Administration identifies MDMA and psilocybin as Schedule I controlled substances. According to the DEA, these substances have no currently accepted medical use in the U.S. and come with high abuse potential.

However, it’s worth noting an important exception. Cannabadiol, or CBD, a chemical that comes from the plant Cannabis sativa, is classified as a Schedule I drug. But the Food and Drug Administration approved its use in 2018 for the treatment of two rare and severe childhood seizure disorders. That doesn’t mean that the CBD in your lotion or seltzer has proof of benefit for most of the ills people are using it for, but its full therapeutic potential is still being explored. Given the strong consistent beneficial effects and manageable adverse events in the newer trials designed with FDA input, we suspect that MDMA-assisted psychotherapy will become an FDA-approved option for PTSD by the end of 2023. Psilocybin – commonly known as hallucinogenic mushrooms – also shows promise for treating major depression, but further research is needed.

The DEA’s stringent policies made it exceptionally hard for scientists to conduct research on Schedule I drugs for decades by criminalizing the possession of the products, even in research settings. But in 2018, the agency streamlined the application process for securing a waiver for research purposes. This made it easier for researchers to conduct trials into the pharmaceutical value of psychedelic drugs. Within the next decade, this shift will almost certainly accelerate the discovery of new treatments for patients suffering from mental illness.


Suggested Content


Psychedelic Medicine a Revolution for the Mind


Psychedelic Laws and Investments May Follow Cannabis’ Success


Acceptance of Psychedelics for Wellness and Recreation


Psychedelics, the Next Breakthrough in Mental Health Treatment (Video)


Stay up to date. Follow us:


Cumulus Media (CMLS) – Undervalued In Spite Of The Recent Move

Tuesday, April 26, 2022

Cumulus Media (CMLS)
Undervalued In Spite Of The Recent Move

CUMULUS MEDIA, Inc. (NASDAQ: CMLS) is a leading audio-first media and entertainment company delivering premium content to over a quarter billion people every month — wherever and whenever they want it. CUMULUS MEDIA engages listeners with high-quality local programming through 428 owned-and-operated stations across 87 markets; delivers nationally-syndicated sports, news, talk, and entertainment programming from iconic brands including the NFL, the NCAA, the Masters, the Olympics, the GRAMMYS, the American Country Music Awards, and many other world-class partners across nearly 8,000 affiliated stations through Westwood One, the largest audio network in America; and inspires listeners through its rapidly growing network of original podcasts that are smart, entertaining and thought-provoking. CUMULUS MEDIA provides advertisers with local impact and national reach through on-air, digital, mobile, and voice-activated media solutions, as well as access to integrated digital marketing services, powerful influencers, and live event experiences. CUMULUS MEDIA is the only audio media company to provide marketers with local and national advertising performance guarantees.

Michael Kupinski, Director of Research, Noble Capital Markets, Inc.

Patrick McCann, Research Associate, Noble Capital Markets, Inc.

Refer to the full report for the price target, fundamental analysis, and rating.

    NobleCon 18 highlights Frank Lopez-Balboa, CFO, and Collin Jones, Corporate Development, held a fireside chat and outlined its operational and debt reduction strategy. In addition, management highlighted an improved financial profile given a rebounding advertising environment. A replay of the company’s presentation may be found here.

    Recovery at full speed.  Management declared that advertising is recovering beyond pre-pandemic levels, thanks to emerging categories such as sports betting and crypto currencies, as well as a strong comeback in entertainment and finance ad categories. These trends offset auto, which is not expected to be rebound now until 2023. Additionally, in 2022, political revenue is expected to surpass the …


This research is provided by Noble Capital Markets, Inc., a FINRA and S.E.C. registered broker-dealer (B/D).

*Analyst certification and important disclosures included in the full report. NOTE: investment decisions should not be based upon the content of this research summary. Proper due diligence is required before making any investment decision. 


Release – Schwazze Announces Virtual Town Hall Meeting


Schwazze Announces Virtual Town Hall Meeting

Research, News, and Market Data on Schwazze


DENVER, Colo.April 25, 2022 /CNW/ – Schwazze, (OTCQX: SHWZ) (NEO: SHWZ) (“Schwazze” or the “Company”), is pleased to announce that Justin Dye, Chairman & CEO will present to investors in a live VID Forum Town Hall on Tuesday, April 26, 2022, at 11:00 am EST. Management will field Q&A from investors and interested parties after their presentation. Please sign up here to register.

The Webinar will be interactive and will be hosted by VID Conferences.  All stakeholders and interested investors are welcome to tune in and participate with questions. The playback will then be available on the Company’s website.

About Schwazze
Schwazze (OTCQX: SHWZ) (NEO: SHWZ) is building a premier vertically integrated regional cannabis company with assets in Colorado and New Mexico and will continue to take its operating system to other states where it can develop a differentiated regional leadership position. Schwazze is the parent company of a portfolio of leading cannabis businesses and brands spanning seed to sale. The Company is committed to unlocking the full potential of the cannabis plant to improve the human condition. Schwazze is anchored by a high-performance culture that combines customer-centric thinking and data science to test, measure, and drive decisions and outcomes. The Company’s leadership team has deep expertise in retailing, wholesaling, and building consumer brands at Fortune 500 companies as well as in the cannabis sector. Schwazze is passionate about making a difference in our communities, promoting diversity and inclusion, and doing our part to incorporate climate-conscious best practices. Medicine Man Technologies, Inc. was Schwazze’s former operating trade name. The corporate entity continues to be named Medicine Man Technologies, Inc.

Schwazze derives its name from the pruning technique of a cannabis plant to enhance plant structure and promote healthy growth.

Forward-Looking Statements
This press release contains “forward-looking statements.” Such statements may be preceded by the words “plan,” “will,” “may,”, “predicts,” or similar words. Forward-looking statements are not guarantees of future events or performance, are based on certain assumptions, and are subject to various known and unknown risks and uncertainties, many of which are beyond the Company’s control and cannot be predicted or quantified. Consequently, actual events and results may differ materially from those expressed or implied by such forward-looking statements. Such risks and uncertainties include, without limitation, risks and uncertainties associated with (i) our inability to manufacture our products and product candidates on a commercial scale on our own or in collaboration with third parties; (ii) difficulties in obtaining financing on commercially reasonable terms; (iii) changes in the size and nature of our competition; (iv) loss of one or more key executives or scientists; (v) difficulties in securing regulatory approval to market our products and product candidates; (vi) our ability to successfully execute our growth strategy in Colorado and outside the state, (vii) our ability to consummate the acquisition described in this press release or to identify and consummate future acquisitions that meet our criteria, (viii) our ability to successfully integrate acquired businesses and realize synergies therefrom, (ix) the ongoing COVID-19 pandemic, * the timing and extent of governmental stimulus programs, (xi) the uncertainty in the application of federal, state and local laws to our business, and any changes in such laws, and * out ability to satisfy the closing conditions for the private finding described in this press release. More detailed information about the Company and the risk factors that may affect the realization of forward-looking statements is set forth in the Company’s filings with the Securities and Exchange Commission (SEC), including the Company’s Annual Report on Form 10-K and its Quarterly Reports on Form 10-Q. Investors and security holders are urged to read these documents free of charge on the SEC’s website at http://www.sec.gov. The Company assumes no obligation to publicly update or revise its forward-looking statements as a result of new information, future events or otherwise except as required by law.

View original content to download multimedia:https://www.prnewswire.com/news-releases/schwazze-announces-virtual-town-hall-meeting-301531590.html

SOURCE Medicine Man Technologies, Inc.

Release – Ocugen Inc. Announces Positive DSMB Recommendation For OCU400-101 Clinical Trial


Ocugen, Inc. Announces Positive DSMB Recommendation For OCU400-101 Clinical Trial

Research, News, and Market Data on Ocugen


PHASE 1/2 STUDY TO ASSESS THE SAFETY AND EFFICACY OF OCU400 MODIFIER GENE THERAPY CANDIDATE TO TREAT RETINITIS PIGMENTOSA ASSOCIATED WITH NR2E3 AND RHO MUTATIONS

MALVERN, Pa., April 25, 2022 (GLOBE NEWSWIRE) — Ocugen, Inc. (NASDAQ: OCGN), a biotechnology company focused on discovering, developing, and commercializing novel gene therapies, biologicals and vaccines, announced today that the independent Data and Safety Monitoring Board (DSMB) for its Phase 1/2 clinical trial of OCU400, the Company’s flagship modifier gene therapy candidate for the treatment of Retinitis Pigmentosa (RP), reviewed safety data based on dosing to date and recommended that the study proceed with enrolling additional subjects.

The OCU400-101 clinical study to assess the safety and efficacy of modifier gene therapy candidate OCU400 for RP resulting from mutations in the nuclear receptor subfamily 2 group E member 3 (NR2E3) and Rhodopsin (RHO) genes recently dosed its first patient. The DSMB recommended that the Company continue enrolling the remaining study subjects in this current cohort at the target dose level.

Ocugen’s modifier gene therapy platform targets nuclear hormone receptors (NHRs) that regulate multiple functions within the retina, giving it the potential to address many different gene mutations – and in turn, multiple retinal diseases – with a single product. Traditional gene therapy, which transfers a functional version of a non-functional gene into target cells, addresses only one individual gene mutation at a time.

“It’s a positive first step that the DSMB review of the current OCU400-101 study results identified no serious adverse events and recommended that the study proceed with enrollment,” said Mark Pennesi, MD, PhD, Professor of Ophthalmology and Chief of the Paul H. Casey Ophthalmic Genetics Division, Oregon Health & Science University, and member of Ocugen’s Retina Scientific Advisory Board. “We’re looking forward to understanding how this modifier gene therapy platform could treat inherited retinal degeneration, potentially bringing an option to people affected with this disease.”

About Ocugen, Inc.
Ocugen, Inc. is a biotechnology company focused on discovering, developing, and commercializing novel gene therapies, biologicals and vaccines that improve health and offer hope for people and global communities. We are making an impact through courageous innovation, taking science in new directions in service of patients. Our breakthrough modifier gene therapy platform has the potential to treat multiple diseases with one drug and we are advancing research in other therapeutic areas to offer new options for people with unmet medical needs. Discover more at www.ocugen.com and follow us on Twitter and LinkedIn.

Cautionary Note on Forward-Looking Statements
This press release contains forward-looking statements within the meaning of The Private Securities Litigation Reform Act of 1995, which are subject to risks and uncertainties. We may, in some cases, use terms such as “predicts,” “believes,” “potential,” “proposed,” “continue,” “estimates,” “anticipates,” “expects,” “plans,” “intends,” “may,” “could,” “might,” “will,” “should” or other words that convey uncertainty of future events or outcomes to identify these forward-looking statements. Such forward-looking statements include information about qualitative assessments of available data, potential benefits, expectations for clinical trials, and anticipated timing of clinical trial readouts and regulatory submissions, including with respect to our Phase 1/2 trial included in our Investigational New Drug application to the U.S. Food and Drug Administration (FDA) for OCU400, which is actively enrolling patients following review of preliminary safety data by the independent Data and Safety Monitory Board. This information involves risks and uncertainties that could cause actual results to differ materially from those expressed or implied by such statements. Risks and uncertainties include, among other things, the uncertainties inherent in research and development, including the ability to meet anticipated clinical endpoints, commencement and/or completion dates for clinical trials, regulatory submission dates, regulatory approval dates and/or launch dates, as well as risks associated with preliminary and interim data, including the possibility of unfavorable new clinical trial data and further analyses of existing clinical trial data; the risk that the results of in-vitro studies will not be duplicated in human clinical trials; the risk that clinical trial data are subject to differing interpretations and assessments, including during the peer review/publication process, in the scientific community generally, and by regulatory authorities; and the risk that the Orphan Drug Designations from the FDA and broad Orphan Medicinal Product Designation from the European Commission for OCU400 may not result in a faster approval timeline for OCU400 or increase the likelihood of any such approvals These and other risks and uncertainties are more fully described in our periodic filings with the Securities and Exchange Commission (SEC), including the risk factors described in the section entitled “Risk Factors” in the quarterly and annual reports that we file with the SEC. Any forward-looking statements that we make in this press release speak only as of the date of this press release. Except as required by law, we assume no obligation to update forward-looking statements contained in this press release whether as a result of new information, future events or otherwise, after the date of this press release.

Ocugen Contact:
Ken Inchausti
Head, Investor Relations & Communications
ken.inchausti@ocugen.com

Please submit investor-related inquiries to: IR@ocugen.com

Information Services (III) – NobleCon 18 Presentation

Monday, April 25, 2022

Information Services (III)
NobleCon 18 Presentation

ISG (Information Services Group) (Nasdaq: III) is a leading global technology research and advisory firm. A trusted business partner to more than 700 clients, including more than 70 of the top 100 enterprises in the world, ISG is committed to helping corporations, public sector organizations, and service and technology providers achieve operational excellence and faster growth. The firm specializes in digital transformation services, including automation, cloud and data analytics; sourcing advisory; managed governance and risk services; network carrier services; strategy and operations design; change management; market intelligence and technology research and analysis. Founded in 2006, and based in Stamford, Conn., ISG employs more than 1,300 digital-ready professionals operating in more than 20 countries—a global team known for its innovative thinking, market influence, deep industry and technology expertise, and world-class research and analytical capabilities based on the industry’s most comprehensive marketplace data. For more information, visit www.isg-one.com

Joe Gomes, Senior Research Analyst, Noble Capital Markets, Inc.

Joshua Zoepfel, Research Associate, Noble Capital Markets, Inc.

Refer to the full report for the price target, fundamental analysis, and rating.

    NobleCon 18. ISG CEO Michael Connors and CFO Bert Alfonso presented at NobleCon18. The transformation of the Company during COVID, ISG NEXT, and potential for acquisitions were highlighted in the presentation. A rebroadcast is available here.

    A Changing Model.  The COVID environment gave ISG the ability to transform the business towards two different segments, ISG Digital and ISG Enterprise, which gave companies the ability to choose which solution is needed, whether it is for more data analytics and cyber security (Digital) or Human Resources and Accounting (Enterprise). Combined with the iFlex working structure, ISG transformed the …


This Company Sponsored Research is provided by Noble Capital Markets, Inc., a FINRA and S.E.C. registered broker-dealer (B/D).

*Analyst certification and important disclosures included in the full report. NOTE: investment decisions should not be based upon the content of this research summary. Proper due diligence is required before making any investment decision. 


Comtech (CMTL) – NobleCon 18 Presentation Notes

Monday, April 25, 2022

Comtech (CMTL)
NobleCon 18 Presentation Notes

Comtech Telecommunications Corp. engages in the design, development, production, and marketing of products, systems, and services for advanced communications solutions in the United States and internationally. It operates in three segments: Telecommunications Transmission, Mobile Data Communications, and RF Microwave Amplifiers. The Telecommunications Transmission segment provides satellite earth station equipment and systems, over-the-horizon microwave systems, and forward error correction technology, which are used in various commercial and government applications, including backhaul of wireless and cellular traffic, broadcasting (including HDTV), IP-based communications traffic, long distance telephony, and secure defense applications. The Mobile Data Communications segment provides mobile satellite transceivers, and computers and satellite earth station network gateways and associated installation, training, and maintenance services; supplies and operates satellite packet data networks, including arranging and providing satellite capacity; and offers microsatellites and related components. The RF Microwave Amplifiers segment designs, develops, manufactures, and markets satellite earth station traveling wave tube amplifiers (TWTA) and broadband amplifiers. Its amplifiers are used in broadcast and broadband satellite communication; defense applications, such as telecommunications systems and electronic warfare systems; and commercial applications comprising oncology treatment systems, as well as to amplify signals carrying voice, video, or data for air-to-satellite-to-ground communications. The company serves satellite systems integrators, wireless and other communication service providers, broadcasters, defense contractors, military, governments, and oil companies. Comtech markets its products through independent representatives and value-added resellers. The company was founded in 1967 and is headquartered in Melville, New York.

Joe Gomes, Senior Research Analyst, Noble Capital Markets, Inc.

Joshua Zoepfel, Research Associate, Noble Capital Markets, Inc.

Refer to the full report for the price target, fundamental analysis, and rating.

    NobleCon18. Comtech Telecommunications VP of Investor Relations Robert Samuel and CFO Michael Bondi presented at NobleCon18. The company’s management highlighted two of its growing markets, the next generation 911 solutions and its satellite ground station equipment. A rebroadcast is available here.

    NG911 Highlights.  In the presentation, the Company showed an emphasis in the growth of its next-gen 911 business, highlighting that it is only one of two companies in the United States that has a 911 routing service. The acquisition pipeline in this segment remains robust according to management, and we would not count out additional acquisitions in the 911 business …


This Company Sponsored Research is provided by Noble Capital Markets, Inc., a FINRA and S.E.C. registered broker-dealer (B/D).

*Analyst certification and important disclosures included in the full report. NOTE: investment decisions should not be based upon the content of this research summary. Proper due diligence is required before making any investment decision. 


Financial Protection Bureau Has New Supervisory Powers


CFPB Invokes Dormant Authority to Examine Nonbank Companies Posing Risks to Consumers


WASHINGTON, D.C. – The Consumer Financial Protection Bureau (CFPB) announced that it is invoking a largely unused legal provision to examine nonbank financial companies that pose risks to consumers. The CFPB believes that utilizing this dormant authority will help protect consumers and level the playing field between banks and nonbanks. The CFPB is also seeking public comments on a procedural rule to make this process more transparent.

“Given the rapid growth of consumer offerings by nonbanks, the CFPB is now utilizing a dormant authority to hold nonbanks to the same standards that banks are held to,” said CFPB Director Rohit Chopra. “This authority gives us critical agility to move as quickly as the market, allowing us to conduct examinations of financial companies posing risks to consumers and stop harm before it spreads.”

Under the Dodd-Frank Wall Street Reform and Consumer Protection Act of 2010, the CFPB has authority to use traditional law enforcement to stop companies from engaging in conduct that pose risk to consumers; this can involve adversarial litigation. However, the law also gives the CFPB authority to conduct supervisory examinations to review the books and records of regulated entities. CFPB examiners typically provide a report to entities with problems that need to be addressed, and responsible institutions typically take prompt corrective action.

Nonbank Supervision

For decades before the Dodd-Frank Act, only banks and credit unions were subject to federal supervision. But after the 2008 financial crisis in which nonbank companies played a pivotal role, Congress tasked the CFPB with supervising certain nonbanks, in addition to large depository institutions with more than $10 billion in assets, and their service providers. Nonbanks do not have a bank, thrift, or credit union charter; many today operate nationally and brand themselves as “fintechs.”

Congress authorized several categories of entities subject to CFPB’s nonbank supervision program. First and foremost, all nonbank entities in the mortgage, private student loan, and payday loan industries, regardless of size. Another category of supervised entities includes what the law calls “larger participants” in other nonbank markets for consumer financial products and services. The CFPB conducted rulemakings to define thresholds for entities subject to supervision in the markets of consumer reporting, debt collection, student loan servicing, international remittances, and auto loan servicing.

The third category of entities subject to the CFPB nonbank supervision are nonbanks whose activities the CFPB has reasonable cause to determine pose risks to consumers. This authority is not specific to any particular consumer financial product or service. While the CFPB did implement the provision through a procedural rule in 2013,  the agency has now begun to invoke this authority. This will allow the CFPB to be agile and supervise entities that may be fast-growing or are in markets outside the existing nonbank supervision program.

Such risky conduct may involve, for example, potentially unfair, deceptive, or abusive acts or practices, or other acts or practices that potentially violate federal consumer financial law. The CFPB may base such reasonable cause determinations on complaints collected by the CFPB, or on information from other sources, such as judicial opinions and administrative decisions. The CFPB may also learn of such risks through whistleblower complaints, state partners, federal partners, or news reports.

Transparency

The CFPB is also issuing a procedural rule today to increase the transparency of the risk-determination process. Unlike other provisions of law regarding nonbank supervision, entities subject to supervision based on risk are given notice and an opportunity to respond. In order to provide greater guidance to the marketplace on how the CFPB will make determinations, the CFPB is updating an aspect of its procedures for risk determinations to authorize the release of certain information about any final determinations made.  The company involved will have an opportunity to provide input to the CFPB on what information is released to the public.


Suggested Reading


Will Mortgage Forbearance Impact Other Markets? (April 2021)


How Much is a Trillion?


Sources

https://www.consumerfinance.gov/about-us/blog/introducing-our-new-bureau-seal/

https://www.consumerfinance.gov/


Stay up to date. Follow us:


The Trend in Currency Reserve Status and Market Impact


Image Credit: Can Pac Swire (Flickr)


Challenges to the US Dollar as a Reserve Currency and Market Impact


The percentage of US dollars used by foreign central banks as their reserve currency, has fallen dramatically in the past seven years. During this same period, a greater share of global reserves are being held in Chinese yuan. Could this shift impact US investments, including stocks and interest-bearing securities? Will US living standards suffer?

When any reserve currency, including gold, the Euro, the yuan and others, experiences increased demand, its value is enhanced. Fading demand has the impact of decreasing value which pushes upward on inflation for goods transacted in that currency. A weakening currency also demands higher interest rates to attract use. Valuations across all dollar-denominated markets may get dragged down with a declining dollar as well.


Background

The United States dollar has been the world’s primary reserve currency for over 60 years. Before the early 1970s, the dollar had been pegged to gold and most other currencies were then valued off the dollar. Since dollars are easier to work with than gold, greenbacks were used as the main intervention currency for monetary policy adjustments outside (and inside) of the US.

The establishment of the European monetary union and the euro in 1999 led to predictions of the dollar weakening. These fears were not realized. The use of the dollar as the primary reserve currency is based on the US maintaining a position as the world’s dominant economy. US dollars did not reach the position of reserve currency by world leaders somehow meeting and deciding to use dollars. Instead, it was based on trust and size of the US economy and debt market.

It does however make international transactions easier if currencies are priced to one currency.


Recent Trend

Using measurements from just before the Russian sanctions from the West, the percentage of dollars used as a currency dropped below 59% (Q4 2021).  This is down from 62% at the beginning of 2020, and 65% five years earlier in 2015. The trend toward using other currencies has recently accelerated.

The declining use of the dollar is even more dramatic when currency values are factored in. The recent strengthening of the dollar is masking a steeper drop in its “per unit” reserve status; the increase in momentum may have begun in 2018 when the US imposed tariffs on specific goods from China and a few other nations.

The euro is the second most widely-held reserve currency. It had experienced a net reduction over the last decade, but so far this decade has ticked higher. The trend seems to show that central banks are diversifying their reserve holdings.  It would not be surprising if future data shows that the war in Europe has caused a lower level of use of euros as reserves.

Rising bond yields are likely to drive flows to dollars as long as competing currency, real yields (after inflation) aren’t rising more rapidly.

Very recently the Yuan has lost value as Beijing has re-imposed strict lockdowns related to coronavirus activity.  Coupled with rising rates in the US and Europe, the Yuan should be under downward pressure.


Impact on Markets

Ordinarily, a softening yuan against US dollars would add to the two countries’ trade imbalances. Strong dollars make imports cheap. However, if production does not keep up with demand because of new lockdowns, the Chinese may not benefit from increased exports.

Inflation would be dampened somewhat on goods produced in China, but again if there is only a modest increase in imported goods from the US the inflation numbers reported will be barely impacted.

Strengthening dollars drive currency into US markets and could help support price levels during a period, like now, when there is a bearish tone due to a more hawkish monetary policy.


Take-Away

The US economy is experiencing its challenges for many different reasons. So are the other economies of the world. For this reason, central banks are diversifying. However, the US dollar is still considered to be the “risk-free” exchange medium against which others are measured. The size and scope of the US economy is likely to help the greenback retain its position, even as outside central banks decide to spread their risk around more than they have in the past.


Paul Hoffman

Managing Editor, Channelchek


Suggested Reading


Panelists Pulled No Punches at NobleCon18 Discussing ESG, Politics, Inflation, and War


The Risky Position Elon Musk is Placing Himself In


Evaluating Gold Royalty Companies to Gain Exposure to Precious Metals


How did the Stock Market Perform Under Each President?


Sources

https://data.imf.org/?sk=E6A5F467-C14B-4AA8-9F6D-5A09EC4E62A4

https://www.chinabankingnews.com/2022/04/25/chinese-renminbi-rises-as-share-of-global-reserves-as-greenback-drops-to-record-low/

https://www.bis.org/publ/qtrpdf/r_qt1812b.pdf


Stay up to date. Follow us:


Release – Lineage Announces A Fifth Cell Therapy Program Allogeneic Photoreceptor Transplants


Lineage Announces A Fifth Cell Therapy Program: Allogeneic Photoreceptor Transplants For The Treatment Of Diseases Which May Lead To Blindness

Research, News, and Market Data on Lineage Cell Therapeutics


Dynamic Culturing Process Developed by Lineage Offers Path to Clinical- and Industrial-Scale Production of Photoreceptors

CARLSBAD, Calif.–(BUSINESS WIRE)–Apr. 25, 2022– 

Lineage Cell Therapeutics, Inc.
 (NYSE American and TASE: LCTX), a clinical-stage biotechnology company developing allogeneic cell therapies for unmet medical needs, today announced a new cell therapy development program: photoreceptor neural cell (PNC) transplants for the treatment of vision loss due to photoreceptor dysfunction or damage. Similar to the company’s recently announced pipeline expansion into auditory neurons for the treatment of hearing loss, Lineage has filed for intellectual property protection covering the composition and methods for generating PNCs. Based on recent in vivo data generated using the company’s PNCs, these cells may be capable of forming reconstructed retina with high survivability and neural connectivity to surrounding functional layers. Notably, Lineage has demonstrated feasibility which could support a large-scale method for producing both types of photoreceptors, known as rods and cones.

“It is natural that, on the heels of the announcement of our alliance with Roche and 
Genentech for our RPE cell therapy, a deal worth up to 
$670 million dollars plus double-digit royalties if certain development, approval, and sales milestones are achieved and other conditions are met, that we also would pursue treatments for vision loss through the other major cell type of the retina, the photoreceptors,” stated  Brian Culley, Lineage’s CEO. “Our fundamental technology and accumulated know-how give us the opportunity to make many different cell types, and we have demonstrated our ability to create new programs rapidly and efficiently in two distinct areas, expanding our cell therapy pipeline to five separate preclinical and clinical programs, while still maintaining what we believe is an appropriate and responsible rate of investment for a company of our size. This latest program is part of our long-term planning for clinical and commercial success and serves as another example of the capability of our technology platform. We believe our ability to, in just a matter of months, advance from a product concept to generating new intellectual property and manufacturing the desired cell types, is illustrative of the power and efficiency of our platform. We believe the combination of our capital discipline and current balance sheet will support multiple years of further progress, during which we anticipate reaching achievements with each of our clinical and preclinical programs.”

Dr.  Rami Skaliter, who leads the manufacturing function for Lineage, added, “I’m exceptionally proud of the team’s success at overcoming obstacles related to the limited scale of photoreceptor production. Building upon our experience with other cell lineages, we have developed intellectual property, and filed for patent protections, on a manufacturing process which is compatible with large-scale production of photoreceptors in a closed system, improvements which could enable industrial manufacturing. We believe this accomplishment will provide new opportunities for clinical, and ultimately commercial, production of photoreceptors in areas of large unmet need such as Retinitis Pigmentosa, Stargardt’s Macular Dystrophy, and retinal detachments, either independently or through strategic alliances.”

As part of a scientific collaboration with Professors  Benjamin Reubinoff, M.D., Ph.D. and  Eyal Banin, M.D., Ph.D., of the 
Hadassah-Hebrew University Medical Center, the differentiation of pluripotent cells into photoreceptors with clinically compatible characteristics was established utilizing a novel differentiation protocol which generated positive identity of key markers of both rods and cones photoreceptor populations. The data generated by the company further demonstrated that a single cell suspension of photoreceptor precursor cells has the potential to survive and mature post-transplantation in a rodent model of retinal degeneration.

About Lineage Cell Therapeutics, Inc.

Lineage Cell Therapeutics is a clinical-stage biotechnology company developing novel cell therapies for unmet medical needs. Lineage’s programs are based on its robust proprietary cell-based therapy platform and associated in-house development and manufacturing capabilities. With this platform Lineage develops and manufactures specialized, terminally differentiated human cells from its pluripotent and progenitor cell starting materials. These differentiated cells are developed to either replace or support cells that are dysfunctional or absent due to degenerative disease or traumatic injury or administered as a means of helping the body mount an effective immune response to cancer. Lineage’s clinical programs are in markets with billion dollar opportunities and include five allogeneic (“off-the-shelf”) product candidates: (i) OpRegen, a retinal pigment epithelium transplant therapy in Phase 1/2a development for the treatment of dry age-related macular degeneration, which is now being developed under a worldwide collaboration with Roche and
Genentech, a member of the Roche Group; (ii) OPC1, an oligodendrocyte progenitor cell therapy in Phase 1/2a development for the treatment of acute spinal cord injuries; (iii) VAC2, a dendritic cell therapy produced from Lineage’s VAC technology platform for immuno-oncology and infectious disease, currently in Phase 1 clinical development for the treatment of non-small cell lung cancer (iv) ANP1, an auditory neuronal progenitor cell therapy for the potential treatment of auditory neuropathy, and (v) PNC1, a photoreceptor neural cell therapy for the treatment of vision loss due to photoreceptor dysfunction or damage. For more information, please visit www.lineagecell.com or follow the company on Twitter @LineageCell.

Forward-Looking Statements

Lineage cautions you that all statements, other than statements of historical facts, contained in this press release, are forward-looking statements. Forward-looking statements, in some cases, can be identified by terms such as “believe,” “aim,” “may,” “will,” “estimate,” “continue,” “anticipate,” “design,” “intend,” “expect,” “could,” “can,” “plan,” “potential,” “predict,” “seek,” “should,” “would,” “contemplate,” “project,” “target,” “tend to,” or the negative version of these words and similar expressions. Such statements include, but are not limited to, statements relating to (i) the potential amount of payments to Lineage under the alliance with 
Hoffman-La Roche Ltd. (“Roche”) and 
Genentech, Inc., (ii) the potential for new opportunities for clinical, and ultimately commercial, production of photoreceptors in areas of large unmet need, (iii) Lineage’s position to become a leader in the emerging field of regenerative medicine and anti-aging technology, and (iv) future areas of potential treatment using PNC transplant. Forward-looking statements involve known and unknown risks, uncertainties and other factors that may cause Lineage’s actual results, performance or achievements to be materially different from future results, performance or achievements expressed or implied by the forward-looking statements in this press release, including, but not limited to, the risk that competing alternative therapies may adversely impact the commercial potential of OpRegen, which could materially adversely affect the payments payable to Lineage under the Roche/
Genentech collaboration and license agreement, the risk that Roche/
Genentech may not be successful in completing further clinical trials for OpRegen and/or obtaining regulatory approval for OpRegen in any particular jurisdiction; the risk that Lineage might not succeed in developing products and technologies that are useful in medicine and demonstrate the requisite safety and efficacy to achieve regulatory approval in accordance with its projected timing, or at all; the risk that Lineage’s intellectual property may be insufficient to protect its assets; risks and uncertainties inherent in Lineage’s business and other risks discussed in Lineage’s filings with the 
Securities and Exchange Commission (SEC). Lineage’s forward-looking statements are based upon its current expectations and involve assumptions that may never materialize or may prove to be incorrect. All forward-looking statements are expressly qualified in their entirety by these cautionary statements. Further information regarding these and other risks is included under the heading “Risk Factors” in Lineage’s periodic reports with the 
SEC, including Lineage’s most recent Annual Report on Form 10-K and Quarterly Report on Form 10-Q filed with the 
SEC and its other reports, which are available from the SEC’s website. You are cautioned not to place undue reliance on forward-looking statements, which speak only as of the date on which they were made. Lineage undertakes no obligation to update such statements to reflect events that occur or circumstances that exist after the date on which they were made, except as required by law.

Lineage Cell Therapeutics, Inc. IR
Ioana C. Hone
(ir@lineagecell.com)
(442) 287-8963

Solebury Trout IR
Mike Biega
(Mbiega@soleburytrout.com)
(617) 221-9660

Russo Partners – Media Relations
Nic Johnson or  David Schull
Nic.johnson@russopartnersllc.com
David.schull@russopartnersllc.com
(212) 845-4242

Source: 
Lineage Cell Therapeutics, Inc.

Release – Comstock Announces First Quarter 2022 Webcast


Comstock Announces First Quarter 2022 Webcast

Research, News, and Market Data on Comstock Mining


VIRGINIA CITY, NEVADA, APRIL 25, 2022 – Comstock Mining Inc. (NYSE: LODE) (“Comstock” and the “Company”) today announced that it will host a conference call on Tuesday, May 3, 2022, at 8:00 a.m. Pacific Daylight Time (11:00 a.m. Eastern Daylight Time) to report its First Quarter 2022 results and business updates. The webcast will include a moderated question and answer session after the Company’s prepared remarks.  Please click the link below to register in advance and please join the event at least 10 minutes prior to the scheduled start time.

Once registered, you will receive a confirmation email containing information about joining the Webcast.

May 3, 2022, 08:00 AM Pacific Daylight Time / 11:00 AM Eastern Daylight Time (US and Canada)

Topic: Comstock’s Q1 2022 Results and Business Update

Please click here to register in advance for this webcast.

About Comstock 

Comstock (NYSE: LODE) innovates technologies that enable systemic decarbonization and circularity by efficiently converting under-utilized wasted and other natural resources into renewable fuels and electrification products that contribute to balancing global uses and emissions of carbon. To learn more, please visit www.comstock.inc.

Forward-Looking Statements

This press release and any related calls or discussions may include forward-looking statements within the meaning of Section 27A of the Securities Act of 1933, as amended, and Section 21E of the Securities Exchange Act of 1934, as amended. All statements, other than statements of historical facts, are forward-looking statements. The words “believe,” “expect,” “anticipate,” “estimate,” “project,” “plan,” “should,” “intend,” “may,” “will,” “would,” “potential” and similar expressions identify forward-looking statements, but are not the exclusive means of doing so. Forward-looking statements include statements about matters such as: future industry market conditions; future explorations or acquisitions; future changes in our exploration activities; future changes in our research and development; and future prices and sales of, and demand for, our products and services. Except as may be required by securities or other law, we undertake no obligation to publicly update or revise any forward-looking statements, whether as a result of new information, future events, or otherwise.

Neither this press release nor any related call or discussion constitutes an offer to sell, the solicitation of an offer to buy or a recommendation with respect to any securities of the Company, the fund or any other issuer.

  Contact information:    
Comstock Mining Inc.
P.O. Box 1118
Virginia City, NV 89440
ComstockMining.com
Corrado De Gasperis
Executive Chairman & CEO
Tel (775) 847-4755
degasperis@comstockmining.com
Zach Spencer
Director of External Relations
Tel (775) 847-5272 Ext.151
questions@comstockmining.com

Is Cannabis Tourism a Good Idea


Image credit: Indrid Cold (Flickr)


The Untapped Economic Opportunity of Cannabis Tourism


Three years into the federal legalization of cannabis in Canada, almost all the pieces are in place for the growth of a robust cannabis tourism industry – except one.

Cannabis tourism includes the variety of activities, events and places that are part of any vacation or travel plans that incorporate cannabis. What’s missing are the rules around consuming cannabis socially in public settings, highlighting a broader issue about cannabis legalization in Canada.


This article was republished with permission from The Conversation, a news site dedicated to sharing ideas from academic experts. It was written by and represents the research-based opinions of Susan Dupej, SSHRC Postdoctoral Research Fellow, Gordon E. Lang School of Business and Economics, University of Guelph.


My recent research on the cannabis industry suggests that integrating cannabis consumption into tourism will have positive social impacts toward normalization, acceptance and tolerance of cannabis.

Re-framing a once-demonized substance as a legitimate recreational resource, tourism can play an important role in challenging stigma.


What is Cannabis Tourism?

Similar to findings from the United States, preliminary Canadian market research around cannabis travel point to untapped economic opportunities for incorporating cannabis into travel experiences. This interest is likely to increase as attitudes become more open towards cannabis.

Cannabis tourism can include a variety of services and experiences, such as tour companies, booking platforms, cannabis friendly accommodations, lounges, bud-tending services, spas, consumer trade shows, specialty travel guides, retail locations, as well as events such as festivals, comedy shows and others.

In all of its forms, cannabis tourism is an educational platform for sharing different types of knowledge about growing the plant, understanding how cannabis interacts with the body, legally purchasing cannabis, the different product types available, the different ways to consume cannabis and the cultural context surrounding cannabis in different locations.


Coffeeshop Smokey is a cannabis coffee shop located in Rembrandt Square, Amsterdam


If the iconic coffee shops of Amsterdam have taught us anything it’s that the ability to purchase and consume cannabis in a lounge-type setting, without fear of reprimand by the authorities or judgement by the general public, attracts tourism.

The ability to legally consume cannabis in public for social, recreational and leisure purposes offers timely opportunities for businesses in the tourism and hospitality industry hit hard by the pandemic.

Yet, a regulation gap has prevented the development of spaces in which people can responsibly consume cannabis products. In order for the cannabis tourism industry to move forward in a socially responsible and sustainable way, regulation is required in the area of cannabis consumption.


Closing the Regulation Gap

Closing the regulatory gap around cannabis consumption requires two things.

First, legislators must set aside outdated, uninformed and mistaken ideas that associate cannabis with deviancy and illegitimate behaviour. Education has a significant role to play changing perceptions.

Second, regulation around consumption must be thought of as an extension of the cannabis supply chain in Canada.

Similar to the legal production and sale of cannabis, spaces of public consumption can be regulated through licensing. Obtaining a license would enable a business to offer patrons the option of legally consuming cannabis on premises.

One level of hospitality licensing could include the on-site consumption of pre-packaged foods and beverages, which would allow an individual to purchase an edible at a café or lounge and consume it at the same establishment.

Another layer of licensing could address temporary events, such as concerts and festivals, with designated outdoor consumption areas for combustibles. Licensing also needs to address infused food and beverages prepared and served by restaurants.


A Global Leader in Cannabis Tourism?

Regulations are a great way to promote Canada as a safe destination to experience cannabis and entice the global travel audience. Beyond economic benefits, regulating cannabis consumption supports the government’s own objectives of reducing risk and supporting public health.

Most significantly, Canada is in a position to be a global leader in setting an international precedent for socially responsible and informed policy for an historically stigmatized and misunderstood substance.

But, a vibrant cannabis tourism industry in Canada is being held back by a lack of clear and meaningful rules. Regulations enabling public cannabis consumption will open up a new frontier for cannabis in Canada and, at the same time, push forward a socially responsible and progressive agenda for tourism that benefits tourists and citizens alike.


Suggested Content


The Risky Position Elon Musk is Placing Himself In


Psychedelic Medicine a Revolution for the Mind


GABY Inc. NobleCon18 Presentation


Schwazze  NobleCon18 Presentation


Stay up to date. Follow us:


Release – Palladium One Announces Mineral Resource Estimate for the LK PGE-Cu-Ni Project


Palladium One Announces Mineral Resource Estimate for the LK PGE-Cu-Ni Project

Research, News, and Market Data on Palladium One Mining


1.1 Million Ounces Total Precious Metals, 111 Million Pounds Copper, 92 Million Pounds Nickel and 5 Million Pounds Cobalt in Indicated AND 1.1 million Ounces Total Precious Metals, 173 Million Pounds Copper, 152 Million Pounds Nickel and 8 Million Pounds Cobalt in Inferred

Toronto, Ontario–(Newsfile Corp. – April 25, 2022) – Palladium One Mining Inc. (TSXV: PDM) (OTCQB: NKORF) (FSE: 7N11) (the “Company” or “Palladium One“) is pleased to announce an updated Indicated and Inferred Mineral Resource Estimate (“MRE”) prepared the Company under the supervision of SLR Consulting (Canada) Ltd. (formerly Roscoe, Postle Associates Inc.) disclosed in accordance with National Instrument 43-101 (“NI43-101”) for the 100%-owned Läntinen Koillismaa (“LK”) Project in north-central Finland (Figure 1).

“We are pleased to report important milestones that measurably de-risk our LK PGE-Cu-Ni Project in Finland. Namely, a) a maiden Mineral Resource Estimate at Kaukua South and Murtolampi which increases the Kaukua Area’s indicated resources tonnes by approximately 250%; b) advanced metallurgical testing conducted by SGS (Lakefield) which demonstrates consistently repeatable metallurgical recoveries; and c) the ability to produce both a high-value copper and nickel concentrate using a conventional flotation recovery process.

“These milestones substantially improve the economic potential by confirming scale and by delivering clarity of recovery rates for various rock types.

“With a grade of 30% copper in the copper concentrate and a value of approximately US$4,200 per tonne for the nickel concentrate, both are highly marketable, which bodes well for future concentrate marketing negotiations.

“While continued exploration in 2022 to increase the size of LK is ongoing, we have accelerated baseline environmental studies and plan to advance a Preliminary Economic Assessment (“PEA”).

“The bulk of 2022’s exploration efforts are expected to be in Canada and directed to the award winning Tyko Ni-Cu Project. Once drill permits are received, we plan to drill test several multi-line VTEM anomalies where highly anomalous soil sample values of copper nickel and cobalt were discovered in 2021. To date, additional drill permits have not been received,” commented Derrick Weyrauch, President and CEO.

Highlights

In addition to the Mineral Resource Estimate (“MRE”) which used US$1,700/oz palladium (Table 1a, 2b), a sensitivity analysis was completed with seven optimized open-pit constrained resource estimates, with palladium prices ranging from US$900/oz to US$2,500/oz (Table 2a, 2b).

Mineral Resource Estimate

  • 1.1 million ounces Total Precious Metals (Pd+Pt+Au) (“TMP”) (0.89 g/t), 111 Million Pounds Copper (0.13%), 92 Million Pounds Nickel (0.11%) and 5 million Pounds Cobalt (65 g/t) are classified as Indicated, contained in 38.2 million tonnes (see Table 1b).
  • 1.1 million ounces TMP (0.68 g/t), 173 Million Pounds Copper (0.16%), 152 Million Pounds Nickel (0.14%) and 8 million Pounds Cobalt (74 g/t) are classified as Inferred, contained in 49.7 million tonnes (see Table 1b).
  • 248% increase in Indicated tonnes and a 14% increase in Inferred tonnes.
  • 44% of the MRE is in the Indicated category.
  • A waste to ore ratio (“Strip Ratio”) of 1.48:1 in the Kaukua Area (including Murtolampi) and a 0.58:1 Strip Ratio at Haukiaho.
  • The MRE assumes a Net Smelter Return (“NSR”) cut-off of US$12.50 per tonne, based on a 20,000 tonne per day milling rate.
  • Includes three open-pits in the Kaukua Area (including Murtolampi) and one at Haukiaho, 10-kilometers to the south of Kaukua.
  • Recovered, and payable metal assumptions are based on the 2022 Phase II Metallurgical Testing Program, and preliminary indicative copper and nickel smelter quotes.

Future Resource Expansion

  • LK remains open for additional resource expansion both along strike and at depth.
    • The MRE covers approximately 5 kilometers of the 38-kilometer marginal series contact zone, for which reconnaissance historical drilling indicated mineralization along nearly it’s entire length.
    • The Company’s near-term targeting includes two additional open-pit targets in the Kaukua Area and possibly multiple open-pit targets along the 17-kilometer Haukiaho Trend.
    • Three areas of Target Potential have been defined for near term resource expansion representing an additional 2.4-kilometer of strike length along the favourable marginal series and could add between 21.6 million and 36.0 million tonnes of resource. Refer to Table 3, Figures 4 & 5.

2022 Phase II Metallurgical Testing Program

  • The Phase II Metallurgical Testing Program demonstrates the ability to produce BOTH a high-value copper AND a high-value nickel concentrate (“Con”) utilizing conventional 3-stage flotation.
  • The Cons were readily and consistently reproduced.
  • Locked Cycle Test results:
    • Locked Cycle Bulk Concentrate recoveries: 73.5% Pd, 56.1% Pt, 73.0% Au, 88.6% Cu, 30.3% Ni, and 18.6% Co (Table 5).
    • Copper Concentrate: Grades of 30.0% Cu, 1.43% Ni, 0.1% Co, 38.3 g/t Pd, 13.1 g/t Pt, 11.2 g/t Au representing a value of US$6,300 per tonne of concentrate (Table 6).
    • Nickel Concentrate: Grades of 4.8% Ni, 3.9% Cu, 0.2% Co, 40.8 g/t Pd, 11.0 g/t Pt, 2.9 g/t Au representing a value of US$4,200 per tonne of concentrate.
    • Rhodium values up to 1.7 g/t and 1.0 g/t were reported in both the Nickel and Copper Concentrates respectively, while the MRE does not include rhodium values.
    • Fortunately, both Cons are high in iron and sulfur and low in MgO, thereby improving marketability.
    • A low mass pull of 1.2% was achieved, thereby suggestive of low transportation charges.

Other

  • In aggregate, there is 38 million tonnes of Indicated and 50 million tonnes of inferred in resources, thereby providing the opportunity for a large tonnage long-life mine to be developed.
  • The LK project has excellent infrastructure with paved roads, power, skilled labour and is less than 180 kilometers from the port of Oulu, thereby providing the opportunity for reduced initial capital cost estimates.

Mineral Resource Estimate:

Table 1a. 2022 LK MRE

MINERAL RESOURCE ESTIMATE – April 2022
Tonnes & Grade – US$1,700 Pd per oz

Strip Ratio Tonnes (Mt) Pd Pt Au TPM Cu Ni Co
(g/t) (g/t) (g/t) (g/t) (%) (%) (g/t)
Indicated


Kaukua Area 1.50 38.2 0.61 0.22 0.07 0.89 0.13 0.11 64.56
Inferred


Kaukua Area +Murtolampi 1.45 30.8 0.52 0.20 0.08 0.80 0.14 0.14 86.07
Haukiaho 0.58 18.9 0.27 0.11 0.10 0.48 0.18 0.14 54.30
Total Inf. 1.26 49.7 0.43 0.17 0.09 0.68 0.16 0.14 73.98


Table 1b: 2022 LK MRE In-situ contained metal

MINERAL RESOURCE ESTIMATE – April 2022
Contained Metal – US$1,700 Pd per oz

Strip Pd Pt Au TPM Cu Ni Co
Ratio (M oz) (M oz) (M oz) (M oz) (M lbs) (M lbs) (M lbs)
Indicated


Kaukua Area 1.50 0.74 0.26 0.08 1.09 110.7 91.6 5.4
Inferred


Kaukua Area +Murtolampi 1.45 0.52 0.20 0.07 0.79 96.5 93.9 5.8
Haukiaho 0.58 0.16 0.07 0.06 0.29 76.4 57.5 2.3
Total Inf. 1.26 0.68 0.26 0.14 1.08 172.9 151.5 8.1


Notes

  1. CIM (2014) definitions were followed for Mineral Resources.
  2. The Mineral Resources have been reported above a preliminary open pit constraining surface using a Net Smelter Return (NSR) pit discard cut-off of US$12.5/t (which for comparison purposes equates to an approximately 0.65 g/t Palladium Equivalent in-situ cut-off, based on metal prices only).
  3. The NSR used for reporting is based on the following:
    1. Long term metal prices of US$ 1,700/oz Pd, US$ 1,100/oz Pt, US$ 1,800/oz Au, US$ 4.25/lb Cu, US$ 8.50/lb Ni and US$ 25/lb Co.
    2. Variable metallurgical recoveries for each metal were used at Kaukua and Murtolampi and fixed recoveries of 79.8% Pd, 80.1% Pt, 65% Au, 89% Cu, 64% Ni and 0% Co at Haukiaho.
    3. Commercial terms for a Cu and Ni concentrate based on indicative quotations from smelters.
  4. Total Precious Metals (TPM) equals palladium plus platinum plus gold.
  5. Bulk densities range between 1.8 and 3.23 t/m3.
  6. Numbers may not add up due to rounding.
  7. Mineral Resources, which are not Mineral Reserves, do not have demonstrated economic viability. The estimate of mineral resources may be materially affected by environmental, permitting, legal, title, taxation, sociopolitical, marketing, or other relevant issues.
  8. The quantity and grade of reported inferred resources in this estimation are conceptual in nature and there has been insufficient exploration to define these inferred resources as an indicated or measured mineral resource and it is uncertain if further exploration will result in upgrading them to an indicated or measured mineral resource category.

Palladium Equivalent (PdEq)

Palladium equivalent (“PdEq”) is calculated using US$1,700 per ounce for palladium, US$1,100 per ounce for platinum, US$1,800 per ounce for gold, US$4.25 per pound for copper, US$8.50 per pound for nickel, and $25 per pound cobalt consistent with the calculation used in the Company’s current Mineral Resource Estimate for the LK project. PdEq was used for wireframe construction and metallurgical test work only, and does not include metallurgical recoveries or smelter terms, and was not used for generation of the conceptual pit shells or Mineral Resource reporting. The Mineral Resource tabulation is based on a unit NSR value which includes metal prices, metallurgical recoveries and contract terms for Ni and Cu concentrates.

Mineral Resource Estimation Methodology

The Kaukua/Murtolampti drillhole database comprises 210 drillholes for a total of 44 km drilling. The Haukiaho drillhole database comprises a further 84 drillholes for a total of 13,392.3 m drilling . An updated 3D geological model has been constructed using Leapfrog software version (Figure 4).

Kaukua

For Kaukua, Key lithological units modelled include the basement gabbro and granodiorite as well as the intrusive or Marginal Series pyroxenite, peridotite and gabbronorite units. Major controlling structures have been used to split the deposit into three zones with subsidiary faults, major stratigraphic units, diabase dykes and the overburden modelled within these four zones. Faults outline the Pit, Gap and South Zones (sub-domains of the Kaukua deposit). A topographic surface has been generated using Lidar data.

Grade shells have been modelled at 0.3 g/t and 0.6 g/t PdEq thresholds using the vein system modelling in Leapfrog Geo within the geological constraints as determined.

Capping was completed on assays prior to compositing. A composite length of 6 m has been used, with the composites within each mineralized domain assessed for the need to apply grade caps. Continuity analysis (variography) has been completed on the composited samples within the various mineralization domains with the resultant variograms checked against the mineralization domain to ensure geological consistency.

A block model has been constructed in Hexagon Minesight software using a 6 m (X) by 6 m (Y) by 6 m (Z) block size. No sub-celling or rotation of the block model has been undertaken.

The block model has been coded by lithology and mineralization domain for each element. The later, cross-cutting diabase dykes and overburden have been coded into the block model with the grades for Pd, Pt, Cu, Ni, Co and Au set to background values in the block model.

The estimation of grade has been undertaken in two interpolation passes using ordinary kriging, with the 0.6 g/t PdEq mineralization wireframes used as firm-boundaries during the estimation. Dynamic anisotropy was used to accommodate local changes in dip and strike of the mineralization. Each subsequent interpolation pass has used an increased search ellipse size and a decrease in the minimum number of samples required:

  • Pass 1 estimations have been undertaken using a minimum of three and a maximum of 8 composites into a 120 m x 120 m x 60 m search ellipse, with a maximum of 2 composites per drillhole,

  • Pass 2 estimations have been undertaken using a minimum of one and a maximum of 8 composites into a 200 m x 200 m x 60 m search ellipse, with a maximum of one composite per drillhole,

Final grade estimates for Pd, Pt, Ni, Cu, Co and Au have been validated by statistical analysis and visual comparison to the input drillhole composite data. The estimated Pd, Pt, Cu, Ni, Co and Au grades validate within acceptable limits to the input declustered composite grades. Therefore, the block model accurately reproduces the input grades at a global scale. Swath plots show that there are negligible local biases. Change of support validation shows that the kriged model grades contain a suitable amount of internal dilution for the anticipated mining selectivity.

Blocks were classified as Indicated and Inferred in accordance with CIM Definition Standards 2014. Blocks were classified to the Inferred category if the block fell within 80 m of a composite. Indicated category blocks were classified using a drill-spacing of 50 x 50 m in the Pit area and 100 x 50 m in the South area.

Murtolampi

A grade shell has been modelled at a 0.3 g/t PdEq threshold using the vein system modelling in Leapfrog Geo within the geological constraints as determined.

Capping was completed on assays prior to compositing. A composite length of 6 m has been used, with the composites within each mineralized domain assessed for the need to apply grade caps. The variogram modelled for Kaukua was used at Murtolampti as there are an insufficient number of composites to model a robust variogram.

A block model has been constructed in Hexagon Mineplan software using a 6 m (X) by 6 m (Y) by 6 m (Z) block size. No sub-celling or rotation of the block model has been undertaken.

The block model has been coded by lithology and mineralization domain for each estimation of grade has been undertaken in two interpolation passes.

The estimation of grade has been undertaken in two interpolation passes using ordinary kriging. Anisotropy directions were selected based on the geometry of the mineralization. Each subsequent interpolation pass has used an increased search ellipse size and a decrease in the minimum number of samples required:

  • Pass 1 estimations have been undertaken using a minimum of three and a maximum of 8 composites into a 120 m x 120 m x 60 m search ellipse, with a maximum of 2 composites per drillhole,

  • Pass 2 estimations have been undertaken using a minimum of one and a maximum of 8 composites into a 200 m x 200 m x 60 m search ellipse, with a maximum of one composite per drillhole,

Final grade estimates for Pd, Pt, Ni, Cu, Co and Au have been validated by statistical analysis and visual comparison to the input drillhole composite data. The estimated Pd, Pt, Cu, Ni, Co and Au grades validate within acceptable limits to the input declustered composite grades. Therefore, the block model accurately reproduces the input grades at a global scale. Swath plots show that there are negligible local biases.

Haukiaho

Key lithological units modelled include the basement, gabbro/peridotite/pyroxenite and diabase. A fault divides the mineralization into eastern and western blocks. A topographic surface has been generated using Lidar data.

A grade shell has been modelled at a 0.25 g/t PdEq thresholds using the vein system modelling in Leapfrog Geo within the geological constraints as determined.

Capping was completed on assays prior to compositing. Several historic drillholes are missing Au, Pt and Pd assays. Linear regression (RMA) with high correlation coefficients against Cu and Ni assays has been used to assign Au, Pt and Pd grades to these drillholes. A composite length of 5 m has been used, with the composites within each mineralized domain assessed for the need to apply grade caps.

A block model has been constructed in Hexagon Mineplan software using a 10 m (X) by 10 m (Y) by 10 m (Z) block size. No sub-celling or rotation of the block model has been undertaken.

The block model has been coded by lithology and mineralization domain for each element. The later, cross-cutting diabase dykes and overburden have been coded into the block model with the grades for Pd, Pt, Cu, Ni, Co and Au set to background values in the block model.

The estimation of grade has been undertaken using inverse-distance weighting to the power of three in two interpolation passes, with the 0.25 g/t Pd-equivalent mineralization wireframes used as a hard-boundary during the estimation. Dynamic anisotropy was used to accommodate local changes in dip and strike of the mineralization. Each subsequent interpolation pass has used an increased search ellipse size and a decrease in the minimum number of samples required:

  • Pass 1 estimations have been undertaken using a minimum of three and a maximum of 8 composites into a 200 m x 200 m x 50 m search ellipse, with a maximum of 2 composites per drillhole,

  • Pass 2 estimations have been undertaken using a minimum of two and a maximum of 8 composites into a 300 m x 300 m x 50 m search ellipse, with a maximum of two composites per drillhole,

Final grade estimates for Pd, Pt, Ni, Cu, Co and Au have been validated by statistical analysis and visual comparison to the input drillhole composite data. The estimated Pd, Pt, Cu, Ni, Co and Au grades validate within acceptable limits to the input declustered composite grades. Therefore, the block model accurately reproduces the input grades at a global scale. Swath plots show that there are negligible local biases. Change of support validation shows that the kriged model grades contain a suitable amount of internal dilution for the anticipated mining selectivity.

Blocks were classified as Inferred in accordance with CIM Definition Standards 2014. Blocks were classified to the Inferred category if the block fell within 120 m of a composite.

Table 2a: 2022 LK MRE Sensitivity to Palladium Price – Grade

SENSITIVITY TO CUTOFF GRADE – Mineral Resource Estimate – March 2022

Pd Price Strip Tonnes (Mt) Pd Pt Au TPM Cu Ni Co
(US$/oz) Ratio (g/t) (g/t) (g/t) (g/t) (%) (%) (g/t)

$ 900 1.69 26.8 0.67 0.24 0.08 0.98 0.14 0.12 67.9
Total Indicated $1,400 1.54 35.2 0.62 0.22 0.07 0.91 0.13 0.11 65.2

$1,600 1.51 37.3 0.61 0.22 0.07 0.90 0.13 0.11 64.8

$1,700 1.50 38.2 0.61 0.22 0.07 0.89 0.13 0.11 64.6

$1,800 1.48 39.1 0.60 0.21 0.07 0.88 0.13 0.11 64.4

$2,000 1.54 46.5 0.58 0.21 0.06 0.85 0.12 0.11 65.6

$2,500 1.44 55.3 0.55 0.19 0.06 0.80 0.12 0.11 66.4
Total Inferred $ 900 1.39 31.2 0.47 0.18 0.10 0.75 0.18 0.15 75.2
$1,400 1.29 43.8 0.44 0.17 0.09 0.70 0.16 0.14 74.4
$1,600 1.27 47.7 0.43 0.17 0.09 0.69 0.16 0.14 74.0
$1,700 1.26 49.7 0.43 0.17 0.09 0.68 0.16 0.14 74.0
$1,800 1.24 51.2 0.42 0.16 0.09 0.67 0.16 0.14 73.5
$2,000 1.30 56.6 0.42 0.16 0.08 0.67 0.15 0.14 73.7
$2,500 1.23 68.1 0.40 0.15 0.08 0.64 0.15 0.13 73.2


Notes:

  1. Total Precious Metals (TPM) equals palladium plus platinum plus gold.
  2. Only the Palladium Price is varied, all other commodity prices remained fixed at the 2022 MRE price deck.
  3. Each Palladium price point is tabulated using a conceptual pit specific to that price point.

Table 2b: 2020 LK MRE Sensitivity to Palladium Price – contained metals

RESOURCE SENSITIVITY TO PALLADIUM PRICE (US$ / OZ)
IN-SITU CONTAINED METAL- Mineral Resource Estimate – March 2022

Pd Price Strip Pd Pt Au TPM Cu Ni Co
(US$/oz) Ratio (M oz) (M oz) (M oz) (M oz) (M lbs) (M lbs) (M lbs)
Total Indicated $ 900 1.69 0.58 0.21 0.07 0.85 83.3 67.9 4.0
$1,400 1.54 0.70 0.25 0.08 1.03 104.4 85.6 5.1
$1,600 1.51 0.73 0.26 0.08 1.07 108.8 89.9 5.3
$1,700 1.50 0.74 0.26 0.08 1.09 110.7 91.6 5.4
$1,800 1.48 0.75 0.27 0.08 1.11 112.5 93.4 5.5
$2,000 1.54 0.87 0.31 0.09 1.27 127.0 112.1 6.7
$2,500 1.44 0.97 0.34 0.11 1.42 143.8 133.6 8.1
Total Inferred $ 900 1.39 0.47 0.19 0.10 0.75 120.6 102.8 5.2
$1,400 1.29 0.62 0.24 0.13 0.99 158.9 137.4 7.2
$1,600 1.27 0.66 0.26 0.13 1.06 169.7 147.4 7.8
$1,700 1.26 0.68 0.26 0.14 1.08 172.9 151.5 8.1
$1,800 1.24 0.70 0.27 0.14 1.11 179.1 156.2 8.3
$2,000 1.30 0.77 0.30 0.15 1.21 192.6 170.9 9.2
$2,500 1.23 0.88 0.34 0.17 1.39 220.8 200.6 11.0


Notes:

  1. Total Precious Metals (TPM) equals palladium plus platinum plus gold.
  2. Only the Palladium Price is varied, all other commodity prices remained fixed at the 2022 MRE price deck.
  3. Each Palladium price point is tabulated using a conceptual pit specific to that price point.

Table 3: 2022 LK Target Potential

LK Target Potential – April 2022
Target Potential

Tonnes Low (Mt) Tonnes High (Mt) TPM Low TPM High Cu Low Cu High Ni Low Ni High
(g/t) (g/t) (%) (%) (%) (%)
Kaukua Far East 8.1 13.5 0.6 0.9 0.09 0.13 0.08 0.12
Haukiaho East 13.5 22.5 0.4 0.6 0.12 0.19 0.09 0.15
Total 21.6 36.0 0.5 0.7 0.11 0.17 0.09 0.14


Table 4: Commodity Price Assumptions used in the MRE

COMMODITY PRICES – Mineral Resource Estimate – April 2022

Unit of Measure 3-Year Trailing Average (1) 2-Year Trailing Average (1) Spot Price (2) Prices Used in Mineral Resource Estimation Percentage of Spot Price
Palladium US$/oz $ 2,132 $ 2,305 $ 2,358 $ 1,700 72%
Platinum US$/oz $ 964 $ 1,007 $ 1,011 $ 1,100 109%
Gold US$/oz $ 1,713 $ 1,829 $ 1,947 $ 1,800 92%
Copper US$/lbs $ 3.42 $ 3.82 $ 4.67 $ 4.25 91%
Nickel US$/lbs $ 7.73 $ 8.43 $ 15.04 $ 8.50 57%
Cobalt US$/lbs $ 19.39 $ 21.71 $ 37.11 $ 25 67%


(1) Source: As of April 19, 2022. As quoted on the LBMA & LME for precious & base metals, respectively.
(2) Source: S&P Capital IQ. 2026 estimates used as a proxy.

Metallurgical testing (2022 Phase II program) results:

  • Variability testing for five main lithologies and a Master Composite of similar grade to the Kaukua resource area was conducted.
  • Results:
    • Concentration by conventional floatation produces a saleable bulk concentrate with no deleterious elements, irrespective of lithology.
    • A clean, high value saleable Copper Concentrate can be produced.
    • A clean, high value saleable Nickel-PGE Concentrate can be produced.

A detailed floatation metallurgical program was conducted by the Company on the Kaukua & Kaukua South deposits. Both deposits posses very similar geology and mineralization, and bulk sample of approximately 1 metric tonne from 22 holes comprising both Upper and Lower Zone mineralization was shipped to SGS Lakefield in Canada in summer of 2021. This sample was blended to produce a representative composite sample of the Lower Zone mineralization with grade of 1.66 g/t PdEq (0.63 g/t Pd, 0.22 g/t Pt, 0.10 g/t Au, 0.13% Cu, 0.14% Ni, 88 g/t Co) (Table 5). In additional, ten individual samples (five high and five low grade) consisting of the four dominant rock types that comprise the Lower zone plus a fifth for the Upper zone were analysed for variability testing.

Results from the current metallurgical program have highlighted very consistently reproducible recovery rates form the Kaukua/Kaukua South mineralization. Copper and PGE recovery being only slightly affected by changes in grade, only nickel recovery is significantly affected by grade, as the percentage of silicate nickel increases as grade decreases.

Historical test work in 2011 on the Kaukua deposit was also performed by SGS Lakefield. This earlier composite sample had a similar bulk composition to the current metallurgical sample but was higher grade 2.38 g/t PdEq (0.94 g/t Pd, 0.31 g/t Pt, 0.08 g/t Au, 0.22% Cu, and 0.20% Ni). Results from this earlier test were consistent with result from the current test and further confirm the consistency of the floatation recovery.

In addition to a Bulk Con, a split copper and nickel con were produced. Both of which are highly saleable (Table 6). The Copper Con is particularly high-grade with 30% Cu and high PGEs. The Copper Con represents 30% by weight of the Bulk Con with the Nickel Con comprising 70%. In addition, the Bulk Con had a low 1.2% mass pull, and low deleterious elements including <6% MgO in the nickel concentrate.

The LK project is located 160 north east of the Port City of Oulu, thereby significantly decreasing potential shipping costs. In addition, Finland has domestic copper and nickel smelting capacity further potentially reducing shipping costs.

Table 5: Locked Cycle Test Results for Lower Zone Composite Sample.

LOCKED CYCLE METALLURGICAL TEST RESULTS – April 2022
Products Mass Assay % Distribution/Recovery

Pull
%
Pd g/t Pt g/t Au g/t Cu % Ni % Co % Pd Pt Au Cu Ni Co
Cu Cleaner Con 0.35 38.3 13.1 11.2 30.0 1.43 0.1 21.0 18.8 45.2 67.9 3.4 2.0
Ni 3rd Cleaner Con 0.82 40.8 11.0 2.9 3.9 4.85 0.2 52.5 37.3 27.8 20.7 27.0 16.6
Calc. Bulk Con 1.17 40.1 11.6 5.4 11.7 3.83 0.2 73.5 56.1 73.0 88.6 30.3 18.6
Rougher Con (1) 13.1 3.85 1.11 0.57 1.08 0.46 81.6 64.7 79.8 94.0 39.8
Sample Head
100 0.63 0.24 0.09 0.15 0.15 0.01 100 100 100 100 100 100


(1) The Rougher Con is from an Open Circuit test for comparison purposes, as Rougher Con results are not available from the Locked Cycle test as it is continuously recirculated.
(2) The Nickel recovery is lower than previous test work in 2011 which used a higher grade (2.38 g/t PdEq) composite sample due to a higher percentage of silicate nickel present in the current more representative lower grade (1.66 g/t PdEq) composite sample.

Concentrate Grades from Locked-Cycle Testwork:

Table 6: Concentrate Grades and Value from Locked Cycle Test

CONCENTRATE GRADES – April 2022

Unit of Measure Bulk Concentrate Grade (1) Copper Concentrate Grade (2) Nickel Concentrate Grade (3) Bulk Concentrate Value (1) Copper Concentrate Value (2) Nickel Concentrate Value (3)
Palladium g/t 40.1 38.3 40.8 $2,189 $2,093 $2,230
Platinum g/t 11.6 13.1 11.0 $411 $463 $389
Gold g/t 5.4 11.2 2.9 $312 $648 $170
Copper % 11.7 30.0 3.9 $1,095 $2,811 $365
Nickel % 3.83 1.43 4.85 $718 $268 $909
Cobalt g/t 0.2 0.1 0.2 $94 $55 $110
Rhodium (4) g/t 1.5 1.0 1.7 $479 $322 $547
PdEq (5) g/t 88.2 116.0 76.4


$ Value (5) US$/t


$4,819 $6,339 $4,173


(1) Represents aggregate concentrate produced.
(2) Represents preferential copper segregation form the Bulk Concentrate.
(3) Represents the remaining Bulk concentrate less the Copper Concentrate extracted.
(4) Rhodium was not consistently analyzed for; these values represent select analysis of nickel and copper concentrates; a price of $10,000/oz was used for purpose of this table for information purposes only.
(5) PdEq and Concentrate Value is calculated using metal price only for information purposes, it does not include Rhodium and is calculated using the current resource price deck of $1,700 US oz Pd, $1,100 US oz Pt, $1,800 US oz Au, $4.25 US lb Cu, $8.50 US lb Ni, and $25 US lb Co.

Methodology:

A resource average master composite was created with representative samples from the four lithologies containing both high- and low-grade samples. The flowsheet developed produced separate Cu and Ni concentrates and the results were confirmed in a locked cycle test which simulates plant conditions. The results of the locked cycle test are presented in Table 1.

Indicative quotations were obtained from smelters for the concentrates produced. Using those terms, the overall smelter returns which include payable metal in addition to treatment and refining charges for metal recovered to the concentrates using a split Nickel and Copper Cons were, Cu 80.3%, Ni 41.8%, Pd 85.3%, Pt 77.3% and Au 79.6%.

In addition to the locked cycle test on the master composite, open circuit tests of 10 variability samples representing the four lithologies of the master composite plus a composite for the Upper Zone were conducted utilizing the flowsheet developed. The results from all tests produced quality concentrates with a very consistent rougher recovery relationship of each metal to its feed grade. The relationships established were used to estimate the rougher recovery from the resource. The rougher recovery relationship combined with the locked cycle test cleaner recovery was used to determine the overall metal recovery. The smelter return for each metal was applied to the overall recovery to determine revenue.
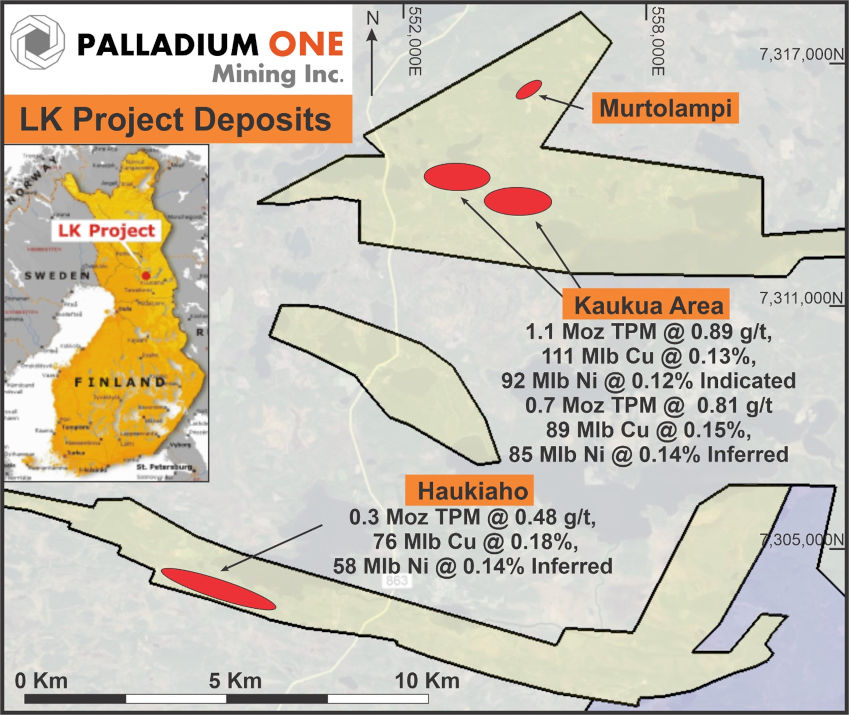
Figure 1 – Location map of LK Project and Open Pit Mineral Resources (red ellipses). The yellow shaded area represents the outer property boundary of the LK Project, and include both Exploration Permits and Permit Applications. The Blue shaded area represents the Company’s adjoining KS Project. TPM represents in-situ Total Precious Metals (Pd + Pt + Au). UTM grid datum is ETRS 35Fin, Zone 35W.

>
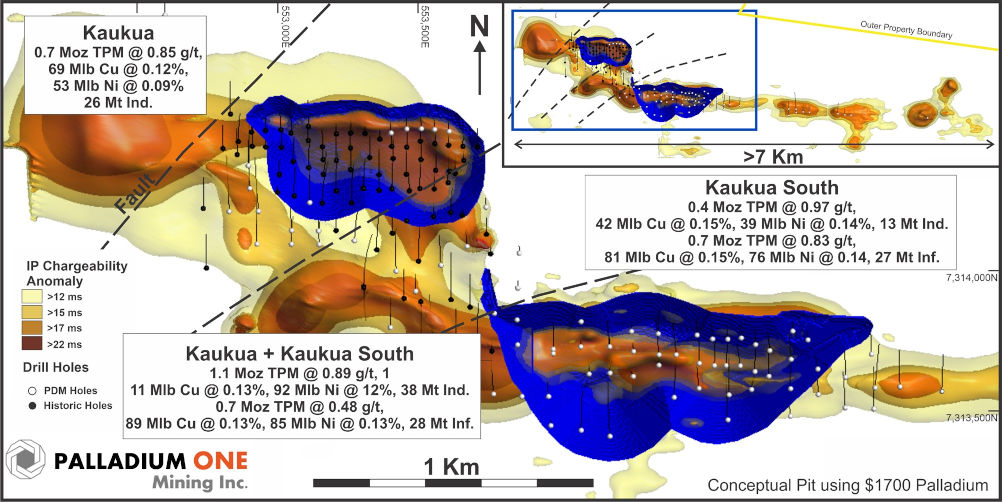
 

Figure 2 – Kaukua Area showing conceptual open pits superimposed on IP chargeability with both historical and Palladium One drill holes. TPM represents in-situ Total Precious Metals (Pd + Pt + Au).
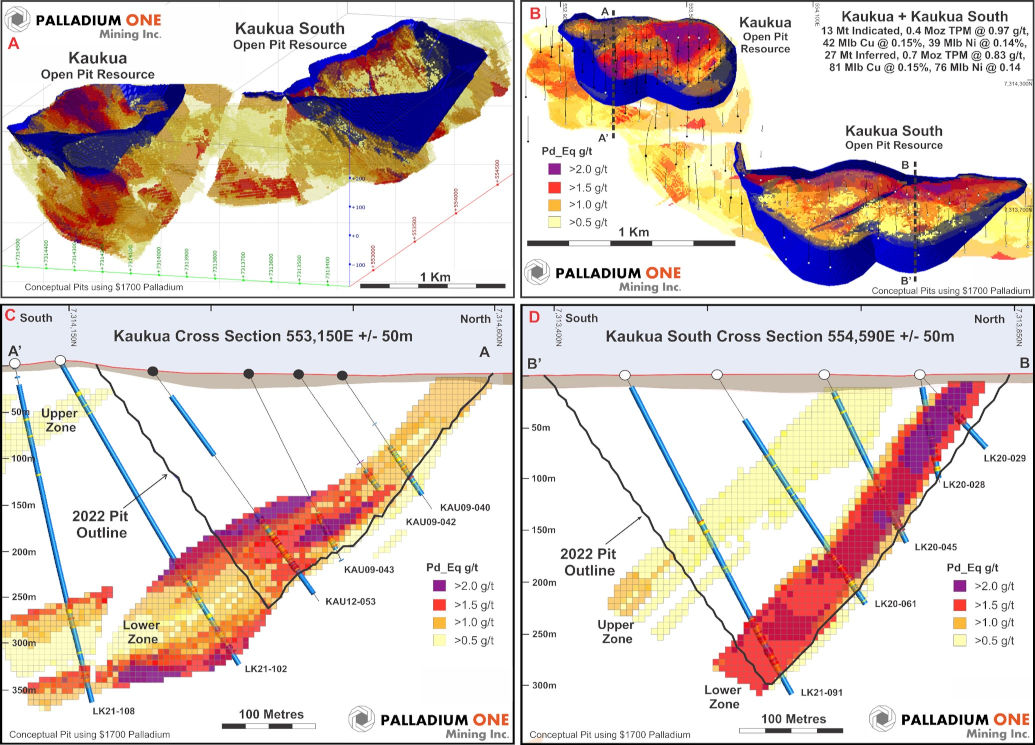
 

Figure 3 – A Isometric view looking to the northeast, Kaukua Area pits superimposed on the block model. B Plan view of the Kuakua Area pits superimposed on the block model and showing cross section locations. TPM represents in-situ Total Precious Metals (Pd + Pt + Au). C Cross section A-A’ looking west of the Kaukua pit showing drilling and the block model. D Cross section B-B’ looking west of the Kaukua South pit showing drilling and the block model.
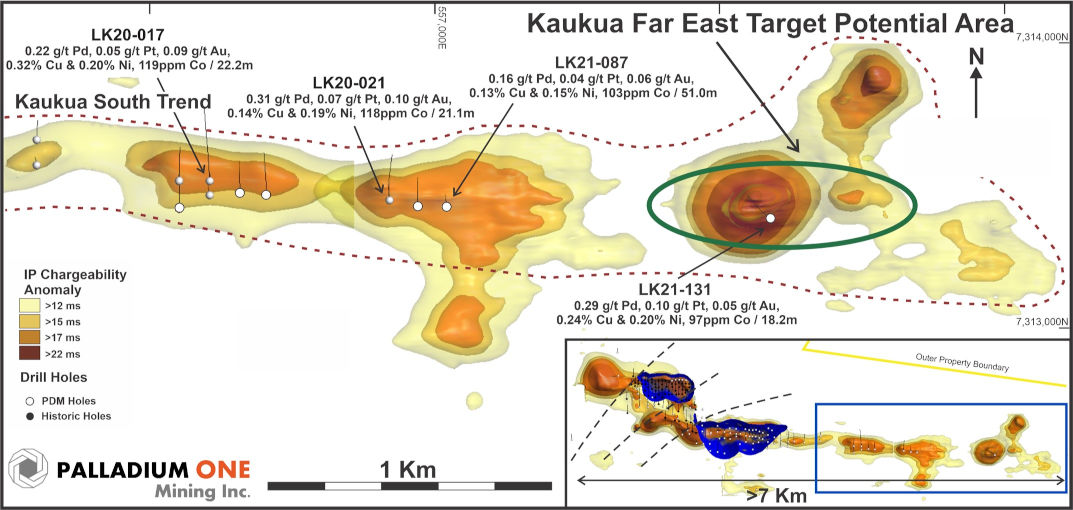
 

Figure 4. Kaukua Area showing eastern extension of the Kaukua South trend with Target Potential areas outlined in green.
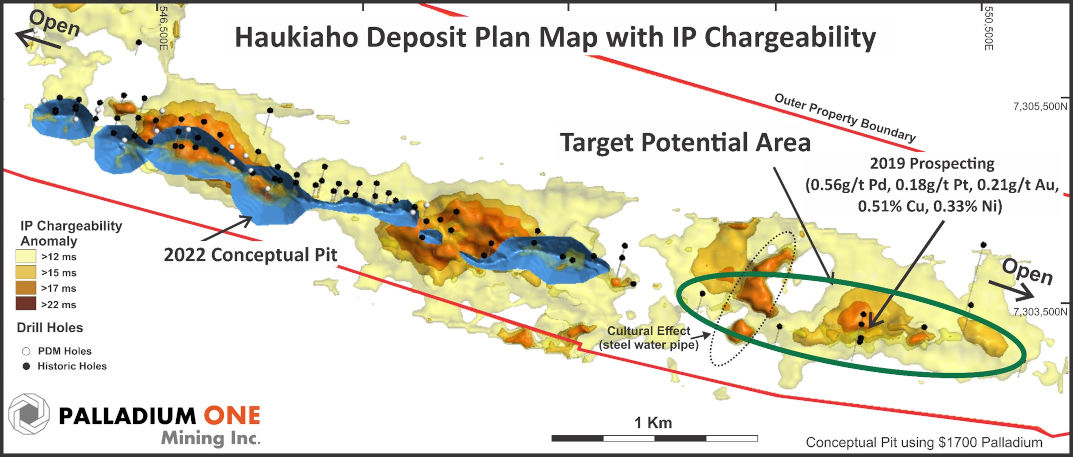
 

Figure 5. Huakiaho area with current conceptual open pit (blue) and Target Potential areas outlined in green.

Qualified Person

The Mineral Resource Estimate was prepared by the Company under the supervision of Mr. Sean Horan, P.Geo., Technical Manager of Geology at SLR Consulting Ltd., based in Toronto, Ontario, Canada. Mr. Horan is an Independent Qualified Person as defined by NI 43-101. The Mineral Resource Estimate in this news release has been classified in accordance with CIM Definition Standards on Mineral Resources and Mineral Reserves (May 14, 2014). Mr. Horan has read and approved the contents of this news release, as it relates to the disclosed Mineral Resource Estimate.

For the purposes of this news release, Mr. Neil Pettigrew, M.Sc., P. Geo., Vice President of Exploration and a director of the Company is the designated non-Independent Qualified Person and has reviewed and approved the scientific and technical information in this news release.

About Palladium One

Palladium One Mining Inc. (TSXV: PDM) is focused on discovering environmentally and socially conscious Metals for Green Transportation. A Canadian mineral exploration and development company, Palladium One is targeting district scale, platinum-group-element (PGE)-copper-nickel deposits in leading mining jurisdictions. Its flagship project is the Läntinen Koillismaa (LK) Project in north-central Finland, which is ranked by the Fraser Institute as one of the world’s top countries for mineral exploration and development. LK is a PGE-copper-nickel project that has existing Mineral Resources. PDM’s second project is the 2020 Discovery of the Year Award winning Tyko Project, a high-grade sulphide, copper-nickel project located in Canada. Follow Palladium One on LinkedIn, Twitter, and at www.palladiumoneinc.com.

ON BEHALF OF THE BOARD
“Derrick Weyrauch”
President & CEO, Director

For further information contact:
Derrick Weyrauch, President & CEO
Email: 
info@palladiumoneinc.com

Neither the TSX Venture Exchange nor its Market Regulator (as that term is defined in the policies of the TSX Venture Exchange) accepts responsibility for the adequacy or accuracy of this release.

This press release is not an offer or a solicitation of an offer of securities for sale in the United States of America. The common shares of Palladium One Mining Inc. have not been and will not be registered under the U.S. Securities Act of 1933, as amended, and may not be offered or sold in the United States absent registration or an applicable exemption from registration.

Information set forth in this press release may contain forward-looking statements. Forward-looking statements are statements that relate to future, not past events. In this context, forward-looking statements often address a company’s expected future business and financial performance, and often contain words such as “anticipate”, “believe”, “plan”, “estimate”, “expect”, and “intend”, statements that an action or event “may”, “might”, “could”, “should”, or “will” be taken or occur, or other similar expressions. By their nature, forward-looking statements involve known and unknown risks, uncertainties and other factors which may cause our actual results, performance or achievements, or other future events, to be materially different from any future results, performance or achievements expressed or implied by such forward-looking statements. Such factors include, among others, risks associated with project development; the need for additional financing; operational risks associated with mining and mineral processing; fluctuations in palladium and other commodity prices; title matters; environmental liability claims and insurance; reliance on key personnel; the absence of dividends; competition; dilution; the volatility of our common share price and volume; and tax consequences to Canadian and U.S. Shareholders. Forward-looking statements are made based on management’s beliefs, estimates and opinions on the date that statements are made and the Company undertakes no obligation to update forward-looking statements if these beliefs, estimates and opinions or other circumstances should change. Investors are cautioned against attributing undue certainty to forward-looking statements.

Release – Kratos Awarded Contract to Deliver OneWeb Spectrum Monitoring System for its LEO Satellite Constellation


Kratos Awarded Contract to Deliver OneWeb Spectrum Monitoring System for its LEO Satellite Constellation

Research, News, and Market Data on Kratos Defense & Security Solutions


SAN DIEGO
April 25, 2022 (GLOBE NEWSWIRE) — 
Kratos Defense & Security Solutions, Inc. (Nasdaq: KTOS), a leading National Security Solutions provider, announced today that it has been awarded a contract to deliver an advanced spectrum monitoring system for OneWeb to monitor, analyze and review the utilized spectrum to support high quality of service for its fleet of Low Earth Orbit (LEO) constellations.

The system will monitor the spectrum used between its global network of Satellite Network Portal (SNP) gateways and its constellation of LEO satellites. The OneWeb Spectrum Monitoring System (OSMS) will help staff monitor, manage and analyze this spectrum, the radio frequencies that satellite signals travel over.

“With our fleet of LEO satellites that will deliver on our mission to provide space connectivity around the world, it is critical for us to monitor and manage the RF spectrum to ensure that we are delivering on our service performance targets,” stated  David Price, Vice President, Access Layer Program at OneWeb. “We are working with Kratos, experts in RF monitoring, measurement and analysis to design, build and integrate the system into our ground operations.”

The OSMS will incorporate Kratos’ industry-leading, integrated spectrum monitoring capabilities to enable real-time management of Radio Frequency (RF) usage and to monitor compliance with frequency transmission regulations. As part of the contract, Kratos is responsible for designing, developing, and installing the OSMS and integrating the system with OneWeb’s ground segment.

At the heart of the OSMS LEO monitoring solution, Kratos will deploy a big data processing, storage and analytics platform for satellite operations. The system will retrieve, store, and access the spectrum traces captured at each antenna during a satellite pass. The RF data across all gateway sites will be consolidated through the OSMS to enable OneWeb’s Network Operations staff to centrally monitor, review,s and analyze the spectrum.

“The OSMS is being built to address the need to monitor very fast-moving LEO satellites and scale to the needs of OneWeb’s fleet of satellites. The Kratos technology used in the OSMS can retrieve, process, and store the high volume of data at almost one gigabit per second on the ground,” explained  Bruno Dupas, President of 
Kratos Communications in 
France. “Kratos and OneWeb are working together to successfully deploy the OSMS, one of the most advanced spectrum monitoring systems for LEO constellations in the industry.”

About Kratos Defense & Security Solutions

Kratos Defense & Security Solutions, Inc. (NASDAQ:KTOS) develops and fields transformative, affordable technology, platforms and systems for United States National Security related customers, allies and commercial enterprises. Kratos is changing the way breakthrough technology for these industries are rapidly brought to market through proven commercial and venture capital backed approaches, including proactive research and streamlined development processes. At Kratos, affordability is a technology and we specialize in unmanned systems, satellite communications, cyber security/warfare, microwave electronics, missile defense, hypersonic systems, training, combat systems and next generation turbo jet and turbo fan engine development. For more information go to www.KratosDefense.com.

Notice Regarding Forward-Looking Statements
Certain statements in this press release may constitute “forward-looking statements” within the meaning of the Private Securities Litigation Reform Act of 1995. These forward-looking statements are made on the basis of the current beliefs, expectations and assumptions of the management of Kratos and are subject to significant risks and uncertainty. Investors are cautioned not to place undue reliance on any such forward-looking statements. All such forward-looking statements speak only as of the date they are made, and Kratos undertakes no obligation to update or revise these statements, whether as a result of new information, future events or otherwise. Although Kratos believes that the expectations reflected in these forward-looking statements are reasonable, these statements involve many risks and uncertainties that may cause actual results to differ materially from what may be expressed or implied in these forward-looking statements. For a further discussion of risks and uncertainties that could cause actual results to differ from those expressed in these forward-looking statements, as well as risks relating to the business of Kratos in general, see the risk disclosures in the Annual Report on Form 10-K of Kratos for the year ended 

December 26, 2021, and in subsequent reports on Forms 10-Q and 8-K and other filings made with the 
SEC by Kratos.

Press Contact:
Yolanda White
858-812-7302 Direct

Investor Information:
877-934-4687
investor@kratosdefense.com 

Source: Kratos Defense & Security Solutions, Inc.