Release – Comstock Mining Announces Full Second Quarter 2020 Results


Comstock Mining Extinguishes Senior Secured Debenture Via Favorable Refinancing

Virginia City, NV (August 17, 2020) Comstock Mining Inc. (the “Company”) (NYSE American: LODE) filed its Quarterly Report on Form 10-Q last week and announced selected strategic and financial results for the fiscal quarter ended June 30, 2020, including the arrival and assembly of our first mercury remediation system.


Recent 2020 Selected Strategic Highlights
• Extinguished the current Senior Secured Debenture from a combination of $0.9 million in accelerated cash proceeds from Tonogold and new, unsecured promissory notes, with favorable, extended terms;
• Investments in Tonogold Resources Inc. (“Tonogold”) valued at $10.4 million at June 30, 2020, a $1.6 million increase in fair market value driving positive net income for the three months ended June 30, 2020;
• Investment in Mercury Clean Up LLC (“MCU”) increased to $1.75 million (in cash and stock) at June 30, 2020, with on-site installation of the Comstock mercury remediation system underway (pictured below);
• Extended agreements for the sale of Comstock’s two non-mining properties in Silver Springs, NV, for total expected proceeds of $10.1 million, with the closings expected this quarter; and
• Consummated the April acquisition of 25% of PELEN LLC, owner of the historic Sutro Tunnel Company.


Second Quarter 2020 Selected Financial Highlights
• Total operating costs were $1.3 million in Q2 2020, a $0.2 million or a 15.9% improvement over Q2 2019;
• Interest expense was $0.1 million in Q2 2020, a $0.1 million or a 49.6% improvement over Q2 2019;
• Other income, net was $2.2 million, primarily driven by gains of $1.6 million on equity investments in Tonogold and $0.4 million on the contingent forward assets receivable still committed to us by Tonogold;
• Net income was $1.3 million, or $0.05 per share for three-months ended June 30, 2020, as compared to a prior period net loss of $2.1 million, or ($0.13) loss per share, driven by investment gains and lower costs;
• Net income was $1.0 million, or $0.04 per share for six-months ended June 30, 2020, as compared to a prior period net loss of $3.9 million, or ($0.24) loss per share, driven by investment gains and lower costs; and
• Cash and cash equivalents at June 30, 2020, were $1.0 million.

Mr. Corrado DeGasperis, Executive Chairman and CEO stated, “We have grown and strengthened our balance sheet, extinguished our secured debt, and deployed and installed the first MCU – Comstock system as we prepare for material testing within the boundaries of the Carson River Mercury Superfund Site (“CRMSS”). We have also reserved shipping containers as we prepare to ship our first international unit to the Philippines.”

The entire press release can be read here:
https://www.comstockmining.com/latest-developments/comstock-mining-announces-full-second-quarter-2020-results-increased-strategic-investment-values-drives-positive-net-income-deploying-mercury-systems/

Contact information for Comstock Mining Inc.:

Corrado De Gasperis
Executive Chairman & CEO
Tel (775) 847-4755
[email protected]

1200 American Flat Rd
PO Box 1118
Virginia City, NV 89440
http://www.comstockmining.com

Zach Spencer
Director of External Relations
Tel (775) 847-5272 ext.151
[email protected]

Eliminating the Con-Fusion


Expect Today’s Nuclear Technologies to Provide an Important Role in the Future of Energy

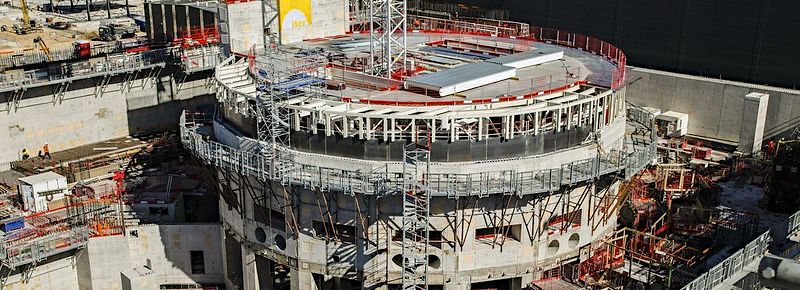
The International Thermal Experimental Reactor (ITER) Project is the first large-scale nuclear fusion project and is being financed by the European Union, United Kingdom, China, India, Russia, Japan, South Korea, and the United States. The $25 billion project entered its five-year assembly phase in July and aims to produce sustainable fusion energy on a commercial scale. Unlike nuclear fission, a technology used for conventional nuclear reactors, nuclear fusion produces four times as much energy without the risk of meltdowns and little waste.  

Nuclear Fusion Versus Fission

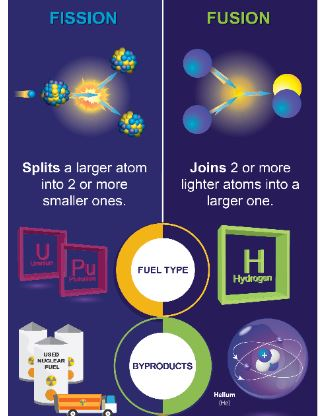
Fusion plants can be fueled by hydrogen and do not rely on radioactive materials. The illustration below, sourced from an infographic sourced from the Office of Nuclear Energy, summarizes some key differences.

Source: U.S. Department of Energy

Despite many years of research, making nuclear fusion commercially viable has been a technical challenge given the difficulty in reliably generating enough energy from the reactions.

Shrinking the Carbon-Free Footprint

The ITER project has inspired private enterprises, both large and small, to explore fusion generation technology on a smaller scale. Last week, Chevron Corp. announced an investment in Zap Energy Inc., joining Italy’s ENI and Norway’s Equinor who have also announced investments in nuclear fusion startups to reduce their carbon footprint. Meanwhile, conventional nuclear technology is advancing to overcome its chief objections, namely, preventing the risk of a meltdown and solutions to reduce or dispose of the radioactive spent fuel. Policymakers are reviewing the feasibility of microreactors and small modular reactors that can generate 20 megawatts to 300 megawatts of electricity. Large scale nuclear reactors can generate 300 megawatts to 1,000 megawatts of power. Nuclear is a carbon free source of electricity and, in terms of power density as measured by watts per square meter, has a smaller footprint than some renewables, including wind farms. According to the Nuclear Energy Institute, wind farms require up to 360 times as much land area to produce the same amount of electricity as a nuclear facility, while solar photovoltaic facilities require up to 75 times the land area.

The Take-Away

The nuclear power industry offers significant potential for innovation and could be a critical part of the solution to curb carbon dioxide emissions and global warming. Big ideas, like the International Thermal Experimental Reactor, may help in advancing nuclear technology as private enterprise grasps for pragmatic solutions for both nuclear fission and fusion. Public policy is also crucial to leveling the playing field. For example, coal-fired and natural gas-fired generation facilities that emit greenhouse gases are not penalized, while nuclear power facilities are not rewarded for producing carbon-free electricity.  A carbon tax, that puts a price on emissions, or a cap-and-trade program are ideas that may help level the playing field among alternative sources of power generation. Rather than going all in on renewables, the public interest may be better served by exploring alternatives and promoting innovation among all sources of energy.  


Suggested Reading:

Carbon-Free
Nuclear Energy Expectations Through 2050

Is M&A Picking up
in Energy Sector

Exploration and
Production Second Quarter Review and Outlook

Each event in our popular Virtual Road Shows Series has maximum capacity of 100 investors online. To take part, listen to and perhaps get your questions answered, see which virtual investor meeting intrigues you here.


Sources:

ITER,
The World’s Largest Nuclear Fusion Project: A Big Step Forward
, Forbes, Ariel Cohen, August 7, 2020.

World’s
Largest Nuclear Fusion Project Begins Assembly in France
, The Guardian, Damian Carrington, July 28, 2020.

A
Giant Fusion Reactor Hotter than the Sun to Provide Unlimited Clean Energy
Without Waste Marks Milestone
, Good News Network, Andy Corbley, August 10, 2020.

ITER: World’s
Largest Nuclear Fusion Project Begins Assembly
, BBC, Paul Rincon, July 28, 2020.

Fission
and Fusion: What is the Difference, Infographic
, Office of Nuclear Energy, U.S. Department of Energy, May 7, 2018.

INFOGRAPHIC:
The Flexibility of Nuclear
, Office of Nuclear Energy, U.S. Department of Energy.

Land
Needs for Wind, Solar Dwarf Nuclear Plant’s Footprint
, Nuclear Energy Institute, July 9, 2015.

2019 Advanced
Nuclear Map: Getting to Zero Emissions by 2050
, Third Way, John Milko, Jackie Kempfner and Todd Allen, October 17, 2019.

Oil
Major Chevron Invests in Nuclear Fusion Startup Zap Energy
, Reuters, August 12, 2020.

Picture: ITER Site, tokamak building

Investing and Trading Skills


Investing, Gambling, and Trading (Which are you Doing?)


“Oh, that’s gambling,” my mom said. We were talking about an investment I recommended to her two months earlier. She had followed my recommendation to purchase the security, which closely follows gold prices. It went up. In fact, I checked it while on the call and saw it was up 13.7%. The last time I had a conversation with my mom, it was even higher at 19.2%. Gold then retraced a bit after its strong run. For those that pay attention to these markets, the recent dip was not unexpected. I was happy with the position, mom was confused. “Why didn’t you have me sell it,” she asked?”


I had recommended the security purchase as an investment, not as a trade. The added diversity it brought to my parent’s portfolio, and perceived downside risk was why I suggested it. Those elements hadn’t changed. It still represents a good position relative to all the factors that went into this decision for them. Additionally, in my mind, there is no asset with a more compelling story that I’d replace it with right now, including cash. Especially considering the joint account owners are both in their eighties. As an investment, there is always a risk of loss, but it is not a gamble in the way rolling dice is. I should mention that the position wasn’t put on as a trading play. There have been and will be future transactions (trades) involved, but we weren’t trading this stock, they are invested in it. After all, these are retirement assets.


Today, many people use the terms investing and trading interchangeably. They’re both different activities and gambling is completely separate from each of them. There is a bit of overlap. All three seek to increase wealth. Two try to increase wealth by price movement, these two are investing and trading, they are not the same and require different skills and knowledge.


Investing

Accumulated capital that has been allocated to assets with the intent of growth and producing profit is financial investing. The return on investment is generally expected to come from income or price appreciation. The expectation of a return over time in excess of the initial outlay is key to investments. At times this return will be positive; if the investment goes as expected, the return can, of course, also be negative. Seldom will it be unchanged.


There is risk with investing. This risk is commonly linked with potential rewards and is measured against a time horizon.  Using real estate as an example, before purchasing an investment property, the investor may try to determine what the risk is that the property sits unrented, what is the risk of the value declining, what are the risks that cost of ownership increases beyond expected rental income, etc.. Investments in stocks, bonds, and funds have their own sets of risks. The primary investment risk is, “what if the investment is worth less than the cost at the time when I anticipate using the money for non-investment purposes.” Within that risk are all the nuances driving the market up and down, the impact of all the elements affecting the sector, and the time you will hold the investment. There is also the consideration of the universe of other options and which would create the best risk-adjusted return over the expected holding period.


Maximizing return at the end of the holding period should be the primary goal of investors. If they find themselves in the position, as many gold investors just did, where the asset jumps 10-20%, it then deserves to be reevaluated with the question, “Is there now a better place for this capital?” This is the same for investments that are not performing or underperforming. Part of investing is looking at nonperforming and holdings that are underwater and asking if it is still the best place for the capital. Seeking return by evaluating holdings, understanding alternatives to each holding, and working to maximize risk-adjusted return is investing.


Trading

More frequent transactions, such as the buying and selling of stocks, commodities, or even flipping houses, fall under the category of trading. The trader could be using the same vehicles as the investor to attempt to increase wealth. But the decision to buy has a limit in that they are looking for quick short-term moves in the asset. Traders of stock, commodities, and real estate are looking for these faster price moves with a goal of returns that outperform buy-and-hold investing. The skill includes awareness that the money committed is not an investment; it is instead the most important tool to generate income. The “tool” needs to be protected through risk management. A trader without money is no longer a trader; they are out of business. This is one reason a good trader has a time horizon – a bad trade should never become a long-term investment.


High-frequency traders look to earn incrementally over many trades during the course of the day.  They have a plan to manage the winners to exceed the losers in dollars they generate. Low-frequency traders may monitor the market for long periods of time before uncovering a setup they believe fits their description of a high probability trade.

Trading can potentially return much more than investing. Deciding when investments are most likely to move, rather than ride ups and downs, is often from a series of calculated speculations which fit a tested methodology of that trader. The trader, like the investor, has to be aware of changes that increase risk without adequate reward adjustment when comparing one trade over another.


Gambling

Wagering, betting or gambling, means risking money on an event that has an uncertain outcome and relies more on chance than does investing or trading. One big difference from investing is that gambling very often has a known outcome probability, both direction, and magnitude. These are called odds (50/50, 1,000,000/1, etc.). There are no firm odds for investors or traders. There could be a history of performance, but no mathematical outcomes that all participants are subject to.

Investors and traders, like the gambler, may also benefit from luck, but when done right, trading and investment decisions are based on expectations that don’t in any way include chance.


Take-Away

Whether you’re investing, gambling, or trading, it is important to have a plan. The plan should involve money management skills. For the investor, they should seek to move into another position when their holdings no-longer offer the best risk-adjusted return expectation. Traders should execute when the trade needs to be entered or exited. Win or lose, money management is key to a trader’s survival. Without capital, there is no trading, that would put them out of business. This can be said of gambling as well. Professional gamblers are able to continue only as long as they have money in which to play their game of choice. The average person that gambles by purchasing a lottery ticket is spending a few bucks, writing off the entry fee almost immediately as they spend it. They’ve purchased a fantasy that can last until they check their success. A raffle ticket, lottery, or spin of the wheel at a Church picnic is viewed as a donation. There are few who view their own gambling as investing and trading. Alternatively, there are many who transact with brokerage accounts acting on hunches and guesses who are leaving too much to chance. Successful investors and traders are more deliberate, more methodical. Hunches are not part of their evaluation.


As an aside, the account my mom spoke to me about is an investment account. She is going to hold onto her gold position until something else makes more sense to replace it.  She is not a trader. However, her gambling luck is top-notch. Last year she won a $50,000 Mercedes in a Church raffle.  Perhaps her exclaiming “that’s gambling” was intended as a positive.


Paul Hoffman

Managing Editor, Channelchek


Suggested Reading:

Contango, ETFs, and Alligators

Trading vs Investing vs
Tomorrow

Millennials Could Use Help With
Investing


Enjoy the Benefits of Premium Channelchek Content at No Cost

Each event in our popular Virtual Road Shows Series has maximum capacity of 100 investors online. To take part, listen to and perhaps get your questions answered, see which virtual investor meeting intrigues you here.

Engage Channelchek on your Preferred Social Platform:

Facebook

LinkedIn

YouTube

Twitter

Stocktwits

Dyadic International Inc. (DYAI) – Q2 EPS: Making Progress with C1 Technology

Friday, August 14, 2020

Dyadic International Inc. (DYAI)

Q2 EPS: Making Progress with C1 Technology

Dyadic International, Inc. is a global biotechnology company which is developing what it believes will be a potentially significant biopharmaceutical gene expression platform based on the industrially proven hyper productive engineered fungus Thermothelomyces heterothallica (formerly Myceliophthora thermophila), named C1.
The C1 microorganism, which enables the development and large scale manufacture of low cost proteins, has the potential to be further developed into a safe and efficient expression system that may help speed up the development, lower production costs and improve the performance of biologic vaccines and drugs at flexible commercial scales. Dyadic is using the C1 technology and other technologies to conduct research, development and commercial activities for the development and manufacturing of human and animal vaccines and drugs, such as virus like particles (VLPs) and antigens, monoclonal antibodies, Fab antibody fragments, Fc-Fusion proteins, biosimilars and/or biobetters, and other therapeutic proteins. Dyadic pursues research and development collaborations, licensing arrangements and other commercial opportunities with its partners and collaborators to leverage the value and benefits of these technologies in development and manufacture of biopharmaceuticals. In particular, as the aging population grows in developed and undeveloped countries, Dyadic believes the C1 technology may help bring biologic vaccines, drugs and other biologic products to market faster, in greater volumes, at lower cost, and with new properties to drug developers and manufacturers, and improve access and cost to patients and the healthcare system, but most importantly save lives.

Ahu Demir, Ph.D., Biotechnology Research Analyst, Noble Capital Markets, Inc.

Refer to the full report for the price target, fundamental analysis, and rating.

    Q2 earnings reported. Dyadic announced Q2 2020 earnings results yesterday. In the second quarter, research and development (R&D) revenue was $524,000, increased 66% compared to the previous quarter, attributed to the new research collaborations. R&D expenses were $1.81 million and general and administrative expenses were $1.48 million in the quarter. The net loss was $2.65 million or $0.10 per share. Our estimates are in line with the reported numbers. We are maintaining our F2020 estimates of $1.77 million revenue and $11.6 million operating expenses including $5.8 million R&D and $5.8 million SG&A expenses. We forecast ($0.32) EPS.

    Multiple milestones achieved in the quarter. Dyadic established multiple research collaborations with companies and institutions to develop vaccine and antibody to combat coronavirus. The partners include Frederick National Laboratory, Israel Institute for Biologic Research (IIBR), EU ZAPI initiative, Ufovax, and others. The company also …


    Click to get the full report

This Company Sponsored Research is provided by Noble Capital Markets, Inc., a FINRA and S.E.C. registered broker-dealer (B/D).

*Analyst
certification and important disclosures included in the full report. 
NOTE: investment decisions should not be based upon the content of
this research summary.  Proper due diligence is required before
making any investment decision.
 

FAT Brands Inc. (FAT) – A Rocketship of an Acquisition

Friday, August 14, 2020

FAT Brands Inc. (FAT)

A Rocketship of an Acquisition

FAT Brands Inc is a multi-brand restaurant franchising company. It develops, markets, and acquires predominantly fast casual restaurant concepts. The company provides turkey burgers, chicken Sandwiches, chicken tenders, burgers, ribs, wrap sandwiches, and others. Its brand portfolio comprises Fatburger, Buffalo’s Cafe and Express, and Ponderosa and Bonanza. The company’s overall footprint covers nearly 32 countries. Fatburger generates maximum revenue for the company.

Joe Gomes, Senior Research Analyst, Noble Capital Markets, Inc.

Refer to the full report for the price target, fundamental analysis, and rating.

    Adding Johnny Rockets. Yesterday, FAT Brands announced a transformative agreement to purchase the Johnny Rockets franchise for $25 million. Founded in 1986, Johnny Rockets is a casual burger chain known for its 1950s diner style decor. The chain has over 325 locations in the U.S. and 25 countries across the globe. Closing should be in mid-September.

    Impact. Johnny Rockets basically will double the size of FAT Brands, both from a unit count and from an adjusted EBITDA perspective, based on a normal operating environment. With about one-third of its locations in casinos, airports, theme parks, etc, we would expect the pandemic to have …


    Click to get the full report

This Company Sponsored Research is provided by Noble Capital Markets, Inc., a FINRA and S.E.C. registered broker-dealer (B/D).

*Analyst
certification and important disclosures included in the full report. 
NOTE: investment decisions should not be based upon the content of
this research summary.  Proper due diligence is required before
making any investment decision.
 

Harte-Hanks Inc. (HRTH) – Recovering Better Than Expected

Friday, August 14, 2020

Harte-Hanks Inc. (HRTH)

Recovering Better Than Expected

Harte-Hanks is a marketing services company that provides multichannel marketing solutions as well as consulting, data analytics, and strategic assessment. The company’s offerings focus on business-to-business, retail, finance, and automotive segments through digital, social, mobile, and print media offerings. Harte-Hanks strives to develop better customer relationships through its marketing and analytical services for clients. The majority of its revenue is derived from its marketing services in the retail, technology, and consumer brand segments.

Michael Kupinski, Director of Research, Noble Capital Markets, Inc.

Refer to the full report for the price target, fundamental analysis, and rating.

    Overachieves Q2 results. Revenues of $41.6 million was better than our $38.5 million estimate and reflected a 23.9% year-over-year quarterly revenue decline, better than many traditional media companies in Q2. Cash flow, as measured by Adj. EBITDA, was a better than expected $480,000 versus our estimate of $150,000. We believe that the results reflect that the company’s transition toward revenue growth is on track.

    Stabilizing revenues? We believe that Q2 revenues may reflect a stabilization in the company’s revenues, possibly the first time since 2016. Q2 revenues showed a sequential quarterly improvement from $40.5 million in Q1 and we estimate that Q3 revenues will …


    Click to get the full report

This Company Sponsored Research is provided by Noble Capital Markets, Inc., a FINRA and S.E.C. registered broker-dealer (B/D).

*Analyst
certification and important disclosures included in the full report. 
NOTE: investment decisions should not be based upon the content of
this research summary.  Proper due diligence is required before
making any investment decision.
 

Pangaea Logistics (PANL) – Unique Business Model Delivers Strong Operating Results in Challenging Times

Friday, August 14, 2020

Pangaea Logistics Solutions Ltd. (PANL)

Unique Business Model Delivers Strong Operating Results in Challenging Times

Pangaea Logistics Solutions Ltd and its subsidiaries provide seaborne drybulk transportation services. It transports drybulk cargos including grains, coal, iron, ore, pig, iron, hot briquetted iron, bauxite, alumina, cement clinker, dolomite and limestone. The firm’s services include cargo loading, cargo discharge, vessel chartering, voyage planning and technical vessel management. The company derives all of its revenues from contracts of affreightment, voyage charters and time charters. Its strategy depends on focusing on increasing strategic contracts of affreightment, expanding capacity and flexibility by increasing its owned fleet and increasing backhaul focus and fleet efficiency.

Poe Fratt, Senior Research Analyst, Noble Capital Markets, Inc.

Refer to the full report for the price target, fundamental analysis, and rating.

    Bounce back from a challenging quarter. Unique and consistent business model continues to deliver TCE rate outperformance. While the 2Q020 environment for the dry bulk market was challenging, the unique business model once again delivered positive operating results and adjusted 2Q2020 EBITDA of $10.7 million was well ahead of expectations, mainly due to an overly cautious stance that we took when 1Q2020 operating results were lower than expected in May.

    Adjusting 2020 EBITDA estimate to reflect current dry bulk market weakness and near-term uncertainty.  Similar to last year, we have seen a robust recovery off the lows of last quarter. We are reversing the conservative stance, which proved way too cautious, taken after 1Q2020 operating results were announced in May and our EBITDA estimate moves back up to …


    Click to get the full report

This Company Sponsored Research is provided by Noble Capital Markets, Inc., a FINRA and S.E.C. registered broker-dealer (B/D).

*Analyst
certification and important disclosures included in the full report. 
NOTE: investment decisions should not be based upon the content of
this research summary.  Proper due diligence is required before
making any investment decision.
 

OPEC Forecasts Lower Demand as Output Cuts Taper


OPEC Members Have Complied with Production Cuts, but it’s Getting Tricky


OPEC indicated in its monthly report that it expects world oil demand to tumble by 9.06 million barrels per day (bpd) this year versus a previous estimate of 8.95 million bpd.  The decline is, of course, due to the COVID-19 pandemic and largely reflects a decrease in jet fuel although gasoline demand will also be challenged. Recall that OPEC cut production on May 1 by 9.7 million bpd to address an expected drop in demand.  That cut is scheduled to taper to 7.7 million beginning in August. Of course, announcing production cuts and achieving production cuts are two different things.  OPEC members (including OPEC plus members) have a history of not complying with mandated production cuts. Iraq is often mentioned as the primary compliance violators, but there are others. 


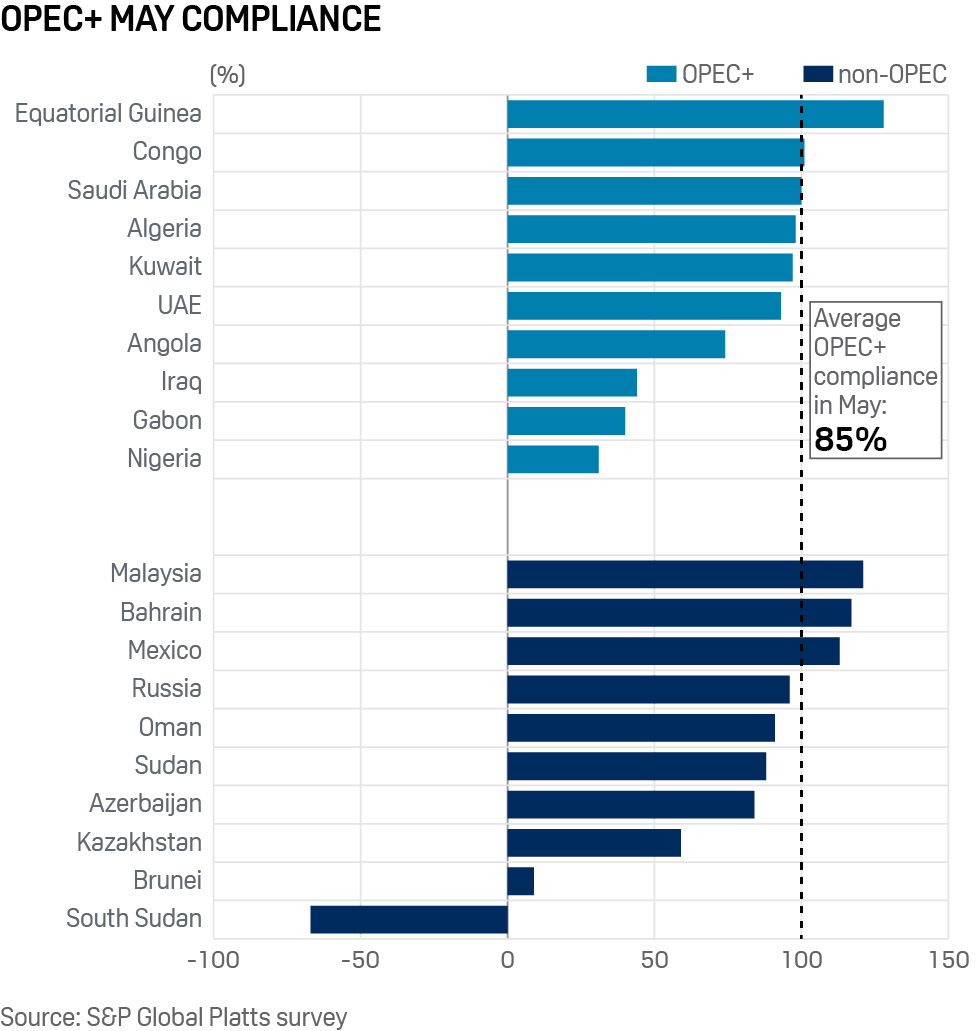
The compliance of the initial output cuts has been respectable.  Compliance was near 85% in May according to a Platts survey.  The chart below shows that OPEC members have generally done a better job than OPEC plus members.  It also shows that several members have been producing at levels below their allocated output.  Updated numbers in June and July have shown some slippage in compliance. 


Bull Case for Compliance and Higher Oil Prices

  • Saudi Arabia is In a Better Leadership Position.  Saudi Arabia is the de facto leader of OPEC as the country with the largest reserves and the lowest cost of production.  If production is not controlled and oil prices fall dramatically, it will be the last producer standing able to make a profit at lower prices.  This is what happened in April when Russia would not agree to cost reductions.  Saudi Arabia let oil prices fall forcing Russia and other countries back to the bargaining table.  The result was the 9.7 million bpd cut agreed to in May.  Saudi Arabia played a game of chicken and won.  It emerged as a more powerful enforcer because it has shown its willingness to punish cheaters.  Few OPEC plus members question whether Saudi Arabia would raise production if others were not complying. Nadir Itayim of Argus believes Saudi Arabia officials have taken an “all or nothing” approach. Either all countries do their part or nobody cuts.
  • Measurement Techniques Have Improved.  Measuring compliance is an arduous task given new areas of production, growing storage options (including floating storage) and a reliance on self-reporting. No wonder OPEC plus nations face a lack of trust when dealing with each other.  That said, the level of distrust has eased as new technology grants members a better system of measuring compliance.  Shipping tankers are better tracked and results are reported more frequently, both within and outside of OPEC.


Bear Case for Noncompliance and Lower Oil Prices

  • Compliance May Be Impossible Due to Contractual Agreements.  David Fyfe, chief economist at Argus, indicated that Iraq, Nigeria and Kazakhstan will have difficulties complying with mandated production cuts because of contractual agreements with upstream companies. Often, production cut arrangements are done hastily and simplistically.  Those arrangements may work in theory but are difficult to implement in reality.
  • Enforcement is Difficult.  Saudi Arabia has shown a willingness to allow oil price to drop to punish non-compliers.  However, it does so at great pain to its own financial position.  Historically, the country has turned a blind eye towards minor violations and other OPEC plus countries know this.  That leaves a temptation for members to test other members to see how far they can get away with challenging the system.
  • The United States is the Largest Producer of Oil
    and Not an OPEC Plus Member.
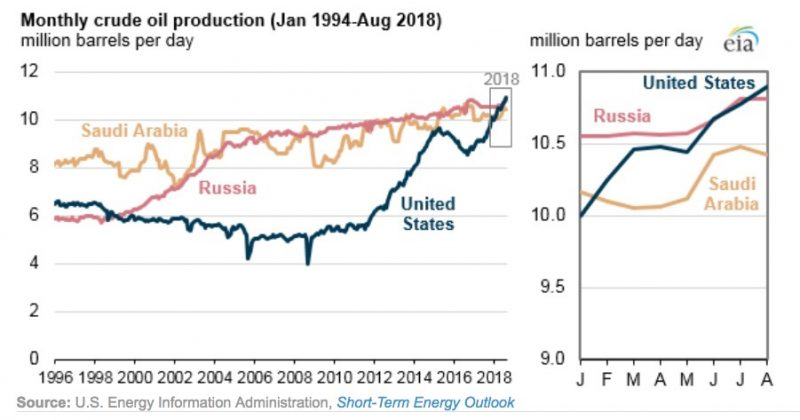
      OPEC became imperative when it lost market share to the United States in recent years. Much of the production has come from the Permian Basin where technological advances have lowered the price at which oil can be produced. The United States became the largest producer of oil in 2018. Domestic production has declined this year with the drop in oil prices.  Should oil prices rise again, it’s safe to bet that domestic production will return.


Summary

It is always difficult to assess whether “this time is different” regarding OPEC compliance.  Early indications are that production cuts have largely been adhered to.  However, it is worth noting that production cuts during a period of lower demand are easier to enforce than during periods of robust demand.  Everyone knows what will happen to oil prices if production is not cut to offset lower demand.  When demand returns and oil prices start to rise, the temptation to cheat may be increased. 


Suggested Reading:

EIA Reports the Largest Weekly U.S.
Crude Decline

Is M&A Picking up
in Energy Sector

Exploration and
Production Second Quarter Review and Outlook

Each event in our popular Virtual Road Shows Series has maximum capacity of 100 investors online. To take part, listen to and perhaps get your questions answered, see which virtual investor meeting intrigues you here.


Sources

https://finance.yahoo.com/news/opec-trims-2020-oil-demand-125222084.html, Alex Lawler, Yahoo Finance, August 12, 2020

https://www.argusmedia.com/en/blog/2020/july/2/the-curious-case-of-opec-compliance, Nader Itayim, Argus, July 02, 2020

https://www.cnbc.com/2020/06/11/opec-mostly-met-cut-targets-in-may-but-future-compliance-uncertain.html, Natasha Turak, CNBC, June 11, 2020

https://www.spglobal.com/platts/en/market-insights/latest-news/oil/061020-opec-delivers-85-compliance-on-oil-output-cuts-in-may-sampp-global-platts-survey, S&P Global Platts, June 10, 2020

http://www.energyintel.com/pages/eig_article.aspx?DocId=1077457, International Oil Daily, July 4, 2020

https://momr.opec.org/pdf-download/, Organization of Petroleum Exporting Countries, August 2020

Release – InPlay Oil Corp. Announces BDC Term Facility and Provides Second Quarter 2020 Financial and Operating Results

InPlay Oil Corp. Announces BDC Term Facility and Provides Second Quarter 2020 Financial and Operating Results


August 14, 2020 – Calgary Alberta – InPlay Oil Corp. (TSX: IPO) (OTCQX: IPOOF) (“InPlay” or the “Company”) is pleased to announce that it has entered into a non-binding term sheet (the “BDC Term Sheet”) with the Business Development Bank of Canada (“BDC”), in partnership with our syndicate of lenders, for a non-revolving term facility of up to $25 million with a four year term. The Company is also announcing its financial and operating results for the second quarter. InPlay’s condensed unaudited interim financial statements and notes, as well as management’s discussion and analysis (“MD&A”) for the three and six months ended June 30, 2020 will be available at www.sedar.com and our website at www.inplayoil.com.


Subsequent to the end of the second quarter, on July 15, 2020 the Company announced the completion of its Credit Facility redetermination at $65 million, maturing on May 31, 2021. On July 30, 2020 the Company entered into the BDC Term Sheet with the BDC under their Business Credit Availability Program (“BCAP”) which, subject to the entering into of definitive agreements, will provide the Company with a non-revolving $25 million, second lien, four year term facility (the “BDC Term Facility”). The Export Development Canada (“EDC”) and BDC programs were initially announced to provide pre-COVID-19 financially viable companies with additional liquidity to continue operations and development activity through the pandemic and allow them to return to preCOVID-19 operating levels in a time frame that can be managed with improved crude oil and commodity pricing.


The BDC Term Facility will provide InPlay with significant additional long term liquidity at reasonable interest rates to withstand the impacts of the COVID-19 pandemic and allow the Company to pursue development opportunities that generate long-term, sustainable net asset value per share growth for our shareholders into the recovery phase. InPlay quickly assessed the program when first announced and were early in initiating discussions with both BDC and Export Development Bank of Canada (“EDC”) regarding their programs. InPlay is pleased to become one of the first companies to be approved for a term sheet through the program, validating our financial strength while also confirming the comments made in our April and May 2020 press releases stating we believed based on the criteria put forward that InPlay was a financially viable Company prior to the COVID19 pandemic. The Company appreciates the support of the BDC and our syndicate of lenders to make this partnership possible.


As a result of crude oil demand improving from the lows seen in April, combined with the reductions in production from OPEC+ and production curtailments by producers, commodity prices have improved earlier than initially expected. Since the end of the second quarter the Company has begun the process of bringing back on our operated shut-in and curtailed production as well as starting to service wells that have been down as long as they have payouts of approximately six months. We anticipate production returning to close to our production capacity levels in late August with average September production forecasted to approximate pre-COVID production rates, including oil inventory of approximately 28,000 to 30,000 barrels which will opportunistically be sold into the spot market prior to year-end.


InPlay has been extremely successful in obtaining approved applications under the Alberta government’s Site Rehabilitation Program (“SRP”). The Company’s diligence in submitting these applications quickly as well as our detailed grant requests has resulted in greater than $1.0 million being received from the program to date. InPlay was allocated a significantly higher portion of the total amount of this program in comparison to our percentage of Alberta oil and gas production. The Company also expects to receive additional grants in subsequent phases of the SRP. As these programs are completed, these amounts will be reflected as a reduction in our decommissioning obligation liability. We thank our operations team and key service providers in their diligence and attentiveness to this program which resulted in well received applications and significant benefit from the program.


Second Quarter 2020 Financial & Operations Results

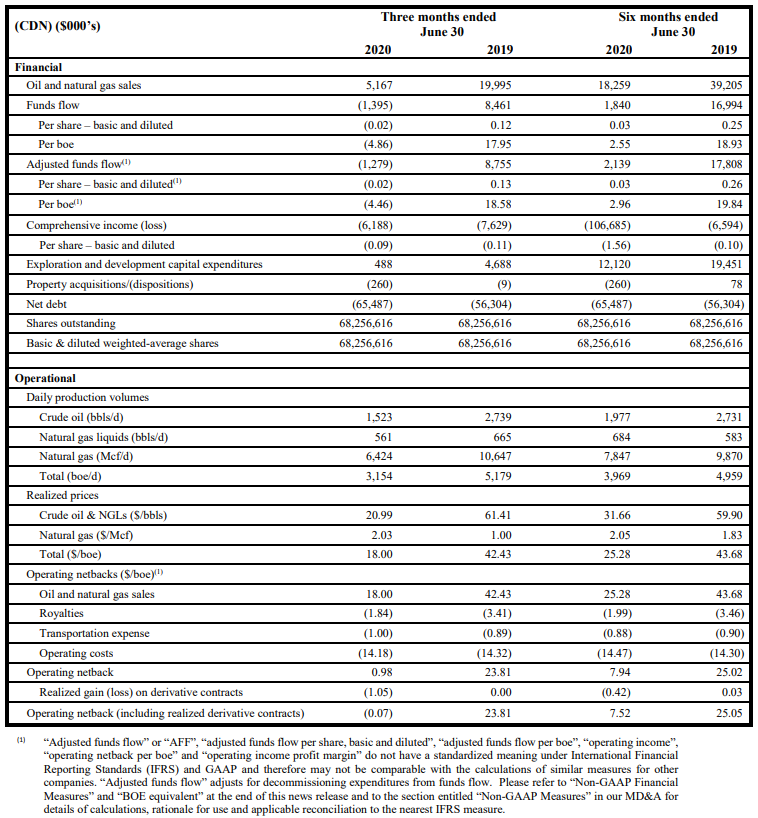
InPlay was proactive and promptly reacted to the dramatic and unprecedented drop in crude oil pricing in March by immediately suspending its 2020 development capital program, quickly implementing cost cutting initiatives in the field and office and initiating temporary production curtailments and shut-ins resulting in production declines to approximately 65% of estimated capacity. This resulted in average production of 3,154 boe/d in the second quarter of 2020 compared to 5,179 boe/d in the second quarter of 2019.


The Company’s operations are well positioned to make adjustments when facing these extreme volatile commodity price environments. The Company looked at all wells in detail taking into account fixed and variable costs, safety concerns, as well as shut-in and startup costs to determine which wells could be temporarily shut in or curtailed and fully restarted with minimal incremental costs. Further initiatives were also undertaken to reduce costs and scale back discretionary expenditures which allowed the Company to achieve lower operating and G&A costs during the quarter of $4.1 and $0.8 million ($14.18 per boe and $2.73 per boe) respectively compared to $6.7 and $1.8 million ($14.32 per boe and $3.81 per boe) in the second quarter of 2019. This is a significant achievement given the presence of fixed costs being incurred over a significantly lower production base. Improved commodity prices began to materialize in June and allowed us to start bringing on curtailed production easily meeting our sales nominations while continuing to fill inventory storage levels. As of June 30, 2020 approximately 24,000 barrels of oil were in storage allowing the Company to sell this production in the future at advantageous pricing levels.


The commodity price collapse due to demand destruction as a result of the COVID-19 crisis heavily impacted financial results for the second quarter of 2020. Oil prices were significantly lower over the second quarter with WTI prices averaging $27.85 USD/bbl, compared to $59.84 USD/bbl for the second quarter of 2019. Revenue was most affected in April at the apex of the crisis when we had to meet sales volumes that were previously nominated at the beginning of March prior to the crisis. This resulted in a net realized price of only $17.06 CDN/bbl for our crude during the month of April. Reacting to the distressed crude oil pricing environment, InPlay began reducing sales nominations in May and June. NGL prices also continued to remain at multi-year lows over the quarter as the Company’s realized NGL prices averaged $11.66 CDN/bbl in the second quarter of 2020 compared to $19.67 CDN/bbl over the same period in 2019, largely due to the benchmarking of these prices on low WTI pricing during the quarter and continued weakness in propane and butane pricing. With these dramatic reductions in commodity prices during the second quarter of 2020, InPlay incurred an adjusted funds flow (“AFF”) deficit of $1.3 million over the quarter.


The Company’s COVID-19 response also included multiple cost cutting measures highlighted by a 20 percent reduction in field and office salaries as wells as cost reductions in all areas of our operations. InPlay has also taken advantage of certain provincial and federal government programs in response to the COVID-19 crisis. The Company received approximately $0.3 million under the Canada Emergency Wage Subsidy (“CEWS”) during the second quarter of 2020. These cost cutting measures and our curtailed operations resulted in savings of approximately $3.4 million in the second quarter of 2020 compared to our original January 2020 budget.


Financial and Operating Results:


Outlook

The Company is cautiously optimistic for the remainder of 2020 and expects that commodity pricing will start gaining momentum in 2021 and beyond as the lack of capital spending on oil and gas projects on a worldwide scale will lead to declining production and ultimately result in demand exceeding supply. Commodity prices have improved quicker than originally anticipated and all cost structures have decreased as a result of internal cost cutting measures and external market conditions. Success in obtaining additional long term financing with the BDC Term Facility is expected to provide us with ample liquidity to get through this difficult period and the potential to resume our development capital program prior to the end of 2020. At current commodity prices and with lower cost structures, the Company has the ability to commence a capital program on projects that are budgeted to payout in 1 to 1.5 years, based on comparable well performance. Subject to the anticipated closing of the BDC Term Facility, we are currently working on plans to resume our 2020 capital program, depending on pricing, in the fourth quarter of 2020. The Company expects to provide capital guidance for the remainder of 2020 in the near future.


InPlay remains steadfast on managing the current crisis, daily monitoring of our rapidly changing environment and prudently reacting to changing circumstances. Management will continue to take action with the objective of diligently managing costs, preserving liquidity and will make capital spending decisions considering commodity prices and liquidity levels.


We thank our employees and all of our service providers for their commitments and efforts in this unprecedented time as well as our directors for their ongoing commitment and dedication. Finally, we thank all of our shareholders and lending partners for their continued interest and support.


For further information please contact:

Doug Bartole
President and Chief Executive Officer
InPlay Oil Corp.
Telephone: (587) 955-0632

Darren Dittmer
Chief Financial Officer
InPlay Oil Corp.
Telephone: (587) 955-0634


Reader Advisories


Non-GAAP Financial Measures

Included in this press release are references to the terms “adjusted funds flow”, “adjusted funds flow per share, basic and diluted”, “adjusted funds flow per boe”, “operating income”, “operating netback per boe” and “operating income profit margin”. Management believes these measures are helpful supplementary measures of financial and operating performance and provide users with similar, but potentially not comparable, information that is commonly used by other oil and natural gas companies. These terms do not have any standardized meaning prescribed by GAAP and should not be considered an alternative to, or more meaningful than, “funds flow”, “profit (loss) before taxes”, “profit (loss) and comprehensive income (loss)” or assets and liabilities as determined in accordance with GAAP as a measure of the Company’s performance and financial position.


InPlay uses “adjusted funds flow”, “adjusted funds flow per share, basic and diluted” and “adjusted funds flow per boe” as key performance indicators. Adjusted funds flow should not be considered as an alternative to or more meaningful than funds flow as determined in accordance with GAAP as an indicator of the Company’s performance. InPlay’s determination of adjusted funds flow may not be comparable to that reported by other companies. Adjusted funds flow is calculated by adjusting for decommissioning expenditures from funds flow. This item is adjusted from funds flow as decommissioning expenditures are incurred on a discretionary and irregular basis and are primarily incurred on previous operating assets, making the exclusion of this item relevant in Management’s view to the reader in the evaluation of InPlay’s operating performance. Adjusted funds flow per share, basic and diluted is calculated by the Company as adjusted funds flow divided by the weighted average number of common shares outstanding for the respective period. Management considers adjusted funds flow per share, basic and diluted an important measure to evaluate its operational performance as it demonstrates its recurring operating cash flow generated attributable to each share. Adjusted funds flow per boe is calculated by the Company as adjusted funds flow divided by production for the respective period. Management considers adjusted funds flow per boe an important measure to evaluate its operational performance as it demonstrates its recurring operating cash flow generated per unit of production. For a detailed description of InPlay’s method of calculating adjusted funds flow, adjusted funds flow per share, basic and diluted and adjusted funds flow per boe and their reconciliation to the nearest GAAP term, refer to the section “Non-GAAP Measures” in the Company’s MD&A filed on SEDAR.


InPlay also uses “operating income”, “operating netback per boe” and “operating income profit margin” as key performance indicators. Operating income should not be considered as an alternative to or more meaningful than net income as determined in accordance with GAAP as an indicator of the Company’s performance. Operating income is calculated by the Company as oil and natural gas sales less royalties, operating expenses and transportation expenses and is a measure of the profitability of operations before administrative, share-based compensation, financing and other noncash items. Management considers operating income an important measure to evaluate its operational performance as it demonstrates its field level profitability. Operating netback per boe is calculated by the Company as operating income divided by average production for the respective period. Management considers operating netback per boe an important measure to evaluate its operational performance as it demonstrates its field level profitability per unit of production. Operating income profit margin is calculated by the Company as operating income as a percentage of oil and natural gas sales. Management considers operating income profit margin an important measure to evaluate its operational performance as it demonstrates how efficiently the Company generates field level profits from its sales revenue. For a detailed description of InPlay’s method of the calculation of operating income, operating netback per boe and operating income profit margin and their reconciliation to the nearest GAAP term, refer to the section “Non-GAAP Measures” in the Company’s MD&A filed on SEDAR.


Forward-Looking Information and Statements

This news release contains certain forward–looking information and statements within the meaning of applicable securities laws. The use of any of the words “expect”, “anticipate”, “continue”, “estimate”, “may”, “will”, “project”, “should”, “believe”, “plans”, “intends” “forecast” and similar expressions are intended to identify forward-looking information or statements. In particular, but without limiting the foregoing, this news release contains forward-looking information and statements pertaining to the following: the anticipated entering into of definitive documents and closing of the BDC Term Facility; production estimates including timing of production restart plants and the impact thereof; the estimated time to payout of wells; the potential for and extent of planned curtailments or shut-ins and the potential timing and impact thereof; expectations regarding future commodity prices; future liquidity and financial capacity; the potential resumption of our development capital program prior to the end of 2020; future results from operations and operating metrics and capital guidance; future costs (including retention of cost reductions post COVID-19), expenses and royalty rates; future interest costs; the exchange rate between the $US and $Cdn; expectations to receive additional grants under the SRP; and methods of funding our capital program.


Forward-looking statements in this news release also include statements regarding the expected terms and availability of the proposed BDC Term Facility, as well as the use of proceeds therefrom. Pursuant to the terms of the BDC Term Sheet, closing of the BDC Term Facility remains subject to a number of conditions, including final BDC credit approval and the entering into of definitive documentation among BDC, InPlay and InPlay’s current lenders. If the BDC Term Facility is not entered into, there may be an adverse impact on InPlay’s ability to continue to fund its operations and development activities. While approvals of InPlay’s syndicate of lenders have been obtained and definitive documentation is expected to be entered into in short order, there can be no assurances that the BDC Term Facility will be completed on the terms currently contemplated in the BDC Term Sheet or at all and, accordingly, investors should not unduly rely on the same.


Forward-looking statements or information are based on a number of material factors, expectations or assumptions of InPlay which have been used to develop such statements and information but which may prove to be incorrect. Although InPlay believes that the expectations reflected in such forward-looking statements or information are reasonable, undue reliance should not be placed on forward-looking statements because InPlay can give no assurance that such expectations will prove to be correct. In addition to other factors and assumptions which may be identified herein, assumptions have been made regarding, among other things: the impact of increasing competition; the general stability of the economic and political environment in which InPlay operates; the timely receipt of any required regulatory approvals; the ability of InPlay to obtain qualified staff, equipment and services in a timely and cost efficient manner; drilling results; the ability of the operator of the projects in which InPlay has an interest in to operate the field in a safe, efficient and effective manner; the ability of InPlay to obtain financing on acceptable terms including the completion of the BDC Term Facility; field production rates and decline rates; the ability to replace and expand oil and natural gas reserves through acquisition, development and exploration; the timing and cost of pipeline, storage and facility construction and the ability of InPlay to secure adequate product transportation; future commodity prices; currency, exchange and interest rates; regulatory framework regarding royalties, taxes and environmental matters in the jurisdictions in which InPlay operates; and the ability of InPlay to successfully market its oil and natural gas products.


The forward-looking information and statements included herein are not guarantees of future performance and should not be unduly relied upon. Such information and statements, including the assumptions made in respect thereof, involve known and unknown risks, uncertainties and other factors that may cause actual results or events to defer materially from those anticipated in such forward-looking information or statements including, without limitation: the duration and impact of COVID-19; changes in commodity prices; the potential for variation in the quality of the reservoirs in which we operate; changes in the demand for or supply of our products; unanticipated operating results or production declines; changes in tax or environmental laws, royalty rates or other regulatory matters; changes in development plans of InPlay or by third party operators of our properties; increased debt levels or debt service requirements; inaccurate estimation of our oil and gas reserve and resource volumes; limited, unfavorable or a lack of access to capital markets; increased costs; a lack of adequate insurance coverage; the impact of competitors; and certain other risks detailed from time-to-time in InPlay’s disclosure documents.


The forward-looking information and statements contained in this news release speak only as of the date hereof and InPlay does not assume any obligation to publicly update or revise any of the included forward-looking statements or information, whether as a result of new information, future events or otherwise, except as may be required by applicable securities laws.


Test Results and Initial Production Rates

Test results and initial production rates disclosed herein, particularly those short in duration, may not necessarily be indicative of long term performance or of ultimate recovery. A pressure transient analysis or well-test interpretation has not been carried out and thus certain of the test results provided herein should be considered to be preliminary until such analysis or interpretation has been completed.


BOE equivalent

Barrel of oil equivalents or BOEs may be misleading, particularly if used in isolation. A BOE conversion ratio of 6 mcf: 1 bbl is based on an energy equivalency conversion method primarily applicable at the burner tip and does not represent a value equivalency at the wellhead. Given that the value ratio based on the current price of crude oil as compared to natural gas is significantly different than the energy equivalency of 6:1, utilizing a 6:1 conversion basis may be misleading as an indication of value.


Release – Aurania Resources – Keith Barron’s Straight Talk on Mining Series: Module 1 – Epithermal Gold-Silver Deposits

Keith Barron’s Straight Talk on Mining
Module 1 – Epithermal Gold-Silver Deposits


At the request of Aurania shareholders, Dr. Keith Barron, Chairman and CEO, created an educational video series about epithermal gold-silver deposits on his website Straight Talk on Mining. There are eight modules in this series which will be released individually in the coming weeks.

We recommend that viewers watch the introduction video before viewing this module which is Module 1.


Aurania Resources Ltd.
36 Toronto St, Suite 1050
Toronto, ON, Canada, M5C 2C5

Phone: (416) 367-3200
Email: [email protected]

QuoteMedia (QMCI) – Keeping The Foot On The Pedal

Thursday, August 13, 2020

QuoteMedia (QMCI)

Keeping The Foot On The Pedal

QuoteMedia, based in Fountain Hills, Arizona, provides cloud-based financial data, market news feeds, and financial software solutions.  Its customers include financial service companies, online brokerages, clearing firms, banks, media portals, public corporations and individual investors.  The company provides a single source solution providing products such as streaming quotes, charting, historical data, technical analysis, news and research.  Information can customized and provided to multiple platforms including terminals and mobile devices.

Michael Kupinski, DOR, Senior Research Analyst, Noble Capital Markets, Inc.

Refer to the full report for the price target, fundamental analysis, and rating.

    Q2 results softer than expected. Q2 revenues were relatively stable in a very difficult operating environment and against tough year earlier comparisons. Revenues were $3.029 million, a new quarterly record for the company, in line with our $3.050 million estimate. Operating cash flow, as measured by adjusted EBITDA, was $214,000, below our $486,000 estimate, reflecting investments in new products to be launched later in the year.

    Keeping the foot on the pedal. Management indicated that it plans to maintain its investment spending on new products and and features to be launched late in the current quarter. It may back off investment spend if the operating environment deteriorates. But, in our view, the company has enough liquidity and runway for the heightened spending. We believe that the new products and features should …


    Click to get the full report

This Company Sponsored Research is provided by Noble Capital Markets, Inc., a FINRA and S.E.C. registered broker-dealer (B/D).

*Analyst
certification and important disclosures included in the full report. 
NOTE: investment decisions should not be based upon the content of
this research summary.  Proper due diligence is required before
making any investment decision.
 

Advertising Budgets are Going Where the Eyes Are


Ten years ago 15% of Ad Money was Spent on Internet Ads, Guess what that Percentage is Today?


Soap operas, magazines, TV sports, local radio; they all allow niche target-advertising.  But, their slice of the advertising-dollar pie is shrinking precipitously. This trend has been in place for a while and still accelerating. Traditional ways to reach motivated buyers are losing out to the newer competitors for ad-dollars. In 2020, this has become even more complicated.


The days of scanning through newspapers for sales or dentist office magazines to learn more about a product are almost nostalgic. Ad-Targeting is much more refined in the new digital world. With a more accurate dataset of consumer likes and dislikes, online advertising has leaped to the forefront of marketing strategies. Marketers have recognized the consumer trends and have adapted to meet them; targeted digital advertisements allows them to be significantly more strategic.


Advertising Spending Trends

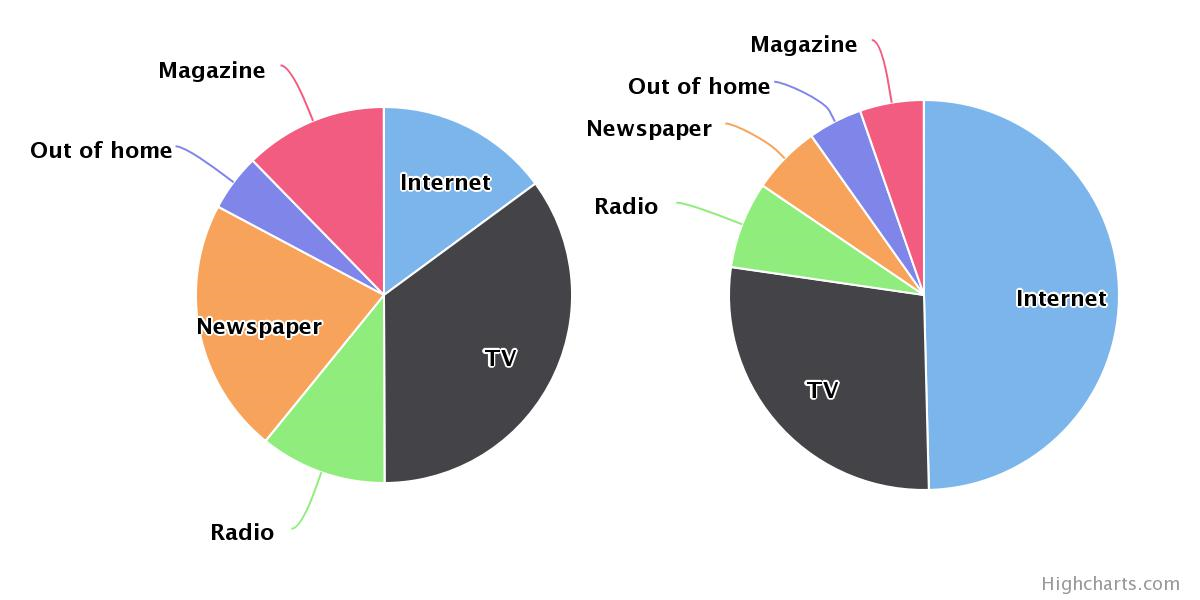
A bit over a decade (2009), the internet represented only 15% of all U.S. ad spending.

               Total dollars spent: $117 Billion

               TV: 39% of ad spending

               Print Media: 34% of ad spending

               Internet: 15%


Today (2020), more is spent on internet advertising alone than all U.S. ad spending of ten years earlier.

               Total dollars spent: $263 Billion (est.)

               TV: 28%

               Print Media: 11%

               Internet: 53%


Share of U.S. Ad Spending by Medium, 2009 (left) vs. 2019 (right)

Internet ad spending captured nearly half of ad dollars in 2019, up from about 15 percent a decade ago.


2020 and Beyond

The average social media user spends 2-plus hours a day browsing their feeds. The larger social media providers are monitoring people’s usage, likes, and dislikes. This creates a massive smart-platform for target-marketing products. The platforms continue to update and improve their methods, including increasingly higher levels of sophisticated algorithms—essentially artificial intelligence to connect a to users in their niche. The relevance of ads that users encounter is now superior to that they would see or hear from more traditional outlets. The big providers, Facebook, Snapchat, Twitter, and Instagram, all offer promoted advertisements that pop up on users’ pages while they scroll their feed. On average, users connect with three or more of their social media accounts a day.


Social Media ad spending is forecast to increase by 20% to $43 billion in 2020. Television advertising has been hard hit, not by social media competition, but by the lack of aired sports competitions. With the postponement of 2020 Summer Olympics $1.2 billion, the cancellation of March Madness and sports in general, the NBA and NHL playoff cancellation could cost $2 billion, and the seasons could cost around $700 million.    New estimates forecast that U.S. TV advertising spending will decline between 22.3% and 29.3%, mostly due to the curtailment of sports programs.


Google ad revenue is projected to be $39.5 Billion in 2020; this is down by 5.3% from 2019. The decrease is a direct result of the steps to curtail the coronavirus, which shut many businesses down and caused others to go into “safety mode” by cutting their spending. However, spending is expected to rebound at unprecedented rates, up 20% in 2021 as businesses begin to restart.


Ad spending on podcasts is forecast to grow 15% from 2019 to around $3.4 B by year-end. Around 40% of Americans now listen to podcasts on a monthly basis. Companies are adapting to new sectors to reach new markets.


Take-Away

Although 2020 has provided some one-time reshuffling of ad-dollar resources, the trend toward social media platforms is firmly in place. This is worth noting if you manage a media company, adapting and changing business models may put you in a position to take advantage of these changes. Investors may find undervalued traditional media companies that have been tossed out with others– those that a bit of research indicate are making smart moves. As for social media outlets, it looks like advanced data-driven technology is giving them their day in the sun.


Suggested Reading:

Will Broadcast Mergers and Acquisitions Surge?

More Accurate than Polls to Gauge Election Outcomes

Cashing In


Enjoy the Benefits of Premium Channelchek Content at No Cost

Each event in our popular Virtual Road Shows Series has maximum capacity of 100 investors online. To take part, listen to and perhaps get your questions answered, see which virtual investor meeting intrigues you here.


Sources:

https://adage.com/article/year-end-lists-2019/internet-medias-share-us-ad-spending-has-more-tripled-over-past-decade/2221701

https://en.wikipedia.org/wiki/Television_consumption

https://www.mediapost.com/publications/article/350281/us-tv-average-ad-spending-to-sink-25-in-the-fir.html

Picture: Etrade advertisement from the day after Superbowl February 2009.

Release – Sierra Metals Reports Solid Consolidated Financial Results For The Second Quarter Of 2020, Despite Covid-19 Interruptions

Sierra Metals Reports Solid Consolidated Financial Results For The Second Quarter Of 2020, Despite Covid-19 Interruptions

Issuing Revised Production Guidance

Conference Call August 14, 2020 At 10:30 AM (EDT) Registration Link Below


(All $ figures reported in USD)

  • Adjusted EBITDA of $12.6 million in Q2 2020 in-line with Q2 2019, as lower revenues due to COVID government mandated curtailments were partially offset by reduced operating costs
  • Operating cash flows before movements in working capital of $13.2 million in Q2 2020 increased from $12.8 million in Q2 2019
  • Revenue from metals payable of $41.9 million in Q2 2020 decreased from $50.7 million in Q2 2019 as the COVID-19 pandemic impacted quarterly production and metal prices
  • Q2 2020 consolidated copper production of 9.7 million pounds was consistent with Q2 2019; consolidated silver production of 0.6 million ounces, consolidated zinc production of 13.7 million pounds and consolidated lead production of 6.4 million pounds declined by 32%, 17% and 21% respectively; consolidated gold production of 2,762 ounces increased 9% as compared to Q2 2019
  • Quarterly silver production declined as Cusi remained under care and maintenance throughout the quarter. The Company announced restarting of Cusi operations on July 28, 2020
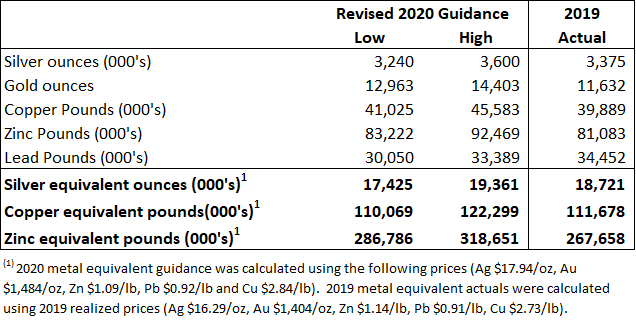
  • Revised production guidance issued which anticipates that 2020 copper equivalent production will now range between 110.1 to 122.3 million pounds; or silver equivalent production will range between 17.4 to 19.4 million ounces; or zinc equivalent production will range between 286.8 to 318.7 million pounds.
  • The Board of Directors has approved studies to be completed for potential expansions of all mines, as per ongoing Company strategy
  • $40.7 million of cash and cash equivalents as at June 30, 2020
  • $49.4 million of working capital as at June 30, 2020
  • Net Debt of $58.7 million as at June 30, 2020
  • Shareholder conference call to be held Friday, August 14, 2020, at 10:30 AM (EDT) – Preregistration required please see link below

(1) Silver equivalent ounces
and copper and zinc equivalent pounds for Q2 2020 were calculated using the following realized prices: $16.59/oz Ag, $2.40/lb Cu, $0.89/lb Zn, $0.76/lb Pb, $1,722/oz Au. Silver equivalent ounces and copper and zinc equivalent pounds for Q2 2019 were calculated using the following realized prices: $14.88/oz Ag, $2.75/lb Cu, $1.20/lb Zn, $0.85/lb Pb, $1,323/oz Au. Silver equivalent ounces and copper and zinc equivalent pounds for 6M 2020 were calculated using the following realized prices: $16.58/oz Ag, $2.46/lb Cu, $0.91/lb Zn, $0.78/lb Pb, $1,654/oz Au. Silver equivalent ounces and copper and zinc equivalent pounds for 6M 2019 were calculated using the following realized prices: $15.23/oz Ag, $2.80/lb Cu, $/1.22lb Zn, $0.90/lb Pb, $1,314/oz Au.


Toronto, ON – August 13, 2020Sierra Metals Inc. (TSX: SMT) (BVL: SMT) (NYSE AMERICAN: SMTS) (“Sierra Metals” or “the Company”) today reported solid consolidated financial results despite the effects of the COVID-19 pandemic, including a strong performance from the Bolivar Mine.  Results included revenue of $41.9 million and adjusted EBITDA of $12.6 million on throughput of 511,485 tonnes and metal production of 22.7 million copper equivalent pounds, or 3.3 million silver equivalent ounces, or 61.4 million zinc equivalent pounds for the three month period ended June 30, 2020.


Revenues were negatively impacted by the COVID-19 pandemic on production and metal prices during the quarter. Average realized prices in Q2 2020 for copper, zinc and lead were 13%, 26% and 11% lower, respectively as compared to realized prices in Q2 2019. Silver and gold prices were 11% and 30% higher than their respective average realized prices in Q2 2019. Adjusted EBITDA generated during Q2 2020 was in-line with Q2 2019 however, as lower operating costs offset lower revenues.


Yauricocha’s cash costs declined 22% quarter over quarter due to lower operating costs per tonne.  AISC per copper equivalent pound decreased 9% as lower cash costs were partially offset by higher treatment and refining charges and lower copper equivalent pounds sold as compared to Q2 2019. The Yauricocha Mine generated positive EBITDA during the quarter, despite the 20% lower throughput as compared to the same quarter of 2019. The mine resumed normal operations on June 5, 2020, as the Peruvian Government included mining and related activities in phase two of its economic recovery plan. The management team believes that the mine has operational flexibility to recover part of the production lost during the quarter.


Cash costs at Bolivar for Q2 2020 dropped 32% as compared to the same quarter of 2019, as the mine operated at lower operating costs and achieved mill throughput that was just 5% lower than Q2 2019, despite the impact of the COVID-19 related shutdowns in Mexico. The increase in revenues from the Bolivar Mine more than compensated for the loss of revenues from the Cusi Mine that remained closed throughout the quarter.  Bolivar generated $6.6 million in EBITDA during the quarter. The mine resumed normal operations on June 1, 2020, as the Mexican Government deemed mining an essential activity effective that date.


Cusi remained in care and maintenance throughout Q2 2020 due to its proximity to urban communities and hence there was no production during the quarter. Cusi generated EBITDA of $0.2 million on revenue of $1.7 million during the quarter resulting from the sale of silver concentrate remaining at the end of Q1 2020. Cusi production recommenced on July 28, 2020 and a process has been implemented at the mine to mitigate the risk of COVID-19 to employees at the site through a testing and quarantine methodology. During the period of care and maintenance, the management team has had the time to complete an optimised view of the entire mine operation. Mine development is ongoing at Cusi to provide access to higher-grade economic ore and feed ore to the mill at the targeted rate of 1,200 tpd. Production will include ore from Santa Rosa de Lima zone, the Promontorio zone, as well as from a series of east-west vein systems including the new high-grade zone, Northeast-Southwest system of Epithermal Veins (“NSEV”) announced on June 18, 2020 that cross the Cusi fault near the Santa Rosa de Lima zone.


The Company expects to continue development and infrastructure improvements at Bolivar with the aim to push throughput close to 5,000 tonnes per day (“tpd”) before end of the year. At Cusi, mine development will continue to provide access to the higher-grade economic ore and feed ore to the mill at the targeted rate of 1,200 tpd. Additional drilling is also planned to better understand the extension of the NSEV zone at depth and to the Northeast. Further, the Company intends to commence studies on the potential expansion of Cusi and begin work on a new tailing dam near the Mal Paso mill, providing for deposition capacity for the foreseeable future.


“The Company was able to maintain essential activities while fully complying with the government protocols during the state of emergency,” stated Luis Marchese, CEO of Sierra Metals. “We achieved remarkable results and reported solid revenue, cashflow and positive EBITDA in the second quarter despite the negative implications of the COVID-19 related shutdowns. We also achieved lower costs at the Bolivar and Cusi mines which are attributable to higher operating efficiency and the prudent management of capital expenditures to protect the balance sheet, while also realizing improved head grades and more favorable foreign exchange rates. A good portion of the credit for these results is owed to the employees at Yauricocha and Bolivar who were able to maintain a high level of productivity with a reduced workforce. Also, to the management team, who led the Company through what we consider its biggest challenge in its history, while all operations were curtailed or placed into care and maintenance during the quarter as metal prices dropped sharply during the crisis. We are currently running our three operations at high operating rates.  However, we remain cognizant that COVID-19 cases remain high in Peru and Mexico. As such, we continue proceeding cautiously, adhering to strict health protocols to protect our employees and the communities in which we operate, as well as to mitigate the potential for further work stoppages.”


He continued, “looking ahead to the second half of the year, due to our operating flexibility, we have the potential to recover some of the lost production experienced during the shutdowns at Yauricocha. We are also excited to see Bolivar continue in its strides towards the 5,000 tpd throughput level.  Cusi having restarted earlier than anticipated is on track and performing well on its way to the 1,200 tpd throughput level. Metals prices have strengthened at the start of the third quarter especially for copper and precious metals. We are optimistic that with improved operating efficiencies and potential higher metal prices we will see a stronger second half for 2020.  Furthermore, we will continue seeking the required permits to increase Yauricocha’s throughput to 3,600 tonnes per day for next year.”


He concluded, “Sierra Metals’ balance sheet, working capital and cash position remain strong. Considering that we remain in a vulnerable environment due to the COVID-19 pandemic, we are optimistic that further cash flow and liquidity improvements should be realized in the second half of 2020, due to higher production rates and improved metal prices.  This would allow the Company to complete more of the deferred required capital expenditures and potential returns of capital which had been originally planned for this year. Management remains committed to the prudent and sustainable growth plan for the Company and more importantly to improving the per share value benefiting all shareholders now and, in the years to come.”


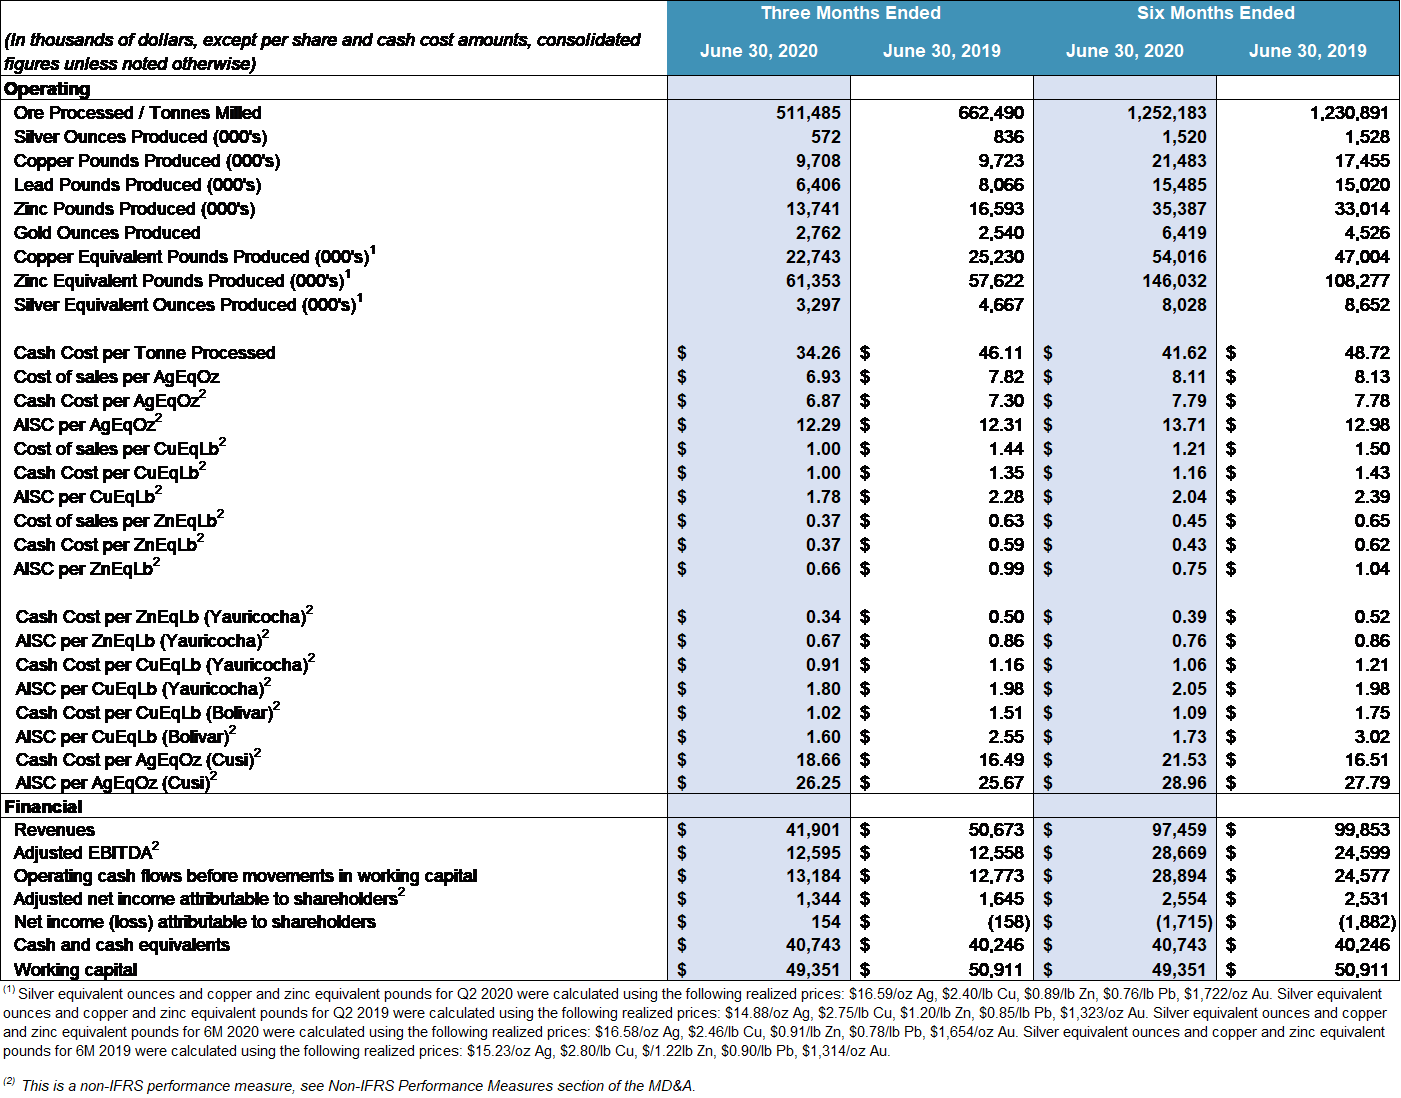
The following table displays selected financial and operational information for the three and six months ended June 30, 2020:
 

Q2 2020 Financial Highlights

  • Revenue from metals payable of $41.9 million in Q2 2020 decreased by 17% from $50.7 million in Q2 2019. Revenues declined due to the COVID-19 pandemic, which impacted mine production and metal prices during the quarter. Average realized prices in Q2 2020 for copper, zinc and lead were 13%, 26% and 11% lower respectively as compared to realized prices in Q2 2019. Silver and gold prices were 11% and 30% higher than their respective average realized prices in Q2 2019;
  • Yauricocha’s cost of sales per copper equivalent payable pound was $0.94 (Q2 2019 – $1.27), cash cost per copper equivalent payable pound was $0.91 (Q2 2019 – $1.16), and AISC per copper equivalent payable pound of $1.80 (Q2 2019 – $1.98). The decrease in the AISC per copper equivalent payable pound for Q2 2020 compared to Q2 2019 was due to lower cash costs and lower sustaining costs, which were partially offset by increase in treatment and refining charges and lower number of equivalent copper pounds sold;
  • Bolivar’s cost of sales per copper equivalent payable pound was $1.01 (Q2 2019 – $1.77), cash cost per copper equivalent payable pound was $1.02 (Q2 2019 – $1.51), and AISC per copper equivalent payable pound was $1.60 (Q2 2019 – $2.55) for Q2 2020. The decrease in the AISC per copper equivalent payable pound was largely due to lower cash costs, lower sustaining costs and higher copper equivalent pounds sold as compared to Q2 2019;
  • Cusi’s cost of sales per silver equivalent payable ounce was $16.33 (Q2 2019 – $10.99), cash cost per silver equivalent payable ounce was $18.66 (Q2 2019 – $16.49), and AISC per silver equivalent payable ounce was $26.25 (Q2 2019 – $25.67) for Q2 2020. AISC per silver equivalent payable ounce increased largely due to lower amount of equivalent silver sold as compared to Q2 2019, as concentrate inventory at the end of Q1 2020 was sold during Q2 2020. There was no production at Cusi throughout the quarter;
  • Adjusted EBITDA(1) of $12.6 million for Q2 2020 was in-line with Q2 2019;
  • Net income (loss) attributable to shareholders for Q2 2020 was $0.2 million (Q2 2019: $(0.2) million) or $0.00 per share (basic and diluted) (Q2 2019: $(0.00));
  • Adjusted net income attributable to shareholders (1) of $1.3 million, or $0.01 per share, for Q2 2020 compared to the adjusted net income of $1.6 million, or $0.01 per share for Q2 2019;
  • A large component of the net income for every period is the non-cash depletion charge in Peru, which was $1.6 million for Q2 2020 (Q2 2019: $2.4 million). The non-cash depletion charge is based on the aggregate fair value of the Yauricocha mineral property at the date of acquisition of Corona of $371.0 million amortized over the total proven and probable reserves of the mine;
  • Cash flow generated from operations before movements in working capital of $13.2 million for Q2 2020 increased compared to $12.8 million in Q2 2019. The increase in operating cash flow is mainly the result of COVID-19 related reductions in general and administrative costs (“G&A”), as gross margins remained in-line with Q2 2019; and
  • Cash and cash equivalents of $40.7 million and working capital of $49.4 million as at June 30, 2020 compared to $43.0 million and $49.9 million, respectively, at the end of 2019. Cash and cash equivalents decreased due to $14.5 million of capital expenditures and interest payment of $2.3 million were partially offset by $14.7 million of operating cash flows.

 (1) This is a non-IFRS performance measure, see non-IFRS Performance Measures section of this MD&A.

Project Development

  • Mine development at Bolívar during Q2 2020 totaled 1,296 meters. To offset impact of lower capacities, affected by COVID-19, major portion of this development (1,282 meters) was to prepare stopes for mine production. The balance of 14 meters were developed at the deepening of ramps and service ramps to be used for ventilation and pumping in El Gallo Inferior and Bolivar West orebody; and
  • During Q2 2020, at the Cusi property, mine development totaled 146.0 meters to stope preparation in various zones within the mine;

Exploration Update

Peru:

In the Q2 2020, there was no surface exploration as a result of the Covid-19 emergency declaration. Underground exploration is planned to resume in September and surface exploration in October.

Mexico:

Bolivar

  • Total 1,344 meters were drilled in Q2 2020. 558 meters of surface exploration included 9 meters at Bolivar West and 549 meters at Porphyry System. Additionally, 786 meters were drilled inside the mine as infill drilling.

Cusi

  • During Q2 2020 the Company drilled 639.80 meters of surface diamond drilling to verify the settlement of the subsidence zone at the Promontorio area and to explore the extension of the NE veins system to the Northeast.

Guidance

The Company has issued revised 2020 production guidance and anticipates that 2020 copper equivalent production will range between 110.1 to 122.3 million pounds; or silver equivalent production will range between 17.4 to 19.4 million ounces; or zinc equivalent production will range between 286.8 to 318.7 million pounds. The decrease from the original 2020 guidance issued (see press release dated January 23, 2020) is related to work stoppages during the government mandated shutdowns due to the COVID-19 pandemic in Q2 2020. Please note that revised guidance assumes no further shutdowns or work stoppages as a result of the COVID-19 pandemic and is based solely on what management expects the Company’s operations can produce this year. 

A table summarizing 2020 production guidance has been provided below:
Approval to proceed with Expansion Studies

As per the ongoing strategy of the Company, the Board of Directors has approved a proposal by management for expenditure to study further expansions at all three mines beyond the current capacity ramp-up levels. These studies will incorporate the latest NI 43-101 mineral resource updates, including the significant mineral resource increases at Bolivar reported in December 2019 and in March 2020. We believe the Company has excellent land packages with tremendous resource growth potential to support further organic growth at all mines.

Conference Call and Webcast

Sierra Metals’ senior management will host a conference call on Friday, August 14, 2020, at 10:30 AM (EDT) to discuss the Company’s financial and operating results for the three months ended June 30, 2020.

Via Webcast:

A live audio webcast of the meeting will be available on the Company’s website:

https://event.on24.com/wcc/r/2393587/AB458B2015EA9FEC98705CC780F49912

The webcast, along with presentation slides, will be archived for 180 days at www.sierrametals.com.

Via phone:

To pre-register for this conference call, please use the registration link provided below. After registering, a confirmation will be sent through email, including dial in details and unique conference call codes for entry. As well, reminders will be sent to registered participants in advance of the call.

If you have trouble registering, and need extra assistance please dial: +1 (888) 869-1189 or +1 (706) 643-5902.

Registration is open throughout the live call, however, to ensure you are connected for the full call we suggest registering a day in advance or at minimum 10 minutes before the start of the call.


Conference Call Registration Link:

http://www.directeventreg.com/registration/event/3580728


Qualified Persons

All technical production data contained in this news release has been reviewed and approved by:

Americo Zuzunaga, FAusIMM (CP Mining Engineer) and Vice President of Corporate Planning is a Qualified Person and chartered professional qualifying as a Competent Person under the Joint Ore Reserves Committee (JORC) Australasian Code for Reporting of Exploration Results, Mineral Resources and Ore Reserves.


Augusto Chung, FAusIMM (CP Metallurgist) and Vice President Special Projects and Metallurgy and a chartered professional qualifying as a Competent Person on metallurgical processes.


About Sierra Metals

Sierra Metals Inc. is a diversified Canadian mining company focused on the production and development of precious and base metals from its polymetallic Yauricocha Mine in Peru, and Bolivar and Cusi Mines in Mexico. The Company is focused on increasing production volume and growing mineral resources. Sierra Metals has recently had several new key discoveries and still has many more exciting brownfield exploration opportunities at all three Mines in Peru and Mexico that are within close proximity to the existing mines. Additionally, the Company also has large land packages at all three mines with several prospective regional targets providing longer-term exploration upside and mineral resource growth potential.


The Company’s Common Shares trade on the Toronto Stock Exchange and the Bolsa de Valores de Lima under the symbol “SMT” and on the NYSE American Exchange under the symbol “SMTS”.


For further information regarding Sierra Metals, please visit www.sierrametals.com or contact any of the following at +1 416 366 7777 or by email at [email protected]:


Mike McAllister, CPIR

V.P., Investor Relations

Ed Guimaraes

CFO

Luis Marchese

CEO


Continue to Follow, Like and Watch our progress:

Web: www.sierrametals.com | Twitter: sierrametals | Facebook: SierraMetalsInc | LinkedIn: Sierra Metals Inc  | Instagram:
sierrametals | LinkedIn: SierraMetals


Forward-Looking Statements

This press release contains “forward-looking information” and “forward-looking statements” within the meaning of Canadian and U.S. securities laws related to the Company (collectively, “forward-looking information”). Forward-looking information includes, but is not limited to, statements with respect to the Company’s operations, including anticipated developments in the Company’s operations in future periods, the Company’s planned exploration activities, the adequacy of the Company’s financial resources, and other events or conditions that may occur in the future. Statements concerning mineral reserve and resource estimates may also be considered to constitute forward-looking statements to the extent that they involve estimates of the mineralization that will be encountered if and when the properties are developed or further developed. These statements relate to analyses and other information that are based on forecasts of future results, estimates of amounts not yet determinable and assumptions of management. Any statements that express or involve discussions with respect to predictions, expectations, beliefs, plans, projections, objectives, assumptions or future events or performance (often, but not always, using words or phrases such as “expects”, “anticipates”, “plans”, “projects”, “estimates”, “assumes”, “intends”, “strategy”, “goals”, “objectives”, “potential” or variations thereof, or stating that certain actions, events or results “may”, “could”, “would”, “might” or “will” be taken, occur or be achieved, or the negative of any of these terms and similar expressions) are not statements of historical fact and may be forward-looking information.

 

Forward-looking information is subject to a variety of risks and uncertainties, which could cause actual events or results to differ from those reflected in the forward-looking information, including, without limitation, the risks described under the heading “Risk Factors” in our Annual Information Form dated March 30, 2020 in respect of the year ended December 31, 2019 and other risks identified in the Company’s filings with Canadian securities regulators and the U.S. Securities and Exchange Commission, which filings are available at www.sedar.com and www.sec.gov, respectively.


The risk factors referred to above is not exhaustive of the factors that may affect any of the Company’s forward-looking information. Forward looking information includes statements about the future and are inherently uncertain, and the Company’s actual achievements or other future events or conditions may differ materially from those reflected in the forward-looking information due to a variety of risks, uncertainties and other factors. The Company’s statements containing forward-looking information are based on the beliefs, expectations and opinions of management on the date the statements are made, and the Company does not assume any obligation to update forward-looking information if circumstances or management’s beliefs, expectations or opinions should change, other than as required by applicable law. For the reasons set forth above, one should not place undue reliance on forward-looking information.