Tribune Publishing Company (TPCO) – Are You Serious?

Monday, January 04, 2021

Tribune Publishing Company (TPCO)
Are You Serious?

Tribune Publishing Co is a print and online media company that publishes various newspapers and websites. It creates and distribute content across its media portfolio, offering integrated marketing, media, and business services to consumers and advertisers, including digital solutions and advertising opportunities. The company manages its business as two distinct segments, M and X. Segment M is comprised of the company’s media groups excluding their digital revenues and related digital expenses, except digital subscription revenues when bundled with a print subscription. Segment X includes the company’s digital revenues and related digital expenses from local Tribune websites, third party websites, mobile applications, digital only subscriptions, Tribune Content Agency and BestReviews.

Michael Kupinski, Director of Research, Noble Capital Markets, Inc.

Refer to the full report for the price target, fundamental analysis, and rating.

    Large influx of cash. The company closed on the sale of BestReviews for a total price of $160 million. Tribune owns 60% of the company and we estimate that net proceeds from the transaction will be roughly $88 million. In total, the company is expected to have roughly $230 million in cash, including $30 million of restricted cash, or over $6 per share. We are raising our financial assessment from 3.5 to 4.0, which is above average.

    Surprising upside guidance.  Management guided 2021 adjusted EBITDA between $105 million and $113 million, well above our back of the envelop estimate of $79 million upon the sale of BestReviews. In fact, the guidance exceeds our original estimate of $99.2 million, which included BestReviews …


This Company Sponsored Research is provided by Noble Capital Markets, Inc., a FINRA and S.E.C. registered broker-dealer (B/D).

*Analyst certification and important disclosures included in the full report. NOTE: investment decisions should not be based upon the content of this research summary.  Proper due diligence is required before making any investment decision. 

The Expected Pace of the IPO Market in 2021


The Dollar Amount of IPOs in 2020 was Blistering. Will Deals Continue in 2021?


Despite the stellar year-over-year 2020 performance experienced by Wall Street, the bull icon was kept mainly under wraps. Instead, unprecedented use of the unicorn came to represent the spectacular deals surrounding private companies eyed by investors as they were brought public.

Investors put money into IPOs including those that fall into the unicorn category in totals that dwarfed all previous records. The explosion was not anticipated as 2020 began, and hopes were even more dim when lockdowns became certain. But a frenzy built as the value of tech companies grew during these lockdowns. IPO-mania is still very much alive; expectations and the current calendar of deals promise that this rampant pace will carry into 2021.


A unicorn is a term in the business world to indicate a privately held startup company valued at over $1 billion. The term was coined in 2013 by venture capitalist Aileen Lee, choosing the mythical animal to represent the statistical rarity of such successful ventures.
Wikipedia


Without Precedent

The previous record for deals closed in a year was $107.9 billion. This prior record was set more than two decades ago amidst the apex of the dot-com era in 1999.  The 20-year old benchmark was blown away in 2020 by a total of 454 companies that raised $167.2 billion on U.S. exchanges (through Dec. 25).

The pandemic-related changes in market activity and flow of business caused the number and type of companies going public to follow an unusual pattern. IPO activity is typically busiest early in the year and quieter in the later months. In 2020, $67.3 billion was raised in the fourth quarter; this is roughly six times that which was raised during the first quarter.

Some Hindsight

When businesses were asked or forced to shut down on pandemic-related concerns back in March, seasoned IPO players were preparing for yet another disappointing year after a tepid 2019.  As parts of global economies closed and eventually in the U.S., it seemed that it would be very difficult to successfully bring companies to market at a fair price. There was a brief pause following the stock market fall in March; then, the Federal Reserve signaled it would take extraordinary measures to keep the economy sound. The stock market, which was already on the rebound, continued its climb. Several new equity offerings began to soar; this caused others to accelerate any plans they had to bring their companies public. Since then, there has been what seems like a race to be the next successful IPO. The fundamental reasons for this enthusiasm, low rates, a changing economy, and strong markets. These conditions are all still firmly in place as we begin 2021.

SPAC Impact

Almost half of all money raised in the IPO market in 2020 was for Special Purpose Acquisition Companies (SPACs). The total amount raised through SPACs last year is close to six times the amount the vehicles had raised in 2019 (which was the previous record-setting year).

There were 242 SPACs created in 2020. This is four times the number created in 2019, according to SPAC Insider. The average size of a SPAC in 2020 was $335 million, nearly ten times the amount back in 2009.

From Here

Jeff Zajkowski, head of U.S. equity capital markets at JP Morgan Chase & Co, was quoted in the Wall Street Journal, “With interest rates near zero, there are few asset classes out there that offer a return above inflation. And U.S. equities is one of those, including IPOs.” The ease and success that IPOs were launched within 2020 and the familiarity and comfort investors developed with SPACS makes it seem certain that we will see another above-average year of activity.

There is no shortage of interesting privately held companies that are worth over a billion dollars. Unicorns like Robinhood, which in December brought Goldman Sachs in to advise them on going public in 2021. Others include the bitcoin exchange Coinbase Global Inc. and grocery-delivery service Instacart Inc. There are also international companies that have signaled they have plans to go public and may seek listing on a U.S. exchange. One notable example is South Korean e-commerce company, Coupang Corp. All indications are there will be a full calendar of opportunities for investors to pick through.


Suggested Reading:

Will Robinhood be Fined on Charges of Gamification?

SPAC Activity
Accelerating in 2020

Investment of
Excess Corporate Cash


Are you subscribed to Channelchek’s active YouTube channel?


Sources:

ETFs to
Tap into Increased IPOs for 2021

December IPOs

Number of IPOs in the U.S. from 1999 to 2019

Stock Market Swooned

Fell Short of Expectations.

Goldman Analyzed 4,481 IPOs over 25 Years

If You
Think There’s Something Strange About the 2019 IPO Market—You’re Right

Fed Unveils Major Expansion of Market Intervention

The Year in Deals Can Be Summed Up in 4 Letters

IPO Scoop


What Should the Price Range Be for Oil and Gas?


Well Productivity Improvements – Good for Producers, Bad for Energy Prices


Oil well production and improved drilling efficiency could keep the price per barrel low, even as demand picks up. Although today’s lower oil price range is largely demand-related, the result of pandemic related slowdowns, technology has been improving well output, this is also a culprit. The trend is also impacting natural gas.  Technology is not likely to reverse itself and reduce the capacity to bring oil to the surface. From a supply standpoint, oil prices could be stuck in a lower range, even in a booming economy.

Where the Growth in Oil Production is Greatest

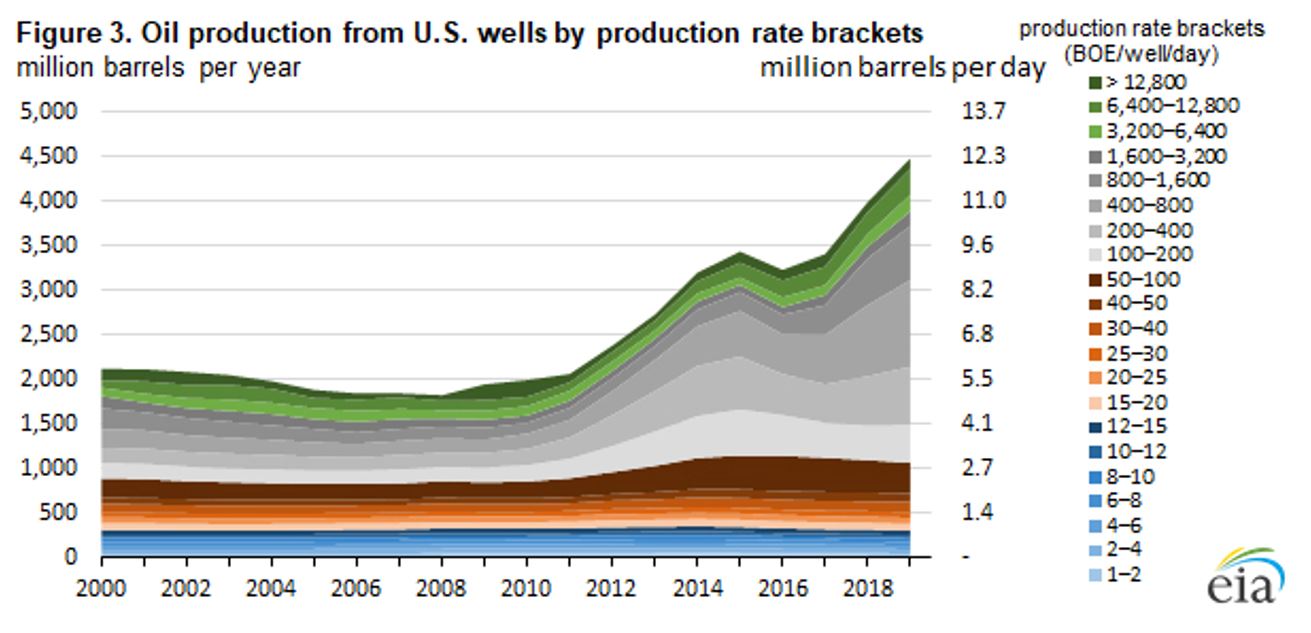
A recent study by the U.S. Energy Information Administration shows that technology improvements in the last decade have not only increased the overall production of oil and gas in the United States they have also dramatically increased production rates per well. To show this graphically, the EIA separated production into categories based on the size of the well. The graph below shows that the growth in oil production has occurred primarily from wells producing 100-1600 barrels of oil equivalent (BOE) per day. Interestingly, there has not been much growth in the number of production of large wells producing more than 3,200 BOE/day. The limited growth from “mega wells” reflects a decreased emphasis on drilling in the Gulf of Mexico and searching for giant discoveries. It is also worth noting that there has been little growth among smaller wells. These largely represent existing wells that have been in production for many years at steady rates.


Where the Growth in Natural Gas Production is Greatest

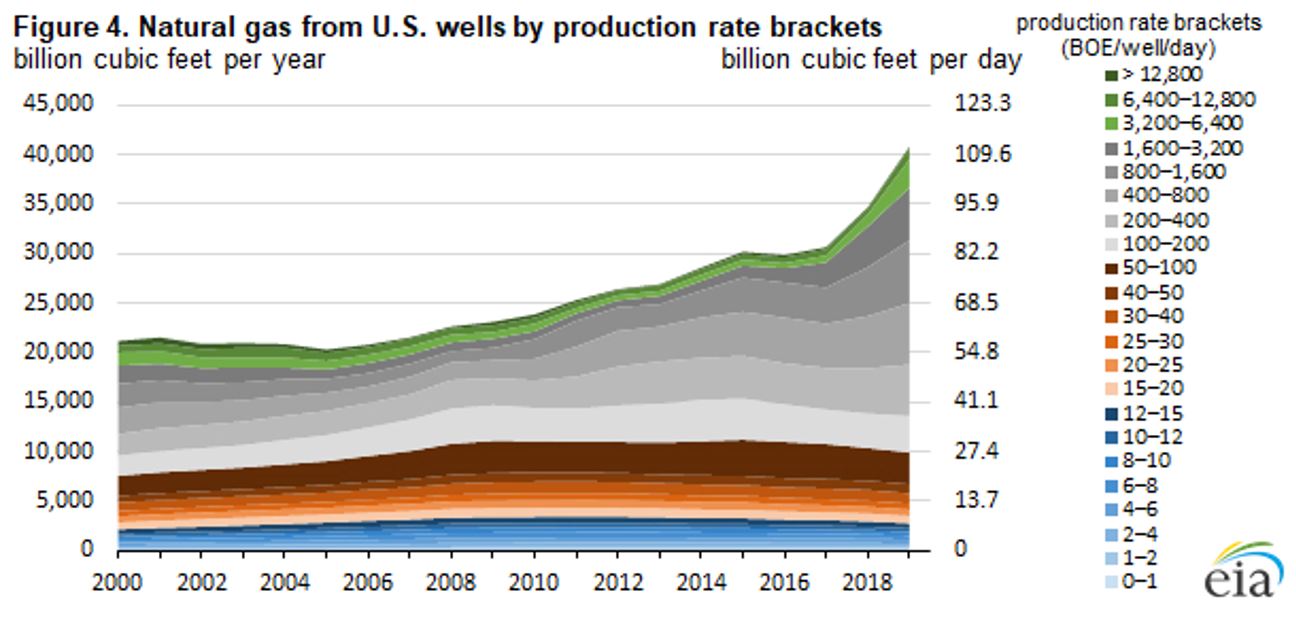
A similar story can be told by looking at natural gas well production.  The growth has come from the middle size wells and not the largest or smallest producing wells. Notably, the production growth has come during a period of low natural gas prices and does not yet reflect the impact of a rebound in natural gas prices in the second half of 2020.


Improved Drilling Methods

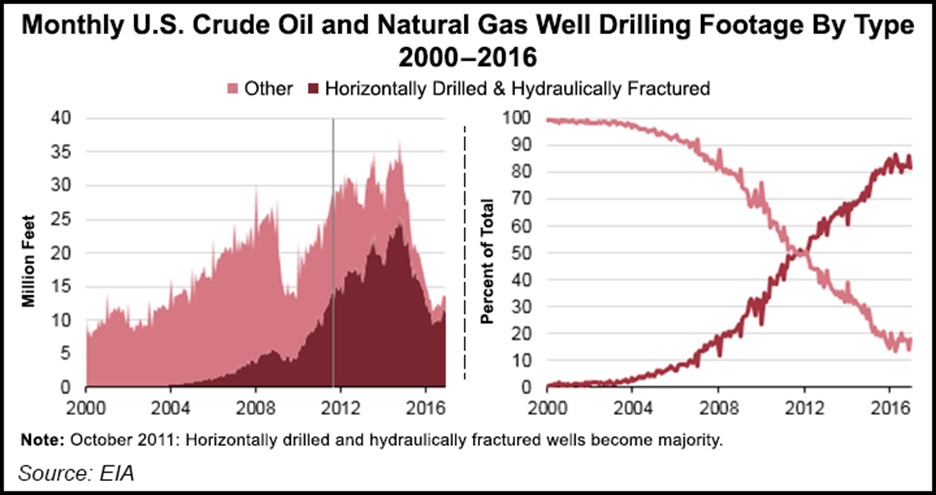
The growth in oil and natural gas production should come as no surprise. Horizontal drilling and fracking have improved initial productivity rates of middle-size wells. What is perhaps a surprise is the fact that improvements seem to be accelerating in recent years. Horizontal drilling began in the ‘70s, and fracking has been done for over 150 years, but it wasn’t until ten years ago that the use of horizontal drilling and fracking surged in the United States. Importantly, drillers continue to improve well production rates by finetuning the number and spacing of fracks per well, and the amount of pressure and viscosity used to frack a well. To complicate matters, the ideal drilling formula in one land formation may not work in another land formation. This has lead to a growth of producers that specialize in specific drilling locations.


It is a common theme among producers to report well production that surpasses expected “type curves”. At the same time, managements report a reduction in the number of days it takes to drill a well and thus its overall drilling cost. The result of reduced well cost and higher production has meant a higher return on investment. Higher returns have helped offset lower energy prices in 2019 and the first half of 2020.

Take-Away

Improved profitability is clearly positive for individual energy companies. As a whole, however, it means lower energy prices.  Drilling can continue at lower energy prices than before, and drilling will increase sooner when prices rise. If the natural trading range of oil was previously $40-$70 per barrel, perhaps the new range is now $30-$60 per barrel. And, for natural gas, perhaps the range has shifted from $2.50-$3.50 per mcf to $2.00-$3.00 per mcf. If true, current prices of $48 for oil and $2.40 for natural gas do not represent depressed levels but levels in the middle of the new trading ranges. And technology continues to improve. Ten years from now, we may be talking about even lower trading ranges. Technology is not going to reverse itself and cause trading ranges to rise.


Suggested Reading:

Small-Cap Energy Underperformance During the Drop in Oil is Unwinding

Are we headed to Another Oil Collapse?

Will Oil Prices Rise
in 2021?


Sources:

https://www.hartenergy.com/news/history-horizontal-directional-drilling-52314., Hart Energy, September 1, 2005

https://www.nrdc.org/stories/fracking-101#history, NRDC, April 19, 2019


Salem Media (SALM) Scheduled To Present at NobleCon17


Join Salem Media (SALM) CFO Evan Masyr at NobleCon17 – Noble Capital Markets 17th Annual Small & Microcap Investor Conference – January 19&20, 2021. Following a formal presentation, a seasoned Wall Street research analyst will join Evan to moderate a LIVE Q&A session. If you want to be added to the roster of presenters… or if you would like to join the virtual audience of investors, at no cost, go to nobleconference.com.

NobleCon 17 Complete Presenting Company Schedule

Gevo, Inc. (GEVO) – Debt free with higher pro forma cash balance moving into 2021

Thursday, December 31, 2020

Gevo, Inc. (GEVO)
Debt free with higher pro forma cash balance moving into 2021

Gevo Inc is a renewable chemicals and biofuels company engaged in the development and commercialization of alternatives to petroleum-based products based on isobutanol produced from renewable feedstocks. Its operating segments are the Gevo segment and the Gevo Development/Agri-Energy segment. By its segments, it is involved in research and development activities related to the future production of isobutanol, including the development of its biocatalysts, the production and sale of biojet fuel, its Retrofit process and the next generation of chemicals and biofuels that will be based on its isobutanol technology. Gevo Development/Agri-Energy is the key revenue generating segment which involves the operation of the Luverne Facility and production of ethanol, isobutanol and related products.

Poe Fratt, Senior Research Analyst, Noble Capital Markets, Inc.

Refer to the full report for the price target, fundamental analysis, and rating.

    Strong December stock price performance proved catalyst for debt conversion into equity. ATM program updated for opportunistic use.  In the updated ATM equity prospectus, we learned that the convert debt was fully converted into equity after strong stock price performance in December and 5.67 million shares were issued to Whitebox to retire the convert debt, including PIK interest and a make whole payment. About $14 million of cash was preserved and current cash is $79 million. In 4Q2020, ATM equity issuance raised $6.2 million and warrant exercises added ~$0.4 million.

    Potential milestones/catalysts over the next year: Expanding the supply contract portfolio with new industry/financial partners; Identifying engineering firm performing FEED work; Identifying equity and debt project financing partners; Awarding an EPC (Engineering/Procurement/Construction) contract to a construction firm; Financial closing of project debt/equity financing that allows the …


This Company Sponsored Research is provided by Noble Capital Markets, Inc., a FINRA and S.E.C. registered broker-dealer (B/D).

*Analyst certification and important disclosures included in the full report. NOTE: investment decisions should not be based upon the content of this research summary.  Proper due diligence is required before making any investment decision. 

Indonesia Energy Corp (INDO) – Shares surge 47 percent on rising oil prices

Thursday, December 31, 2020

Indonesia Energy Corp (INDO)
Shares surge 47% on rising oil prices

Indonesia Energy Corp Ltd is an oil and gas exploration and production company focused on Indonesia. It holds two oil and gas assets through its subsidiaries in Indonesia: one producing block (the Kruh Block) and one exploration block (the Citarum Block). The Kruh Block is located to the northwest of Pendopo, Pali, South Sumatra. The Citarum Block is located to the south of Jakarta.

Michael Heim, Senior Research Analyst, Noble Capital Markets, Inc.

Refer to the full report for the price target, fundamental analysis, and rating.

    The shares of INDO rose 47% on December 30 on heavy volume. The shares of INDO opened at $5.74 and quickly rose to $15.33 before ending the day at $7.11. The company did not report any news that might account for the rise in its stock. We would note that management gave an update on operations on November 23 and presented at a conference for microcap stocks on December 10. The shares of INDO are thinly traded with less than 1 million shares traded on average. More than 50 million shares were traded on Wednesday with most of the trades executed before noon.

    Oil prices have been rising.  Brent oil prices have been rising since the beginning of November and are now above $51 per barrel. The price INDO receives for oil production follows a complicated formula but generally tracks Brent oil prices. Current prices are above that assumed in our models which call for an average price of $45 in 2021 and $50 in 2022 and beyond. Drilling has been delayed into …


This Company Sponsored Research is provided by Noble Capital Markets, Inc., a FINRA and S.E.C. registered broker-dealer (B/D).

*Analyst certification and important disclosures included in the full report. NOTE: investment decisions should not be based upon the content of this research summary.  Proper due diligence is required before making any investment decision. 

Vectrus (VEC) – Another Major Win: OMDAC-SWACA Award

Thursday, December 31, 2020

Vectrus (VEC)
Another Major Win: OMDAC-SWACA Award

Vectrus Inc is a U.S.-based company that provides services to the U.S. government. It operates as one segment and offer facility and logistics services and information technology and network communications services. The information technology and network communications capabilities consist of communications systems operations and maintenance, management and service support, systems installation and activation, system-of-systems engineering and software development, and mission support for the department of defense. The facility and logistics service include airfield management, ammunition management, civil engineering, communications, emergency services, life support activities, public works, security, transportation operations and others.

Joe Gomes, Senior Research Analyst, Noble Capital Markets, Inc.

Refer to the full report for the price target, fundamental analysis, and rating.

    OMDAC-SWACA Award. Tuesday evening, the U.S. Army announced Vectrus was awarded an $882.5 million cost-plus-fixed-fee contract for operation, maintenance, and defense of Army communications (OMDAC-SWACA) with an estimated completion date of December 26, 2025. This is another major win for Vectrus, as OMDAC-SWACA accounted for approximately 15.6% of the Company’s 2019 revenues.

    Details.  The OMDAC-SWACA award of $882.5 million over the next five years is similar in value to what the contract provided Vectrus over the 2016-2020 period, which we estimate to have contributed a total of $932 million of revenue. The entire $882.5 million was obligated at the time of the …


This Company Sponsored Research is provided by Noble Capital Markets, Inc., a FINRA and S.E.C. registered broker-dealer (B/D).

*Analyst certification and important disclosures included in the full report. NOTE: investment decisions should not be based upon the content of this research summary.  Proper due diligence is required before making any investment decision. 

Eagle Bulk Shipping (EGLE) – Another Ultramax Acquisition Adds to Fleet Renewal

Wednesday, December 30, 2020

Eagle Bulk Shipping (EGLE)
Another Ultramax Acquisition Adds to Fleet Renewal

Eagle Bulk Shipping Inc. is a US-based drybulk owner-operator focused on the Supramax/Ultramax mid-size asset class, which ranges from 50,000 and 65,000 deadweight tons in size; these vessels are equipped with onboard cranes allowing for the self-loading and unloading of cargoes, a feature which distinguishes them from the larger classes of drybulk vessels and provides for greatly enhanced flexibility and versatility- both with respect to cargo diversity and port accessibility. The Company transports a broad range of major and minor bulk cargoes around the world, including coal, grain, ore, pet coke, cement, and fertilizer. Eagle operates out of three offices, Stamford (headquarters), Singapore, and Hamburg, and performs all aspects of vessel management in-house including: commercial, operational, technical, and strategic.

Poe Fratt, Senior Research Analyst, Noble Capital Markets, Inc.

Refer to the full report for the price target, fundamental analysis, and rating.

    Fleet renewal continues with another Ultramax acquisition. The fleet renewal program, which began in April 2016, continues. Another SDARI-64 Ultramax (to be renamed Stockholm Eagle), which was built in 2016 at Chengxi Shipyard and is outfitted with scrubbers, will be acquired for $17.65 million. The acquisition adds to two Ultramax acquisitions slated to close in 1Q2021. We believe that these moves represent a shift to growth after selling a total of five older Supramaxes with an average age of 18 years since mid-2020. The impact is positive from the perspectives of age profile and fuel consumption. Pro forma for the pending transactions, the fleet will total 48 vessels with an average age of ~8.8 years.

    Fine tuning 2021 EBITDA estimate to reflect new transaction.  No change to 2020 EBITDA estimate of $55.4 million based on TCE rates of $9.9k/day. The new transaction has a slight positive impact and our new 2021 EBITDA estimate is $77.2 million (up from $75.6 million). Forward cover is light into next year, but TCE rates have moved higher after firmer market fundamentals kicked in late 2Q2020 …


This research is provided by Noble Capital Markets, Inc., a FINRA and S.E.C. registered broker-dealer (B/D).

*Analyst certification and important disclosures included in the full report. NOTE: investment decisions should not be based upon the content of this research summary.  Proper due diligence is required before making any investment decision. 

Vectrus (VEC) – Zenetex Acquisition Expands and Deepens Offerings

Wednesday, December 30, 2020

Vectrus (VEC)
Zenetex Acquisition Expands and Deepens Offerings

Vectrus Inc is a U.S.-based company that provides services to the U.S. government. It operates as one segment and offer facility and logistics services and information technology and network communications services. The information technology and network communications capabilities consist of communications systems operations and maintenance, management and service support, systems installation and activation, system-of-systems engineering and software development, and mission support for the department of defense. The facility and logistics service include airfield management, ammunition management, civil engineering, communications, emergency services, life support activities, public works, security, transportation operations and others.

Joe Gomes, Senior Research Analyst, Noble Capital Markets, Inc.

Refer to the full report for the price target, fundamental analysis, and rating.

    Zenetex Acquisition. Monday evening, Vectrus announced it was acquiring Zenetex, accelerating its converged infrastructure strategy. Vectrus is paying $123 million, or $112 million, net, after $11 million of expected tax benefits, or approximately 8.4x 2020E adjusted EBITDA. The deal is expected to be accretive to VEC’s adjusted diluted EPS and adjusted EBITDA margin. The deal is expected to close before the end of 2020.

    Who is Zenetex? Zenetex is a leading provider of technical and strategic solutions focused on enabling mission readiness, performance, and enhanced protection for defense and national security clients globally. For 2020, the Company is expected to generate revenue in excess of $200 million and we estimate around $13 million of adjusted EBITDA. The Company is at the front end of significant new …


This Company Sponsored Research is provided by Noble Capital Markets, Inc., a FINRA and S.E.C. registered broker-dealer (B/D).

*Analyst certification and important disclosures included in the full report. NOTE: investment decisions should not be based upon the content of this research summary.  Proper due diligence is required before making any investment decision. 

Voyager Digital (VYGVF)(VYGR:CA) Scheduled To Present at NobleCon17


Join Voyager Digital (VYGVF)(VYGR:CA) CEO Steve Ehrlich at NobleCon17 – Noble Capital Markets 17th Annual Small & Microcap Investor Conference – January 19&20, 2021. Following a formal presentation, a seasoned Wall Street research analyst will join Steve to moderate a LIVE Q&A session. If you want to be added to the roster of presenters… or if you would like to join the virtual audience of investors, at no cost, go to nobleconference.com.

NobleCon 17 Complete Presenting Company Schedule

Endeavour Silver (EXK)(EDR:CA) Scheduled To Present at NobleCon17


Join Endeavour Silver (EXK)(EDR:CA) CEO Bradford Cooke & CFO Dan Dickson at NobleCon17 – Noble Capital Markets 17th Annual Small & Microcap Investor Conference – January 19&20, 2021. Following a formal presentation, a seasoned Wall Street research analyst will join Bradford and Dan to moderate a LIVE Q&A session. If you want to be added to the roster of presenters… or if you would like to join the virtual audience of investors, at no cost, go to nobleconference.com.

NobleCon 17 Complete Presenting Company Schedule

Aurania Resources (AUIAF)(ARU:CA) Scheduled To Present at NobleCon17


Join Aurania Resources (AUIAF)(ARU:CA) CEO Keith Barron at NobleCon17 – Noble Capital Markets 17th Annual Small & Microcap Investor Conference – January 19&20, 2021. Following a formal presentation, a seasoned Wall Street research analyst will join Keith to moderate a LIVE Q&A session. If you want to be added to the roster of presenters… or if you would like to join the virtual audience of investors, at no cost, go to nobleconference.com.

NobleCon 17 Complete Presenting Company Schedule

Release – U.S. Gold Corp. (USAU) – Drills 244 m of Continuous Mineralization at the CK Gold Project in Wyoming


U.S. Gold Corp. Drills 244 m (800 ft) of Continuous Mineralization, Including 78.3 Meters (257 ft) of 5.708 g/t AuEq from Surface for its Fourth Metallurgical Hole at the CK Gold Project in Wyoming


  • Earlier test hole CK20-04cA, which was lost at 29.6m (97 ft) and averages 29.2 meters of 5.075 g/t AuEq, shows similar grades and mineralization thicknesses as CK20-04cB.
  • 04cB also includes an interval of 104 meters (342 ft) of 1.41 g/t AuEq below the higher-grade intercept.
  • Drill hole location was to obtain metallurgical sample for process optimization from the center of the deposit as outlined by historical drilling, 380 ft east from CK20-01c, released December 16, 2020.

ELKO, Nevada, Dec. 29, 2020 /PRNewswire/ — U.S. Gold Corp. (NASDAQ: USAU) (the “Company”), a gold exploration and development company, is pleased to announce additional results of the recent twenty-nine hole drilling program for its CK Gold Project, an advanced stage gold and copper exploration and development project located just outside of Cheyenne, Wyoming.

George Bee, President and CEO of U.S. Gold Corp. commented, “We believe that hole CK20-04cB results returned an outstanding intercept of higher-grade gold and copper mineralization from the core of the CK Gold deposit. Perceptions in the past have been that CK Gold is just a low-grade deposit but our drilling to date verifies a higher-grade component, with attractive grades at the core of the deposit. As detailed in our previous releases, this is some of the first material that would be mined in any potential future mining operation and could lead to a quicker payback period after mine construction, should a positive PFS and FS be produced for the project. Metallurgical work is currently in progress on a composite created from holes CK20-04cA and 04cB at KCA of Reno, Nevada.”

CK Gold Project 2020 drilling results summary table:

https://www.usgoldcorp.gold/properties/ck-gold-project/2020-drilling/hole-4-ck-2020-drill-hole-intercepts-table

Assumptions: Grades quoted represent contained metal as assayed. The calculation of equivalent gold grade assumes the spot prices for gold, silver and copper as quoted at Kitco.com on December 10, 2020 and does not account for metallurgical recoveries. Future press releases will utilize these same metal prices for all gold-equivalent value calculations.

3D Visualization

A VRIFY 3D model of the CK Gold Project including the drill results announced today is available through the following

https://vrify.com/embed/decks/2020-12-29-US-Gold-Copper-King-PR

CK20-04cB assay intervals:

www.usgoldcorp.gold/properties/ck-gold-project/2020-drilling/hole-4b-assay-intervals

Comments on hole CK20-04cB results:

  • Shows continuous, attractive gold and copper grades for the length of the hole and verifies historic drill results in the core of the deposit
  • Drilled vertical in known mineralization, parallel to strike and along steep dip in the center of a historically drill defined higher-grade zone that appears open at depth to the northwest (see VRIFY deck)
  • Terminated at planned depth in lower-grade mineralization for priority metallurgical purposes
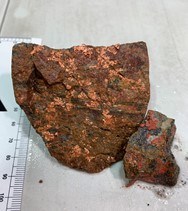


Image 1: Native copper in core from CK20-04cA
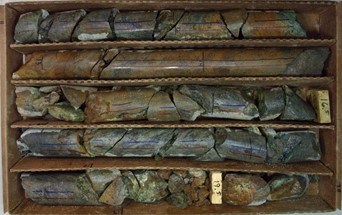


Image 2: Hole CK20-04cA core is similar to the top 100 feet of CK20-04cB (shown

Geologic observations:

Results from hole CK20-04cB continue to demonstrate the continuity of attractive gold and copper mineralization within this part of the CK Gold Project deposit. The higher-grade material starting at surface to approximately 100 feet depth is characterized by strongly foliated-gneissic granodiorite showing abundant iron oxides, native copper and green secondary copper minerals. This is followed at depth by a thin zone of mixed iron oxides, pyrite, chalcocite and chalcopyrite, and gives way at further depth to primary mineralization dominated by chalcopyrite with some bornite. Previous operators interpreted this highly sheared zone to be silicified but the Company’s work shows much of the silicification to be quartz segregations in gneissic fabric. To date, intensity of shearing seems to visually correlate with sulfide content. See the links above which provide a cross section of hole CK20-04cB and a link to U.S. Gold’s VRIFY deck which shows all holes released to date relative to historical drilling.

QA/QC Procedure

U.S. Gold Corp. employs a rigorous QA/QC protocol on all aspects of sampling and analytical procedure. Drill core is checked, logged, marked for sampling and sawn in half. One-half of each drill core is maintained for future reference and the other half of each drill core is sent to Bureau Veritas an ISO 17025 accredited laboratory in Reno, Nevada to complete all sample preparation and assaying. Samples are analyzed employing fire assaying with atomic absorption finish for gold and four acid ICP-MS analysis for silver and copper. For QA/QC purposes, certified standards, blank samples and sample duplicates are inserted into the sample stream. U.S. Gold Corp. also periodically submits sample pulps to another independent laboratory for check analysis.

COVID-19 Policy

U.S. Gold Corp. recognizes the heightened health risks associated with the current pandemic. At this stage of the CK Gold Project development, focusing largely on the gathering of information from the field, our personnel, contractors and consultants do not need to come into close contact with others apart from work within individual pods such as the drill crew and core logging personnel. Much of our work is conducted outdoors and physically separated. Meetings are conducted from remote locations using available video conferencing software. When it is necessary for individuals to meet or visit facilities, health guidelines are followed to avoid and minimize the risk of spreading the COVID-19 virus. We take the health and safety all those associated with our activities very seriously. If necessary, we will suspend activities and observe quarantine regimens until any health uncertainty passes.

Note on Qualified Person

QP Review: This statement has been reviewed by Kevin Francis, P Geo, SME Registered Member, Principle of Mineral Resource Management LLC who has inspected the data furnished in this announcement and has knowledge of the activities outlined in the CK Gold Project update. Acting within the scope of his expertise, Mr. Francis as a Qualified Person, has reviewed the information provided and finds it to be accurate and reflecting facts.

About U.S. Gold Corp.

U.S. Gold Corp. is a publicly traded, U.S. focused gold exploration and development company. U.S. Gold Corp. has a portfolio of exploration properties. Copper King, now the CK Gold Project, is located in Southeast Wyoming and has a Preliminary Economic Assessment (PEA) technical report, which was completed by Mine Development Associates. Keystone and Maggie Creek are exploration properties on the Cortez and Carlin Trends in Nevada. The Challis Gold Project is located in Idaho. For more information about U.S. Gold Corp., please visit www.usgoldcorp.gold

Safe Harbor


Certain statements in this press release are forward-looking within the meaning of the Private Securities Litigation Reform Act of 1995. These statements may be identified by the use of forward-looking words such as “anticipate,” “believe,” “forecast,” “estimated,” and “intend,” among others. These forward-looking statements are based on U.S. Gold Corp.’s current expectations, and actual results could differ materially from such statements. There are a number of factors that could cause actual events to differ materially from those indicated by such forward-looking statements. These factors include, but are not limited to, risks arising from: the prevailing market conditions for metal prices and mining industry cost inputs, environmental and regulatory risks, risks faced by junior companies generally engaged in exploration activities, whether U.S. Gold Corp. will be able to raise sufficient capital to implement future exploration programs, COVID-19 uncertainties, and other factors described in the Company’s most recent Annual Report on Form 10-K, Quarterly Reports on Form 10-Q, and Current Reports on Form 8-K filed with the Securities and Exchange Commission, which can be reviewed at www.sec.gov. The Company has based these forward-looking statements on its current expectations and assumptions about future events. While management considers these expectations and assumptions to be reasonable, they are inherently subject to significant business, economic, competitive, regulatory, and other risks, contingencies, and uncertainties, most of which are difficult to predict and many of which are beyond the Company’s control. The Company makes no representation or warranty that the information contained herein is complete and accurate and we have no duty to correct or update any information contained herein.

Cautionary Note to U.S. Investors Concerning Mineral Resources

We may use certain terms on this press release, which are defined in Canadian Institute of Metallurgy guidelines, the guidelines widely followed to comply with Canadian National Instrument 43–101– Standards of Disclosure for Mineral Projects (“NI 43–101”). We advise U.S. investors that these terms are not recognized by the United States Securities and Exchange Commission (the “SEC”). However, the SEC normally only permits issuers to report mineralization that does not constitute “reserves” by SEC standards as in place tonnage and grade without reference to unit measures. Note that a preliminary economic assessment is preliminary in nature, and it includes Inferred mineral resources that are considered too speculative geologically to have the economic considerations applied that would enable them to be classified as mineral reserves, and there is no certainty that the preliminary assessment will be realized.

For additional information, please contact:

U.S. Gold Corp. Investor Relations: +1 800 557 4550
[email protected]
www.usgoldcorp.gold

SOURCE U.S. Gold Corp.