Euroseas Ltd. (ESEA) – Higher Rate Charters Boost 2021 EBITDA and Price Target

Thursday, March 18, 2021

Euroseas Ltd. (ESEA)
Higher Rate Charters Boost 2021 EBITDA and Price Target

Euroseas Ltd. provides ocean-going transportation services worldwide. The company owns and operates containerships that transport dry and refrigerated containerized cargoes, including manufactured products and perishables; and drybulk carriers that transport iron ore, coal, grains, bauxite, phosphate, and fertilizers. As of March 31, 2017, it had a fleet of seven containerships; and six drybulk carriers, including three Panamax drybulk carriers, one Handymax drybulk carrier, one Kamsarmax drybulk carrier, and one Ultramax drybulk carrier. The company was founded in 2005 and is based in Maroussi, Greece.

Poe Fratt, Senior Research Analyst, Noble Capital Markets, Inc.

Refer to the full report for the price target, fundamental analysis, and rating.

    Two new charters at higher-than-expected rates announced. The charter on the EM Kea, a 2007-built 3,091 TEU vessel, was extended for 25-28 months at a rate of $22.0k/day, or well above the current rate of $8.1k/day. The Synergy Busan, a 2009-built 4,253 TEU vessel, entered into a new 36-40 month time charter contract at a rate of $25.0k/day, or well above the current rate of $12.0k/day.

    Net impact in the $3.5 million range.  We are increasing 2021 EBITDA estimate. Our new 2021 EBITDA is $31.1 million based on TCE rates of $14.8k/day, up from $27.6 million based on TCE rates of $14.1k/day …


This research is provided by Noble Capital Markets, Inc., a FINRA and S.E.C. registered broker-dealer (B/D).

*Analyst certification and important disclosures included in the full report. NOTE: investment decisions should not be based upon the content of this research summary.  Proper due diligence is required before making any investment decision. 

Gevo, Inc. (GEVO) – Looking Beyond Losses to Brighter Future

Thursday, March 18, 2021

Gevo, Inc. (GEVO)
Looking Beyond Losses to Brighter Future

Gevo Inc is a renewable chemicals and biofuels company engaged in the development and commercialization of alternatives to petroleum-based products based on isobutanol produced from renewable feedstocks. Its operating segments are the Gevo segment and the Gevo Development/Agri-Energy segment. By its segments, it is involved in research and development activities related to the future production of isobutanol, including the development of its biocatalysts, the production and sale of biojet fuel, its Retrofit process and the next generation of chemicals and biofuels that will be based on its isobutanol technology. Gevo Development/Agri-Energy is the key revenue generating segment which involves the operation of the Luverne Facility and production of ethanol, isobutanol and related products.

Poe Fratt, Senior Research Analyst, Noble Capital Markets, Inc.

Refer to the full report for the price target, fundamental analysis, and rating.

    As expected, 4Q2020/FY2020 operating losses continued. 4Q2020 revenue was minimal at $0.5 million and EBITDA was negative $5.1 million. FY2020 revenue was $5.5 million and EBITDA was negative $18.3 million. Recent capital raises increased cash to $531 million (on Feb 26th) and materially reduced funding risk.

    Tune in for today’s fireside chat on financing.  Water Tower Research will host another fireside chat with Gevo management on March 18th at 2:30pm EST. Gevo will be represented by CEO Dr. Patrick Gruber and CFO Lynn Smull. The main topic is slated to be project financing efforts. Details are posted at www.gevo.com …


This Company Sponsored Research is provided by Noble Capital Markets, Inc., a FINRA and S.E.C. registered broker-dealer (B/D).

*Analyst certification and important disclosures included in the full report. NOTE: investment decisions should not be based upon the content of this research summary.  Proper due diligence is required before making any investment decision. 

InPlay Oil (IPOOF)(IPO:CA) – Strong Quarter. Stronger 2021 Outlook

Thursday, March 18, 2021

InPlay Oil (IPOOF)(IPO:CA)
Strong Quarter. Stronger 2021 Outlook

As of April 24, 2020, Noble Capital Markets research on InPlay Oil is published under ticker symbols (IPOOF and IPO:CA). The price target is in USD and based on ticker symbol IPOOF. Research reports dated prior to April 24, 2020 may not follow these guidelines and could account for a variance in the price target. InPlay Oil is a junior oil and gas exploration and production company with operations in Alberta focused on light oil production. The company operates long-lived, low-decline properties with drilling development and enhanced oil recovery potential as well as undeveloped lands with exploration possibilities. The common shares of InPlay trade on the Toronto Stock Exchange under the symbol IPO and the OTCQZ Exchange under the symbol IPOOF.

Michael Heim, Senior Research Analyst, Noble Capital Markets, Inc.

Refer to the full report for the price target, fundamental analysis, and rating.

    InPlay reported strong 2020-4Q results. Results were generally favorable. Average production of 4,259 boe/d surpassed our 4,200 est. Pricing was in line with expectations that had been raised just last week. Operating costs of $14.35/boe was near our $14.00 estimate. Adjusted fund flow and EPS were slightly below recently raised expectations. Most importantly, total proved reserves grew 16% in 2020 on the heels of upward price revisions. The growth was higher than expected and what we believe will be a rarity for junior exploration companies.

    The outlook for 2021 is very favorable.  Energy prices are high, drilling is accelerating (3 wells completed in the 4Q), production rates are approaching pre-Covid levels, and production costs are low. Management raised their 2021 AFF to C$39-42 million from C$30.5-35.5 million leapfrogging our recently raised $35 million level. Finding costs of $9.85/boe are impressive and the company is poised to …


This Company Sponsored Research is provided by Noble Capital Markets, Inc., a FINRA and S.E.C. registered broker-dealer (B/D).

*Analyst certification and important disclosures included in the full report. NOTE: investment decisions should not be based upon the content of this research summary.  Proper due diligence is required before making any investment decision. 

Travelzoo (TZOO) – The Skies Are Looking Friendlier, But

Thursday, March 18, 2021

Travelzoo (TZOO)
The Skies Are Looking Friendlier, But

Travelzoo is a US-based company which acts as a publisher of travel and entertainment offers. The company informs a varied number of members in Asia Pacific, Europe, and North America, as well as millions of website users, about the best travel, entertainment and local deals available from various companies. It provides travel, entertainment, and local businesses in a flexible manner to the various customer. The company operates in three geographic segments namely Asia Pacific, Europe, and North America. Travelzoo derives its revenue through advertising fees including listing fees paid by travel, entertainment, and local businesses to advertise their offers on company’s media properties. Most of the company’s revenue is derived from the North America.

Michael Kupinski, Director of Research, Noble Capital Markets, Inc.

Refer to the full report for the price target, fundamental analysis, and rating.

    Soft Q4 results. Revenues of $12.5 million was lighter than our $14.6 million estimate as travel restrictions kept consumers from leisure international travel. In addition, the revenues were below management’s previous guide. Operating cash flow stayed positive, however, at $569,000, although it was lighter than our estimate of $1.4 million.

    Voucher sales remain strong.  Consumers appear to have a heightened interest to travel. Voucher sales for future travel remains strong. As a result, the company’s cash position substantially increased from $51.7 million at the end of Q3 to $64.2 million (including restricted cash) at the end of December, 2020 …


This Company Sponsored Research is provided by Noble Capital Markets, Inc., a FINRA and S.E.C. registered broker-dealer (B/D).

*Analyst certification and important disclosures included in the full report. NOTE: investment decisions should not be based upon the content of this research summary.  Proper due diligence is required before making any investment decision. 

Release – Ocugen (OCGN) – Provides Business Update and Full Year 2020 Financial Results


Ocugen Provides Business Update and Full Year 2020 Financial Results


Conference Call and Webcast Today at 8:30 a.m. ET

  • COVID-19 vaccine candidate, COVAXIN™, demonstrates efficacy of 81% in Phase 3 interim results
  • Emergency Use Authorization pathway with U.S. regulatory authorities in development for COVAXIN™
  • European Commission grants orphan medicinal product designation for OCU400 for retinitis pigmentosa and leber congenital amaurosis and Ocugen is on track to submit an Investigational New Drug application for OCU400 in 2021
  • On track to initiate four Phase 1/2 clinical trials encompassing Ocugen’s ophthalmology pipeline in 2021 and 2022

MALVERN, Pa., March 18, 2021 (GLOBE NEWSWIRE) — Ocugen, Inc. (“Ocugen”) (NASDAQ: OCGN), a biopharmaceutical company focused on discovering, developing, and commercializing gene therapies to cure blindness diseases and developing a vaccine to save lives from COVID-19, today reported full year 2020 financial results along with a general business update.

“We made strong progress toward our goal of offering a differentiated vaccine to save lives from COVID-19 and in our work toward curing blindness diseases. We are actively working with U.S. regulatory authorities to develop a plan around Emergency Use Authorization in the United States for COVAXIN™ and are preparing to file an Investigational New Drug application to initiate our first two clinical trials for OCU400 in the second half of this year. Proceeds from our recent registered direct offering provide the financial resources to drive our COVAXIN™ development efforts and ophthalmology pipeline forward,” said Dr. Shankar Musunuri, Chairman, Chief Executive Officer, and Co-Founder of Ocugen.

Business Highlights:

  • Execution of Co-Development Agreement for COVAXIN™ in the U.S. Market – On February 2, 2021, Ocugen entered into a Co-Development, Supply and Commercialization Agreement with Bharat Biotech International Limited (“Bharat Biotech”) for the development and commercialization of COVAXIN™ in the U.S. market. Upon receipt of Emergency Use Authorization (“EUA”), Bharat Biotech will supply a specified minimum number of doses of COVAXIN™ and then support the technology transfer for manufacturing for the U.S. market. Ocugen will share the profits from the sale of COVAXIN™ in the U.S. market with Bharat Biotech, with Ocugen retaining 45% of the profits.
  • Steady Progress to Develop EUA Pathway in the United States for COVAXIN™ Supported by U.S. Leading Experts in Vaccines – Key members of Ocugen’s management team and key advisors possess proven expertise and a track record of success in vaccine development and commercialization. Ocugen has established a vaccine scientific advisory board composed of leading academic and industry experts with extensive experience in the vaccine field. Collectively, the team is working with U.S. regulatory authorities to develop the regulatory pathway to EUA in the U.S. market.
  • COVAXIN™ Demonstrates Efficacy of 81% in Phase 3 Interim Results – Interim results from Bharat Biotech’s Phase 3 trial in India showed that COVAXIN™ was well tolerated and demonstrated 81% efficacy in preventing COVID-19 in those without prior infection after the second dose. In addition, COVAXIN™ has been shown to induce immune responses against multiple protein antigens of the virus potentially reducing the possibility of mutant virus escape. This breadth of immune responses has been demonstrated by the ability of antibodies induced by COVAXIN™ to neutralize the U.K. variant of SARS-CoV-2. This broad-antigen containing vaccine has the potential to be effective against new emerging variants.
  • First Gene Therapy Candidate OCU400 On Track to Enter the Clinic in 2H21 – Based on Ocugen’s modifier gene therapy platform, Ocugen’s product candidate OCU400 represents a novel approach in that it has the potential to address multiple retinal diseases with one product. Ocugen is planning to file an Investigational New Drug application to initiate two Phase 1/2 clinical trials of OCU400 later this year for the treatment of two disease genotypes.
  • European Commission (“EC”) Grants Orphan Medicinal Product Designation for OCU400 for Retinitis Pigmentosa (“RP”) and Leber Congenital Amaurosis (“LCA”) – Designation by the EC further supports the potential broad spectrum application of OCU400 to treat many IRDs. IRDs associated with RP and LCA diseases are caused by mutations in over 175 genes, and it is impractical to develop therapies that are specific to each gene.
  • Capital Raised – Ocugen’s cash, cash equivalents, and restricted cash totaled approximately $46.6 million as of February 28, 2021. Subsequent to December 31, 2020, Ocugen generated net proceeds of $4.8 million under an at-the-market offering and net proceeds of $21.2 million under a registered direct offering.

Full Year 2020 Financial Results:

  • Ocugen’s cash, cash equivalents, and restricted cash totaled $24.2 million as of December 31, 2020, compared to $7.6 million as of December 31, 2019. The Company had 184.0 million shares of common stock outstanding as of December 31, 2020.
  • Research and development expenses for the year ended December 31, 2020 were $6.4 million compared to $8.1 million for the year ended December 31, 2019. General and administrative expenses for the year ended December 31, 2020 were $8.0 million compared to $6.1 million for the year ended December 31, 2019. Ocugen reported a $0.31 net loss per share for the year ended December 31, 2020 compared to a $1.46 net loss per share for the year ended December 31, 2019.

Conference Call and Webcast Details

Ocugen has scheduled a conference call and webcast for 8:30 a.m. eastern time today to discuss the financial results and recent business highlights. Ocugen’s senior management team will host the call, which will be open to all listeners. There will also be a question and answer session following the prepared remarks.

The call can be accessed by dialing (844) 873-7330 (U.S.) or (602) 563-8473 (international) and providing the conference ID 2375087. To access a live audio webcast of the call on the “Investors” section of the Ocugen website, please click here. A replay of the webcast will be archived on Ocugen’s website for approximately 45 days following the call.

About Ocugen, Inc.
Ocugen, Inc. is a biopharmaceutical company focused on discovering, developing, and commercializing gene therapies to cure blindness diseases and developing a vaccine to save lives from COVID-19. Our breakthrough modifier gene therapy platform has the potential to treat multiple retinal diseases with one drug – “one to many” and our novel biologic product candidate aims to offer better therapy to patients with underserved diseases such as wet age-related macular degeneration, diabetic macular edema, and diabetic retinopathy. We are co-developing Bharat Biotech’s COVAXIN™ vaccine candidate for COVID-19 in the U.S. market. For more information, please visit www.ocugen.com.

Cautionary Note on Forward-Looking Statements
This press release contains forward-looking statements within the meaning of The Private Securities Litigation Reform Act of 1995, which are subject to risks and uncertainties. We may, in some cases, use terms such as “predicts,” “believes,” “potential,” “proposed,” “continue,” “estimates,” “anticipates,” “expects,” “plans,” “intends,” “may,” “could,” “might,” “will,” “should” or other words that convey uncertainty of future events or outcomes to identify these forward-looking statements. Such forward-looking statements include information about qualitative assessments of available data, potential benefits, expectations for clinical trials, and anticipated timing of clinical trial readouts and regulatory submissions. This information involves risks and uncertainties that could cause actual results to differ materially from those expressed or implied by such statements. Risks and uncertainties include, among other things, the uncertainties inherent in research and development, including the ability to meet anticipated clinical endpoints, commencement and/or completion dates for clinical trials, regulatory submission dates, regulatory approval dates and/or launch dates, as well as risks associated with preliminary and interim data (including the Phase 3 interim data related to COVAXIN™), including the possibility of unfavorable new clinical trial data and further analyses of existing clinical trial data; the risk that clinical trial data are subject to differing interpretations and assessments, including during the peer review/publication process, in the scientific community generally, and by regulatory authorities; whether and when data from Bharat Biotech’s clinical trials will be published in scientific journal publications and, if so, when and with what modifications; whether the U.S. Food and Drug Administration (“FDA”) will be satisfied with the design of and results from preclinical and clinical studies of COVAXIN™, which have been conducted by Bharat Biotech in India; whether and when any biologics license and/or EUA applications may be filed in the United States for COVAXIN™; whether and when any such applications may be approved by the FDA; decisions by the FDA impacting labeling, manufacturing processes, safety and/or other matters that could affect the availability or commercial potential of COVAXIN™ in the United States, including development of products or therapies by other companies. These and other risks and uncertainties are more fully described in our periodic filings with the Securities and Exchange Commission (“SEC”), including the risk factors described in the section entitled “Risk Factors” in the quarterly and annual reports that we file with the SEC. Any forward-looking statements that we make in this press release speak only as of the date of this press release. Except as required by law, we assume no obligation to update forward-looking statements contained in this press release whether as a result of new information, future events or otherwise, after the date of this press release.

This press release contains a preliminary estimate of Ocugen’s cash, cash equivalents, and restricted cash as of February 28, 2021. The preliminary estimate should not be viewed as a substitute for interim financial statements prepared in accordance with U.S. generally accepted accounting principles. The preliminary estimate is based on preliminary unaudited information and management estimates as of February 28, 2021, is not a comprehensive statement of Ocugen’s financial results, and is subject to the completion of Ocugen’s financial closing procedures. As a result, this preliminary estimate may differ from the actual results that will be reflected in Ocugen’s financial statements when they are completed and publicly disclosed. Additional information and disclosures would be required for a more complete understanding of Ocugen’s financial position as of February 28, 2021. Ocugen’s independent registered public accounting firm has not conducted an audit or review of, and does not express an opinion or any other form of assurance with respect to, the preliminary estimate.

Corporate Contact:
Ocugen, Inc.
Sanjay Subramanian
Chief Financial Officer and Head of Corporate Development
[email protected]

Media Contact:
LaVoieHealthScience
Lisa DeScenza
[email protected]
+1 978-395-5970

(tables to follow)

OCUGEN, INC.
CONSOLIDATED BALANCE SHEETS
(UNAUDITED)

  December 31,
2020
  December 31,
2019
Assets      
Current assets      
Cash and cash equivalents $ 24,039,325     $ 7,444,052  
Prepaid expenses and other current assets 1,838,357     1,322,167  
Asset held for sale     7,000,000  
Total current assets 25,877,682     15,766,219  
Property and equipment, net 632,967     222,464  
Restricted cash 151,226     151,016  
Other assets 714,477     667,747  
Total assets $ 27,376,352     $ 16,807,446  
Liabilities and stockholders’ equity      
Current liabilities      
Accounts payable $ 395,034     $ 1,895,613  
Accrued expenses 2,930,395     2,270,045  
Short-term debt, net 234,119      
Operating lease obligation 44,248     172,310  
Other current liabilities 9,755     205,991  
Total current liabilities 3,613,551     4,543,959  
Non-current liabilities      
Operating lease obligation, less current portion 389,317     163,198  
Long term debt, net 1,823,043     1,072,123  
Other non-current liabilities     9,755  
Total liabilities 5,825,911     5,789,035  
Stockholders’ equity      
Common stock 1,841,334     527,467  
Treasury Stock (47,864 )   (47,864 )
Additional paid-in capital 93,058,748     62,018,632  
Accumulated deficit (73,301,777 )   (51,479,824 )
Total stockholders’ equity 21,550,441     11,018,411  
Total liabilities and stockholders’ equity $ 27,376,352     $ 16,807,446  


OCUGEN, INC.
CONSOLIDATED STATEMENTS OF OPERATIONS
(UNAUDITED)

  Year ended December 31,
  2020   2019
Revenues      
Collaboration revenue $ 42,620     $  
Total revenues 42,620      
Operating expenses      
Research and development 6,353,287     8,085,522  
In-process research and development 7,000,000      
General and administrative 7,974,050     6,077,097  
Total operating expenses 21,327,337     14,162,619  
Loss from operations (21,284,717 )   (14,162,619 )
Other income (expense)      
Change in fair value of derivative liabilities     (3,187,380 )
Loss on debt conversion     (341,136 )
Interest income 1,065     1,214  
Interest expense (720,963 )   (1,767,836 )
Other income (expense) 182,662     (784,873 )
Total other income (expense) (537,236 )   (6,080,011 )
Net loss $ (21,821,953 )   $ (20,242,630 )
Deemed dividend related to Warrant Exchange (12,546,340 )    
Net loss to common stockholders $ (34,368,293 )   $ (20,242,630 )
       
Shares used in calculating net loss per common share — basic and diluted 112,236,110     13,893,819  
Net loss per share of common stock — basic and diluted $ (0.31 )   $ (1.46 )
               

SOURCE: Ocugen

QuickChek – March 18, 2021


Seanergy Maritime Holdings Corp. to Acquire Two Additional Capesize Vessels

Seanergy Maritime Holdings Corp. announced that it has entered into agreements with unaffiliated third parties to purchase two Capesize vessels.

Research, News & Market Data on Seanergy Maritime

Watch recent presentation from NobleCon17


Ocugen Provides Business Update and Full Year 2020 Financial Results

Ocugen, Inc. reports full year 2020 financial results along with a general business update.

Research, News & Market Data on Ocugen

Watch recent presentation from NobleCon17


PDS Biotech Reports Financial Results for the Year Ended December 31, 2020

PDS Biotechnology Corporation announced its financial results for the year ended December 31, 2020 and provided a business update.

Research, News & Market Data on PDS Biotechnology

Watch recent presentation from PDS Biotechnology


Palladium One Expands High-Grade at Kaukua South, Drills 47 Meters

Palladium One Mining Inc. announced that 34 holes have been drilled as part of the 17,500-meter Phase II Resource Definition drill program at Kaukua South.

Research, News & Market Data on Palladium One


Stay up to date. Follow us:

Release – PDS Biotechnology (PDSB) – Reports Financial Results for the Year Ended December 31 2020


PDS Biotech Reports Financial Results for the Year Ended December 31, 2020 and Provides Business Update


FLORHAM PARK, N.J., March 18, 2021 (GLOBE NEWSWIRE) — PDS Biotechnology Corporation (Nasdaq: PDSB), a clinical-stage immunotherapy company developing novel cancer therapies and infectious disease vaccines based on the Company’s proprietary Versamune® T-cell activating technology, today announced its financial results for the year ended December 31, 2020 and provided a business update.

Recent Business Highlights:

  • Achieved preliminary efficacy benchmark in the Phase 2 combination trial of PDS0101 led by the National Cancer Institute.
  • Initiated VERSATILE-002, a Phase 2 trial of lead investigational drug candidate PDS0101, in combination with standard of care KEYTRUDA® for first-line treatment of patients with metastatic or recurrent HPV-positive head and neck cancer.
  • Phase 2 trial of lead investigational drug candidate PDS0101, in combination with standard of care chemoradiotherapy for patients with advanced cervical cancer was initiated by the University of Texas MD Anderson Cancer Center.
  • Expanded consortium for development of PDS0203, a novel, Versamune®-based second-generation COVID-19 vaccine to include Blanver Farmoquímica in addition to Farmacore.
  • Received award commitment of up to $60 million from Brazil’s Ministry of Science, Technology and Innovation (MCTI) to fund clinical development and commercialization of PDS0203.
  • Strengthened leadership team with the appointment of Seth Van Voorhees as Chief Financial Officer and addition of preeminent oncologist Otis Brawley, M.D. to the board of directors.

“Despite the challenges of 2020, the PDS Biotech team remained focused on the advancement of our Versamune®-based drug pipeline,” commented Dr. Frank Bedu-Addo, President and Chief Executive Officer of PDS Biotech. “Through that commitment and the strength of our partnerships with leading institutions in the fields of immuno-oncology and infectious disease, we made significant strides in solidifying the safety profile and establishing the efficacy of our Versamune® platform and products as we continue to progress our portfolio towards commercialization.”

Full Year 2020 Financial Results

For the year ended December 31, 2020, the net loss was approximately $14.8 million, or $0.89 per basic share and diluted share, compared to a net loss of approximately $7.0 million, or $1.44 per basic share and diluted share for the year ended December 31, 2019.

For the year ended December 31, 2020, research and development expenses increased to $7.9 million compared to $6.1 million during the prior year. The increase was primarily the result of increased expenses related to manufacturing and personnel costs for the ongoing clinical studies.

For the year ended December 31, 2020, general and administrative expenses decreased to $7.0 million compared to $11.0 million during 2019. The $4.0 million decrease was due to decreases in personnel costs of $0.4 million, non-cash stock-based compensation of $2.4 million, D&O insurance costs of $0.5 million, legal fees of $0.5 million and professional fees of $0.2 million.

Total operating expenses for 2020 were $14.9 million, a decrease of approximately 29% compared to $21.0 million during the prior year.

The company’s cash balance as of December 31, 2020 was $28.8 million.

Conference Call and Webcast

The conference call is scheduled to begin at 8:00 am ET on Thursday, March 18, 2021. Participants should dial 877-407-3088 (United States) or 201-389-0927 (International) and mention PDS Biotech. Participants can also access the conference call via webcast on the investor relations page of the Company’s corporate website (link).

The event will be archived in the investor relations section of PDS Biotech’s website for 6 months. In addition, a telephonic replay of the call will be available for 6 months. The replay can be accessed by dialing 877-660-6853 (United States) or 201-612-7415 (International) with confirmation code 13716518.

About PDS Biotechnology

PDS Biotech is a clinical-stage immunotherapy company with a growing pipeline of cancer immunotherapies and infectious disease vaccines based on the Company’s proprietary Versamune® T-cell activating technology platform. Versamune® effectively delivers disease-specific antigens for in
vivo 
uptake and processing, while also activating the critical type 1 interferon immunological pathway, resulting in production of potent disease-specific killer T-cells as well as neutralizing antibodies. PDS Biotech has engineered multiple therapies, based on combinations of Versamune® and disease-specific antigens, designed to train the immune system to better recognize disease cells and effectively attack and destroy them. To learn more, please visit www.pdsbiotech.com or follow us on Twitter at @PDSBiotech.

Forward Looking Statements

This communication contains forward-looking statements (including within the meaning of Section 21E of the United States Securities Exchange Act of 1934, as amended, and Section 27A of the United States Securities Act of 1933, as amended) concerning PDS Biotechnology Corporation (the “Company”) and other matters. These statements may discuss goals, intentions and expectations as to future plans, trends, events, results of operations or financial condition, or otherwise, based on current beliefs of the Company’s management, as well as assumptions made by, and information currently available to, management. Forward-looking statements generally include statements that are predictive in nature and depend upon or refer to future events or conditions, and include words such as “may,” “will,” “should,” “would,” “expect,” “anticipate,” “plan,” “likely,” “believe,” “estimate,” “project,” “intend,”  “forecast,” “guidance”, “outlook” and other similar expressions among others. Forward-looking statements are based on current beliefs and assumptions that are subject to risks and uncertainties and are not guarantees of future performance. Actual results could differ materially from those contained in any forward-looking statement as a result of various factors, including, without limitation: the Company’s ability to protect its intellectual property rights; the Company’s anticipated capital requirements, including the Company’s anticipated cash runway and the Company’s current expectations regarding its plans for future equity financings; the Company’s dependence on additional financing to fund its operations and complete the development and commercialization of its product candidates, and the risks that raising such additional capital may restrict the Company’s operations or require the Company to relinquish rights to the Company’s technologies or product candidates; the Company’s limited operating history in the Company’s current line of business, which makes it difficult to evaluate the Company’s prospects, the Company’s business plan or the likelihood of the Company’s successful implementation of such business plan; the timing for the Company or its partners to initiate the planned clinical trials for PDS0101, PDS0203 and other Versamune® based products; the future success of such trials; the successful implementation of the Company’s research and development programs and collaborations, including any collaboration studies concerning PDS0101, PDS0203 and other Versamune®
based products and the Company’s interpretation of the results and findings of such programs and collaborations and whether such results are sufficient to support the future success of the Company’s product candidates; the acceptance by the market of the Company’s product candidates, if approved; the timing of and the Company’s ability to obtain and maintain U.S. Food and Drug Administration or other regulatory authority approval of, or other action with respect to, the Company’s product candidates; and other factors, including legislative, regulatory, political and economic developments not within the Company’s control, including unforeseen circumstances or other disruptions to normal business operations arising from or related to COVID-19. The foregoing review of important factors that could cause actual events to differ from expectations should not be construed as exhaustive and should be read in conjunction with statements that are included herein and elsewhere, including the risk factors included in the Company’s annual and periodic reports filed with the SEC. The forward-looking statements are made only as of the date of this press release and, except as required by applicable law, the Company undertakes no obligation to revise or update any forward-looking statement, or to make any other forward-looking statements, whether as a result of new information, future events or otherwise.

Media & Investor Relations Contact:

Deanne Randolph
PDS Biotechnology
Phone: +1 (908) 517-3613
Email: [email protected]

Jacob Goldberger
CG Capital
Phone: +1 (404) 736-3841
Email: [email protected]


PDS BIOTECHNOLOGY CORPORATION AND SUBSIDIARIES
Condensed Consolidated
Balance Sheets


December 31,

2020


December 31,

2019

ASSETS


Current assets:


Cash and cash equivalents

$

28,839,565


$

12,161,739


Prepaid expenses and other


1,497,665


2,308,462


Total current assets


30,337,230


14,470,201


Property and equipment, net


5,443


21,051


Operating lease right-to-use asset


547,706


Total assets

$

30,890,379


$

14,491,252


LIABILITIES AND STOCKHOLDERS’ EQUITY


Current liabilities:


Accounts payable

$

1,415,224


$

1,197,720


Accrued expenses


1,735,322


1,097,640


Restructuring reserve


498,185


Operating lease obligation – short term


119,904


Total current liabilities


3,270,450


2,793,545


Noncurrent liability:


Operating lease obligation – long term


490,353


Total liabilities

$

3,760,803


$

2,793,545


STOCKHOLDERS’ EQUITY


Common stock, $0.00033 par value, 75,000,000 shares authorized at December 31, 2020 and
   December 31, 2019, 22,261,619 shares and 5,281,237 shares issued and outstanding at
   December 31, 2020 and December 31, 2019, respectively


7,346


1,742


Additional paid-in capital


70,907,315


40,633,670


Accumulated deficit


(43,785,085

)


(28,937,705

)

Total stockholders’ equity


27,129,576


11,697,707


Total liabilities and stockholders’ equity

$

30,890,379


$

14,491,252


PDS BIOTECHNOLOGY CORPORATION AND SUBSIDIARIES
Condensed Consolidated
Statements of Operations and Comprehensive Loss


Year Ended December 31,


2020


2019


Operating expenses:


Research and development expenses

$

7,924,450


$

6,099,580


General and administrative expenses


6,962,328


10,981,765


Impairment expense IPRD


2,974,000


Lease termination costs


979,273


Depreciation


15,608


Total operating expenses


14,902,386


21,034,618


Loss from operations


(14,902,386

)


(21,034,618

)


Other income (expense):


Gain on bargain purchase upon merger


13,334,568


Interest income


55,006


353,490


Interest expense


(33,559

)


Loss before income taxes


(14,847,380

)


(7,380,119

)


Income taxes (benefit)


(381,513

)

Net loss and comprehensive loss

$

(14,847,380

)


$

(6,998,606

)


Per share information:


Net loss per share, basic and diluted

$

(0.89

)


$

(1.44

)


Weighted average common shares outstanding basic and diluted


16,745,044


4,868,079


SOURCE: PDS Biotechnology

Release – Palladium One Mining (NKORF)(PDM:CA) – Expands High-Grade at Kaukua South Drills 47 Meters


Palladium One Expands High-Grade at Kaukua South, Drills 47 Meters @ 2.6 g/t Pd_Eq, Including 12 Meters @ 4.2 g/t Pd_Eq


March 18, 2021 –
Toronto, Ontario –
Drilling has returned significant PGE (Platinum Group Element) grades of 47 meters at 2.6 g/t Pd_Eq, including 12 meters at
4.2 g/t Pd_Eq
. (Hole LK21-045), defining a high-grade core at Kaukua South on the Läntinen Koillismaa (“LK”) PGE-Ni-Cu project in Finland, said Palladium One Mining Inc. (“Palladium One” or the “Company”) (TSXV: PDM, FRA: 7N11, OTC: NKORF) today.

Thus far, 34 holes have been drilled as part of the 17,500-meter Phase II Resource Definition drill program at Kaukua South, including today’s results 22 have been released, while results for 12 holes are pending. Drilling has been strategically undertaken to define mineralization from surface to a depth of 200 metres, leaving mineralization open at depth, across the known 4-kilometer strike length of Kaukua South. In total 6,404-meters have been drilled to date as part of the Phase II program at Kaukua South, while an additional 860-meters (6 holes) of regional exploration has been undertaken.

Derrick Weyrauch, President and CEO of Palladium One said, “Drilling at Kaukua South continues to intersect impressive grades and widths, thereby proving up the known four-kilometer strike length of Kaukua South. Induced Polarization (IP) surveys have been started to expand the Kaukua South strike length by up to three kilometers. With robust drill results thus far and the potential to increase the Kaukua South strike length to seven kilometers we are optimistic that, in addition to our existing Kaukua National Instrument 43-101 pit constrained resource, a new multi-million ounce resource is well within our reach.”

“In addition to our Phase II Kaukua South drill program and to take advantage of winter drilling conditions, 2,000 meters (12 holes) were recently drilled on the Haukiaho zone. This drilling represents completion of the infill campaign that was launched in February 2020 and suspended in March 2020 due to Covid-19. The drill program was designed to provide additional data in advance of a NI43-101 resource estimate. Assay results are pending.” said Weyrauch.

Highlights

  • Drilling continues to
    demonstrate continuity of near surface open pit grades and widths at
    Kaukua South.
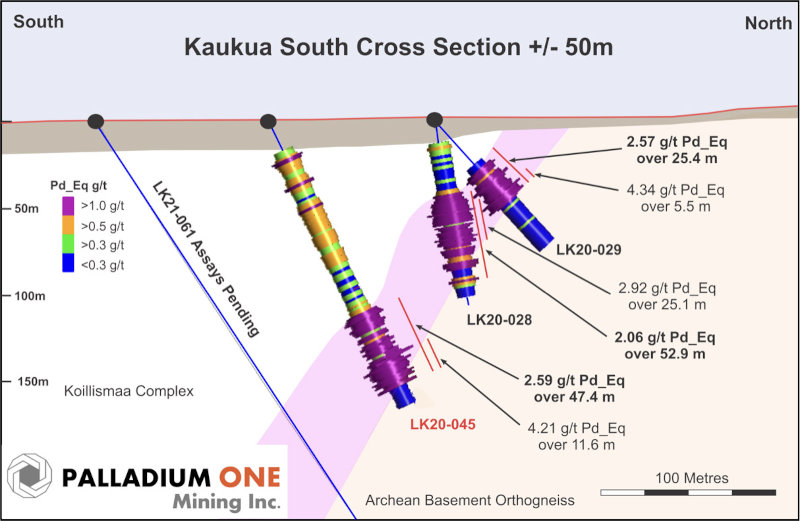
  • Core zone of 11.6 meters grading 4.21 g/t
    Palladium equivalent
    (“Pd_Eq”) within 47.4 meters grading 2.59 g/t
    Pd_Eq.
    in hole LK21-045, starting 123 meters down hole.
  • Core zone of 16.5 meters grading 2.52 g/t
    Pd_Eq,
    within 52.7
    meters grading 1.53 g/t Pd_Eq
    in hole LK21-046, starting 66 meters down hole.
  • 2,000 meters of drilling completed on the Haukiaho Zone to upgrade the historic resource to National Instrument 43-101 standards.

Kaukua South Infill Drilling

Kaukua South infill drilling continues to demonstrate consistent near surface open pit grades and widths. A total of 22 holes from the Phase II infill drill program on Kaukua South have now been released with intersections such as 53 meters at
2.1 g/t Pd_Eq,
in hole LK20-028 (see press release January 18, 2021) and 33 metres grading
2.0 g/t Pd_Eq
in hole LK20-034 (see news release March 11, 2021). These 22 holes cover approximately 1.3 kilometers of the Kaukua

IP Survey Underway

Induced Polarization (“IP”) surveys have proven to be highly successful at outlining palladium-rich disseminated copper-nickel sulphide mineralization on the LK Project. The discovery of Kaukua South in an overburden covered area with no previous drilling was a direct result of the Company’s 2020 IP survey.

The current IP survey is well advanced, with the western grid anticipated to be completed within the next week. The Company believes there is potential to extend the currently Kaukua South IP chargeability anomaly from the currently defined four to over seven kilometres of strike length (Figure 1).

Figure 1. Greater Kaukua area plan map, showing current NI 43-101 Kaukua Deposit conceptual pit outline (dashed yellow), Kaukua South and Murtolampi IP chargeability anomalies, and Palladium One drill hole locations. Holes labels in red form part of this release.

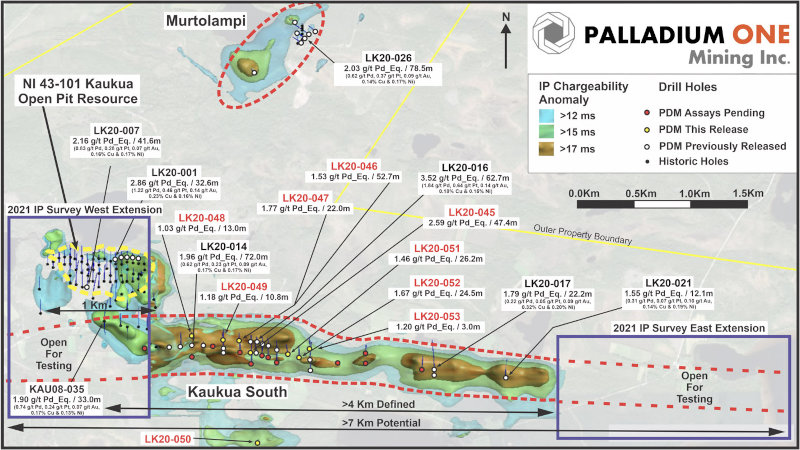
Figure 2. Kaukua South long-section looking north, holes labelled in red form part of this release

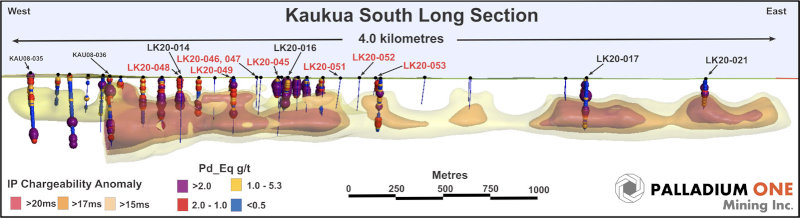
Figure 3. Cross Section showing Kaukua South infill holes LK20-027, 028, 045, looking west.

Haukiaho Drill Program

The Haukiaho Zone is located 15 kilometers to the South of Kaukua. In late February and early March 2021, the Company completed 2,000 meters (12 holes) of infill drilling to enable the historic Haukiaho resource to be upgraded to NI43-101 compliant standards. The Haukiaho Zone which hosts the historic Haukiaho deposit, is part of a 17-kilometre-long trend (Figure 4.), and prior to the discovery of the Kaukua South Zone had a top priority for the Company and it remains a significant asset of the greater LK project.

In March 2020, before being forced to shut down due to the first wave of the Covid-19 pandemic, the Company completed 3 holes on the Haukiaho Zone returning a core zone of 34.2
metres grading 2.09 g/t Pd_Eq. within 83.3 metres grading 1.27 g/t Pd_Eq
. in hole LK20-010 (see news release September 15, 2020).

In February 2020, the Company completed an IP survey covering five-kilometres of the Haukiaho Trend (see news release May 7, 2020). This survey identified three strong chargeability anomalies, one of which is associated with the core of the historic Haukiaho deposit, however the other two are in areas of sparse historic drilling. The eastern most of these three anomalies was prospected
by the Company in 2019, returning up to
3.3 g/t Pd_Eq. (0.51% Cu, 0.33% Ni, 0.56 g/t Pd, 0.18 g/t Pt, and 0.21 g/t Au), (see news release August 12, 2019).

Historic Haukiaho Resource Estimates
In 2013, Finore Mining Inc. completed a non-pit constrained NI43-101 historic resource with a 0.1 g/t Pd cut-off at Haukiaho comprising 23.2 million tonnes grading 1.51 g/t Pd_Eq (0.31 g/t Pd, 0.12g/t Pt, 0.10 g/t Au, 0.21% Cu, and 0.14% Ni) (See news release August 12, 2019 and May 7, 2020). This resource encompassed widely spaced drilling with a focus on maximizing tonnage, not grade. An earlier historic resource estimate completed by Outokumpu in the 1980’s covered a much larger part of the Haukiaho trend and was focused more on grade and used a 0.7% Cu_eq cut-off (defined as Cu% + 2 x Ni%) and returned 7 million tonnes grading 0.38% Cu and 0.24% Ni, however importantly, no PGE assays were conducted.

Figure 4. LK Project location map showing 43-101 compliant Kaukua deposit and historic Haukiaho resource along with 2020 IP grids (blue lines) and current 2021 IP grid areas (black boxes). Yellow lines represent Exploration Permits, red lines represent Exploration Reservations held by the Company.

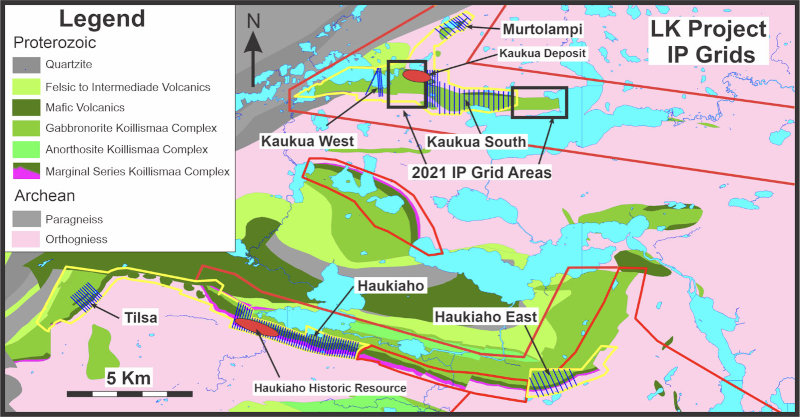
Figure 5. Haukiaho IP chargeability and 2020 DDH location map

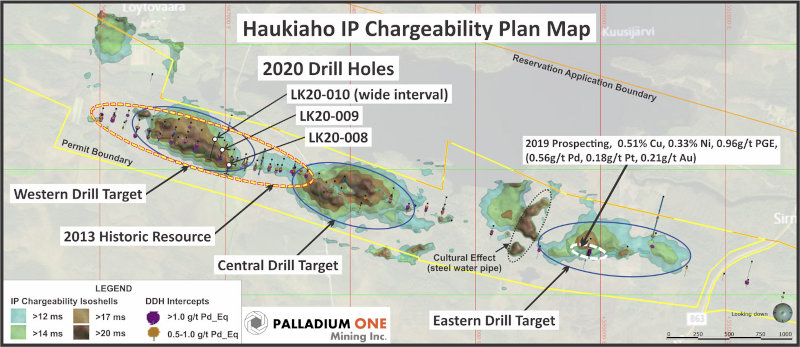
Table 1: Phase II infill drill results to date on Kaukua South

Zone

Hole

From
(m)

To
(m)

Width
(m)

Pd_Eq
g/t*

PGE g/t
(Pd+Pt+Au)

Pd
g/t

Pt
g/t

Au
g/t

Cu
%

Ni
%

Kaukua
South

LK20-027

103.4

155.0

51.6

1.98

1.07

0.72

0.27

0.08

0.17

0.15

Inc.

105.6

113.0

7.4

2.58

1.34

0.90

0.31

0.13

0.26

0.18

And

149.5

155.0

5.5

3.12

1.96

1.34

0.52

0.10

0.27

0.17

Inc.

153.5

155.0

1.5

6.14

4.09

2.79

1.15

0.15

0.56

0.28

Kaukua
South

LK20-028

42.6

95.5

52.9

2.06

1.44

1.00

0.36

0.08

0.11

0.11

Inc.

46.9

72.0

25.1

2.92

2.08

1.44

0.52

0.12

0.17

0.14

Inc.

50.5

60.0

9.5

3.56

2.52

1.75

0.61

0.16

0.23

0.16

Kaukua
South

LK20-029

37.5

62.9

25.4

2.57

1.87

1.30

0.46

0.11

0.15

0.11

Inc.

47.0

62.0

15.0

3.16

2.36

1.65

0.58

0.13

0.17

0.13

Inc.

56.5

62.0

5.5

4.34

3.36

2.36

0.82

0.18

0.20

0.16

Inc

56.5

57.7

1.2

6.15

4.97

3.54

1.26

0.17

0.25

0.21

Kaukua
South

LK20-030

26.4

86.5

60.1

1.88

1.00

0.68

0.24

0.07

0.17

0.14

Inc.

47.0

68.0

21.0

2.44

1.43

0.98

0.35

0.10

0.21

0.16

Inc.

53.0

54.5

1.5

3.94

2.69

1.78

0.78

0.12

0.28

0.20

Kaukua
South

LK20-031

17.9

61.5

43.6

1.94

1.12

0.76

0.27

0.09

0.16

0.13

Inc.

17.9

55.5

37.6

2.17

1.25

0.85

0.30

0.10

0.19

0.14

Inc.

24.5

35.0

10.5

2.81

1.60

1.09

0.39

0.11

0.27

0.18

Kaukua
South

LK20-032

60.3

108.3

48.0

1.81

0.84

0.57

0.21

0.06

0.16

0.16

Inc.

61.4

75.0

13.7

2.12

0.90

0.58

0.23

0.09

0.22

0.20

Kaukua
South

LK20-033

41.3

85.0

43.7

1.76

0.87

0.58

0.21

0.07

0.18

0.14

Inc.

42.7

56.3

13.7

2.33

1.21

0.83

0.28

0.10

0.21

0.18

Kaukua
South

LK20-034

86.9

119.5

32.7

2.05

1.16

0.81

0.26

0.09

0.16

0.15

Inc.

88.5

112.5

24.0

2.26

1.32

0.93

0.29

0.10

0.17

0.15

Inc.

88.5

97.5

9.0

3.06

1.98

1.41

0.45

0.12

0.20

0.17

Inc.

94.5

96.0

1.5

4.20

2.94

2.15

0.66

0.14

0.25

0.20

Kaukua
South

LK20-035

66.0

118.0

52.0

1.32

0.63

0.44

0.15

0.04

0.11

0.11

Inc

67.5

69.0

1.5

3.49

2.44

2.10

0.27

0.07

0.23

0.15

And

95.5

104.7

9.2

2.04

1.23

0.80

0.32

0.11

0.17

0.13

Kaukua
South

LK20-036

245.3

280.0

34.6

1.05

0.39

0.25

0.11

0.03

0.10

0.11

Inc.

259.0

260.5

1.5

1.72

0.86

0.62

0.16

0.07

0.15

0.14

Kaukua
South

LK20-042

115.5

158.9

43.4

1.41

0.77

0.53

0.19

0.05

0.09

0.12

Inc.

118.5

123.0

4.5

2.29

1.23

0.82

0.32

0.09

0.14

0.19

Kaukua
South

LK20-043

131.5

162.3

30.8

1.24

0.55

0.36

0.15

0.04

0.11

0.12

Inc.

133.0

136.0

3.0

2.05

1.16

0.82

0.32

0.02

0.05

0.20

Kaukua
South

LK20-044

156.8

173.8

17.0

1.38

0.62

0.41

0.14

0.06

0.14

0.12

Inc.

166.0

169.5

3.4

2.10

1.07

0.73

0.25

0.08

0.20

0.16

Kaukua South

LK20-045

122.8

170.2

47.4

2.59

1.74

1.20

0.42

0.11

0.17

0.14

Inc.

152.0

170.2

18.2

3.64

2.55

1.77

0.62

0.15

0.23

0.17

Inc.

155.0

166.6

11.6

4.21

2.92

2.03

0.72

0.18

0.27

0.20

Inc.

156.0

160.6

4.6

5.09

3.67

2.57

0.89

0.21

0.33

0.21

Inc.

156.0

157.5

1.5

7.18

5.18

3.67

1.23

0.28

0.44

0.31

Kaukua South

LK20-046

65.9

118.6

52.7

1.53

1.05

0.73

0.26

0.06

0.09

0.08

Inc.

73.0

89.5

16.5

2.52

1.79

1.23

0.44

0.12

0.13

0.13

Inc.

73.0

79.0

6.0

3.31

2.42

1.69

0.60

0.12

0.18

0.15

Kaukua South

LK20-047

36.0

58.0

22.0

1.77

1.11

0.75

0.29

0.07

0.12

0.11

Inc.

40.5

43.5

3.0

3.15

1.85

1.23

0.49

0.13

0.27

0.20

And

53.5

56.0

2.5

2.89

2.25

1.61

0.54

0.09

0.12

0.11

Kaukua South

LK20-048

80.0

93.0

13.0

1.08

0.55

0.35

0.15

0.05

0.09

0.09

Inc.

89.0

91.3

2.3

1.91

1.13

0.73

0.31

0.09

0.18

0.12

Kaukua South

LK20-049

16.2

27.0

10.8

1.18

0.52

0.33

0.13

0.06

0.13

0.10

Inc.

23.5

27.0

3.5

1.53

0.87

0.57

0.21

0.09

0.16

0.09

Kaukua Recon

LK20-050

no significant values

Kaukua South

LK21-051

118.8

145.0

26.2

1.46

0.55

0.36

0.13

0.06

0.16

0.15

Inc.

133.2

145.0

11.8

1.87

0.77

0.49

0.18

0.10

0.21

0.17

Kaukua South

LK21-052

53.0

62.7

9.7

1.04

0.36

0.22

0.10

0.04

0.09

0.12

Inc.

54.5

57.0

2.5

1.75

0.75

0.48

0.22

0.06

0.12

0.19

Zone

147.5

172.0

24.5

1.67

0.79

0.55

0.17

0.07

0.18

0.13

Inc.

147.5

152.0

4.5

2.17

0.91

0.65

0.20

0.06

0.38

0.14

Inc.

147.5

148.0

0.5

6.44

1.03

0.79

0.20

0.05

2.45

0.24

And

164.0

165.5

1.5

3.35

2.31

1.70

0.49

0.12

0.21

0.16

Kaukua South

LK21-053

60.0

63.0

3.0

1.20

0.51

0.33

0.13

0.06

0.11

0.11

Zone

93.9

101.4

7.5

0.77

0.25

0.15

0.07

0.03

0.05

0.10

* Reported widths are “drilled widths” not true widths.
** Orange shaded values previously released (see press release January 18, 2021 and March 11, 2021)

*Palladium Equivalent
Palladium equivalent is calculated using US$1,100 per ounce for palladium, US$950 per ounce for platinum, US$1,300 per ounce for gold, US$6,614 per tonne for copper, and US$15,4332 per tonne for nickel. This calculation is consistent with the calculation in the Company’s September 2019 NI 43-101 Kaukua resource estimate.

QA/QC
The Phase I drilling program was carried out under the supervision of Neil Pettigrew, M.Sc., P. Geo., Vice President of Exploration and a director of the Company.

Drill core samples were split using a rock saw by Company staff, with half retained in the core box and stored indoors in a secure facility, in Taivalkoski, Finland. The drill core samples were transported by courier from the Company’s core handling facility in Taivalkoski, Finland, to ALS Global (“ALS”) laboratory in Outokumpu, Finland. ALS, is an accredited lab and are ISO compliant (ISO 9001:2008, ISO/IEC 17025:2005). PGE analysis was performed using a 30 grams fire assay with an ICP-MS or ICP-AES finish. Multi-element analyses, including copper and nickel were analysed by four acid digestion using 0.25 grams with an ICP-AES finish.

Certified standards, blanks and crushed duplicates are placed in the sample stream at a rate of one QA/QC sample per 10 core samples. Results are analyzed for acceptance at the time of import. All standards associated with the results in this press release were determined to be acceptable within the defined limits of the standard used

Qualified Person
The technical information in this release has been reviewed and verified by Neil Pettigrew, M.Sc., P. Geo., Vice President of Exploration and a director of the Company and the Qualified Person as defined by National Instrument 43-101.

About Palladium One
Palladium One Mining Inc. is an exploration company targeting district scale, platinum-group-element (PGE)-copper nickel deposits in Finland and Canada. Its flagship project is the Läntinen Koillismaa or LK Project, a palladium dominant platinum group element-copper-nickel project in north-central Finland, ranked by the Fraser Institute as one of the world’s top countries for mineral exploration and development. Exploration at LK is focused on targeting disseminated sulfides along 38 kilometers of favorable basal contact and building on an established NI 43-101 open pit resource.

ON BEHALF OF THE BOARD
“Derrick Weyrauch”
President & CEO,
Director

For further information contact: Derrick Weyrauch, President
& CEO

Email: [email protected]

Neither the TSX Venture Exchange nor its Market Regulator (as
that term is defined in the policies of the TSX Venture Exchange) accepts
responsibility for the adequacy or accuracy of this release.

This press release
includes “forward-looking information” that is subject to a few
assumptions, risks and uncertainties, many of which are beyond the control of
the Company. Statements regarding listing of the Company’s common shares on the
TSXV are subject to all of the risks and uncertainties normally incident to
such events. Investors are cautioned that any such statements are not
guarantees of future events and that actual events or developments may differ
materially from those projected in the forward-looking statements. Such
forward-looking statements represent management’s best judgment based on
information currently available. Factors that could cause the actual results to
differ materially from those in forward-looking statements include regulatory
actions and general business conditions. Such forward-looking information
reflects the Company’s views with respect to future events and is subject to
risks, uncertainties and assumptions, including those set out in the Company’s
annual information form dated April 29, 2020 and filed under the Company’s
profile on SEDAR at www.sedar.com.
The Company does not undertake to update forward-looking statements or
forward-looking information, except as required by law. Investors are cautioned
that any such statements are not guarantees of future performance and actual
results or developments may differ materially from those projected in the
forward-looking statements.

SOURCE: Palladium One Mining

Release – Seanergy Maritime (SHIP) – to Acquire Two Additional Capesize Vessels


Seanergy Maritime Holdings Corp. to Acquire Two Additional Capesize Vessels


March 18,
2021 – Glyfada, Greece –
Seanergy Maritime Holdings Corp. (the “Company”) (NASDAQ: SHIP) announced today that it has entered into agreements with unaffiliated third parties to purchase two Capesize vessels. Following their delivery, the size of the Company’s fleet will increase to 14 Capesize vessels with an aggregate cargo capacity of approximately 2.5 million dwt.  

The first vessel was built in 2013 at a reputable shipyard in Japan, has a cargo-carrying capacity of approximately 176,000 deadweight tons (“dwt”) and shall be renamed M/V
Flagship. The vessel is expected to be delivered to the Company by the end of April 2021, subject to the satisfaction of certain customary closing conditions.  

The second vessel was built in 2010 at a reputable shipyard in Japan, has a cargo-carrying capacity of approximately 182,000 dwt and shall be renamed M/V Patriotship. The vessel is expected to be delivered to the Company by the end of May 2021, subject to the satisfaction of certain customary closing conditions.  

The special survey and ballast water treatment system installation for both vessels were completed recently by the current owners and therefore the Company does not anticipate incurring significant capital expenditure for these vessels at least for the next two years. Moreover, M/V Patriotship is fitted with an exhaust gas cleaning system (scrubber).  

The aggregate purchase price for the two vessels is approximately $55 million and is expected to be funded with cash on hand. The Company is also in discussions with leading financial institutions to finance part of the acquisition cost at competitive financing terms.  

Stamatis
Tsantanis, the Company’s Chairman & Chief Executive Officer, stated:
 

“We are very pleased to announce the acquisition of two high-quality Capesize vessels built at reputable shipyards in Japan. The M/Vs Flagship and Patriotship, both delivering promptly and in a rapidly increasing market environment, represent great added value for Seanergy, the only U.S. listed pure-play Capesize company. Following the delivery of these two vessels and a third acquisition announced last month, our fleet’s cargo carrying capacity will increase by 28% as compared to the beginning of the year.   

The average of the Baltic Capesize Index for the current quarter stands at substantially higher levels than for the same period in recent years, while the Capesize forward freight contracts (“FFA”) for the second half of 2021 are trading at $23,000 per day. Based on current FFA rates, the incremental net revenue from all three acquisitions announced so far this year may exceed $15 million for the remainder of the year, assuming the expected deliveries for the vessels. Seanergy is ideally positioned to capture the substantial improvement of the market as all the vessels of our fleet will be deployed in the spot market or on index-linked time charters.  

Since the beginning of 2021 we have concluded or have agreed to significant accretive transactions and we will continue to actively pursue similar deals, aiming to create substantial shareholder value in the coming years.” 

Company
Fleet upon Vessels’ delivery: 

Vessel Name 

Vessel Class 

Capacity (DWT) 

Year Built 

Yard 

Employment 

Partnership  

Capesize 

179,213 

2012 

Hyundai 

T/C Index Linked  

Championship  

Capesize 

179,238 

2011 

Sungdong 

T/C Index Linked  

Lordship  

Capesize 

178,838 

2010 

Hyundai 

T/C Index Linked  

Premiership 

Capesize 

170,024 

2010 

Sungdong 

T/C Index Linked  

Squireship 

Capesize 

170,018 

2010 

Sungdong 

T/C Index Linked  

Knightship 

Capesize 

178,978 

2010 

Hyundai  

T/C Index Linked  

Gloriuship 

Capesize 

171,314 

2004 

Hyundai 

T/C Index Linked  

Fellowship 

Capesize 

179,701 

2010 

Daewoo 

T/C Index Linked 

Geniuship 

Capesize 

170,058 

2010 

Sungdong 

T/C Index Linked 

Goodship 

Capesize 

177,536 

2005 

Mitsui Engineering 

Voyage/Spot 

Leadership 

Capesize 

171,199 

2001 

Koyo – Imabari 

Voyage/Spot 

Tradership 

Capesize 

176,925 

2006 

Japanese Shipyard 

N/A 

Flagship 

Capesize 

176,387 

2013 

Japanese Shipyard 

N/A 

Patriotship 

Capesize 

181,709 

2010 

Japanese Shipyard 

N/A 

  Total  

2,461,138         

14 


About
Seanergy Maritime Holdings Corp. 

Seanergy Maritime Holdings Corp. is the only pure-play Capesize ship-owner publicly listed in the US. Seanergy provides marine dry bulk transportation services through a modern fleet of Capesize vessels. Upon delivery of the new vessels, the Company’s operating fleet will consist of 14 Capesize vessels with an average age of 12 years and aggregate cargo carrying capacity of approximately 2,461,138 dwt. 

The Company is incorporated in the Marshall Islands and has executive offices in Glyfada, Greece. The Company’s common shares trade on the Nasdaq Capital Market under the symbol “SHIP”, its Class A warrants under “SHIPW” and its Class B warrants under “SHIPZ”. 

Please visit our company website at: www.seanergymaritime.com  

Forward-Looking
Statements 

This press release contains forward-looking statements (as defined in Section 27A of the Securities Act of 1933, as amended, and Section 21E of the Securities Exchange Act of 1934, as amended) concerning future events. Words such as “may”, “should”, “expects”, “intends”, “plans”, “believes”, “anticipates”, “hopes”, “estimates” and variations of such words and similar expressions are intended to identify forward-looking statements. These statements involve known and unknown risks and are based upon a number of assumptions and estimates, which are inherently subject to significant uncertainties and contingencies, many of which are beyond the control of the Company. Actual results may differ materially from those expressed or implied by such forward-looking statements. Factors that could cause actual results to differ materially include, but are not limited to, the Company’s operating or financial results; the Company’s ability to continue as a going concern; the Company’s liquidity, including its ability to service its indebtedness; competitive factors in the market in which the Company operates; shipping industry trends, including charter rates, vessel values and factors affecting vessel supply and demand; future, pending or recent acquisitions and dispositions, business strategy, areas of possible expansion or contraction, and expected capital spending or operating expenses; risks associated with operations outside the United States; risks associated with the length and severity of the ongoing novel coronavirus (COVID-19) outbreak, including its effects on demand for dry bulk products and the transportation thereof; and other factors listed from time to time in the Company’s filings with the SEC,  its most recent annual report on Form 20-F. The Company’s filings can be obtained free of charge on the SEC’s website at www.sec.gov. Except to the extent required by law, the Company expressly disclaims any obligations or undertaking to release publicly any updates or revisions to any forward-looking statements contained herein to reflect any change in the Company’s expectations with respect thereto or any change in events, conditions or circumstances on which any statement is based. 

For further
information please contact

Seanergy Investor Relations 
Tel: +30 213 0181 522 

E-mail: [email protected] 

Capital Link, Inc.  
Daniela Guerrero 
230 Park Avenue Suite 1536  
New York, NY 10169  
Tel: (212) 661-7566  
E-mail: [email protected]  

Source: Seanergy Maritime Holdings Corp.

Are Inflation and Interest Rates Expected to Rise?


What to Expect from the Fed in 2021 – Bottom Line


“The economy is a long way from our employment and inflation goals, and it is likely to take some time for
substantial further progress to be achieved.”

The above quote, taken from yesterday’s comments by Federal Reserve Chairman Jerome Powell, may have been intended to calm fears that the Fed may be removing some of their intense market accommodation. Leading up to this meeting, there was also concerns of additional fiscal stimulus that was feared may fuel inflation pressures and a concomitant rise in rates. This would undermine a smooth recovery. The statement after the FOMC meeting went a long way in addressing those concerns.

Economics is a social science and is impacted greatly by the actions of the masses. If the masses are confident, then there is more upward economic activity.  If the masses have concerns or doubts about the future, that very pessimism could undermine what could have been greater expansion. So, the Fed in its statements is inclined to be careful and put its more optimistic face forward. This is without regard to whether the economy is floundering or overheating. Their exuding confidence that they are in the driver’s seat and their “GPS” may show a need for some rerouting, but an expected “ETA” toward recovery is better than last projected, is what can be expected from any Fed statement.

New Economic Projections by the Fed

Most of the projections toward the Fed’s targets announced yesterday (March 17, 2021) were improved over the statements given in December. They now place their median estimate for 2021 Gross Domestic Product (GDP) at 6.5%, and 3.3% for 2022. This is significantly higher than the December forecasts of 4.2% and 3.2%. The Fed sees a reduction in unemployment and forecasts that it will reach 4.5%, the prior forecast was 5%. The unemployment rate for February was 6.2% as reported by the Department of Labor.

The inflation numbers the Fed targets are not the headline CPI-U (urban consumers) that we most often see reported or even the CPI-W (urban wage earners) that is used for COLA in many retirement plans and Social Security calculations. The Fed instead reviews Personal Consumption Expenditures inflation (see link in Sources). The Fed’s preferred price-growth gauge is projected to reach 2.4% in 2021, up from the previous 1.8% estimate. They anticipate inflation will then fall to 2% in 2022 and reach 2.1% the following year. In his post-meeting remarks, Fed Chairman Powell warned that the U.S. may experience higher than 2% inflation during 2021 but that any increases would taper next year.


Actions the Fed
Expects to Take

The short and the long of it is the Fed is not expected to raise rates before the end of 2023. As for the details, the FOMC is targeting maximum employment and inflation at the rate of 2 percent over the longer run. Inflation has been well below the 2% target. As a policy measure to achieve a long-term 2% rate of price increase, the Fed will aim for inflation moderately above 2 percent for some time so that inflation averages 2 percent over time. The goal is for longer-term inflation to be well anchored at 2%.

The Fed expects to maintain its accommodative (easy money) monetary policies until the Inflation goals are achieved and the economy nears full employment. The target range for the federal funds rate will be held at 0 to ¼%. They expect that this is the appropriate level until “labor market conditions have reached levels consistent with the Committee’s assessments of maximum employment and inflation has risen to 2 percent.” 

Additionally, the Federal Reserve will continue to increase its holdings of Treasury securities by at least $80 billion per month and of agency mortgage-backed securities by at least $40 billion per month. The goal of these purchases is to support the flow of credit to households and businesses.

Take-Away

We all have a stake in the economy, investors, workers, home-buyers, business owners, retirees, everyone. Actions the Fed does and does not take impact all of our lives. The main role of the Fed is to maintain a sound banking system by using the tools of monetary policy to maintain stable prices and reach maximum employment. The two are often at odds with each other.

Actions taken during 2020 in response to a medical crisis had a severe impact on the economy, which leaves the Fed (among others) in unchartered waters. The Feds projections have improved dramatically since December and are likely to be revised again along with expected actions to achieve their goals.

As for the overall outcome of the FOMC meeting, the stock and bond markets got what they were looking for, the Fed doesn’t see inflation as a problem, and it expects it will continue its extreme accommodative stance. Home-buyers may not have to rush to beat a mortgage rate surge, business owners can feel confident that the Fed is working to improve conditions, workers can feel confident that they haven’t been forgotten, and retirees can breathe a sigh of relief that the Fed feels inflation is well under control.

Paul Hoffman

Managing Editor, Channelchek


Suggested Reading:


Should Stock Market Investors Worry About Inflation? How Much is a Trillion?


The Correlation Between Stocks and Unemployment Will Janet Yellen as U.S. Treasury Secretary be Good for Investors?


Sources:

https://www.federalreserve.gov/monetarypolicy/files/fomcprojtabl20210317.pdf

https://www.federalreserve.gov/newsevents/pressreleases/monetary20210317a.htm

https://www.bls.gov/web/laus/lauhsthl.htm

https://www.bea.gov/data/personal-consumption-expenditures-price-index#:~:text=A%20measure%20of%20the%20prices,reflecting%20changes%20in%20consumer%20behavior.

https://inflationdata.com/Inflation/Inflation_Rate/CurrentInflation.asp?reloaded=true

Release – Golden Predator Mining (NTGSF)(GPY:CA) – Metal Investors Forum & Backstage Interview


Golden Predator Mining Corp and Viva Gold Corp: Metal Investors Forum & Backstage Interview


On March 5th, 2021 Golden Predator Mining Corp.’s Chief Executive Officer, Janet Lee-Sheriff, and Viva Gold Corp’s Chief Executive Officer, James Hesketh, presented an update on the Agreement between Golden Predator and Viva Gold to merge development stage assets in Nevada and Yukon. In the event you missed the live version we have provided the link to the presentation:

Golden Predator Mining: Metal Investors Forum Presentation: https://youtu.be/DDHh-UYvNyo

Greg McCoach also talks to Janet Lee-Sheriff and James Hesketh on the business combination and the assets in Golden Predator in the below interview: https://youtu.be/2YiVWPTTZfc

About Golden Predator Mining Corp.

Golden Predator is advancing the past-producing Brewery Creek Mine towards a timely resumption of mining activities, under its Quartz Mining and Water Licenses, in Canada’s Yukon. With established resources grading over 1.0 g/t gold the Company is completing a Bankable Feasibility Study for the  restart of heap leach operations. The Brewery Creek Mine project operates with a Socio Economic Accord with the Tr’ondëk Hwëch’in First Nation.

About Viva Gold Corp.

Viva Gold is a gold exploration and project development company with a focus on Nevada. Viva Gold holds 100% of the advanced Tonopah Gold Project, a large land position of approximately 8,800 acres with demonstrated high-grade measured, indicated and inferred gold resources, located on the prolific Walker Lane gold trend in Nevada. Viva’s management team has extensive experience in mining exploration, development and production and is supported by a Board of Directors and advisors who are proven mine finders, deal makers and financiers.  

For additional information:

Janet Lee-Sheriff
Golden Predator Mining Corp.
Chief Executive Officer
(604) 260-8435
[email protected]
www.goldenpredator.com

James Hesketh
Viva Gold Corp.
Chief Executive Officer
720-291-1775

[email protected]
www.vivagold.com

Source: Golden Predator Mining

Uranium is an ESG Energy Source Getting More Attention


How Does Uranium Fit Into the ESG Energy Landscape?


Since the November elections in the U.S., so-called ESG (environmental, social, and governance) stocks have seen a dramatic uptick as investors anticipate a shift in policy away from fossil fuels and towards cleaner-burning energy sources.

While perhaps not an obvious clean energy investment play, uranium and rare earth producers have benefitted from this ESG boom.  Despite the known risks associated with nuclear power, nuclear power plants represent a carbon and emission-free source of energy.

The months following the Fukushima disaster, in March 2011, saw a drop in nuclear-power generation of about 11%, but the industry remained strong, representing about 10% of total global electricity generation.  Today, In the U.S., nuclear power generates about 20% of the total electricity consumed.

Upward pressure on uranium’s price?

The price of uranium is driven by nuclear power demand, global supply and inventories, and macroeconomic and political factors. The highest demand for uranium is nuclear power use. Factors impacting this demand are the price of alternative generating fuels like coal, oil, and natural gas. Higher fossil-fuel prices increases demand for nuclear generation.

Nuclear accidents such as Chernobyl or the Fukushima tsunami have the potential to very quickly turn public sentiment against nuclear generation. These two accidents (Chernobyl 1986) and Fukishima Daiichi (2011) are the only two events with reported release of radioactivity. Although public sentiment towards nuclear quickly turned negative after these two and the Three Mile Island (1979) cooling malfunction, which did not involve radioactive release, there have been over 18,500 cumulative reactor-years of commercial nuclear power operation in 36 countries. Although this track record puts public safety numbers inline or lower than many other acceptable industries, it is still a factor in public policy.

Electricity demand is often correlated with a strong economy. When world economies are expanding, industries and consumers require more electricity. This increased demand drives more demand from all sources of power. With current politics leaning more heavily toward non-fossil fuel solutions to satisfy demand increases, nuclear power is again on the rise.

The current U.S. and global environment is one where demand for energy is increasing. Traditional generating fuels such as coal and oil are at odds with the current environmentally minded political climate. Fuels with minimum carbon emissions are gaining in popularity, adoption, and government support.


Some Companies Involved in Uranium Production

Energy Fuels (UUUU)

Energy Fuels is the leading U.S. producer of uranium and vanadium, and an emerging player in the commercial rare earth business where its work is helping to reestablish a fully integrated U.S. supply chain. The company boasts more production capacity, licensed mines and processing facilities, and in-ground uranium resources than any other U.S.-based producer.

Energy Fuels recently announced that they had received the first shipments of natural monazite ore, with commercial recovery of rare earths expected to begin in the U.S. in the coming weeks, as part of their increased “rare earths” focus.  In the press release, Mark S. Chalmers, President and CEO of Energy Fuels stated: “Over the past few months, Energy Fuels, Neo and Chemours have quietly worked to create something very significant: a new, fully-integrated, U.S.-Europe rare earth supply chain. This weekend’s shipments of monazite ore from Chemours to Energy Fuels marks the beginning of operations for what we believe will become a burgeoning supply chain. There is a lot of excitement building for rare earths, because they make many clean energy and advanced technologies possible, including electric vehicles, wind generation, batteries, and advanced electronics. Today’s announcement is a key milestone as our companies create, refine, and grow a sustainable rare earth supply chain capable of supplying the growing demand for clean technologies in the U.S. and Europe.

Over the past three months, the UUUU price per share has increased over 75%, with the company’s market cap recently surpassing $750MM.

Watch the video
replay
of Energy Fuels CEO Mark Chalmers presentation at NobleCon17 (January 2021).


enCore Energy Corp (ENCUF)

enCore Energy is a domestic uranium developer focused on becoming a leading in-situ recovery (ISR) uranium producer, based in the U.S. In-site recovery mining involves leaving the ore in the ground, dissolving the minerals in place and pumping the solution created to the surface.  enCore’s flagship ISR project hosts an indicated mineral resource containing 26.6 million pounds of uranium.  The company also has several high-grade conventional projects in the U.S.

In January, 2021 enCore Energy acquired Westwater Resources’ Texas-based uranium production and resource assets, which included two licensed in-situ recovery uranium production facilities, as well as mineral exploration leases in Texas, and more than 270 square miles of deeded mineral rights in New Mexico. 

William M. Sheriff, Executive Chairman of enCore Energy stated “This transformational acquisition is the first significant step to build enCore into a domestic uranium producer. Our experienced and accomplished management team believes that a major change is coming in the uranium market in the next 12 to 24 months. The recent impressive strength in the uranium equity market is evidence of a broader realization within the financial community of the early changes in the dynamics of the uranium market. In addition to the key acquisition of licensed production facilities in Texas, enCore will hold the leading land position in New Mexico, consolidating the large Santa Fe and Frisco railroad “checkerboard” mineral rights land grant running through most of the Grants mineral belt.

Shares of ENCUF have traded over 60% higher over the past 3 months.  The company’s market cap is just under $150MM.

Watch the video
replay
of encore Energy CEO Paul Goranson and Executive Chairman William Sheriff  presentation at NobleCon17 (January 2021).


Standard Uranium Ltd. (STTDF)

Standard Uranium is a pre-discovery uranium exploration company based in Canada.  The company’s primary focus is its Davidson River flagship project in the Southwest Athabasca Uranium District.

In February, the company began its phase II winter drill program at its Davidson River Project.  The project will consist of ~4500m of diamond drilling in 9 holes. Jon Bey, President, CEO and Chairman commented: “It is great to see the drills turning again on our Davidson River Project and to have the Aggressive Drilling team working with us once again. Their experience with our Phase I drilling program, and in this region, will go a long way to help us in making a high-grade uranium discovery. Our technical team have prepared an exciting drill program and I look forward to getting to the project site to view core with them.”

STTDF has risen 26% over the past 3 months.

Watch the Video
Replay
  of Standard Uranium CEO Jon Bey presentation at NobleCon17 (January 2021).


Ur-Energy Inc. (URG)

Ur-Energy is a junior mining company operating an in-situ uranium facility in Wyoming.  Their Lost Creek processing facility is designed to have a two million pound-per-year capacity.  They have produced, packaged, and shipped more than 2.6 million pounds from Lost Creek since the commencement of operations. Ur-Energy engages in a wide range of uranium mining and recovery operations, with activities including acquisition, exploration, development, and operation of uranium mineral properties.

Ur-Energy recently announced the closing of a $15.24MM public equity offering.  They anticipate using the proceeds from the offering to maintain and enhance operational readiness, for possible strategic transactions and/or acquisitions, and for operating capital.

In a recent press release covering 2020 year-end results, Ur-Energy CEO, Jeff Klenda said: “We look forward to 2021 as a year with numerous prospective catalysts for the domestic uranium recovery industry – catalysts from which our proven operational results at Lost Creek position us to benefit. We are pleased that, already, the Biden Administration has committed to integrate nuclear energy into its clean energy mandate, which is coupled with its pledge, expressed just this week, to ‘expand and strengthen domestic mining and processing capacity of the U.S. These priorities, and the growing bipartisan support for nuclear energy, will facilitate the formation of the national uranium reserve approved in December 2020, as well as implementation of other recommendations of the U.S. Nuclear Fuel Working Group.”

URG is up 77% over the past 3 months.

Take-Away

There is no way to overstate the importance of energy in society or the economy at large. It’s a necessity that can only grow. The current trend away from carbon-emitting fossil-fuels and toward fuel sources viewed to have a less negative impact on the planet is changing the wealth of companies involved in sourcing fuel and products related to alternatives.  Investors are looking beyond wind and solar to also consider uranium producers and the potential for nuclear-generated electricity demand to experience increased growth.

Content Team, Channelchek


Suggested Reading:


Lithium-Ion Battery Recycling Market Heats Up Is the Price of Uranium Rising?


What to Look for in Mining Stocks? What is an ESG Score?


Watch Channelchek’s C-Suite
Interview
with Capstone Turbine’s Darren Jamison


Capstone Turbine (CPST) CEO Darren Jamison

Micro-turbines: an economically competitive green energy source with flexible application

  • Customer base; largest current clients, pandemic impacts on growth, and the post-covid strategy
  • The future of hydrogen and its use as a blending fuel
  • Recent Texas blackouts and the impact of natural disasters
  • Service business growth, reoccurring revenues, and their current cash position


Sources:


https://www.world-nuclear.org/information-library/nuclear-fuel-cycle/mining-of-uranium/in-situ-leach-mining-of-uranium.aspx

https://www.world-nuclear.org/information-library/safety-and-security/safety-of-plants/safety-of-nuclear-power-reactors.aspx

https://finance.yahoo.com/news/ur-energy-releases-2020-end-230500192.html

https://finance.yahoo.com/news/ur-energy-inc-announces-closing-173700737.html

https://www.bloomberg.com/news/articles/2021-03-03/rare-earth-uranium-miners-benefit-from-ev-mania-and-dash-of-esg

https://www.energyfuels.com/

https://www.energyfuels.com/2021-03-09-Energy-Fuels-Receives-First-Shipments-of-Natural-Monazite-Ore-Commercial-Recovery-of-Rare-Earths-Expected-to-Begin-in-U-S-in-Coming-Weeks

https://encoreenergycorp.com/

https://www.globenewswire.com/news-release/2021/01/05/2153363/0/en/enCore-Energy-Corp-Completes-Acquisition-of-Westwater-Resources-Texas-Based-Uranium-Production-Resource-Assets.html

https://www.standarduranium.ca/

https://www.standarduranium.ca/news-releases/standard-uranium-begins-phase-ii-winter-drill-program-at-its-flagship-davidson-river-project/

Release – Gevo (GEVO) – Reports Fourth Quarter 2020 Financial Results


Gevo Reports Fourth Quarter 2020 Financial Results


Gevo to Host Conference Call Today at 4:30 p.m. EDT/2:30 p.m. MDT

ENGLEWOOD,
Colo. – March 17, 2021
– Gevo, Inc. (NASDAQ: GEVO) today announced financial results for the fourth quarter of 2020 and recent corporate highlights.

Recent Corporate Highlights

  • In January 2021, Gevo announced the plans for its Net-Zero 1 Project (“Net-Zero 1”) to be located in Lake Preston, South Dakota.  Net-Zero 1 is expected to produce about 45 MGPY of energy dense liquid hydrocarbons that, when burned as transportation fuels, should have a net-zero greenhouse gas footprint across the whole of the life cycle based on Argonne National Laboratories’ GREET model.  Net-Zero 1 is being designed to eliminate the fossil based energy footprint to run the production facility.  Importantly, Net-Zero 1 is expected to produce ~400 million pounds per year of protein rich animal feed, and about 30 million pounds per year of corn oil.  The 45 MGPY of hydrocarbons would be sold into the gasoline and jet fuel markets under existing take-or-pay contracts.  Net-Zero 1 is expected to produce its own biogas.  The biogas would be used to heat the production facility and provide approximately 30% of the electricity needed to power the production facility.   In addition, wind power is being developed and is expected to supply the other 70% of electricity needed to run the production facility.  Green hydrogen will also be produced from the renewable electricity as part of the productions processes at Net-Zero 1.  Net-Zero 1 is also expected to have its own water treatment plant to further improve the environmental footprint.
  • In February 2021, Gevo signed an amendment to its Fuel Sales Agreement with Scandinavian Airlines System (“SAS”) for sustainable aviation fuel.  The volume in the amendment is 5 million gallons per year, and is a “take-or-pay” contract worth ~$100 of revenue across the life of the contract.  This volume for the SAS contract is expected to be supplied by Gevo’s second Net-Zero Project beginning in 2024.
  • As of February 26, 2021, Gevo had approximately $530.6 million in cash and no significant debt.
  • Gevo believes it has the cash on the balance sheet needed to fund the project equity required for Net-Zero 1.  A tax-exempt private activity bond debt structure has been developed and vetted by Citigroup which Gevo currently expects to utilize.  In order to close the financing for Net-Zero 1, the engineering design and costs first need to be delivered in suitable form for project style financing, and the EPC firm needs to be selected prior to the bond offering.  The financial close for Net-Zero 1 is targeted for the first half of 2022.
  • In January 2021, Gevo announced that it had selected Koch Process Solutions to provide the Front End Engineering and Design services (FEED) for Net-Zero 1.  FEED is expected to be completed in December of 2021.  The completion of the FEED work is necessary before the financing of Net-Zero 1 can be completed with Citigroup Global Markets, Inc.
  • In January 2021, Gevo completed a registered direct offering of 43.7 million shares of common stock (or common stock equivalents) at $8.0 per share. Total proceeds were $321.7 million, net of closing costs.
  • In January 2021, Gevo raised $135.8 million, net of fees, by issuing 24.4 million shares of common stock through its At-the-Market (“ATM”) offering program.
  • In December 2020, the holders of Gevo’s 12.0% Convertible Senior Secured Notes due 2020/2021 (the “2020/21 Notes”) converted $12.7 million in aggregate outstanding principal amount of 2020/21 Notes (including the applicable make-whole payment) into an aggregate of 5,672,654 shares of common stock.  As a result, as of December 31, 2020, all obligations under the 2020/2021 Notes had been fully paid and satisfied.
  • In December 2020, Gevo entered into an option agreement for the right to purchase approximately 240 acres of land near Lake Preston, SD.  Gevo expects to construct its Net-Zero 1 Project on this land. 

2020 Fourth Quarter Financial Highlights

  • Ended the quarter with cash and cash equivalents of $78.3 million. 
  • Revenue totaled $0.5 million for the quarter compared to $6.9 million in Q4 2019.
  • Hydrocarbon revenue totaled $0.4 million for the quarter compared to $1.0 million in Q4 2019.
  • Loss from operations of ($7.0) million for the quarter compared to ($6.2) million in Q4 2019.
  • Non-GAAP cash EBITDA loss[1] of ($5.1) million for the quarter compared to ($4.0) million in Q4 2019.
  • Net loss per share of ($0.15) based on 120,017,120 weighted average shares outstanding for the quarter compared to ($0.50) based on 13,659,944 weighted average shares outstanding for the quarter in Q4 2019.
  • Non-GAAP adjusted net loss per share[2] of ($0.07) based on 120,017,120 weighted average shares outstanding for the quarter compared to ($0.50) based on 13,659,944 weighted average shares outstanding for the quarter in Q4 2019.

Commenting on the fourth quarter of 2020 and recent corporate events, Dr. Patrick R. Gruber, Gevo’s Chief Executive Officer, said “Net-Zero 1 is a first of a kind, off-the-grid type of plant where we are putting great effort into making Net-Zero 1 the most sustainable plant it can be.  I’m glad we have the customers secured, Citigroup to help us with the debt financing, and that the economics of Net-Zero 1 are attractive at this stage.  I’m also pleased that we are making progress on filling up production capacity at Net-Zero 2 as evidenced by the recent SAS contract.  We are making great progress, fast.”

Fourth Quarter 2020 Financial Results

Revenue for the three months ended December 31, 2020 was $0.5 million compared with $6.9 million in the same period in 2019.

Revenue
derived at our production facility located in Luverne, Minnesota (
the “Luverne Facility”) related to ethanol sales and related products was nil compared to $5.9 million for the fourth quarter of 2020. As a result of COVID-19 and in response to an unfavorable commodity environment, Gevo terminated its production of ethanol and distiller grains at the Luverne Facility in March 2020.  The Luverne Facility is currently shut down until further notice. Currently, the South Hampton Facility is not producing renewable premium gasoline or jet fuel. Gevo expects to produce isobutanol in intermittent campaigns during 2021 to supply the demonstration plant at the South Hampton Resources, Inc. facility in Silsbee, Texas (the “South Hampton Facility”) so that renewable premium gasoline or jet fuel can be produced in 2021.

During the three months ended December 31, 2020, hydrocarbon revenue was $0.4 million compared with $1.0 million in the same period in 2019 as a result of decreased shipments of finished products from our demonstration plant at the South Hampton Facility. Gevo’s hydrocarbon revenue is comprised of sales of alcohol-to-jet fuel, isooctane and isooctene.

Cost of goods sold was $2.0 million for the three months ended December 31, 2020, compared with $9.4 million in the same period in 2019, primarily as a result of terminating ethanol production at the Luverne Facility as discussed above. Cost of goods sold included approximately $0.9 million associated with the production of isobutanol and related products and maintenance of the Luverne Facility and approximately $1.1 million in depreciation expense for the three months ended December 31, 2020.

Gross loss was $1.4 million for the three months ended December 31, 2020, versus a $2.5 million gross loss in the same period in 2019.

Research and development expense increased by $1.7 million during the three months ended December 31, 2020 compared with the same period in 2019, due primarily to an increase in consultant and personnel expenses.

Selling, general and administrative expense increased by $0.2 million during the three months ended December 31, 2020, compared with the same period in 2019, due primarily to an increase in consulting and personnel costs offset by a decrease in investor relations and marketing costs.

Loss from operations in the three months ended December 31, 2020 was $(7.0) million, compared with a ($6.2) million loss from operations in the same period in 2019.

Non-GAAP cash EBITDA loss[3] in the three months ended December 31, 2020 was ($5.1) million, compared with a ($4.0) million non-GAAP cash EBITDA loss in the same period in 2019.

Interest expense in the three months ended December 31, 2020 was $0.5 million, a decrease of $0.1 million as compared to the same period in 2019, primarily due to a decline in amortization of original issue discounts and debt issuance costs compared to the same period last year and the conversion of $2.0 million of 2020/21 Notes in July 2020.

In the three months ended December 31, 2020, Gevo recognized net non-cash loss totaling $1.4 million due to the conversion of $12.7 million of 2020/21 Notes during December 2020.

During the three months ended December 31, 2020, Gevo recognized net non-cash loss totaling $8.6
million due to changes in the fair value of our 2020/21 Notes embedded derivative liability resulting from the increase in the price of our common stock prior to the conversion of the $12.7 million of 2020/21 Notes.

Gevo incurred a net loss for the three months ended December 31, 2020 of ($18.1) million, compared with a net loss of ($6.8) million during the same period in 2019. Non-GAAP adjusted net loss[4] for the three months ended December 31, 2020 was ($8.1) million, compared with a non-GAAP adjusted net loss of ($6.8) million during the same period in 2019.

Cash at December 31, 2020 was $78.3 million, and the total principal face value of 2020/21 Notes was $0.

Webcast
and Conference Call Information

Hosting today’s conference call at 4:30 p.m. EDT (2:30 p.m. MDT) will be Dr. Patrick R. Gruber, Chief Executive Officer, L. Lynn Smull, Chief Financial Officer, Carolyn M. Romero, Chief Accounting Officer, and Geoffrey T. Williams, Jr., Vice President – General Counsel & Secretary. They will review Gevo’s financial results and provide an update on recent corporate highlights.

To participate in the conference call, please dial (833) 729-4776 (inside the U.S.) or (830) 213-7701 and reference the access code 3178466#, or through the event weblink: https://edge.media-server.com/mmc/p/xhvdnuqd.

A replay of the call and webcast will be available two hours after the conference call ends on March 17, 2021. To access the replay, please visit https://edge.media-server.com/mmc/p/xhvdnuqd. The archived webcast will be available in the Investor Relations section of Gevo’s website at www.gevo.com.


About Gevo

Gevo’s mission is to transform renewable energy and carbon into energy-dense liquid hydrocarbons. These liquid hydrocarbons can be used for drop-in transportation fuels such as gasoline, jet fuel, and diesel fuel, that when burned have potential to yield net-zero greenhouse gas emissions when measured across the full lifecycle of the products. Gevo uses low-carbon renewable resource-based carbohydrates as raw materials, and is in an advanced state of developing renewable electricity and renewable natural gas for use in production processes, resulting in low-carbon fuels with substantially reduced carbon intensity (the level of greenhouse gas emissions compared to standard petroleum fossil-based fuels across their lifecycle). Gevo’s products perform as well or better than traditional fossil-based fuels in infrastructure and engines, but with substantially reduced greenhouse gas emissions. In addition to addressing the problems of fuels, Gevo’s technology also enables certain plastics, such as polyester, to be made with more sustainable ingredients. Gevo’s ability to penetrate the growing low-carbon fuels market depends on the price of oil and the value of abating carbon emissions that would otherwise increase greenhouse gas emissions. Gevo believes that its proven, patented, technology enabling the use of a variety of low-carbon sustainable feedstocks to produce price-competitive low carbon products such as gasoline components, jet fuel, and diesel fuel yields the potential to generate project and corporate returns that justify the build-out of a multi-billion-dollar business.

Gevo believes that Argonne National Laboratory GREET model is the best available standard of scientific based measurement for life cycle inventory or LCI.

Learn more at Gevo’s website: www.gevo.com

Forward-Looking Statements

Certain statements in this press release may constitute “forward-looking statements” within the meaning of the Private Securities Litigation Reform Act of 1995. These forward-looking statements relate to a variety of matters, including, without limitation, Gevo’s business development activities, Gevo’s Net-Zero Projects, Gevo’s offtake agreements, Gevo’s plans to develop its business, Gevo’s ability to successfully construct and finance its operations and growth projects, Gevo’s ability to achieve cash flow from its planned projects, the ability of Gevo’s products to contribute to lower greenhouse gas emissions, particulate and sulfur pollution and other statements that are not purely statements of historical fact. These forward-looking statements are made based on the current beliefs, expectations and assumptions of the management of Gevo and are subject to significant risks and uncertainty. Investors are cautioned not to place undue reliance on any such forward-looking statements. All such forward-looking statements speak only as of the date they are made, and Gevo undertakes no obligation to update or revise these statements, whether as a result of new information, future events or otherwise. Although Gevo believes that the expectations reflected in these forward-looking statements are reasonable, these statements involve many risks and uncertainties that may cause actual results to differ materially from what may be expressed or implied in these forward-looking statements. For a further discussion of risks and uncertainties that could cause actual results to differ from those expressed in these forward-looking statements, as well as risks relating to the business of Gevo in general, see the risk disclosures in the Annual Report on Form 10-K of Gevo for the year ended December 31, 2020 and in subsequent reports on Forms 10-Q and 8-K and other filings made with the U.S. Securities and Exchange Commission by Gevo.

Non-GAAP Financial Information

This press release contains financial measures that do not comply with U.S. generally accepted accounting principles (GAAP), including non-GAAP cash EBITDA loss, non-GAAP adjusted net loss and non-GAAP adjusted net loss per share. Non-GAAP cash EBITDA excludes depreciation and non-cash stock-based compensation. Non-GAAP adjusted net loss and adjusted net loss per share excludes non-cash gains and/or losses recognized in the quarter due to the changes in the fair value of certain of Gevo’s financial instruments, such as warrants, convertible debt and embedded derivatives. Management believes these measures are useful to supplement its GAAP financial statements with this non-GAAP information because management uses such information internally for its operating, budgeting and financial planning purposes. These non-GAAP financial measures also facilitate management’s internal comparisons to Gevo’s historical performance as well as comparisons to the operating results of other companies. In addition, Gevo believes these non-GAAP financial measures are useful to investors because they allow for greater transparency into the indicators used by management as a basis for its financial and operational decision making. Non-GAAP information is not prepared under a comprehensive set of accounting rules and therefore, should only be read in conjunction with financial information reported under U.S. GAAP when understanding Gevo’s operating performance. A reconciliation between GAAP and non-GAAP financial information is provided in the financial statement tables below.


[1] Cash EBITDA loss is a non-GAAP
measure calculated by adding back depreciation and non-cash stock compensation
to GAAP loss from operations. A reconciliation of cash EBITDA loss to GAAP loss
from operations is provided in the financial statement tables following this
release.

[2] Adjusted net loss per share is a
non-GAAP measure calculated by adding back non-cash gains and/or losses
recognized in the quarter due to the changes in the fair value of certain of
our financial instruments, such as warrants, convertible debt and embedded
derivatives, to GAAP net loss per share. A reconciliation of adjusted net loss
per share to GAAP net loss per share is provided in the financial statement
tables following this release.

[3] Cash EBITDA loss is a non-GAAP
measure calculated by adding back depreciation and non-cash stock compensation
to GAAP loss from operations. A reconciliation of cash EBITDA loss to GAAP loss
from operations is provided in the financial statement tables following this
release.

[4] Adjusted net loss is a non-GAAP
measure calculated by adding back non-cash gains and/or losses recognized in
the quarter due to the changes in the fair value of certain of our financial
instruments, such as warrants, convertible debt and embedded derivatives, to
GAAP net loss. A reconciliation of adjusted net loss to GAAP net loss is
provided in the financial statement tables following this release.


Gevo,
Inc.


Investor and Media Contact

+1 720-647-9605

[email protected]