Bunker Hill Announces Robust Restart PEA: $101m Npv, 46% Irr, 2.5 Year Payback, $42m Initial Capex, $20m Average Annual Fcf Over 10 Years
HIGHLIGHTS:
- Attractive returns: $101 million NPV, 46% IRR, and 2.5 year payback at $1.15/lb Zn, $0.90/lb Pb, $20.00/oz Ag
- Low-cost, rapid restart based on $42 million initial capital expenditures over a 15-month period
- Robust annual average free cash flow of $20 million and EBITDA of $30 million over a 10-year mine life
- Competitive cost position with all-in sustaining costs of $0.65 per payable pound of zinc, net of by-products
- Low environmental footprint with minimal surface disturbance and long-term water management solution
- Significant positive economic impact for the Shoshone County, Idaho community
- Life of mine zinc equivalent production of 912 million pounds at a zinc equivalent grade of 9.3%, including over 550 million pounds of zinc, 290 million pounds of lead, and 7 million ounces of silver
- Key upsides include ongoing exploration focused on high-grade silver and resource expansion
- Executive Chairman Richard Williams, CEO Sam Ash, and CFO David Wiens to host live interactive 6ix virtual investor event on Wednesday, April 21 st at 11:00AM ET / 8:00AM PT to discuss the PEA results and next steps. Investors are invited to register for this event at: LINK
|
TORONTO, April 20, 2021 (GLOBE NEWSWIRE) — Bunker Hill Mining Corp. (CSE: BNKR) (“Bunker Hill” or the “Company) is pleased to report the results of its Preliminary Economic Assessment (“PEA”) for the Bunker Hill Mine in Idaho’s Silver Valley, USA.
The PEA contemplates a $42 million initial capital cost (including 20% contingency) to rapidly restart the mine, generating approximately $20 million of annual average free cash flow over a 10-year mine life, and producing over 550 million pounds of zinc, 290 million pounds of lead, and 7 million ounces of silver at all-in sustaining costs (“AISC”) of $0.65 per payable pound of zinc (net of by-products).
Sam Ash, CEO of Bunker Hill, stated: “Our PEA confirms that by maximizing the use of existing resources, partnerships and infrastructure, the Bunker Hill Mine has the potential to be re-started rapidly as a low-cost, long life, sustainable operation. Pleasingly for our investors, the robust financial returns in the PEA, including a $101 million NPV, 46% IRR, and 2.5 year payback, do not include the significant upside to come from the on-going high-grade silver exploration which we expect to further increase cash flow margins. Based an annual average free cash flow of $20 million at metal prices below spot levels, we can self-fund these exploration efforts while continuing to grow the company. We look forward to progressing further technical studies and project finance discussions over the coming months.”
The early and robust cash-flow generated by this restart plan is designed to deliver optimal returns to all stakeholders, creating 150-200 new mining and administrative jobs within the local community, ensuring long-term environmental-management partnerships with the U.S. EPA and IDEQ, and driving the long-term development of the mine’s resources for many years to come.
The PEA was prepared in accordance with National Instrument 43-101 – Standards of Disclosure for Mineral Projects (“NI 43-101”). MineTech USA, LLC (“MineTech”) developed the mine infrastructure, capital expenditures and operating expenditures related portions of the PEA as well as portions of the mine plan and operating schedules in coordination with Resource Development Associates Inc. (“RDA”) and Pro Solv Consulting, LLC. The Company plans to file the completed PEA technical report on SEDAR within 45 days of this press release and make it available on the Company’s website. All “t” references in this press release are to short tons and “$” references are in U.S. dollars.
Table 1 summarizes the key findings of the PEA.
Table 1: PEA Summary
| |
YEARS
1 – 5 |
|
YEARS
6 – 10 |
|
LIFE OF
MINE |
|
| |
|
|
|
| Metal prices |
|
|
|
| Zinc ($/lb) |
1.15 |
|
1.15 |
|
1.15 |
|
| Lead ($/lb) |
0.90 |
|
0.90 |
|
0.90 |
|
| Silver ($/oz) |
20.00 |
|
20.00 |
|
20.00 |
|
| |
|
|
|
| Mine plan |
|
|
|
| Total mineralized material mined (kt) |
2,708 |
|
2,651 |
|
5,460 |
|
| Average annual mineralized material mined (kt) |
542 |
|
530 |
|
536 |
|
| Average zinc grade (%) |
6.5 |
% |
4.5 |
% |
5.5 |
% |
| Average lead grade (%) |
2.2 |
% |
3.7 |
% |
2.9 |
% |
| Average silver grade (oz/t) |
1.0 |
|
2.1 |
|
1.5 |
|
| Average zinc equivalent grade (%) (1) |
9.3 |
% |
9.4 |
% |
9.3 |
% |
| |
|
|
|
| Total Production over LOM (2) |
|
|
|
| Zinc produced (klbs) |
326,273 |
|
218,138 |
|
555,977 |
|
| Lead produced (klbs) |
109,701 |
|
176,130 |
|
290,157 |
|
| Silver produced (koz) |
2,439 |
|
4,849 |
|
7,401 |
|
| Zinc equivalent produced (klbs) (1) |
454,538 |
|
440,315 |
|
911,773 |
|
| |
|
|
|
| Average Annual Production (2) |
|
|
|
| Zinc produced (klbs) |
65,255 |
|
43,628 |
|
54,441 |
|
| Lead produced (klbs) |
21,940 |
|
35,226 |
|
28,583 |
|
| Silver produced (koz) |
488 |
|
970 |
|
729 |
|
| Zinc equivalent produced (klbs) (1) |
90,908 |
|
88,063 |
|
89,485 |
|
| |
|
|
|
| Average Unit Costs over LOM |
|
|
|
| Opex – total ($/t) |
83 |
|
74 |
|
78 |
|
| Sustaining capex ($/t) |
12 |
|
16 |
|
14 |
|
| Cash costs ($/lb Zn payable) (3) |
0.67 |
|
0.10 |
|
0.49 |
|
| AISC: ($/lb Zn payable) (3) |
0.78 |
|
0.33 |
|
0.65 |
|
| |
|
|
|
| Total Cash Flow over LOM ($’000) |
|
|
|
| EBITDA (3) |
135,071 |
|
162,947 |
|
298,018 |
|
| Pre-tax free cash flow (3), ( 4 ) |
101,435 |
|
131,544 |
|
232,978 |
|
| Free cash flow (3), ( 4 ) |
86,107 |
|
110,391 |
|
196,498 |
|
| |
|
|
|
| Average Annual Cash Flow ($’000) |
|
|
|
| EBITDA (3) |
27,014 |
|
32,589 |
|
29,802 |
|
| Pre-tax free cash flow (3) |
20,287 |
|
26,309 |
|
23,298 |
|
| Free cash flow (3) |
17,221 |
|
22,078 |
|
19,650 |
|
| |
|
|
|
| Financial Returns |
|
|
|
| After-tax NPV (5%) |
100,737 |
|
|
|
| After-tax NPV (8%) |
78,355 |
|
|
|
| After-tax IRR (%) |
46.2 |
% |
|
|
| Payback (years) |
2.5 |
|
|
|
| (1) |
|
Zinc equivalency calculated using metal prices shown above and based on recovery rates of 91% for Pb and 89% for Ag and 92% for Zn. |
| (2) |
|
Includes zinc produced in zinc concentrate, lead and silver produced in lead concentrate. |
| (3) |
|
Cash costs and AISC per payable pound of zinc sold, earnings before interest, taxes, depreciation and amortization (“EBITDA”), pre-tax free cash flow and free cash flow are non-GAAP financial measures. Please see “Cautionary Note Regarding Non-GAAP Measures”. |
| (4) |
|
Life of mine (“LOM”) includes initial capital expenditures. |
The PEA is preliminary in nature and includes Inferred mineral resources that are considered too speculative geologically to have the economic considerations applied to them that would enable them to be categorized as mineral reserves. There is no certainty that the project described in the PEA will be realized. Mineral resources that are not mineral reserves do not have demonstrated economic viability.
Sustainability Impacts
The mine’s development and operations will generate between 150-200 new jobs in Shoshone County that will pay twice the county’s median household income, on average. This has the potential to reduce unemployment in the county by more than ten percent. Procurement by the mine is projected to inject an additional $15 million into the local economy annually.
The mine will achieve carbon neutrality in year one of operations while depositing all waste and tailings underground to maintain a minimal environmental footprint. The production of low porosity paste from tailings will be an integral part of long-term water management. By sealing sulfide and pyrite-rich mineralization with paste, production of acid rock drainage will be reduced substantially and permanently. This will reduce the challenge and cost of water management from year one onward.
Mineral Resource Inventory
The Bunker Hill Mine is located in the historic Coeur d’Alene Mining District in Kellogg, Idaho at the base of Silver Mountain. It was operated from 1885 until 1981 when it was closed due to low metal prices, an extended labor strike, and capital short-falls required to meet new environmental standards. Although attempts were made to modernize and operate the mine until 1991, the mill and smelter facilities were removed and reclaimed along with the tailings impoundment. The underground workings, surface portal and shaft access points remain intact along with the mine office and maintenance complex. Given the historic reserves and existing infrastructure, Bunker Hill management has assessed the mine’s rapid restart potential, which is the subject of today’s published PEA.
The PEA is based on the Bunker Hill Mineral Resource, which was published on March 22, 2021, following the drilling program conducted in 2020 and early 2021 to validate the historical reserves. The PEA includes a mining inventory of 5.5Mt, which represents a portion of the 4.4Mt Indicated mineral resource and 5.6Mt Inferred mineral resource. Given the 10-year mine life, the mine plan has been based on prioritizing higher grade material. The mine production schedule is based on a 5.0% zinc operating cut-off grade and the 3.3% zinc cut-off grade which includes Indicated and Inferred mineral resources.
Table 2: Mineral Resources
| Zinc Resources |
K Tons |
Pb% |
Ag opt |
Zn% |
| Indicated |
4,410 |
2.00 |
0.69 |
5.52 |
| Inferred |
4,569 |
1.67 |
0.83 |
5.66 |
| |
|
|
|
|
| Lead-Silver Resources |
K Tons |
Pb% |
Ag opt |
Zn% |
| Indicated |
– |
– |
– |
– |
| Inferred |
1,050 |
7.56 |
4.28 |
1.50 |
| |
|
|
|
|
| Total Resources |
K Tons |
Pb% |
Ag opt |
Zn% |
| Indicated |
4,410 |
2.00 |
0.69 |
5.52 |
| Inferred |
5,618 |
2.77 |
1.48 |
4.88 |
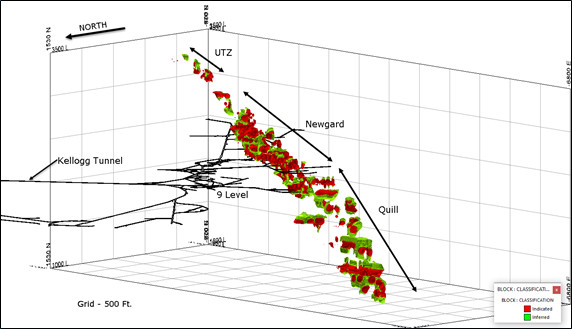
Notes: Mineral resources are reported at a zinc cutoff grade of 3.3%. Mineral resources are not mineral reserves and do not have demonstrated economic viability. There is no certainty that all or any part of the mineral resource will be converted into mineral reserves. Mineral resources are reported in situ and undiluted. Mineral resources meet the reasonable prospects of eventual economic extraction due to the fact that the entire vertical extents of the mineralization have been developed on mining levels every two-hundred feet. Newgard and Quill were being actively exploited and developed prior to the shutdown of mining operations in 1991. High grade capping was applied to the assays prior to grade estimation. Grades are estimated using Inverse Distance Cubed (ID3) interpolation techniques. Grades were estimated into a regularized 5 ft x 5 ft x 5 ft block model. A bulk density of 11.3 cubic feet per ton was applied to the entire mineral resource based upon historic density values from production records at the Bunker Hill Mine. Two-hundred sixty-one (261) drillholes, totaling 29,380-feet, containing 5,720 Pb, Zn and Ag assays were used in the determination of mineralization. Drill hole data was collected on 5-foot composite intervals which resulted in 4,483 composite assays. Additionally, 4,545 actual production car samples and 394 recent channel sample verification samples were used for the resource estimate. Historic mining voids, stopes and development drifting have been accounted for in the mineral resource estimate. For additional information regarding the mineral resources estimate, please refer to the Company’s news release dated March 22, 2021.
Infrastructure Overview and Initial Capital Costs
The vast underground workings, surface portals, mine office, maintenance complex, and 9-level shaft access points for the Bunker Hill Mine remain intact. The Kellogg Tunnel (“KT”) portal adjacent to the surface infrastructure connects horizontally by rail to the underground hoisting facilities on 9-level, approximately 9,500 feet to the south. Water seepage above the 9-level drains naturally out of the KT, and laterals below the 9-level must be dewatered prior to production commencement. All water is collected at the portal and sent for treatment. The underground workings are extensive, and only the infrastructure germane to the opening of the mine is being described in the PEA. Several shafts and raises connect to the 9-level and its underground infrastructure is central to the mine and home to the #1 and #2 hoistrooms, material bins, substations and shops. Shafts at the mine are inclined rail; the #1 being the production shaft and #2 materials and personnel.
The mine is currently accessed by the KT and 5-level portals located just above the Town of Wardner.
The utilization of this pre-existing infrastructure allows for a restart of the mine with an initial capital investment of approximately $42 million, net of pre-commercial production revenue, as detailed in the Table below. Each of the initial capital items listed (excluding pre-production revenue) include a 20% contingency.
Table 3: Initial Capital
| (in $‘000) |
Initial Capital |
|
| Process plant |
25,440 |
|
| Shaft and tunnel rehabilitation |
7,380 |
|
| Development |
6,446 |
|
| Other |
4,931 |
|
| Pre-production revenue (net) |
(2,162 |
) |
| Total |
42,034 |
|
Mill capacity and power consumption are based on 1,500 tons per day at 90% availability, a Bond Work Index of 14.5 kW-hrs/t and a 150-mesh grind, which is supported by the preliminary metallurgical work. Capital costs include equipment and installation labor. Metallurgical work is ongoing at Resource Development, Inc. (“RDI”) and the Company is evaluating multiple sourcing alternatives for processing and equipment.
Other life of mine capital improvements include the following, as set forth in the PEA:
- Connect the 5-level and 9-level with an access ramp
- Remove and replace Shaft#1 hoist and hoist works
- Recondition Shaft #2 hoist and hoist works
- Recondition Shafts #1 and #2; replace the existing rail with a modular track system and associated conveyances
- Install new mine wide power distribution
- Install fiber optic and Sentinel communications from the surface to the main underground facilities
- Install a backfill paste plant on the 5-level; allows efficient access to cement, fly ash and reagents
- Install a primarily gravity backfill distribution system to active and historical mining areas
- Recondition the KT and remove existing rail to convert to rubber tire access
- Introduce rubber tire development to the stopes as required
- Vertical development for muck passes, escapeways and ventilation
- Excavations for milling, flotation and backfilling equipment
- Fan and air control installations
- Tailings water treatment plant
Mining
The Newgard/Quill resource was designed and scheduled utilizing a traditional overhead cut and fill mining method. The cut and fill stopes are accessed via an incline ramp developed between levels. The ramp provides ventilation, utilities, and secondary escapeway, as well as connecting the entire mine with rubber tire access. Long-hole open stoping (“LHOS”) is also employed similar to the previous mining extraction methods. The LHOS areas are accessed through existing excavations rehabilitated to modern mining standards. Backfill requirements are provided via an underground paste plant and distribution system.
Production commences six months following the start of construction, targeting 200 tons/day (“tpd”) ramping up to 1,500 tpd over a 14-month period. The slow ramp up allows for infrastructure components to be completed and commissioned and to ensure the mine is adequately developed to maintain consistent production. Initially, production will be targeted above the 9-level as the hoists and first 200-foot section of shaft rehabilitation are completed. The mine plan is developed to allow sequential water draw down and shaft rehabilitation between levels as new production horizons are required. This sequencing is continued to the 26-level.
As the mine matures and progresses deeper, the resource transitions from primarily zinc to primarily lead mineralization in Year 9. In Year 8, the mine plan also transitions away from cut and fill production to LHOS for the remainder of the mine life.
Exploration potential is significant throughout the mine. Due to the substantial existing workings, Bunker Hill has the opportunity to delineate specific mineralized zones (zinc or lead) that maximizes cash flow potential depending on commodity pricing.
The mining schedule is presented in the Table below.
Table 4: Mine Schedule
| Year |
Pre-
Prod
|
Year 1 |
Year 2 |
Year 3 |
Year 4 |
Year 5 |
Year 6 |
Year 7 |
Year 8 |
Year 9 |
Year 10 |
|
LOM
Total |
| |
|
|
|
|
|
|
|
|
|
|
|
|
|
| Mineralized material mined (kt) |
101 |
|
485 |
|
559 |
|
556 |
|
556 |
|
553 |
|
555 |
|
548 |
|
548 |
|
548 |
|
453 |
|
|
5,460 |
|
| |
|
|
|
|
|
|
|
|
|
|
|
|
|
| Zinc grade (%) |
6.2 |
% |
7.0 |
% |
6.2 |
% |
6.9 |
% |
6.3 |
% |
6.4 |
% |
5.8 |
% |
4.6 |
% |
4.2 |
% |
3.5 |
% |
4.3 |
% |
|
5.5 |
% |
| Lead grade (%) |
2.4 |
% |
2.7 |
% |
2.3 |
% |
2.0 |
% |
2.1 |
% |
2.2 |
% |
2.3 |
% |
1.8 |
% |
3.8 |
% |
4.2 |
% |
6.7 |
% |
|
2.9 |
% |
| Silver grade (oz/t) |
1.3 |
|
0.9 |
|
0.7 |
|
1.1 |
|
1.3 |
|
1.2 |
|
1.1 |
|
1.1 |
|
2.2 |
|
2.8 |
|
3.2 |
|
|
1.5 |
|
| |
|
|
|
|
|
|
|
|
|
|
|
|
|
| Zinc eq grade (%) (1) |
9.3 |
% |
9.9 |
% |
8.7 |
% |
9.5 |
% |
9.3 |
% |
9.2 |
% |
8.6 |
% |
7.1 |
% |
9.4 |
% |
9.6 |
% |
12.8 |
% |
|
9.3 |
% |
| (1) |
|
Zinc equivalency calculated using metal prices shown above and based on recovery rates of 91% for Pb and 89% for Ag and 92% for Zn. |
| (2) |
|
Mineral resources are not mineral reserves and do not have demonstrated economic viability. |
Processing
The PEA envisages a crushing and milling plant to be centrally located on the 9-level. Milled material will then be pumped in slurry to the flotation and paste plant on the 5-level. The flotation plant will generate concentrates which will be transported to surface for shipment. The paste plant will generate paste for geotechnical fill and tailings disposal in open drifts and stopes in the mine. This approach optimizes material transport costs while eliminating the need for surface tailings disposal.
The local utility substation is located next to the mine main offices and supplies power to the mine and other local consumers. The existing power feeds to the mine are scheduled to be replaced prior to full production and the substation will require upgrades by Year 3 to allow for the additional dewatering loads as the mine advances to depth.
A traditional mill grinding circuit followed by zinc and lead flotation circuits is envisioned in the PEA. Payable silver follows the lead and reports to the lead concentrate.
Metallurgical test work with the recent drilling samples is being conducted at RDI. Preliminary results indicate that a conventional polymetallic process flowsheet will be able to produce the marketable grade concentrates. Historical metallurgical results have been used for concentrate recoveries and grade. The results were averaged for the last five years of operation. The lead concentrate, assaying an average 67% Pb and 34 oz/t Ag, is estimated to recover 91% Pb and 89% Ag. The zinc concentrate, assaying 58% Zn, will recover 92% Zn.
The production schedule is presented in the Table below.
Table 5: Production Schedule
| Year |
Pre-
Prod |
Year 1 |
Year 2 |
Year 3 |
Year 4 |
Year 5 |
Year 6 |
Year 7 |
Year 8 |
Year 9 |
Year 10 |
|
LOM
Total |
| |
|
|
|
|
|
|
|
|
|
|
|
|
|
| Zinc concentrate (t) |
9,971 |
53,677 |
55,214 |
60,510 |
55,891 |
55,978 |
50,683 |
39,850 |
36,297 |
30,167 |
31,054 |
|
479,290 |
| Lead concentrate (t) |
3,229 |
17,578 |
17,119 |
15,049 |
15,725 |
16,395 |
17,079 |
13,519 |
28,332 |
31,133 |
41,377 |
|
216,535 |
| |
|
|
|
|
|
|
|
|
|
|
|
|
|
| Zinc produced (Zn concentrate) (klbs) |
11,566 |
62,265 |
64,048 |
70,191 |
64,833 |
64,935 |
58,792 |
46,226 |
42,104 |
34,993 |
36,022 |
|
555,977 |
| Lead produced (Pb concentrate) (klbs) |
4,327 |
23,554 |
22,940 |
20,165 |
21,071 |
21,970 |
22,886 |
18,115 |
37,965 |
41,719 |
55,445 |
|
290,157 |
| Silver produced (Pb concentrate) (koz) |
113 |
379 |
334 |
522 |
636 |
568 |
526 |
549 |
1,080 |
1,384 |
1,311 |
|
7,401 |
| |
|
|
|
|
|
|
|
|
|
|
|
|
|
| Zinc equivalent production (klbs) (1) |
16,921 |
87,290 |
87,808 |
95,049 |
92,378 |
92,013 |
85,843 |
69,946 |
90,595 |
91,710 |
102,221 |
|
911,773 |
| (1) |
|
Zinc equivalency calculated using metal prices shown above and based on recovery rates of 91% for Pb and 89% for Ag and 92% for Zn. |
Operating Costs
Cash costs and AISC per payable pound of zinc sold are non-GAAP financial measures. Please see “Cautionary Note Regarding Non-GAAP Measures”.
Mine operating costs are based on experienced local contract labor and equipment for mining operations. A zero-based efficiency and cost estimate was completed based on current underground contractors’ rates and guidance benchmarked against other like operations. Electrical power costs are based on scheduled projected loads applying an estimated power factor correction and applicable Avista Utilities rates for all projected mine, milling and site operations. Mining costs are based on cut and fill techniques in the Newgard, Quill and UTZ mineral zones, and LHOS in the remaining deposits.
Mill operating costs are within guidance resulting from bench marking similar mill operations in north Idaho. Mine site general and administrative (G&A) costs are determined based on anticipated staffing levels and similar compensation compatible with area salaries.
Annual and LOM cost metrics are presented in the Table below.
Table 6: Operating Costs
| Year |
Year 1 |
Year 2 |
Year 3 |
Year 4 |
Year 5 |
Year 6 |
Year 7 |
Year 8 |
Year 9 |
Year 10 |
|
LOM
Total |
| |
|
|
|
|
|
|
|
|
|
|
|
|
| Mining ($/t) |
70 |
64 |
62 |
61 |
57 |
61 |
52 |
51 |
50 |
|
51 |
|
|
58 |
| Processing ($/t) |
15 |
15 |
15 |
15 |
15 |
15 |
15 |
15 |
15 |
|
15 |
|
|
15 |
| G&A ($/t) |
6 |
6 |
6 |
6 |
6 |
6 |
6 |
6 |
6 |
|
7 |
|
|
6 |
| Opex – total ($/t) |
91 |
84 |
83 |
82 |
78 |
81 |
72 |
72 |
71 |
|
73 |
|
|
78 |
| |
|
|
|
|
|
|
|
|
|
|
|
|
| Sustaining capex ($/t) |
14 |
8 |
10 |
9 |
18 |
19 |
15 |
17 |
19 |
|
9 |
|
|
14 |
| |
|
|
|
|
|
|
|
|
|
|
|
|
| Cash costs ($/lb Zn payable) |
0.68 |
0.75 |
0.67 |
0.64 |
0.61 |
0.69 |
0.73 |
0.14 |
(0.18 |
) |
(0.60 |
) |
|
0.49 |
| AISC ($/lb Zn payable) |
0.81 |
0.83 |
0.76 |
0.73 |
0.79 |
0.90 |
0.93 |
0.40 |
0.17 |
|
(0.47 |
) |
|
0.65 |
Cash Flow & Valuation
EBITDA, pre-tax cash flow and cash flow are non-GAAP financial measures. Please see “Cautionary Note Regarding Non-GAAP Measures”.
The project is expected to generate pre-tax free cash flow of $191 million over its 10-year mine life and $154 million on an after-tax basis. The Company expects to reinvest a portion of its pre-tax cash flows on its high-grade silver program, which may reduce the tax assumptions accounted for in the project economics. Annual free cash flow increases in later years of the mine plan due to higher silver grades at deeper elevations. The Company’s goal is to significantly increase the free cash flow in earlier years based on its ongoing high-grade silver exploration program.
The financial summary is presented in the Table below.
Table 7: Cash Flow & Valuation
| Year (1) (in $‘000) |
Initial
Capex |
Year 1 |
Year 2 |
Year 3 |
Year 4 |
Year 5 |
Year 6 |
Year 7 |
Year 8 |
Year 9 |
Year 10 |
|
LOM
Total |
| |
|
|
|
|
|
|
|
|
|
|
|
|
|
| Zinc revenue |
|
50,286 |
|
62,607 |
|
68,612 |
|
63,374 |
|
63,474 |
|
57,469 |
|
45,186 |
|
41,157 |
|
34,206 |
|
35,212 |
|
|
521,583 |
|
| Lead revenue |
|
17,065 |
|
19,614 |
|
17,241 |
|
18,016 |
|
18,784 |
|
19,567 |
|
15,489 |
|
32,460 |
|
35,669 |
|
47,406 |
|
|
241,311 |
|
| Silver revenue |
|
6,014 |
|
6,344 |
|
9,916 |
|
12,076 |
|
10,799 |
|
9,986 |
|
10,426 |
|
20,516 |
|
26,293 |
|
24,917 |
|
|
137,286 |
|
| Gross revenue |
|
73,365 |
|
88,564 |
|
95,769 |
|
93,467 |
|
93,057 |
|
87,022 |
|
71,100 |
|
94,133 |
|
96,168 |
|
107,534 |
|
|
900,181 |
|
| Smelter charges and freight |
|
(16,360 |
) |
(19,914 |
) |
(21,014 |
) |
(20,082 |
) |
(20,205 |
) |
(18,906 |
) |
(15,050 |
) |
(18,692 |
) |
(18,147 |
) |
(21,048 |
) |
|
(189,419 |
) |
| Net smelter return |
|
57,006 |
|
68,650 |
|
74,755 |
|
73,385 |
|
72,851 |
|
68,116 |
|
56,050 |
|
75,440 |
|
78,021 |
|
86,486 |
|
|
710,762 |
|
| Mining costs |
|
(28,048 |
) |
(35,546 |
) |
(34,674 |
) |
(34,057 |
) |
(31,709 |
) |
(33,979 |
) |
(28,424 |
) |
(28,011 |
) |
(27,457 |
) |
(22,981 |
) |
|
(304,887 |
) |
| Processing costs |
|
(5,831 |
) |
(8,132 |
) |
(8,100 |
) |
(8,095 |
) |
(8,052 |
) |
(8,089 |
) |
(7,985 |
) |
(7,985 |
) |
(7,985 |
) |
(6,757 |
) |
|
(77,011 |
) |
| G&A costs |
|
(2,369 |
) |
(3,172 |
) |
(3,171 |
) |
(3,171 |
) |
(3,169 |
) |
(3,171 |
) |
(3,167 |
) |
(3,167 |
) |
(3,167 |
) |
(3,121 |
) |
|
(30,845 |
) |
| EBITDA |
|
20,757 |
|
21,800 |
|
28,810 |
|
28,063 |
|
29,922 |
|
22,877 |
|
16,474 |
|
36,277 |
|
39,411 |
|
53,627 |
|
|
298,018 |
|
| Sustaining capex |
|
(5,690 |
) |
(4,480 |
) |
(5,736 |
) |
(5,185 |
) |
(9,888 |
) |
(10,631 |
) |
(7,978 |
) |
(9,501 |
) |
(10,252 |
) |
(4,161 |
) |
|
(73,503 |
) |
| Initial capex |
(42,034 |
) |
|
|
|
|
|
|
|
|
|
|
|
(42,034 |
) |
| Land & salvage value |
|
|
|
|
|
|
|
|
|
|
8,463 |
|
|
8,463 |
|
| Pre-tax free cash flow |
(42,034 |
) |
15,067 |
|
17,321 |
|
23,074 |
|
22,878 |
|
20,034 |
|
12,246 |
|
8,495 |
|
26,775 |
|
29,159 |
|
57,929 |
|
|
190,944 |
|
| Taxes |
(319 |
) |
(1,351 |
) |
(2,366 |
) |
(4,129 |
) |
(3,818 |
) |
(3,344 |
) |
(1,283 |
) |
(312 |
) |
(5,896 |
) |
(6,074 |
) |
(7,909 |
) |
|
(36,800 |
) |
| Free cash flow |
(42,354 |
) |
13,716 |
|
14,954 |
|
18,945 |
|
19,060 |
|
16,690 |
|
10,964 |
|
8,184 |
|
20,879 |
|
23,085 |
|
50,021 |
|
|
154,144 |
|
| |
|
|
|
|
|
|
|
|
|
|
|
|
|
Annual metrics –
post initial capex (2) |
|
|
|
|
|
|
|
|
|
|
|
|
|
| Gross revenue |
|
98,675 |
|
87,973 |
|
91,042 |
|
96,740 |
|
91,548 |
|
83,042 |
|
76,858 |
|
94,642 |
|
99,010 |
|
80,651 |
|
|
900,181 |
|
| EBITDA |
|
28,548 |
|
21,397 |
|
26,116 |
|
30,849 |
|
28,161 |
|
21,276 |
|
21,424 |
|
37,060 |
|
42,965 |
|
40,220 |
|
|
298,018 |
|
| Pre-tax free cash flow |
|
22,649 |
|
16,017 |
|
21,324 |
|
23,357 |
|
18,087 |
|
11,308 |
|
13,065 |
|
27,371 |
|
36,352 |
|
43,447 |
|
|
232,978 |
|
| Free cash flow |
|
20,707 |
|
13,210 |
|
17,273 |
|
19,658 |
|
15,258 |
|
10,269 |
|
11,358 |
|
21,431 |
|
29,819 |
|
37,516 |
|
|
196,498 |
|
| |
|
|
|
|
|
|
|
|
|
|
|
|
|
| NPV (5%) |
100,737 |
|
|
|
|
|
|
|
|
|
|
|
|
|
| NPV (8%) |
78,355 |
|
|
|
|
|
|
|
|
|
|
|
|
|
| |
|
|
|
|
|
|
|
|
|
|
|
|
|
| IRR (%) |
46.2 |
% |
|
|
|
|
|
|
|
|
|
|
|
|
| Payback (years) |
2.5 |
|
|
|
|
|
|
|
|
|
|
|
|
|
| (1) |
|
Initial capex period is expressed on a 15 month basis; “Year 1” is expressed on a 9 month basis; all other years expressed on a 12 month basis. |
| (2) |
|
All metrics expressed on a 12 month basis, beginning after the 15 month initial capex period. |
Note: all figures expressed in USD 000’s unless otherwise stated
Sensitivities
The tables below summarize the after-tax sensitivities of NPV and IRR, with respect to metal prices and costs.
Table 8: Sensitivities
| |
Metal Prices |
Operating & Capital Costs
|
| |
|
|
|
|
|
|
|
|
|
|
|
|
|
|
|
NPV (5%)
($M)
|
|
|
Zinc Price ($/lb)
|
|
|
Operating Costs (+/- %) |
| |
|
0.95 |
1.05 |
1.15 |
1.25 |
1.35 |
|
|
|
-20% |
-10% |
0% |
10% |
20% |
|
Lead
Price
($/lb)
|
0.70 |
10 |
43 |
71 |
98 |
125 |
|
Total Capital Costs
(+/- %) |
-20% |
183 |
151 |
120 |
89 |
58 |
|
| 0.80 |
29 |
58 |
86 |
113 |
141 |
|
-10% |
173 |
142 |
110 |
79 |
48 |
|
| 0.90 |
45 |
73 |
101 |
128 |
156 |
|
0 |
163 |
132 |
101 |
69 |
38 |
|
| 1.00 |
61 |
88 |
116 |
144 |
172 |
|
10%
|
154 |
122 |
91 |
60 |
28 |
|
| 1.10 |
76 |
104 |
131 |
155 |
187 |
|
20%
|
144 |
113 |
81 |
50 |
19 |
|
| |
|
|
|
|
|
|
|
|
|
|
|
|
|
|
| |
|
|
|
|
|
|
|
|
|
|
|
|
|
|
IRR (%)
|
|
|
Zinc Price ($/lb) |
|
|
Operating Costs (+/- %) |
| |
|
0.95 |
1.05 |
1.15 |
1.25 |
1.35 |
|
|
|
-20% |
-10% |
0% |
10% |
20% |
|
Lead
Price
($/lb)
|
0.70 |
9% |
22% |
35% |
48% |
62% |
|
Total Capital Costs
(+/- %) |
-20% |
94% |
79% |
63% |
47% |
32% |
|
| 0.80 |
15% |
28% |
41% |
54% |
68% |
|
-10% |
82% |
68% |
54% |
40% |
25% |
|
| 0.90 |
21% |
33% |
46 % |
60% |
73% |
|
0 |
72% |
59% |
46 % |
33% |
20% |
|
| 1.00 |
27% |
39% |
52% |
65% |
79% |
|
10% |
64% |
52% |
40% |
28% |
16% |
|
| 1.10 |
32% |
44% |
57% |
71% |
85% |
|
20% |
56% |
45% |
34% |
23% |
12% |
|
UPCOMING EVENTS
HC Wainwright Mining Conference
Bunker Hill presentation: April 20, 2021 at 1:30PM ET / 10:30AM PT
Join Us: REGISTER NOW
121 Mining Investment Americas
April 27-29, 2021
https://www.weare121.com/121mininginvestment-new-york/
QUALIFIED PERSON
MineTech developed the mine infrastructure, capital expenditures and operating expenditures related portions of the PEA, as well as portions of the mine plan and operating schedules in coordination with RDA and Pro Solv Consulting, LLC. Robert Todd, P.E. is a Principal of MineTech, a registered engineer in Idaho, consultant to the Company and an independent “qualified person” as defined by NI 43-101.
Mr. Scott E. Wilson, CPG, President of RDA and a consultant to the Company, is an independent “qualified person” as defined by NI 43-101 and is acting as the qualified person for the Company. He has reviewed and approved the technical information summarized in this news release.
The qualified persons have verified the information disclosed herein, including the sampling, preparation, security and analytical procedures underlying such information, and are not aware of any significant risks and uncertainties that could be expected to affect the reliability or confidence in the information discussed herein.
ABOUT BUNKER HILL MINING CORP.
Under new Idaho-based leadership, Bunker Hill Mining Corp. intends to sustainably restart and develop the Bunker Hill Mine as the first step in consolidating a portfolio of North American precious-metal assets with a focus on silver. Information about the Company is available on its website, www.bunkerhillmining.com , or under the Company’s profile on SEDAR at www.sedar.com and on EDGAR at www.sec.gov .
For additional information contact: [email protected]
CAUTIONARY STATEMENTS
Certain statements in this news release are forward-looking and involve a number of risks and uncertainties. Such forward-looking statements are within the meaning of that term in Section 27A of the Securities Act of 1933, as amended, and Section 21E of the Securities Exchange Act of 1934, as amended, as well as within the meaning of the phrase ‘forward-looking information’ in the Canadian Securities Administrators’ National Instrument 51-102 – Continuous Disclosure Obligations. Forward-looking statements are not comprised of historical facts. Forward-looking statements include estimates and statements that describe the Company’s future plans, objectives or goals, including words to the effect that the Company or management expects a stated condition or result to occur. Forward-looking statements may be identified by terminology such as “may”, “will”, “could”, “should”, “expect”, “plan”, “anticipate”, “believe”, “intend”, “estimate”, “projects”, “predict”, “potential”, “continue” or other similar expressions concerning matters that are not historical facts.
Since forward-looking statements are based on assumptions and address future events and conditions, by their very nature they involve inherent risks and uncertainties. Although these statements are based on information currently available to the Company, the Company provides no assurance that actual results will meet management’s expectations. Risks, uncertainties and other factors involved with forward-looking information could cause actual events, results, performance, prospects and opportunities to differ materially from those expressed or implied by such forward-looking information. The key risks and uncertainties include, but are not limited to: local and global political and economic conditions; governmental and regulatory requirements and actions by governmental authorities, including changes in government policy, government ownership requirements, changes in environmental, tax and other laws or regulations and the interpretation thereof; developments with respect to the coronavirus disease 2019 (“COVID-19”) pandemic, including the duration, severity and scope of the pandemic and potential impacts on mining operations; and other risk factors detailed from time to time in the Company’s reports filed on SEDAR and EDGAR.
Forward-looking information and statements in this news release include statements concerning, among other things: the potential of the Bunker Hill Mine to be re-started rapidly as a low-cost, long life, sustainable operation based on the results of the PEA; the PEA representing robust financial returns; the potential of the restart plan to create jobs, ensure long-term environmental-management partnerships, and drive the long-term development of the Bunker Hill Mine’s resources; the timing for filing the PEA technical report; the timing, amount and duration of future production; future cash costs and AISC; commodity prices; the estimated capital and operating costs; the Company’s ability to discover new mineralization; the Company’s ability to self-fund high-grade silver exploration efforts to further increase cash flow margins; the timing for the Company’s progression of further technical studies and project finance discussions; potential sustainability impacts based on the results of the PEA, including the Bunker Hill Mine’s development and operations generating new jobs in Shoshone County, with such job creation having the potential to reduce unemployment in the county, procurement by the Bunker Hill Mine injecting additional funds into the local economy annually, and the Bunker Hill Mine achieving carbon neutrality in year one of operations and maintaining a minimal environmental footprint for the LOM; the potential for a reduction in the production of acid rock drainage; the potential for a reduction in the challenge and cost of water management; LOM capital improvements; metal recoveries; the Company’s plans to reinvest a portion of its pre-tax cash flows on its high-grade silver program; the Company’s goal to significantly increase free cash flow in the earlier years of the PEA based on its ongoing high-grade silver exploration program; the estimates of free cash flow, net present value and economic returns from the Bunker Hill Mine based on the results of the PEA; opportunities to increase the economics of the Bunker Hill Mine; our plans and expectations for the Bunker Hill Mine; and the Company’s intentions regarding its objectives, goals or future plans and statements. Factors that could cause actual results to differ materially from such forward-looking information include, but are not limited to: the ability to predict and counteract the effects of COVID-19 on the business of the Company, including but not limited to the effects of COVID-19 on the price of commodities, capital market conditions, restriction on labor and international travel and supply chains; failure to identify mineral resources; failure to convert estimated mineral resources to reserves; the inability to complete a feasibility study which recommends a production decision; the preliminary nature of metallurgical test results; delays in obtaining or failures to obtain required governmental, environmental or other project approvals; political risks; changes in equity markets; uncertainties relating to the availability and costs of financing needed in the future; the inability of the Company to budget and manage its liquidity in light of the failure to obtain additional financing, including the ability of the Company to complete the payments pursuant to the terms of the agreement to acquire the Bunker Hill Mine Complex; inflation; changes in exchange rates; fluctuations in commodity prices; delays in the development of projects; capital, operating and reclamation costs varying significantly from estimates and the other risks involved in the mineral exploration and development industry; and those risks set out in the Company’s public documents filed on SEDAR and EDGAR. Although the Company believes that the assumptions and factors used in preparing the forward-looking information in this news release are reasonable, undue reliance should not be placed on such information, which only applies as of the date of this news release, and no assurance can be given that such events will occur in the disclosed time frames or at all. The Company disclaims any intention or obligation to update or revise any forward-looking information, whether as a result of new information, future events or otherwise, other than as required by law. No stock exchange, securities commission or other regulatory authority has approved or disapproved the information contained herein.
Cautionary Note to United States Investors
This press release has been prepared in accordance with the requirements of the securities laws in effect in Canada, which differ from the requirements of U.S. securities laws. Unless otherwise indicated, all resource and reserve estimates included in this press release have been disclosed in accordance with NI 43-101 and the Canadian Institute of Mining, Metallurgy, and Petroleum Definition Standards on Mineral Resources and Mineral Reserves. NI 43-101 is a rule developed by the Canadian Securities Administrators which establishes standards for all public disclosure an issuer makes of scientific and technical information concerning mineral projects. Canadian disclosure standards, including NI 43-101, differ significantly from the requirements of the United States Securities and Exchange Commission (“SEC”), and resource and reserve information contained in this press release may not be comparable to similar information disclosed by U.S. companies. In particular, and without limiting the generality of the foregoing, the term “resource” does not equate to the term “reserves”. Under U.S. standards, mineralization may not be classified as a “reserve” unless the determination has been made that the mineralization could be economically and legally produced or extracted at the time the reserve determination is made. The SEC’s disclosure standards normally do not permit the inclusion of information concerning “measured mineral resources”, “indicated mineral resources” or “inferred mineral resources” or other descriptions of the amount of mineralization in mineral deposits that do not constitute “reserves” by U.S. standards in documents filed with the SEC. Investors are cautioned not to assume that any part or all of mineral deposits in these categories will ever be converted into reserves. U.S. investors should also understand that “inferred mineral resources” have a great amount of uncertainty as to their existence and great uncertainty as to their economic and legal feasibility. It cannot be assumed that all or any part of an “inferred mineral resource” will ever be upgraded to a higher category. Investors are cautioned not to assume that all or any part of an “inferred mineral resource” exists or is economically or legally mineable. Disclosure of “contained ounces” in a resource is permitted disclosure under Canadian regulations; however, the SEC normally only permits issuers to report mineralization that does not constitute “reserves” by SEC standards as in-place tonnage and grade without reference to unit measures. The requirements of NI 43-101 for disclosure of “reserves” are also not the same as those of the SEC, and reserves disclosed by the Company in accordance with NI 43-101 may not qualify as “reserves” under SEC standards. Accordingly, information concerning mineral deposits may not be comparable with information made public by companies that report in accordance with U.S. standards.
Cautionary Note Regarding Non-GAAP Measures
This news release includes certain terms or performance measures commonly used in the mining industry that are not defined under International Financial Reporting Standards (“IFRS”) or U.S. GAAP, including cash costs and AISC per payable pound of zinc sold,EBITDA, pre-tax cash flow and free cash flow. Non-GAAP measures do not have any standardized meaning prescribed under IFRS or U.S. GAAP and, therefore, they may not be comparable to similar measures employed by other companies. The Company believes that, in addition to conventional measures prepared in accordance with IFRS and U.S. GAAP, certain investors use this information to evaluate its performance. The data presented is intended to provide additional information and should not be considered in isolation or as a substitute for measures of performance prepared in accordance with IFRS or U.S. GAAP.