Ceapro Inc. Announces Completion of Patient Enrollment in Clinical Study Evaluating Beta Glucan as a Cholesterol-Lowering Agent


Ceapro Inc. Announces Completion of Patient Enrollment in Clinical Study Evaluating Beta Glucan as a Cholesterol-Lowering Agent


– Clinical study evaluating the well-known health claims of beta glucan and its potentially beneficial approach for patients to lower plasma cholesterol –

– Study conducted in collaboration with the Montreal Heart Institute and led by MHI’s Montreal Health Innovations Coordinating Center (MHICC) –

– Topline data readout expected Q4 2021 –

EDMONTON, Alberta, May 26, 2021 (GLOBE NEWSWIRE) —  Ceapro Inc. (TSX-V: CZO) (“Ceapro” or the “Company”), a growth-stage biotechnology company focused on the development and commercialization of active ingredients for healthcare and cosmetic industries, today announced the completion of patient enrollment in its comparison study evaluating high-medium molecular weight beta glucan as a stand-alone or add-on therapy to statins (the “BetAvena study”) in subjects with hyperlipidemia.

The study is being conducted with the Montreal Heart Institute (MHI), led by Dr. Jean-Claude Tardif, Director of the Montreal Heart Institute Research Center and Principal Investigator for this clinical trial as part of a long-term collaboration.

“We are incredibly pleased with the flawless execution of this important clinical study, despite challenges posed by the COVID-19 pandemic. We are extremely grateful to Dr. Jean-Claude Tardif and his expert team at the Montreal Heart Institute and their dedication to getting this study across the finish line and providing the opportunity to assess and validate the well-known health benefits of beta glucan per the highest clinical practice standards. The amended protocol that we were granted for the study expanded our target addressable patient population, which provided both scientific and clinical value and aided in successfully completing patient enrollment. This is a major milestone for our Company as we expand as a biopharmaceutical company and we look forward to reporting topline data in the fourth quarter of this year,” stated Gilles Gagnon, M.Sc., MBA, President and CEO.

“With patient enrollment now complete, our team is focused on advancing this potential alternative treatment forward and bring the study to successful completion. Pending statistical review, the BetAvena study may represent a significant shift for the patient community hoping to achieve hyperlipidemia control with nutraceuticals such as Ceapro’s CP105F. We are impressed by the engagement of our clinical sites and our patients who had to compose with very difficult COVID circumstances,” added Dr. Tardif.

This multicenter, randomized, double-blind, parallel group, placebo-controlled study is conducted to determine the efficacy and safety of high-medium molecular weight beta glucan in subjects with hyperlipidemia (LDL-C level >130 mg/d L (3.37 mmol/L). The 18 to 24-month study enrolled approximately 264 subjects who cannot tolerate high doses of current treatments. The Company received approval from Health Canada in February 2020 to expand the inclusion criteria of the study to allow evaluation of enrolled subjects with confirmed pathophysiological condition of hyperlipidemia who voluntarily request to be treated with beta glucan only, without regular dosing of statins. Enrolled patients were randomized to receive either placebo, low, medium or high doses of beta glucan (500 mg tablet) as add-on therapy, or not, to atorvastatin 10 mg – 20 mg or an equivalent statin for a 12-week treatment period. The primary efficacy endpoint of the study is the change over 12 weeks in LDL-cholesterol.

The Company anticipates the statistical analysis to be completed this fall and subsequently submitted to Heath Canada. The Company expects to report topline data from the study in the fourth quarter of 2021.

About Ceapro Inc.

Ceapro Inc. is a Canadian biotechnology company involved in the development of proprietary extraction technology and the application of this technology to the production of extracts and “active ingredients” from oats and other renewable plant resources. Ceapro adds further value to its extracts by supporting their use in cosmeceutical, nutraceutical, and therapeutics products for humans and animals. The Company has a broad range of expertise in natural product chemistry, microbiology, biochemistry, immunology and process engineering. These skills merge in the fields of active ingredients, biopharmaceuticals and drug-delivery solutions. For more information on Ceapro, please visit the Company’s website at www.ceapro.com.

For more information contact:

Jenene Thomas
JTC Team, LLC
Investor Relations and Corporate Communications Advisor
T (US): +1 (833) 475-8247
E: [email protected]

Issuer:
Gilles R. Gagnon, M.Sc., MBA
President & CEO
T: 780-421-4555

Neither TSX Venture Exchange nor its Regulation Services Provider (as that term is defined in the policies of the TSX Venture Exchange) accepts responsibility for the adequacy or accuracy of this release


Source: Ceapro Inc.

Palladium One Drills Haukiaho Trend, Intercepts 72 Meters @ 1.8 g/t Palladium-Equivalent, Finland


Palladium One Drills Haukiaho Trend, Intercepts 72 Meters @ 1.8 g/t Palladium-Equivalent, Finland


May 26, 2021 – Toronto, Ontario – First drill results from the Company’s 2,000 meter drill program at Haukiaho, a zone approximately 20 kilometers south of the Company’s primary target area Kaukua South, have returned  significant widths and grades, including 72 meters at 1.8 g/t Palladium-equivalent “Pd_Eq”) (Hole LK21-071), on the Läntinen Koillismaa “LK”) PGE-Ni-Cu project in Finland, said Palladium One Mining Inc. “Palladium One” or the “Company”) (TSXV: PDM, FRA: 7N11, OTC: NKORF) today.

A total of 12 holes (1,943 metres) were drilled on the Haukiaho trend. This release contains the results from the first 7 holes of this program. The drilling was designed establish sufficient drill density to prepare a National Instrument 43-101 resource estimate at Haukiaho, which the Company anticipates completing in Q3 2021.

“Establishing a NI43-101 resource estimate at Haukiaho has been a priority for the Company given the robust historical data set available to the Company. Haukiaho was the original focus of the Phase I drill program in 2020, however, the discovery of Kaukua South led us towards first defining the potential of this new discovery and exploring the greater Kaukua area.  Despite this, Haukiaho was not forgotten and has remained an important part of our strategy to grow a multi-million ounce resource base. At 17 kilometers in length, the Haukiaho trend, currently represents the largest continuous patch of blue-sky potential on the LK property.” said Derrick Weyrauch, President and CEO.

Highlights

  • Drilling has returned significant widths and grades
  • Expanded higher grade areas within the known historic Haukiaho resource area
  • Expanded mineralization 100m to east of the historic resource
  • 72.2 meters grading 1.79 g/t Pd_Eq in hole LK21-071 starting 56m down hole, including 17.0 meters grading 2.23 g/t Pd_Eq
  • 15.7 meters grading 2.26 g/t Pd_Eq in hole LK21-069 including 3.6 meters grading 3.11 g/t Pd_Eq
  • 51.2 meters grading 1.07 g/t Pd_Eq in hole LK21-073 including 9.1 meters grading 2.10 g/t Pd_Eq
  • The historic Haukiaho resource is shallowly drilled, mostly above 200m in depth and therefore amendable to open pit mining

Haukiaho Historic Resource Estimate

In the 1980’s, Outokumpu  (a Finnish State-run mining company) prepared a resource estimate using very widely spaced holes along a portion of the Haukiaho trend, which estimated 7 million tonnes grading 0.38% Cu and 0.24% Ni, however importantly, no PGE assays were undertaken. The cut-off grade used was a 0.7% Copper_equivalent (defined as Cu% + 2 x Ni%).

Subsequently in 2013, Finore Mining Inc. completed a non-pit constrained NI43-101 historic resource estimate, over a much smaller strike length.  Using  a 0.1 g/t Pd cut-off, they estimated a resource of 1.13 million Pd_Eq ounces within 23.2 million tonnes grading 1.51 g/t Pd_Eq (0.31 g/t Pd, 0.12g/t Pt, 0.10 g/t Au, 0.21% Cu, and 0.14% Ni) (See news release August 12, 2019 and May 7, 2020).  This resource estimate encompassed widely spaced drilling with a focus on maximizing tonnage, not grade.

The Haukiaho trend is 17 kilometers long and the historic 2013 Haukiaho resource prepared by Finore covers less than 2 kilometers of this trend.  This knowledge coupled with the historic work by Outokumpu point to the enormous potential to significantly add resources at Haukiaho with disciplined execution of exploration activities.

While similar to the Kaukua deposit (See new release, September 30, 2019), the Haukiahio trend is more copper-nickel rich.  At Kaukua, approximately ~1/3 of the in-situ value per tonne is copper-nickel, while at Haukiaho copper-nickel represent approximately ~2/3s of the in-situ value.

Figure 1. LK Project location map showing 43-101 compliant Kaukua deposit and historic Haukiaho resource along with 2020 IP grids (blue lines) and current 2021 IP grid areas (black boxes). Yellow lines represent Exploration Permits, red lines represent Exploration Reservations held by the Company.

Figure 2. Plan map of Haukiaho 2020 IP chargeability anomalies and Palladium One drill holes locations.

Figure 3. Plan map of the Haukiaho historic 2013 Finore resource estimate represented by the > 0.5g/t Pd_Eq resource shape with Palladium One drill holes.

Figure 4. Haukiaho Cross section showing holes LK21-071, Finore hole HAU11-005, and geological survey of Finland (GTK) holes R-390 and R-389.

Table 1: Palladium One Haukiaho drill results

Hole

From
(m)

To
(m)

Width
(m)

Pd_Eq
g/t*

Pd
g/t

Pt
g/t

Au
g/t

Cu
%

Ni
%

LK20-008

17.3

33.5

16.2

1.99

0.38

0.15

0.14

0.26

0.20

Inc.

20.3

23.3

3.0

2.55

0.48

0.19

0.22

0.33

0.25

LK20-009

161.5

168.1

6.6

2.34

0.47

0.20

0.13

0.26

0.25

LK20-010

118.7

202.0

83.3

1.27

0.24

0.09

0.05

0.12

0.16

Inc.

166.8

201.0

34.3

2.09

0.47

0.20

0.10

0.20

0.22

Inc.

167.8

173.0

5.3

3.08

0.66

0.25

0.20

0.38

0.30

Inc.

20.3

23.3

3.0

2.55

0.48

0.19

0.22

0.33

0.25

LK21-067

No Significant values (collared in footwall rocks)

LK21-068

81.5

122.0

40.6

0.65

0.05

0.02

0.02

0.04

0.11

Inc.

106.2

120.0

13.9

0.80

0.12

0.05

0.02

0.06

0.12

Inc.

106.2

112.7

6.6

0.91

0.13

0.05

0.03

0.09

0.13

LK21-069

48.5

64.1

15.7

2.26

0.47

0.18

0.18

0.27

0.22

Inc.

48.5

60.0

11.6

2.53

0.52

0.19

0.18

0.30

0.25

Inc.

48.5

52.0

3.6

3.11

0.60

0.22

0.23

0.37

0.32

LK21-070

103.5

131.0

27.5

0.65

0.01

0.00

0.02

0.04

0.12

Inc.

113.0

119.0

6.0

0.83

0.02

0.00

0.04

0.09

0.14

LK21-071

55.8

128.0

72.2

1.79

0.37

0.15

0.14

0.22

0.17

Inc.

72.0

77.0

5.0

2.33

0.53

0.21

0.18

0.27

0.22

Inc.

74.0

75.5

1.5

3.20

0.75

0.29

0.23

0.39

0.29

And

86.2

94.0

7.8

2.74

0.53

0.21

0.23

0.32

0.27

And

111.0

128.0

17.0

2.23

0.53

0.21

0.18

0.28

0.18

Inc.

112.5

118.0

5.5

2.84

0.64

0.25

0.23

0.36

0.25

LK21-072

No Significant values (ended before zone)

LK21-073

75.8

127.0

51.2

1.07

0.15

0.06

0.06

0.13

0.13

Inc.

90.0

113.1

23.1

1.51

0.25

0.10

0.10

0.21

0.16

Inc.

90.8

99.9

9.1

2.10

0.37

0.15

0.16

0.27

0.21

Inc.

98.0

99.0

1.0

3.21

0.61

0.27

0.29

0.47

0.28

LK21-074

Pending

LK21-075

Pending

LK21-076

Pending

LK21-077

Pending

LK21-078

Pending

* Reported widths are “drilled widths” not true widths.
**Italicised orange highlighted results are previously released results see news release September 15, 2020

*Palladium Equivalent
Palladium equivalent is calculated using US$1,100 per ounce for palladium, US$950 per ounce for platinum, US$1,300 per ounce for gold, US$6,614 per tonne for copper, and US$15,4332 per tonne for nickel. This calculation is consistent with the calculation in the Company’s September 2019 NI 43-101 Kaukua resource estimate. Additionally, US$1,100 per ounce for palladium is consistent with the UBS January 2021 long-term consensus price forecast even though the current price of palladium is approximately US$2,800 per ounce.

QA/QC
The Phase I drilling program was carried out under the supervision of Neil Pettigrew, M.Sc., P. Geo., Vice President of Exploration and a director of the Company.

Drill core samples were split using a rock saw by Company staff, with half retained in the core box and stored indoors in a secure facility, in Taivalkoski, Finland. The drill core samples were transported by courier from the Company’s core handling facility in Taivalkoski, Finland, to ALS Global “ALS”) laboratory in Outokumpu, Finland. ALS, is an accredited lab and are ISO compliant (ISO 9001:2008, ISO/IEC 17025:2005). PGE analysis was performed using a 30 grams fire assay with an ICP-MS or ICP-AES finish. Multi-element analyses, including copper and nickel were analysed by four acid digestion using 0.25 grams with an ICP-AES finish.

Certified standards, blanks and crushed duplicates are placed in the sample stream at a rate of one QA/QC sample per 10 core samples. Results are analyzed for acceptance at the time of import. All standards associated with the results in this press release were determined to be acceptable within the defined limits of the standard used.

Qualified Person
The technical information in this release has been reviewed and verified by Neil Pettigrew, M.Sc., P. Geo., Vice President of Exploration and a director of the Company and the Qualified Person as defined by National Instrument 43-101.

About Palladium One
Palladium One Mining Inc. is an exploration company targeting district scale, platinum-group-element (PGE)-copper nickel deposits in Finland and Canada. Its flagship project is the Läntinen Koillismaa or LK Project, a palladium dominant platinum group element-copper-nickel project in north-central Finland, ranked by the Fraser Institute as one of the world’s top countries for mineral exploration and development. Exploration at LK is focused on targeting disseminated sulfides along 38 kilometers of favorable basal contact and building on an established NI 43-101 open pit resource.

ON BEHALF OF THE BOARD
“Derrick Weyrauch”
President & CEO, Director

For further information contact: Derrick Weyrauch, President & CEO
Email: [email protected]

Neither the TSX Venture Exchange nor its Market Regulator (as that term is defined in the policies of the TSX Venture Exchange) accepts responsibility for the adequacy or accuracy of this release.

This press release includes “forward-looking information” that is subject to a few assumptions, risks and uncertainties, many of which are beyond the control of the Company. Statements regarding listing of the Company’s common shares on the TSXV are subject to all of the risks and uncertainties normally incident to such events. Investors are cautioned that any such statements are not guarantees of future events and that actual events or developments may differ materially from those projected in the forward-looking statements. Such forward-looking statements represent management’s best judgment based on information currently available. Factors that could cause the actual results to differ materially from those in forward-looking statements include regulatory actions and general business conditions. Such forward-looking information reflects the Company’s views with respect to future events and is subject to risks, uncertainties and assumptions, including those set out in the Company’s annual information form dated April 29, 2020 and filed under the Company’s profile on SEDAR at www.sedar.com. The Company does not undertake to update forward?looking statements or forward?looking information, except as required by law. Investors are cautioned that any such statements are not guarantees of future performance and actual results or developments may differ materially from those projected in the forward-looking statements.

PLBY Group Announces Successful Completion of Debt Refinancing


PLBY Group Announces Successful Completion of Debt Refinancing


LOS ANGELES, May 25, 2021 (GLOBE NEWSWIRE) — PLBY Group, Inc. (NASDAQ: PLBY) (“PLBY Group” or the “Company”), a leading pleasure and leisure lifestyle company and owner of Playboy, one of the most recognizable and iconic brands in the world, today announced the successful completion of the refinancing of their existing credit facility through a $160 million senior secured term loan maturing in May 2027.

The new term loan will accrue interest at LIBOR plus 5.75%, with a single step-down to LIBOR plus 5.25% upon achieving gross leverage of 3.0x, subject to a LIBOR floor of 0.5%. The debt refinancing is expected to result in an estimated $3 million in annual interest expense savings, reduce amortization by over $3 million annually, and eliminate over $7 million in annual excess cash flow sweep payments. The refinancing also allows the Company to request to borrow at least $30 million of additional incremental term loans, and the Company may borrow unlimited additional amounts of pari passu debt as long as its senior secured leverage ratio is below 4.75x.

“We are pleased to further strengthen our financial flexibility by refinancing our existing facility with a new term loan that should reduce our annual debt service by over $13 million and which provides a defined path for additional borrowing to fund M&A,” said Lance Barton, Chief Financial Officer of PLBY Group. “Following the strength of our first quarter results, we are well-positioned to execute on both our organic and M&A growth initiatives and build upon our incredible global brand.”

About PLBY Group, Inc.
PLBY Group connects consumers around the world with products, services, and experiences to help them look good, feel good, and have fun. PLBY Group serves consumers in four major categories: Sexual Wellness, Style & Apparel, Gaming & Lifestyle, and Beauty & Grooming. PLBY Group’s flagship consumer brand, Playboy, is one of the most recognizable, iconic brands in the world, driving billions of dollars in consumer spending annually across 180 countries. Learn more at http://www.plbygroup.com.

Forward-Looking Statements
This press release includes “forward-looking statements” within the meaning of the “safe harbor” provisions of the United States Private Securities Litigation Reform Act of 1995. The Company’s actual results may differ from their expectations, estimates, and projections and, consequently, you should not rely on these forward-looking statements as predictions of future events. Words such as “expect,” “estimate,” “project,” “budget,” “forecast,” “anticipate,” “intend,” “plan,” “may,” “will,” “could,” “should,” “believes,” “predicts,” “potential,” “continue,” and similar expressions (or the negative versions of such words or expressions) are intended to identify such forward-looking statements. These forward-looking statements include, without limitation, the Company’s expectations with respect to future performance, growth plans and anticipated financial impacts of the Company’s recent business combination and its acquisitions.

These forward-looking statements involve significant risks and uncertainties that could cause the actual results to differ materially from those discussed in the forward-looking statements. Factors that may cause such differences include, but are not limited to: (1) the impact of COVID-19 pandemic on the Company’s business; (2) the inability to maintain the listing of the Company’s shares of common stock on Nasdaq; (3) the risk that the business combination, recent acquisitions or any proposed transactions disrupt the Company’s current plans and operations, including the risk that the Company does not complete any such proposed transactions or achieve the expected benefits from them; (4) the ability to recognize the anticipated benefits of the business combination, which may be affected by, among other things, competition, the ability of the Company to grow and manage growth profitably, and retain its key employees; (5) costs related to the business combination, acquisitions and proposed transactions; (6) changes in applicable laws or regulations; (7) the possibility that the Company may be adversely affected by other economic, business, and/or competitive factors; (8) risks relating to the uncertainty of the projected financial information of the Company; (9) risks related to the organic and inorganic growth of the Company’s business and the timing of expected business milestones; and (10) other risks and uncertainties indicated from time to time in the Company’s annual report on Form 10-K, including those under “Risk Factors” therein, and in the Company’s other filings with the Securities and Exchange Commission. The Company cautions that the foregoing list of factors is not exclusive, and readers should not place undue reliance upon any forward-looking statements, which speak only as of the date which they were made. The Company does not undertake any obligation to update or revise any forward-looking statements to reflect any change in its expectations or any change in events, conditions, or circumstances on which any such statement is based.

Contact:

Investors: [email protected]
Media: [email protected]

HCA Healthcare Partners with Google Cloud to Accelerate Digital Transformation


image credit: Panodex - BigQuery (Flickr)


Medical and Tech Giants to Apply AI to Records for Actionable Care Insights


Google (GOOG) and HCA Healthcare (HCA) just announced (May 26) a partnership to build on HCA Healthcare’s use of information technology to further their transformation to benefit from collected patient data. According to an HCA press release, “The partnership with Google Cloud is designed to help create a secure and dynamic data analytics platform for HCA Healthcare and enable the development of next generation operational models focused on actionable insights and improved workflows.”

Under the plan, HCA’s 2,000 locations in 21 states would consolidate and store digital health records along with information from internet-connected medical devices with Google Data. The multiyear agreement will require Google and HCA engineers to work to help improve operating efficiency, monitor patients and guide doctors’ decisions.


Patients Privacy and Providing Data

The company said, “While protecting patient privacy and the security of data, HCA Healthcare uses information from its 32 million annual encounters to identify opportunities to improve clinical care and support its 93,000 nurses and 47,000 active and affiliated physicians.” The data collected can be valuable for the hospital chain while at the same time serve to better inform global medical care.  HCA Healthcare has published studies in leading medical journals like the New England Journal of Medicine and The Lancet, developed algorithm-informed decision support tools for caregivers, and identified clinical practices that reduce infections and improve perinatal care. The partnership with Google Cloud is expected to enhance efforts by HCA to continue to improve and develop advanced decision support to promote quality, safety, and efficiency.


Data Science in Medicine

Data generated by hospitals places them in an enviable position as brokers of this information.  Patients under their care, being seen by doctors, labs, pharmacies, and monitored by medical devices, provide records of treatment, behavior, patterns, and results. This information, fed through algorithms developed by data-mining companies, can serve as a revenue source as it may be sold to pharmaceutical and technology companies. The data-mining companies involved include large companies like Google right down start-ups where the profits are more impactful on financials. The results, if done with strict control over privacy, can be win-win-win as patient care improves, hospitals benefit, and tech companies provide solutions.


Looking Toward the Future

“The cloud can be an accelerant for innovation in health, particularly in driving data interoperability, which is critical in streamlining operations and providing better quality of care to improve patient outcomes,” said Thomas Kurian, CEO, Google Cloud Sam Hazen, CEO of HCA healthcare stated, “Next-generation care demands data science-informed decision support so we can more sharply focus on safe, efficient and effective patient care.”  The cloud-based network is intended to allow clinicians to rely on it for on-the-fly decisions, as well as medical staff in more controlled settings.

HCA Healthcare has deployed 90,000 mobile devices that run tools created by the organization’s PatientKeeper and Mobile Heartbeat teams and other developers to empower caregivers. The partnership with Google Cloud is expected to empower physicians, nurses and others with workflow tools, analysis and alerts on their mobile devices to help clinicians respond quickly to changes in a patient’s condition.

This is an opportunity for both partnered companies to benefit while, with sufficient safety and security measures in place, positively impact care patients receive.


Suggested Reading:

What Cells Can be Made From Stem Cells

Cannabis Customers Served by “Ice Cream Truck” Model


Scientists Now Better Understand Viral Mutations

The Case for Investing in Regenerative Medicine


Sources:

https://investor.hcahealthcare.com/news/news-details/2021/HCA-Healthcare-Partners-With-Google-Cloud-to-Accelerate-Digital-Transformation/default.aspx

https://www.wsj.com/articles/google-strikes-deal-with-hospital-chain-to-develop-healthcare-algorithms-11622030401?mod=hp_lead_pos1


Stay up to date. Follow us:


Stay up to date. Follow us:

Euroseas Ltd. Reports Results for the Quarter Ended March 31, 2021


Euroseas Ltd. Reports Results for the Quarter Ended March 31, 2021


ATHENS, Greece, May 25, 2021 (GLOBE NEWSWIRE) — Euroseas Ltd. (NASDAQ: ESEA, the “Company” or “Euroseas”), an owner and operator of container carrier vessels and provider of seaborne transportation for containerized cargoes, announced today its results for the three-month period ended March 31, 2021.

First Quarter 2021 Financial Highlights:

  • Total net revenues of $14.3 million. Net income of $3.8 million; net income attributable to common shareholders (after a $0.1 million of dividend on Series B Preferred Shares and a $0.1 million of preferred deemed dividend arising out of the redemption of approximately $2 million of Series B Preferred Shares in the first quarter of 2021) of $3.6 million or $0.53 per share basic and diluted. Adjusted net income attributable to common shareholders1 for the period was $3.0 million or $0.45 per share basic and diluted.

  • Adjusted EBITDA1 was $5.6 million.

  • An average of 14.0 vessels were owned and operated during the first quarter of 2021 earning an average time charter equivalent rate of $12,134 per day. 

  • The Company declared a dividend of $0.1 million on its Series B Preferred Shares. The dividend will be paid in cash.

Additional announcement:

The Company has completed its first Environment, Social & Governance (“ESG”) report which will be available on its web site on May 26, 2021.

Aristides Pittas, Chairman and CEO of Euroseas commented: “Over the last three months, the containership markets have continued their upward path exceeding their previous peak of 2008 and coming within reach to challenge their all-time highs last observed in 2005. Recovering demand and inefficiencies in container transport logistics, like port congestion, crew replacement and COVID related protocols, have been combined with modest supply growth to support the present market levels. The higher rates, naturally, have had a very positive effect on our profitability which is to further increase as the remaining of our vessels will renew their legacy charters during the following 4-5 months. In addition to chartering our vessels at higher rates, the strong market has allowed us to pursue charters of longer periods, of two or more years, thus, establishing visibility of our earnings well into next year and even 2023.

“We believe that the favorable market fundamentals will continue over the remainder of this and the next year as world economies are projected to continue recovering from their pandemic induced slowdowns and to register strong growth rates while, in parallel, vessel deliveries are expected to be modest over the same period.

“Our strategy is focused on ensuring that Euroseas remains a significant participant in the feeder/intermediate containership segment, expanding in a risk measured and accretive manner and using our public listing as a potential platform to consolidate privately owned vessels or fleets. Furthermore, as our liquidity increases, we are evaluating possible uses of any accumulated funds in terms of further deleveraging our balance sheet, exploiting investment opportunities or rewarding our shareholders by re-instituting common stock dividends.

“Finally, we are pleased to have completed our first Environment, Social & Governance report. Our ESG responsibilities is an integral part of our strategy and our overall success and we look forward to regularly communicating our progress on this front to our shareholders and investors.”

Tasos Aslidis, Chief Financial Officer of Euroseas commented: “The results of the first quarter of 2021 reflect the increased charter rates our vessels earned due to the major recovery of the market compared to the same period of last year. Our net revenues decreased to $14.3 million in the first quarter of 2021 compared to $15.4 million during the same period of last year due to the lower number of vessels we operated in the first quarter of 2021. During the first quarter of 2021 we operated 14.0 vessels versus 19.0 vessels during the same period of last year.

“On a per-vessel-per-day basis, our vessels earned a 26.2% higher average charter rate in the first quarter of 2021 as compared to the same period of 2020. Again, on a per-vessel-per-day basis, the sum of vessel operating expenses, management fees and general and administrative expenses increased by 17.6% during the first quarter of 2021 as compared to the same period in 2020 which was attributable to increased supply of stores, increase in hull and machinery insurance premiums and the increased crewing costs for our vessels compared to the same period of 2020, resulting from difficulties in crew rotation due to COVID-19 related restrictions. We believe that we continue to maintain one of the lowest operating cost structures amongst the public shipping companies which is one of our competitive advantages.

“Adjusted EBITDA during the first quarter of 2021 was $5.6 million compared to $4.1 million achieved for the first quarter of 2020.”

“Finally, as of March 31, 2021, our outstanding debt (excluding the unamortized loan fees) is about $65.1 million versus restricted and unrestricted cash of about $6.4 million.”
        
First Quarter 2021 Results:
For the first quarter of 2021, the Company reported total net revenues of $14.3 million representing a 7.3% decrease over total net revenues of $15.4 million during the first quarter of 2020. On average, 14.0 vessels were owned and operated during the first quarter of 2021 earning an average time charter equivalent rate of $12,134 per day compared to 19.0 vessels in the same period of 2020 earning on average $9,615 per day. The Company reported a net income for the period of $3.8 million and a net income attributable to common shareholders of $3.6 million, as compared to a net income of $2.0 million and a net income attributable to common shareholders of $1.8 million for the first quarter of 2020.

Vessel operating expenses for the first quarter of 2021 amounted to $6.9 million as compared to $8.0 million for the same period of 2020. The decreased amount is due to the lower number of vessels owned and operated in the first quarter of 2021 compared to the corresponding period of 2020, partly offset by the increased crewing costs for our vessels compared to the same period of 2020, resulting from difficulties in crew rotation due to COVID-19 related restrictions, the increased supply of stores and the increase in hull and machinery insurance premiums. Depreciation expense for the first quarter of 2021 amounted to $1.6 million compared to $1.7 million for the same period of 2020 due to the decreased number of vessels in the Company’s fleet. Related party management fees for the first quarter of 2021 decreased to $1.1 million from $1.3 million for the same period of 2020 for the same reason. In the first quarter of 2021 and 2020, none of our vessels underwent drydocking and certain expenses were incurred in connection with upcoming drydockings; finally, during the first quarter of 2021, we had other operating income of $0.2 million relating to settlement of accounts with charterers of sold vessels.

Interest and other financing costs for the first quarter of 2021 amounted to $0.7 million compared to $1.3 million for the same period of 2020. This decrease is due to the decreased amount of debt and the decrease in weighted average LIBOR rate in the current period compared to the same period of 2020. For the three months ended March 31, 2021 the Company recognized a $0.48 million loss on its interest rate swap contract, comprising a $0.52 million unrealized loss and a $0.04 million realized gain.

Adjusted EBITDA1 for the first quarter of 2021 was $5.6 million, compared to $4.1 million achieved for the first quarter of 2020. Please see below for Adjusted EBITDA reconciliation to net income.

Basic and diluted earnings per share for the first quarter of 2021 was $0.53, calculated on 6,711,408 basic and 6,749,393 diluted weighted average number of shares outstanding compared to basic and diluted earnings per share of $0.32 for the first quarter of 2020, calculated on 5,576,960 basic and diluted weighted average number of shares outstanding.

Excluding the effect on the income attributable to common shareholders for the quarter of the unrealized gain on derivatives and the loss on sale of vessel, the adjusted earnings per share for the quarter ended March 31, 2021 would have been $0.45 per share basic and diluted, respectively, compared to adjusted earnings of $0.17 per share basic and diluted for the first quarter of 2020, after excluding amortization of below market time charters acquired. Usually, security analysts do not include the above items in their published estimates of earnings per share.

Fleet Profile:
The Euroseas Ltd. fleet profile is as follows:

Name Type Dwt TEU Year Built Employment(*) TCE Rate ($/day)

Container Carriers
           
AKINADA BRIDGE (*) Intermediate 71,366 5,610 2001 TC until Oct-21
TC until Oct-22
$17,250
$20,000
SYNERGY BUSAN (*) Intermediate 50,726 4,253 2009 TC until Aug-21
TC until Aug-24
$12,000
$25,000
SYNERGY ANTWERP (*) Intermediate 50,726 4,253 2008 TC until Sep-23 $18,000
SYNERGY OAKLAND (*) Intermediate 50,787 4,253 2009 TC until Jul-21 CONTEX(**) 4250 less 10%, i.e. $37,850 from 22/4/21 until 22/7/21
SYNERGY KEELUNG (+) Intermediate 50,969 4,253 2009 TC until Jun-22 plus 8- 12 months option $10,000 until Jun-21; $11,750 until Jun-22; option $14,500
EM KEA (*) Feeder 42,165 3,100 2007 TC until May-23 $22,000
EM ASTORIA (+) Feeder 35,600 2,788 2004 TC until Feb-22 $18,650
EVRIDIKI G (+) Feeder 34,677 2,556 2001 TC until Jan-22 $15,500
EM CORFU (+) Feeder 34,654 2,556 2001 TC until Sep-21 $10,200
DIAMANTIS P (+) Feeder 30,360 2,008 1998 TC until Aug-21 $6,500
EM SPETSES (+) Feeder 23,224 1,740 2007 TC until Jul-21 $8,100
EM HYDRA (*) Feeder 23,351 1,740 2005 TC until May-21
TC until April-23
$7,200
$20,000
JOANNA (*) Feeder 22,301 1,732 1999 TC until Oct-22 $16,800
AEGEAN EXPRESS (*) Feeder 18,581 1,439 1997 TC until Mar-22 $11,500
Total Container Carriers 14 539,487 42,281      

Note: (*) TC denotes time charter. Charter duration indicates the earliest redelivery date; All dates listed are the earliest redelivery dates under each TC unless the contract rate is lower than the current market rate in which cases the latest redelivery date is assumed; vessels with the latest redelivery date shown are marked by (+).

(**) The CONTEX (Container Ship Time Charter Assessment Index) has been published by the Hamburg and Bremen Shipbrokers’ Association (VHBS) since October 2007. The CONTEX is a company-independent index of time charter rates for containerships. It is based on assessments of the current day charter rates of six selected containership types, which are representative of their size categories: Type 1,100 TEU and Type 1,700 TEU with a charter period of one year, and the Types 2,500, 2,700, 3,500 and 4,250 TEU all with a charter period of two years.

Summary Fleet Data:

  Three Months, Ended March 31, 2020 Three Months, Ended March 31, 2021
FLEET DATA    
Average number of vessels (1) 19.00   14.00  
Calendar days for fleet (2) 1,729.0   1,260.0  
Scheduled off-hire days incl. laid-up (3)    
Available days for fleet (4) = (2) – (3) 1,729.0   1,260.0  
Commercial off-hire days (5) 18.2    
Operational off-hire days (6) 65.8   41.2  
Voyage days for fleet (7) = (4) – (5) – (6) 1,645.0   1,218.8  
Fleet utilization (8) = (7) / (4) 95.1 % 96.7 %
Fleet utilization, commercial (9) = ((4) – (5)) / (4) 98.9 % 100.0 %
Fleet utilization, operational (10) = ((4) – (6)) / (4) 96.2 % 96.7 %
     
AVERAGE DAILY RESULTS    
Time charter equivalent rate (11) 9,615   12,134  
Vessel operating expenses excl. drydocking expenses (12) 5,417   6,310  
General and administrative expenses (13) 464   604  
Total vessel operating expenses (14) 5,881   6,914  
Drydocking expenses (15) 13   65  

(1) Average number of vessels is the number of vessels that constituted the Company’s fleet for the relevant period, as measured by the sum of the number of calendar days each vessel was a part of the Company’s fleet during the period divided by the number of calendar days in that period.

(2) Calendar days. We define calendar days as the total number of days in a period during which each vessel in our fleet was in our possession including off-hire days associated with major repairs, drydockings or special or intermediate surveys or days of vessels in lay-up. Calendar days are an indicator of the size of our fleet over a period and affect both the amount of revenues and the amount of expenses that we record during that period.

(3) The scheduled off-hire days including vessels laid-up are days associated with scheduled repairs, drydockings or special or intermediate surveys or days of vessels in lay-up.

(4) Available days. We define available days as the Calendar days in a period net of scheduled off-hire days incl. laid up. We use available days to measure the number of days in a period during which vessels were available to generate revenues. 

(5) Commercial off-hire days. We define commercial off-hire days as days a vessel is idle without employment.

(6) Operational off-hire days. We define operational off-hire days as days associated with unscheduled repairs or other off-hire time related to the operation of the vessels.

(7) Voyage days. We define voyage days as the total number of days in a period during which each vessel in our fleet was in our possession net of commercial and operational off-hire days. We use voyage days to measure the number of days in a period during which vessels actually generate revenues or are sailing for repositioning purposes.

(8) Fleet utilization. We calculate fleet utilization by dividing the number of our voyage days during a period by the number of our available days during that period. We use fleet utilization to measure a company’s efficiency in finding suitable employment for its vessels and minimizing the amount of days that its vessels are off-hire for reasons such as unscheduled repairs or days waiting to find employment. 

(9) Fleet utilization, commercial. We calculate commercial fleet utilization by dividing our available days net of commercial off-hire days during a period by our available days during that period. 

(10) Fleet utilization, operational. We calculate operational fleet utilization by dividing our available days net of operational off-hire days during a period by our available days during that period. 

(11) Time charter equivalent rate, or TCE rate, is a measure of the average daily net revenue performance of our vessels. Our method of calculating TCE is determined by dividing time charter revenue and voyage charter revenue net of voyage expenses by voyage days for the relevant time period. Voyage expenses primarily consist of port, canal and fuel costs that are unique to a particular voyage, which would otherwise be paid by the charterer under a time charter contract, or are related to repositioning the vessel for the next charter. TCE is a standard shipping industry performance measure used primarily to compare period-to-period changes in a shipping company’s performance despite changes in the mix of charter types (i.e., spot voyage charters, time charters, pool agreements and bareboat charters) under which the vessels may be employed between the periods. Our definition of TCE may not be comparable to that used by other companies in the shipping industry.

(12) Daily vessel operating expenses, which include crew costs, provisions, deck and engine stores, lubricating oil, insurance, maintenance and repairs and management fees are calculated by dividing vessel operating expenses and management fees by fleet calendar days for the relevant time period. Drydocking expenses are reported separately. 

(13) Daily general and administrative expense is calculated by dividing general and administrative expense by fleet calendar days for the relevant time period. 

(14) Total vessel operating expenses, or TVOE, is a measure of our total expenses associated with operating our vessels. TVOE is the sum of vessel operating expenses, management fees and general and administrative expenses; drydocking expenses are not included. Daily TVOE is calculated by dividing TVOE by fleet calendar days for the relevant time period.

(15) Drydocking expenses include expenses during drydockings that would have been capitalized and amortized under the deferral method divided by the fleet calendar days for the relevant period. Drydocking expenses could vary substantially from period to period depending on how many vessels underwent drydocking during the period. The Company expenses drydocking expenses as incurred.

Conference Call and Webcast:
Tomorrow, Wednesday, May 26, 2021 at 10:00 a.m. Eastern Time, the Company’s management will host a conference call and webcast to discuss the results.

Conference Call details:
Participants should dial into the call 10 minutes before the scheduled time using the following numbers: 1 (877) 553-9962 (US Toll Free Dial In), 0(808) 238-0669 (UK Toll Free Dial In) or +44 (0) 2071 928592 (Standard International Dial In). Please quote “Euroseas” to the operator.

A telephonic replay of the conference call will be available until Tuesday, June 1, 2021, by dialing 1(866) 331-1332 (US Toll Free Dial In), 0(808) 238-0667 (UK Toll Free Dial In) or +44 (0) 3333 009785 (Standard International Dial In) and the access code required for the replay is: 6973591#.
 
Audio Webcast – Slides Presentation: 
There will be a live and then archived audio webcast of the conference call, via the internet through the Euroseas website (www.euroseas.gr). Participants to the live webcast should register on the website approximately 10 minutes prior to the start of the webcast.

The slide presentation on the first quarter ended March 31, 2021 will also be available in PDF format 10 minutes prior to the conference call and webcast, accessible on the company’s website (www.euroseas.gr) on the webcast page. Participants to the webcast can download the PDF presentation. 


Euroseas Ltd.
Unaudited Consolidated Condensed Statements of Operations
(All amounts expressed in U.S. Dollars except number of shares)

  Three Months Ended March 31, Three Months Ended March 31,
  2020 2021
     
Revenues    
Time charter revenue 16,131,322   14,916,567  
Commissions (698,515 ) (607,249 )
Net revenues 15,432,807   14,309,318  
       
Operating expenses / (income)    
Voyage expenses 314,554   127,409  
Vessel operating expenses 8,037,863   6,864,353  
Drydocking expenses 23,823   82,209  
Vessel depreciation 1,727,085   1,596,543  
Related party management fees 1,328,822   1,086,405  
Loss on sale of vessel   9,417  
General and administrative expenses

802,376
 

760,977
 
Other operating income   (216,496 )
Total operating expenses, net 12,234,523   10,310,817  
     
Operating income 3,198,284   3,998,501  
     
Other income / (expenses)    
Interest and other financing costs (1,251,412 ) (694,307 )
Gain on derivative, net   484,910  
Foreign exchange gain/ (loss) 1,628   (241 )
Interest income 8,595   1,214  
Other expenses, net (1,241,189 ) (208,424 )
     
Net income 1,957,095   3,790,077  
Dividend Series B Preferred shares

(159,562


)


(138,269


)
Preferred deemed dividend   (86,356 )
Net income attributable to common shareholders

1,797,533
 

3,565,452
 
Earnings per share, basic and diluted 0.32   0.53  
Weighted average number of shares, basic 5,576,960   6,711,408  
Weighted average number of shares, diluted 5,576,960   6,749,393  


Euroseas Ltd.
Unaudited Consolidated Condensed Balance Sheets
(All amounts expressed in U.S. Dollars – except number of shares)

  December 31,  2020
  March 31, 2021
           
ASSETS          
Current Assets:          
Cash and cash equivalents 3,559,399     3,629,150  
Trade accounts receivable 2,013,023     1,399,710  
Other receivables 1,866,624     2,093,941  
Inventories 1,662,422     1,638,868  
Restricted cash 345,010     341,432  
Prepaid expenses 244,315     420,454  
     Total current assets

9,690,793     9,523,555  
Fixed assets:          
Vessels, net 98,458,447     97,107,065  
Long-term assets:          
Restricted cash 2,433,768     2,434,267  
Derivative     191,825  
Total assets 110,583,008     109,256,712  
           
LIABILITIES, MEZZANINE EQUITY AND SHAREHOLDERS’ EQUITY          
Current liabilities:          
Long-term bank loans, current portion 20,645,320     21,145,320  
Related party loan, current 2,500,000        
Trade accounts payable 2,854,377     2,376,280  
Accrued expenses 1,300,420     1,536,931  
Accrued preferred dividends 168,676     215,338  
Deferred revenue 949,364     629,969  
Due to related company 24,072     1,769,238  
Derivative 203,553     229,798  
Total current liabilities 28,645,782     27,902,874  
           
Long-term liabilities:          
Long-term bank loans, net of current portion 46,220,028     43,583,848  
Derivative 362,195      
Total long-term liabilities 46,582,223     43,583,848  
Total liabilities 75,228,005     71,486,722  
            
Mezzanine equity:          
Series B Preferred shares (par value $0.01, 20,000,000 shares authorized, 8,365 and 6,365 issued and outstanding, respectively)       8,019,636     6,105,992  
Shareholders’ equity:          
Common stock (par value $0.03, 200,000,000 shares authorized, 6,708,946 and 6,791,847, issued and outstanding) 201,268     203,755  
Additional paid-in capital 257,467,980     258,228,672  
Accumulated deficit (230,333,881 )   (226,768,429 )
Total shareholders’ equity 27,335,367     31,663,998  
Total liabilities, mezzanine equity and shareholders’ equity 110,583,008     109,256,712  


Euroseas Ltd.
Unaudited Consolidated Condensed Statements of Cash Flows
(All amounts expressed in U.S. Dollars)

  Three Months Ended March 31,
  Three Months Ended March 31,
  2020   2021
     
Cash flows from operating activities:    
Net income 1,957,095     3,790,077  
Adjustments to reconcile net income to net cash provided by operating activities:    
Vessel depreciation 1,727,085     1,596,543  
Amortization of deferred charges 61,156     49,280  
Share-based compensation 30,404     28,765  
Loss on sale of vessel     9,417  
Unrealized gain on derivatives     (527,775 )
Amortization of fair value of below market time charters acquired

(846,405


)


Changes in operating assets and liabilities (903,784 )   1,422,694  
Net cash provided by operating activities 2,025,551     6,369,001  
     
Cash flows from investing activities:    
Cash paid for vessels capitalized expenses and sale expenses (149,420 )   (208,457 )
Advance received for vessel held for sale 1,133,817      
Net cash provided by / (used in) investing activities 984,397

    (208,457

)


Cash flows from financing activities:
   
Redemption of Series B preferred shares     (2,000,000 )
Proceeds from issuance of common stock, net of commissions paid     743,552  
Preferred dividends paid (161,315 )   (91,607 )
Repayment of long-term bank loans (3,285,460 )   (2,185,460 )
Repayment of related party loan     (2,500,000 )
Offering expenses paid (40,486 )   (60,357 )
Net cash used in financing activities (3,487,261 )   (6,093,872 )
     
Net (decrease)/ increase in cash, cash equivalents, and restricted cash (477,313 )   66,672  
Cash, cash equivalents, and restricted cash at beginning of period 5,930,061     6,338,177  
Cash, cash equivalents, and restricted cash at end of period 5,452,748     6,404,849  
Cash breakdown    
Cash and cash equivalents 508,105     3,629,150  
Restricted cash, current 810,376     341,432  
Restricted cash, long term 4,134,267     2,434,267  
Total cash, cash equivalents, and restricted cash shown in the statement of cash flows 5,452,748     6,404,849  


Euroseas Ltd.
Reconciliation of Adjusted EBITDA to
Net Income
(All amounts expressed in U.S. Dollars)

  Three Months Ended
March 31, 2020
Three Months Ended
March 31, 2021

Net income 1,957,095   3,790,077  
Interest and finance costs, net (incl. interest income) 1,242,817   693,093  
Vessel depreciation 1,727,085   1,596,543  
Loss on vessel sale   9,417  
Gain on interest rate swap derivative, net   (484,910 )
Amortization of below market time charters acquired (846,405 )  
Adjusted EBITDA 4,080,592   5,604,220  

Adjusted EBITDA Reconciliation:
Euroseas Ltd. considers Adjusted EBITDA to represent net income before interest, income taxes, depreciation, gain on interest rate swap, loss on sale of vessel and amortization of below market time charters acquired. Adjusted EBITDA does not represent and should not be considered as an alternative to net income, as determined by United States generally accepted accounting principles, or GAAP. Adjusted EBITDA is included herein because it is a basis upon which the Company assesses its financial performance and liquidity position and because the Company believes that this non-GAAP financial measure assists our management and investors by increasing the comparability of our performance from period to period by excluding the potentially disparate effects between periods of, financial costs, gain on interest rate swap, loss on sale of vessel, depreciation and amortization of below market time charters acquired. The Company’s definition of Adjusted EBITDA may not be the same as that used by other companies in the shipping or other industries.

Euroseas Ltd.
Reconciliation of Net Income to Adjusted Net Income
(All amounts expressed in U.S. Dollars except share data and per share amounts)

  Three Months Ended
March 31, 2020
Three Months Ended
March 31, 2021

Net income 1,957,095   3,790,077  
Unrealized gain on derivative   (527,775 )
Amortization of below market time charters acquired (846,405 )  
Loss on sale of vessel   9,417  
Adjusted net income 1,110,690   3,271,719  
Preferred dividends (159,562 ) (138,269 )
Preferred deemed dividend   (86,356 )
Adjusted net income attributable to common shareholders 951,128   3,047,094  
Adjusted earnings per share, basic and diluted 0.17   0.45  
Weighted average number of shares, basic 5,576,975   6,711,408  
Weighted average number of shares, diluted 5,576,975   6,749,393  

Adjusted net income and Adjusted earnings per share Reconciliation:
Euroseas Ltd. considers Adjusted net income to represent net income before unrealized gain on derivative, loss on sale of vessel and amortization of below market time charters acquired. Adjusted net income and Adjusted earnings per share is included herein because we believe it assists our management and investors by increasing the comparability of the Company’s fundamental performance from period to period by excluding the potentially disparate effects between periods of unrealized gain on derivative, loss on sale of vessel and amortization of below market time charters acquired, which items may significantly affect results of operations between periods.

Adjusted net income and Adjusted earnings per share do not represent and should not be considered as an alternative to net income or earnings per share, as determined by GAAP. The Company’s definition of Adjusted net income and Adjusted earnings per share may not be the same as that used by other companies in the shipping or other industries.

About Euroseas Ltd.
Euroseas Ltd. was formed on May 5, 2005 under the laws of the Republic of the Marshall Islands to consolidate the ship owning interests of the Pittas family of Athens, Greece, which has been in the shipping business over the past 140 years. Euroseas trades on the NASDAQ Capital Market under the ticker ESEA.

Euroseas operates in the container shipping market. Euroseas’ operations are managed by Eurobulk Ltd., an ISO 9001:2008 and ISO 14001:2004 certified affiliated ship management company, which is responsible for the day-to-day commercial and technical management and operations of the vessels. Euroseas employs its vessels on spot and period charters and through pool arrangements.

The Company has a fleet of 14 vessels, including 9 Feeder containerships and 5 Intermediate containerships. Euroseas 14 containerships have a cargo capacity of 42,281 teu.

Forward Looking Statement
This press release contains forward-looking statements (as defined in Section 27A of the Securities Act of 1933, as amended, and Section 21E of the Securities Exchange Act of 1934, as amended) concerning future events and the Company’s growth strategy and measures to implement such strategy; including expected vessel acquisitions and entering into further time charters. Words such as “expects,” “intends,” “plans,” “believes,” “anticipates,” “hopes,” “estimates,” and variations of such words and similar expressions are intended to identify forward-looking statements. Although the Company believes that the expectations reflected in such forward-looking statements are reasonable, no assurance can be given that such expectations will prove to have been correct. These statements involve known and unknown risks and are based upon a number of assumptions and estimates that are inherently subject to significant uncertainties and contingencies, many of which are beyond the control of the Company. Actual results may differ materially from those expressed or implied by such forward-looking statements. Factors that could cause actual results to differ materially include, but are not limited to changes in the demand for containerships, competitive factors in the market in which the Company operates; risks associated with operations outside the United States; and other factors listed from time to time in the Company’s filings with the Securities and Exchange Commission. The Company expressly disclaims any obligations or undertaking to release publicly any updates or revisions to any forward-looking statements contained herein to reflect any change in the Company’s expectations with respect thereto or any change in events, conditions or circumstances on which any statement is based.

Visit the Company’s website www.euroseas.gr

Company Contact Investor Relations / Financial Media
Tasos Aslidis
Chief Financial Officer
Euroseas Ltd.
11 Canterbury Lane,
Watchung, NJ 07069
Tel. (908) 301-9091
E-mail: [email protected]
Nicolas Bornozis
President
Capital Link, Inc.
230 Park Avenue, Suite 1536
New York, NY 10169
Tel. (212) 661-7566
E-mail: [email protected]


1 Adjusted EBITDA, Adjusted net income and Adjusted earnings per share are not recognized measurements under US GAAP (GAAP) and should not be used in isolation or as a substitute for Euroseas financial results presented in accordance with GAAP. Refer to a subsequent section of the Press Release for the definitions and reconciliation of these measurements to the most directly comparable financial measures calculated and presented in accordance with GAAP.

Finding Replacements for Petroleum Based Chemicals


image credit: Repsol (Flickr)


Oil Companies are Going All-In on Petrochemicals – Where Will That Leave Biochemicals?


Global oil consumption declined by roughly 9% in 2020 as the pandemic reduced business and pleasure travel, factory production and transportation of goods. This abrupt drop accelerated an ongoing shift from fossil fuels to renewable energy.

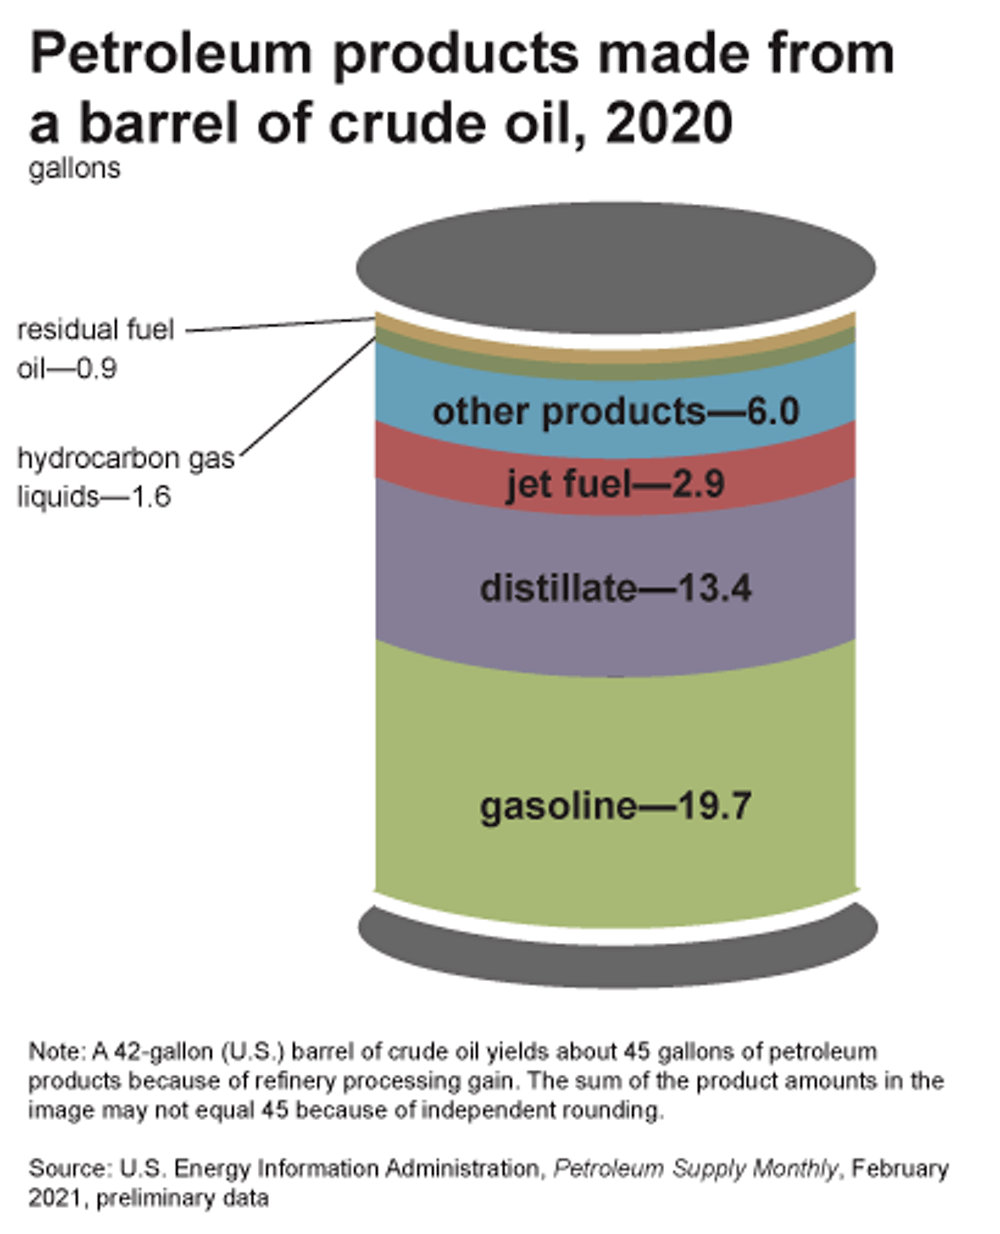
U.S. government forecasts show that oil use for transportation, industry, construction, heating and electricity is declining and will continue to drop in the coming years. This trend has enormous implications for the oil industry: As the International Energy Agency observed in 2020, “No oil and gas company will be unaffected by clean energy transitions.” Many of these companies are trying to make up losses by boosting production of petrochemicals derived from oil and natural gas. Today roughly 80% of every barrel of oil is used to make gasoline, diesel and jet fuel, with the rest going into petrochemical products. As demand for petroleum fuels gradually declines, the amount of oil used for that “other” share will grow.

This makes sense as a business strategy, but here’s the problem: Researchers are working to develop more sustainable replacements for petrochemical products, including bio-based plastics and specialty chemicals. However, petrochemicals can be manufactured at a fraction of the cost. As a biochemist working to develop environmentally benign versions of valuable chemicals, I’m concerned that without adequate support, pioneering green chemistry research will struggle to compete with fossil-based products.


Pivoting Toward Petrochemicals

Petrochemicals are used in millions of products, from plastics, detergents, shampoos and makeup to industrial solvents, lubricants, pharmaceuticals, fertilizer and carpeting. Over the next 20 years, oil company BP projects that this market will grow by 16% to 20%.

Oil companies are ramping up to increase petrochemical production. In the Saudi Arabian town of Yanbu, for example, two state-owned companies, Saudi Aramco and Sabic, are planning a new complex that will produce 9 million metric tons of petrochemicals each year, transforming Arabian light crude oil into lubricants, solvents and other products.

These changes are happening across the global industry. Several Chinese companies are constructing factories that will convert about 40% of their oil into chemicals such as p-Xylene, a building block for industrial chemicals. Exxon-Mobil began expanding research and development on petrochemicals as far back as 2014.


The Promise of Green Chemistry

At the same time, in the U.S. and other industrialized countries, health, environmental and security issues are driving a quest to produce sustainable alternatives for petroleum-based chemicals. Drilling for oil and natural gas, using petrochemicals and burning fossil fuels have widespread environmental and human health impacts. High oil consumption also raises national security concerns.

The Department of Energy has led basic research on bioproducts through its national laboratories and funding for university BioEnergy Research Centers. These labs are developing plant-based, sustainable domestic biofuels and bioproducts, including petrochemical replacements, through a process called “metabolic engineering.”

Researchers like me are using enzymes to transform leafy waste matter from crops and other sources into sugars that can be consumed by microorganisms – typically, bacteria and fungi such as yeast. These microorganisms then transform the sugars into molecules, similar to the way that yeast converts sugar to ethanol, fermenting it into beer.

In the creation of bioproducts, instead of creating ethanol the sugar is transformed into other molecules. We can design these metabolic pathways to create solvents; components in widely used polymers like nylon; perfumes; and many other products.

My laboratory is exploring ways to engineer enzymes – catalysts produced by living cells that cause or speed up biochemical reactions. We want to produce enzymes that can be put into engineered bacteria, in order to make structurally complex natural products.

The overall goal is to put carbon and oxygen together in a predictable fashion, similar to the chemical structures created through petroleum-based chemistry. But the green approach uses natural substances instead of oil or natural gas as building blocks.

This isn’t a new concept. Enzymes in bacteria are used to make an important antibiotic, erythromycin, which was first discovered in 1952.

All of this takes place in a biorefinery – a facility that takes natural inputs like algae, crop waste or specially grown energy crops like switchgrass and converts them into commercially valuable substances, as oil refineries do with petroleum. After fermenting sugars with engineered microorganisms, a biorefinery separates and purifies microbial cells to produce a spectrum of bio-based products, including food additives, animal feed, fragrances, chemicals and plastics.

In response to the global plastic pollution crisis, one research priority is “polymer upcycling.” Using bio-based feedstocks can transform single-use water bottles into materials that are more recyclable than petroleum-based versions because they are easier to heat and remold.

Promoting bio-based products is compatible with President Biden’s all-of-government approach to climate change. Biomanufacturing investments could also help bring modern manufacturing jobs to rural areas, a goal of Biden’s American Jobs Plan.

But oil company investments in the design of novel chemicals are growing, and the chasm between the cost of petroleum-based products and those produced through emerging green technologies continues to widen. More efficient technologies could eventually flood existing petrochemical markets, further driving down the cost of petrochemicals and making it even harder to compete.

In my view, the growing climate crisis and increasing plastic pollution make it urgent to wean the global economy from petroleum. I believe that finding replacements for petroleum-based chemicals in many products we use daily can help move the world toward that goal.


This article
was republished with permission from 
The
Conversation
, a news
site dedicated to sharing ideas from academic experts.  Written by, 
Constance B. Bailey Assistant Professor of Chemistry, University of Tennessee


Suggested Reading:

Repurposing Power Plants for Crypto Mining

Rare Earth Elements Demand is Still Growing


Can Mining be Green and Sustainable?

The Increasing Popularity of Uranium Investments

Release – Cleveland Cavaliers Team Up With Esports Entertainment Group to Become Official Esports Tournament Platform Provider in Multi-Year Deal


Cleveland Cavaliers Team Up With Esports Entertainment Group to Become Official Esports Tournament Platform Provider in Multi-Year Deal

Newark, New Jersey and Cleveland, Ohio–(Newsfile Corp. – May 26, 2021) – Esports Entertainment Group, Inc. (NASDAQ: GMBL) (NASDAQ: GMBLW) (or the “Company”) have announced a multi-year partnership with the Cleveland Cavaliers (“Cavs”) to be the NBA franchise’s official esports tournament platform provider. As part of the new multi-year agreement, the Company will operate three co-branded esports tournaments annually for the Cavs utilizing its Esports Gaming League (“EGL”) platform.

“Our EGL platform continues to gain strong traction among top-tier professional sports franchises,” said Grant Johnson, CEO of Esports Entertainment Group. “We are delighted to announce the Cavs as our first NBA team partnership. Our robust tournament platform will help the Cavs strengthen connections with their fans, while providing new avenues for engagement.”

As a proud partner of the Cavs, Esports Entertainment Group will receive courtside LED signage at all Cavs regular season home games during the upcoming 2021-2022 season and will be the presenting partner of an annual esports themed night. Esports Entertainment Group will leverage the Cavs ongoing digital marketing efforts spanning social, email, mobile, and online channels to promote the tournaments. The partnership also includes Cavs Legion GC, the team’s NBA 2K League affiliate, with brand exposure on the player’s physical jerseys and virtually in-game. Cavs Legion will also host an upcoming NBA 2K tournament operated by EGL.

“The growing popularity of esports provides a great opportunity for our team to create deeper connections and engagement with our fans,” said Matt O’Brien, Cleveland Cavaliers vice president, global corporate partnerships. “We think these tournaments will be very popular with our fans and a fun way to compete in an entertaining and social environment with gamers from across the world.”

“Working with the Cavs and other top teams in the NFL, NHL, and more provide a strong validation of the quality of our robust platform and its ability to meet the demanding needs of large-scale, high-profile deployments,” said Magnus Leppäniemi, President of Esports at Esports Entertainment Group.

EGL enables live and online events and tournaments where gamers can compete and enjoy a wide range of content relating to esports and video games on a proprietary technology platform. Services include full turnkey esports events, live broadcast production, game launches, and online branded tournaments.

About Esports Entertainment Group

Esports Entertainment Group, Inc. is an esports and iGaming company. The Company maintains offices in New Jersey, the UK and Malta. For more information visit www.esportsentertainmentgroup.com.

FORWARD-LOOKING STATEMENTS

The information contained herein includes forward-looking statements. These statements relate to future events or to our future financial performance, and involve known and unknown risks, uncertainties and other factors that may cause our actual results, levels of activity, performance, or achievements to be materially different from any future results, levels of activity, performance or achievements expressed or implied by these forward-looking statements. You should not place undue reliance on forward-looking statements since they involve known and unknown risks, uncertainties and other factors which are, in some cases, beyond our control and which could, and likely will, materially affect actual results, levels of activity, performance or achievements. Any forward-looking statement reflects our current views with respect to future events and is subject to these and other risks, uncertainties and assumptions relating to our operations, results of operations, growth strategy and liquidity. We assume no obligation to publicly update or revise these forward-looking statements for any reason, or to update the reasons actual results could differ materially from those anticipated in these forward-looking statements, even if new information becomes available in the future. The safe harbor for forward-looking statements contained in the Securities Litigation Reform Act of 1995 protects companies from liability for their forward-looking statements if they comply with the requirements of the Act.

ABOUT CLEVELAND CAVALIERS

The Cleveland Cavaliers won the NBA Championship in 2016 while also taking the Eastern Conference crown in 2007, 2015, 2016, 2017 and 2018. The team plays at, and also operates, the newly transformed, publicly-owned Rocket Mortgage FieldHouse in downtown Cleveland, Ohio. The Cavaliers are regularly recognized for their extensive community support and engagement programs and contributions, workplace diversity and inclusion leadership, and an on-going economic impact that now registers in the billions of dollars locally. Dan Gilbert is Chairman of the Cleveland Cavaliers. Gilbert and his family of companies have now invested over $2.0 billion in Cleveland. Gilbert is also Founder and Chairman of Quicken Loans, Inc. the nation’s largest mortgage lender, and Founder and Chairman of Rock Ventures LLC, the umbrella entity for his portfolio of business and real estate investments. Len Komoroski is the Cavaliers and Rocket Mortgage FieldHouse CEO and Nic Barlage is the Cavaliers and Rocket Mortgage FieldHouse President of Business Operations. The Cavaliers team is led by General Manager Koby Altman and Head Coach J.B. Bickerstaff. The Cavaliers and Rocket Mortgage FieldHouse provide fans the best experience in the NBA with its extensive and stunning array of amenities and technology and signature, electrifying game presentation. The Cavaliers and Rocket Mortgage FIeldHouse are part of Rock Entertainment Group. The Group also includes the Cleveland Monsters of the AHL, the Canton Charge of the NBA G League, Cavs Legion of the NBA 2K League, Legion Lair Lit by TCP home of Cavs Legion in Cleveland, and Cleveland Clinic Courts – the Cavaliers’ training and development center in Independence, Ohio.

Contact:

U.S. Investor Relations
RedChip Companies, Inc.
Dave Gentry
407-491-4498

[email protected]

Media & Investor Relations
Inquiries

[email protected]

Cleveland Cavaliers
Zack Yohman
[email protected]
(216) 420-2837

Release – Euroseas Ltd. Reports Results for the Quarter Ended March 31 2021


Euroseas Ltd. Reports Results for the Quarter Ended March 31, 2021


ATHENS, Greece, May 25, 2021 (GLOBE NEWSWIRE) — Euroseas Ltd. (NASDAQ: ESEA, the “Company” or “Euroseas”), an owner and operator of container carrier vessels and provider of seaborne transportation for containerized cargoes, announced today its results for the three-month period ended March 31, 2021.

First Quarter 2021 Financial Highlights:

  • Total net revenues of $14.3 million. Net income of $3.8 million; net income attributable to common shareholders (after a $0.1 million of dividend on Series B Preferred Shares and a $0.1 million of preferred deemed dividend arising out of the redemption of approximately $2 million of Series B Preferred Shares in the first quarter of 2021) of $3.6 million or $0.53 per share basic and diluted. Adjusted net income attributable to common shareholders1 for the period was $3.0 million or $0.45 per share basic and diluted.

  • Adjusted EBITDA1 was $5.6 million.

  • An average of 14.0 vessels were owned and operated during the first quarter of 2021 earning an average time charter equivalent rate of $12,134 per day. 

  • The Company declared a dividend of $0.1 million on its Series B Preferred Shares. The dividend will be paid in cash.

Additional announcement:

The Company has completed its first Environment, Social & Governance (“ESG”) report which will be available on its web site on May 26, 2021.

Aristides Pittas, Chairman and CEO of Euroseas commented: “Over the last three months, the containership markets have continued their upward path exceeding their previous peak of 2008 and coming within reach to challenge their all-time highs last observed in 2005. Recovering demand and inefficiencies in container transport logistics, like port congestion, crew replacement and COVID related protocols, have been combined with modest supply growth to support the present market levels. The higher rates, naturally, have had a very positive effect on our profitability which is to further increase as the remaining of our vessels will renew their legacy charters during the following 4-5 months. In addition to chartering our vessels at higher rates, the strong market has allowed us to pursue charters of longer periods, of two or more years, thus, establishing visibility of our earnings well into next year and even 2023.

“We believe that the favorable market fundamentals will continue over the remainder of this and the next year as world economies are projected to continue recovering from their pandemic induced slowdowns and to register strong growth rates while, in parallel, vessel deliveries are expected to be modest over the same period.

“Our strategy is focused on ensuring that Euroseas remains a significant participant in the feeder/intermediate containership segment, expanding in a risk measured and accretive manner and using our public listing as a potential platform to consolidate privately owned vessels or fleets. Furthermore, as our liquidity increases, we are evaluating possible uses of any accumulated funds in terms of further deleveraging our balance sheet, exploiting investment opportunities or rewarding our shareholders by re-instituting common stock dividends.

“Finally, we are pleased to have completed our first Environment, Social & Governance report. Our ESG responsibilities is an integral part of our strategy and our overall success and we look forward to regularly communicating our progress on this front to our shareholders and investors.”

Tasos Aslidis, Chief Financial Officer of Euroseas commented: “The results of the first quarter of 2021 reflect the increased charter rates our vessels earned due to the major recovery of the market compared to the same period of last year. Our net revenues decreased to $14.3 million in the first quarter of 2021 compared to $15.4 million during the same period of last year due to the lower number of vessels we operated in the first quarter of 2021. During the first quarter of 2021 we operated 14.0 vessels versus 19.0 vessels during the same period of last year.

“On a per-vessel-per-day basis, our vessels earned a 26.2% higher average charter rate in the first quarter of 2021 as compared to the same period of 2020. Again, on a per-vessel-per-day basis, the sum of vessel operating expenses, management fees and general and administrative expenses increased by 17.6% during the first quarter of 2021 as compared to the same period in 2020 which was attributable to increased supply of stores, increase in hull and machinery insurance premiums and the increased crewing costs for our vessels compared to the same period of 2020, resulting from difficulties in crew rotation due to COVID-19 related restrictions. We believe that we continue to maintain one of the lowest operating cost structures amongst the public shipping companies which is one of our competitive advantages.

“Adjusted EBITDA during the first quarter of 2021 was $5.6 million compared to $4.1 million achieved for the first quarter of 2020.”

“Finally, as of March 31, 2021, our outstanding debt (excluding the unamortized loan fees) is about $65.1 million versus restricted and unrestricted cash of about $6.4 million.”
        
First Quarter 2021 Results:
For the first quarter of 2021, the Company reported total net revenues of $14.3 million representing a 7.3% decrease over total net revenues of $15.4 million during the first quarter of 2020. On average, 14.0 vessels were owned and operated during the first quarter of 2021 earning an average time charter equivalent rate of $12,134 per day compared to 19.0 vessels in the same period of 2020 earning on average $9,615 per day. The Company reported a net income for the period of $3.8 million and a net income attributable to common shareholders of $3.6 million, as compared to a net income of $2.0 million and a net income attributable to common shareholders of $1.8 million for the first quarter of 2020.

Vessel operating expenses for the first quarter of 2021 amounted to $6.9 million as compared to $8.0 million for the same period of 2020. The decreased amount is due to the lower number of vessels owned and operated in the first quarter of 2021 compared to the corresponding period of 2020, partly offset by the increased crewing costs for our vessels compared to the same period of 2020, resulting from difficulties in crew rotation due to COVID-19 related restrictions, the increased supply of stores and the increase in hull and machinery insurance premiums. Depreciation expense for the first quarter of 2021 amounted to $1.6 million compared to $1.7 million for the same period of 2020 due to the decreased number of vessels in the Company’s fleet. Related party management fees for the first quarter of 2021 decreased to $1.1 million from $1.3 million for the same period of 2020 for the same reason. In the first quarter of 2021 and 2020, none of our vessels underwent drydocking and certain expenses were incurred in connection with upcoming drydockings; finally, during the first quarter of 2021, we had other operating income of $0.2 million relating to settlement of accounts with charterers of sold vessels.

Interest and other financing costs for the first quarter of 2021 amounted to $0.7 million compared to $1.3 million for the same period of 2020. This decrease is due to the decreased amount of debt and the decrease in weighted average LIBOR rate in the current period compared to the same period of 2020. For the three months ended March 31, 2021 the Company recognized a $0.48 million loss on its interest rate swap contract, comprising a $0.52 million unrealized loss and a $0.04 million realized gain.

Adjusted EBITDA1 for the first quarter of 2021 was $5.6 million, compared to $4.1 million achieved for the first quarter of 2020. Please see below for Adjusted EBITDA reconciliation to net income.

Basic and diluted earnings per share for the first quarter of 2021 was $0.53, calculated on 6,711,408 basic and 6,749,393 diluted weighted average number of shares outstanding compared to basic and diluted earnings per share of $0.32 for the first quarter of 2020, calculated on 5,576,960 basic and diluted weighted average number of shares outstanding.

Excluding the effect on the income attributable to common shareholders for the quarter of the unrealized gain on derivatives and the loss on sale of vessel, the adjusted earnings per share for the quarter ended March 31, 2021 would have been $0.45 per share basic and diluted, respectively, compared to adjusted earnings of $0.17 per share basic and diluted for the first quarter of 2020, after excluding amortization of below market time charters acquired. Usually, security analysts do not include the above items in their published estimates of earnings per share.

Fleet Profile:
The Euroseas Ltd. fleet profile is as follows:

Name Type Dwt TEU Year Built Employment(*) TCE Rate ($/day)

Container Carriers
           
AKINADA BRIDGE (*) Intermediate 71,366 5,610 2001 TC until Oct-21
TC until Oct-22
$17,250
$20,000
SYNERGY BUSAN (*) Intermediate 50,726 4,253 2009 TC until Aug-21
TC until Aug-24
$12,000
$25,000
SYNERGY ANTWERP (*) Intermediate 50,726 4,253 2008 TC until Sep-23 $18,000
SYNERGY OAKLAND (*) Intermediate 50,787 4,253 2009 TC until Jul-21 CONTEX(**) 4250 less 10%, i.e. $37,850 from 22/4/21 until 22/7/21
SYNERGY KEELUNG (+) Intermediate 50,969 4,253 2009 TC until Jun-22 plus 8- 12 months option $10,000 until Jun-21; $11,750 until Jun-22; option $14,500
EM KEA (*) Feeder 42,165 3,100 2007 TC until May-23 $22,000
EM ASTORIA (+) Feeder 35,600 2,788 2004 TC until Feb-22 $18,650
EVRIDIKI G (+) Feeder 34,677 2,556 2001 TC until Jan-22 $15,500
EM CORFU (+) Feeder 34,654 2,556 2001 TC until Sep-21 $10,200
DIAMANTIS P (+) Feeder 30,360 2,008 1998 TC until Aug-21 $6,500
EM SPETSES (+) Feeder 23,224 1,740 2007 TC until Jul-21 $8,100
EM HYDRA (*) Feeder 23,351 1,740 2005 TC until May-21
TC until April-23
$7,200
$20,000
JOANNA (*) Feeder 22,301 1,732 1999 TC until Oct-22 $16,800
AEGEAN EXPRESS (*) Feeder 18,581 1,439 1997 TC until Mar-22 $11,500
Total Container Carriers 14 539,487 42,281      

Note: (*) TC denotes time charter. Charter duration indicates the earliest redelivery date; All dates listed are the earliest redelivery dates under each TC unless the contract rate is lower than the current market rate in which cases the latest redelivery date is assumed; vessels with the latest redelivery date shown are marked by (+).

(**) The CONTEX (Container Ship Time Charter Assessment Index) has been published by the Hamburg and Bremen Shipbrokers’ Association (VHBS) since October 2007. The CONTEX is a company-independent index of time charter rates for containerships. It is based on assessments of the current day charter rates of six selected containership types, which are representative of their size categories: Type 1,100 TEU and Type 1,700 TEU with a charter period of one year, and the Types 2,500, 2,700, 3,500 and 4,250 TEU all with a charter period of two years.

Summary Fleet Data:

  Three Months, Ended March 31, 2020 Three Months, Ended March 31, 2021
FLEET DATA    
Average number of vessels (1) 19.00   14.00  
Calendar days for fleet (2) 1,729.0   1,260.0  
Scheduled off-hire days incl. laid-up (3)    
Available days for fleet (4) = (2) – (3) 1,729.0   1,260.0  
Commercial off-hire days (5) 18.2    
Operational off-hire days (6) 65.8   41.2  
Voyage days for fleet (7) = (4) – (5) – (6) 1,645.0   1,218.8  
Fleet utilization (8) = (7) / (4) 95.1 % 96.7 %
Fleet utilization, commercial (9) = ((4) – (5)) / (4) 98.9 % 100.0 %
Fleet utilization, operational (10) = ((4) – (6)) / (4) 96.2 % 96.7 %
     
AVERAGE DAILY RESULTS    
Time charter equivalent rate (11) 9,615   12,134  
Vessel operating expenses excl. drydocking expenses (12) 5,417   6,310  
General and administrative expenses (13) 464   604  
Total vessel operating expenses (14) 5,881   6,914  
Drydocking expenses (15) 13   65  

(1) Average number of vessels is the number of vessels that constituted the Company’s fleet for the relevant period, as measured by the sum of the number of calendar days each vessel was a part of the Company’s fleet during the period divided by the number of calendar days in that period.

(2) Calendar days. We define calendar days as the total number of days in a period during which each vessel in our fleet was in our possession including off-hire days associated with major repairs, drydockings or special or intermediate surveys or days of vessels in lay-up. Calendar days are an indicator of the size of our fleet over a period and affect both the amount of revenues and the amount of expenses that we record during that period.

(3) The scheduled off-hire days including vessels laid-up are days associated with scheduled repairs, drydockings or special or intermediate surveys or days of vessels in lay-up.

(4) Available days. We define available days as the Calendar days in a period net of scheduled off-hire days incl. laid up. We use available days to measure the number of days in a period during which vessels were available to generate revenues. 

(5) Commercial off-hire days. We define commercial off-hire days as days a vessel is idle without employment.

(6) Operational off-hire days. We define operational off-hire days as days associated with unscheduled repairs or other off-hire time related to the operation of the vessels.

(7) Voyage days. We define voyage days as the total number of days in a period during which each vessel in our fleet was in our possession net of commercial and operational off-hire days. We use voyage days to measure the number of days in a period during which vessels actually generate revenues or are sailing for repositioning purposes.

(8) Fleet utilization. We calculate fleet utilization by dividing the number of our voyage days during a period by the number of our available days during that period. We use fleet utilization to measure a company’s efficiency in finding suitable employment for its vessels and minimizing the amount of days that its vessels are off-hire for reasons such as unscheduled repairs or days waiting to find employment. 

(9) Fleet utilization, commercial. We calculate commercial fleet utilization by dividing our available days net of commercial off-hire days during a period by our available days during that period. 

(10) Fleet utilization, operational. We calculate operational fleet utilization by dividing our available days net of operational off-hire days during a period by our available days during that period. 

(11) Time charter equivalent rate, or TCE rate, is a measure of the average daily net revenue performance of our vessels. Our method of calculating TCE is determined by dividing time charter revenue and voyage charter revenue net of voyage expenses by voyage days for the relevant time period. Voyage expenses primarily consist of port, canal and fuel costs that are unique to a particular voyage, which would otherwise be paid by the charterer under a time charter contract, or are related to repositioning the vessel for the next charter. TCE is a standard shipping industry performance measure used primarily to compare period-to-period changes in a shipping company’s performance despite changes in the mix of charter types (i.e., spot voyage charters, time charters, pool agreements and bareboat charters) under which the vessels may be employed between the periods. Our definition of TCE may not be comparable to that used by other companies in the shipping industry.

(12) Daily vessel operating expenses, which include crew costs, provisions, deck and engine stores, lubricating oil, insurance, maintenance and repairs and management fees are calculated by dividing vessel operating expenses and management fees by fleet calendar days for the relevant time period. Drydocking expenses are reported separately. 

(13) Daily general and administrative expense is calculated by dividing general and administrative expense by fleet calendar days for the relevant time period. 

(14) Total vessel operating expenses, or TVOE, is a measure of our total expenses associated with operating our vessels. TVOE is the sum of vessel operating expenses, management fees and general and administrative expenses; drydocking expenses are not included. Daily TVOE is calculated by dividing TVOE by fleet calendar days for the relevant time period.

(15) Drydocking expenses include expenses during drydockings that would have been capitalized and amortized under the deferral method divided by the fleet calendar days for the relevant period. Drydocking expenses could vary substantially from period to period depending on how many vessels underwent drydocking during the period. The Company expenses drydocking expenses as incurred.

Conference Call and Webcast:
Tomorrow, Wednesday, May 26, 2021 at 10:00 a.m. Eastern Time, the Company’s management will host a conference call and webcast to discuss the results.

Conference Call details:
Participants should dial into the call 10 minutes before the scheduled time using the following numbers: 1 (877) 553-9962 (US Toll Free Dial In), 0(808) 238-0669 (UK Toll Free Dial In) or +44 (0) 2071 928592 (Standard International Dial In). Please quote “Euroseas” to the operator.

A telephonic replay of the conference call will be available until Tuesday, June 1, 2021, by dialing 1(866) 331-1332 (US Toll Free Dial In), 0(808) 238-0667 (UK Toll Free Dial In) or +44 (0) 3333 009785 (Standard International Dial In) and the access code required for the replay is: 6973591#.
 
Audio Webcast – Slides Presentation: 
There will be a live and then archived audio webcast of the conference call, via the internet through the Euroseas website (www.euroseas.gr). Participants to the live webcast should register on the website approximately 10 minutes prior to the start of the webcast.

The slide presentation on the first quarter ended March 31, 2021 will also be available in PDF format 10 minutes prior to the conference call and webcast, accessible on the company’s website (www.euroseas.gr) on the webcast page. Participants to the webcast can download the PDF presentation. 


Euroseas Ltd.
Unaudited Consolidated Condensed Statements of Operations
(All amounts expressed in U.S. Dollars except number of shares)

  Three Months Ended March 31, Three Months Ended March 31,
  2020 2021
     
Revenues    
Time charter revenue 16,131,322   14,916,567  
Commissions (698,515 ) (607,249 )
Net revenues 15,432,807   14,309,318  
       
Operating expenses / (income)    
Voyage expenses 314,554   127,409  
Vessel operating expenses 8,037,863   6,864,353  
Drydocking expenses 23,823   82,209  
Vessel depreciation 1,727,085   1,596,543  
Related party management fees 1,328,822   1,086,405  
Loss on sale of vessel   9,417  
General and administrative expenses

802,376
 

760,977
 
Other operating income   (216,496 )
Total operating expenses, net 12,234,523   10,310,817  
     
Operating income 3,198,284   3,998,501  
     
Other income / (expenses)    
Interest and other financing costs (1,251,412 ) (694,307 )
Gain on derivative, net   484,910  
Foreign exchange gain/ (loss) 1,628   (241 )
Interest income 8,595   1,214  
Other expenses, net (1,241,189 ) (208,424 )
     
Net income 1,957,095   3,790,077  
Dividend Series B Preferred shares

(159,562


)


(138,269


)
Preferred deemed dividend   (86,356 )
Net income attributable to common shareholders

1,797,533
 

3,565,452
 
Earnings per share, basic and diluted 0.32   0.53  
Weighted average number of shares, basic 5,576,960   6,711,408  
Weighted average number of shares, diluted 5,576,960   6,749,393  


Euroseas Ltd.
Unaudited Consolidated Condensed Balance Sheets
(All amounts expressed in U.S. Dollars – except number of shares)

  December 31,  2020
  March 31, 2021
           
ASSETS          
Current Assets:          
Cash and cash equivalents 3,559,399     3,629,150  
Trade accounts receivable 2,013,023     1,399,710  
Other receivables 1,866,624     2,093,941  
Inventories 1,662,422     1,638,868  
Restricted cash 345,010     341,432  
Prepaid expenses 244,315     420,454  
     Total current assets

9,690,793     9,523,555  
Fixed assets:          
Vessels, net 98,458,447     97,107,065  
Long-term assets:          
Restricted cash 2,433,768     2,434,267  
Derivative     191,825  
Total assets 110,583,008     109,256,712  
           
LIABILITIES, MEZZANINE EQUITY AND SHAREHOLDERS’ EQUITY          
Current liabilities:          
Long-term bank loans, current portion 20,645,320     21,145,320  
Related party loan, current 2,500,000        
Trade accounts payable 2,854,377     2,376,280  
Accrued expenses 1,300,420     1,536,931  
Accrued preferred dividends 168,676     215,338  
Deferred revenue 949,364     629,969  
Due to related company 24,072     1,769,238  
Derivative 203,553     229,798  
Total current liabilities 28,645,782     27,902,874  
           
Long-term liabilities:          
Long-term bank loans, net of current portion 46,220,028     43,583,848  
Derivative 362,195      
Total long-term liabilities 46,582,223     43,583,848  
Total liabilities 75,228,005     71,486,722  
            
Mezzanine equity:          
Series B Preferred shares (par value $0.01, 20,000,000 shares authorized, 8,365 and 6,365 issued and outstanding, respectively)       8,019,636     6,105,992  
Shareholders’ equity:          
Common stock (par value $0.03, 200,000,000 shares authorized, 6,708,946 and 6,791,847, issued and outstanding) 201,268     203,755  
Additional paid-in capital 257,467,980     258,228,672  
Accumulated deficit (230,333,881 )   (226,768,429 )
Total shareholders’ equity 27,335,367     31,663,998  
Total liabilities, mezzanine equity and shareholders’ equity 110,583,008     109,256,712  


Euroseas Ltd.
Unaudited Consolidated Condensed Statements of Cash Flows
(All amounts expressed in U.S. Dollars)

  Three Months Ended March 31,
  Three Months Ended March 31,
  2020   2021
     
Cash flows from operating activities:    
Net income 1,957,095     3,790,077  
Adjustments to reconcile net income to net cash provided by operating activities:    
Vessel depreciation 1,727,085     1,596,543  
Amortization of deferred charges 61,156     49,280  
Share-based compensation 30,404     28,765  
Loss on sale of vessel     9,417  
Unrealized gain on derivatives     (527,775 )
Amortization of fair value of below market time charters acquired

(846,405


)


Changes in operating assets and liabilities (903,784 )   1,422,694  
Net cash provided by operating activities 2,025,551     6,369,001  
     
Cash flows from investing activities:    
Cash paid for vessels capitalized expenses and sale expenses (149,420 )   (208,457 )
Advance received for vessel held for sale 1,133,817      
Net cash provided by / (used in) investing activities 984,397

    (208,457

)


Cash flows from financing activities:
   
Redemption of Series B preferred shares     (2,000,000 )
Proceeds from issuance of common stock, net of commissions paid     743,552  
Preferred dividends paid (161,315 )   (91,607 )
Repayment of long-term bank loans (3,285,460 )   (2,185,460 )
Repayment of related party loan     (2,500,000 )
Offering expenses paid (40,486 )   (60,357 )
Net cash used in financing activities (3,487,261 )   (6,093,872 )
     
Net (decrease)/ increase in cash, cash equivalents, and restricted cash (477,313 )   66,672  
Cash, cash equivalents, and restricted cash at beginning of period 5,930,061     6,338,177  
Cash, cash equivalents, and restricted cash at end of period 5,452,748     6,404,849  
Cash breakdown    
Cash and cash equivalents 508,105     3,629,150  
Restricted cash, current 810,376     341,432  
Restricted cash, long term 4,134,267     2,434,267  
Total cash, cash equivalents, and restricted cash shown in the statement of cash flows 5,452,748     6,404,849  


Euroseas Ltd.
Reconciliation of Adjusted EBITDA to
Net Income
(All amounts expressed in U.S. Dollars)

  Three Months Ended
March 31, 2020
Three Months Ended
March 31, 2021

Net income 1,957,095   3,790,077  
Interest and finance costs, net (incl. interest income) 1,242,817   693,093  
Vessel depreciation 1,727,085   1,596,543  
Loss on vessel sale   9,417  
Gain on interest rate swap derivative, net   (484,910 )
Amortization of below market time charters acquired (846,405 )  
Adjusted EBITDA 4,080,592   5,604,220  

Adjusted EBITDA Reconciliation:
Euroseas Ltd. considers Adjusted EBITDA to represent net income before interest, income taxes, depreciation, gain on interest rate swap, loss on sale of vessel and amortization of below market time charters acquired. Adjusted EBITDA does not represent and should not be considered as an alternative to net income, as determined by United States generally accepted accounting principles, or GAAP. Adjusted EBITDA is included herein because it is a basis upon which the Company assesses its financial performance and liquidity position and because the Company believes that this non-GAAP financial measure assists our management and investors by increasing the comparability of our performance from period to period by excluding the potentially disparate effects between periods of, financial costs, gain on interest rate swap, loss on sale of vessel, depreciation and amortization of below market time charters acquired. The Company’s definition of Adjusted EBITDA may not be the same as that used by other companies in the shipping or other industries.

Euroseas Ltd.
Reconciliation of Net Income to Adjusted Net Income
(All amounts expressed in U.S. Dollars except share data and per share amounts)

  Three Months Ended
March 31, 2020
Three Months Ended
March 31, 2021

Net income 1,957,095   3,790,077  
Unrealized gain on derivative   (527,775 )
Amortization of below market time charters acquired (846,405 )  
Loss on sale of vessel   9,417  
Adjusted net income 1,110,690   3,271,719  
Preferred dividends (159,562 ) (138,269 )
Preferred deemed dividend   (86,356 )
Adjusted net income attributable to common shareholders 951,128   3,047,094  
Adjusted earnings per share, basic and diluted 0.17   0.45  
Weighted average number of shares, basic 5,576,975   6,711,408  
Weighted average number of shares, diluted 5,576,975   6,749,393  

Adjusted net income and Adjusted earnings per share Reconciliation:
Euroseas Ltd. considers Adjusted net income to represent net income before unrealized gain on derivative, loss on sale of vessel and amortization of below market time charters acquired. Adjusted net income and Adjusted earnings per share is included herein because we believe it assists our management and investors by increasing the comparability of the Company’s fundamental performance from period to period by excluding the potentially disparate effects between periods of unrealized gain on derivative, loss on sale of vessel and amortization of below market time charters acquired, which items may significantly affect results of operations between periods.

Adjusted net income and Adjusted earnings per share do not represent and should not be considered as an alternative to net income or earnings per share, as determined by GAAP. The Company’s definition of Adjusted net income and Adjusted earnings per share may not be the same as that used by other companies in the shipping or other industries.

About Euroseas Ltd.
Euroseas Ltd. was formed on May 5, 2005 under the laws of the Republic of the Marshall Islands to consolidate the ship owning interests of the Pittas family of Athens, Greece, which has been in the shipping business over the past 140 years. Euroseas trades on the NASDAQ Capital Market under the ticker ESEA.

Euroseas operates in the container shipping market. Euroseas’ operations are managed by Eurobulk Ltd., an ISO 9001:2008 and ISO 14001:2004 certified affiliated ship management company, which is responsible for the day-to-day commercial and technical management and operations of the vessels. Euroseas employs its vessels on spot and period charters and through pool arrangements.

The Company has a fleet of 14 vessels, including 9 Feeder containerships and 5 Intermediate containerships. Euroseas 14 containerships have a cargo capacity of 42,281 teu.

Forward Looking Statement
This press release contains forward-looking statements (as defined in Section 27A of the Securities Act of 1933, as amended, and Section 21E of the Securities Exchange Act of 1934, as amended) concerning future events and the Company’s growth strategy and measures to implement such strategy; including expected vessel acquisitions and entering into further time charters. Words such as “expects,” “intends,” “plans,” “believes,” “anticipates,” “hopes,” “estimates,” and variations of such words and similar expressions are intended to identify forward-looking statements. Although the Company believes that the expectations reflected in such forward-looking statements are reasonable, no assurance can be given that such expectations will prove to have been correct. These statements involve known and unknown risks and are based upon a number of assumptions and estimates that are inherently subject to significant uncertainties and contingencies, many of which are beyond the control of the Company. Actual results may differ materially from those expressed or implied by such forward-looking statements. Factors that could cause actual results to differ materially include, but are not limited to changes in the demand for containerships, competitive factors in the market in which the Company operates; risks associated with operations outside the United States; and other factors listed from time to time in the Company’s filings with the Securities and Exchange Commission. The Company expressly disclaims any obligations or undertaking to release publicly any updates or revisions to any forward-looking statements contained herein to reflect any change in the Company’s expectations with respect thereto or any change in events, conditions or circumstances on which any statement is based.

Visit the Company’s website www.euroseas.gr

Company Contact Investor Relations / Financial Media
Tasos Aslidis
Chief Financial Officer
Euroseas Ltd.
11 Canterbury Lane,
Watchung, NJ 07069
Tel. (908) 301-9091
E-mail: [email protected]
Nicolas Bornozis
President
Capital Link, Inc.
230 Park Avenue, Suite 1536
New York, NY 10169
Tel. (212) 661-7566
E-mail: [email protected]


1 Adjusted EBITDA, Adjusted net income and Adjusted earnings per share are not recognized measurements under US GAAP (GAAP) and should not be used in isolation or as a substitute for Euroseas financial results presented in accordance with GAAP. Refer to a subsequent section of the Press Release for the definitions and reconciliation of these measurements to the most directly comparable financial measures calculated and presented in accordance with GAAP.

Release – PLBY Group Announces Successful Completion of Debt Refinancing


PLBY Group Announces Successful Completion of Debt Refinancing


LOS ANGELES, May 25, 2021 (GLOBE NEWSWIRE) — PLBY Group, Inc. (NASDAQ: PLBY) (“PLBY Group” or the “Company”), a leading pleasure and leisure lifestyle company and owner of Playboy, one of the most recognizable and iconic brands in the world, today announced the successful completion of the refinancing of their existing credit facility through a $160 million senior secured term loan maturing in May 2027.

The new term loan will accrue interest at LIBOR plus 5.75%, with a single step-down to LIBOR plus 5.25% upon achieving gross leverage of 3.0x, subject to a LIBOR floor of 0.5%. The debt refinancing is expected to result in an estimated $3 million in annual interest expense savings, reduce amortization by over $3 million annually, and eliminate over $7 million in annual excess cash flow sweep payments. The refinancing also allows the Company to request to borrow at least $30 million of additional incremental term loans, and the Company may borrow unlimited additional amounts of pari passu debt as long as its senior secured leverage ratio is below 4.75x.

“We are pleased to further strengthen our financial flexibility by refinancing our existing facility with a new term loan that should reduce our annual debt service by over $13 million and which provides a defined path for additional borrowing to fund M&A,” said Lance Barton, Chief Financial Officer of PLBY Group. “Following the strength of our first quarter results, we are well-positioned to execute on both our organic and M&A growth initiatives and build upon our incredible global brand.”

About PLBY Group, Inc.
PLBY Group connects consumers around the world with products, services, and experiences to help them look good, feel good, and have fun. PLBY Group serves consumers in four major categories: Sexual Wellness, Style & Apparel, Gaming & Lifestyle, and Beauty & Grooming. PLBY Group’s flagship consumer brand, Playboy, is one of the most recognizable, iconic brands in the world, driving billions of dollars in consumer spending annually across 180 countries. Learn more at http://www.plbygroup.com.

Forward-Looking Statements
This press release includes “forward-looking statements” within the meaning of the “safe harbor” provisions of the United States Private Securities Litigation Reform Act of 1995. The Company’s actual results may differ from their expectations, estimates, and projections and, consequently, you should not rely on these forward-looking statements as predictions of future events. Words such as “expect,” “estimate,” “project,” “budget,” “forecast,” “anticipate,” “intend,” “plan,” “may,” “will,” “could,” “should,” “believes,” “predicts,” “potential,” “continue,” and similar expressions (or the negative versions of such words or expressions) are intended to identify such forward-looking statements. These forward-looking statements include, without limitation, the Company’s expectations with respect to future performance, growth plans and anticipated financial impacts of the Company’s recent business combination and its acquisitions.

These forward-looking statements involve significant risks and uncertainties that could cause the actual results to differ materially from those discussed in the forward-looking statements. Factors that may cause such differences include, but are not limited to: (1) the impact of COVID-19 pandemic on the Company’s business; (2) the inability to maintain the listing of the Company’s shares of common stock on Nasdaq; (3) the risk that the business combination, recent acquisitions or any proposed transactions disrupt the Company’s current plans and operations, including the risk that the Company does not complete any such proposed transactions or achieve the expected benefits from them; (4) the ability to recognize the anticipated benefits of the business combination, which may be affected by, among other things, competition, the ability of the Company to grow and manage growth profitably, and retain its key employees; (5) costs related to the business combination, acquisitions and proposed transactions; (6) changes in applicable laws or regulations; (7) the possibility that the Company may be adversely affected by other economic, business, and/or competitive factors; (8) risks relating to the uncertainty of the projected financial information of the Company; (9) risks related to the organic and inorganic growth of the Company’s business and the timing of expected business milestones; and (10) other risks and uncertainties indicated from time to time in the Company’s annual report on Form 10-K, including those under “Risk Factors” therein, and in the Company’s other filings with the Securities and Exchange Commission. The Company cautions that the foregoing list of factors is not exclusive, and readers should not place undue reliance upon any forward-looking statements, which speak only as of the date which they were made. The Company does not undertake any obligation to update or revise any forward-looking statements to reflect any change in its expectations or any change in events, conditions, or circumstances on which any such statement is based.

Contact:

Investors: [email protected]
Media: [email protected]

Release – Palladium One Drills Haukiaho Trend Intercepts 72 Meters


Palladium One Drills Haukiaho Trend, Intercepts 72 Meters @ 1.8 g/t Palladium-Equivalent, Finland


May 26, 2021 – Toronto, Ontario – First drill results from the Company’s 2,000 meter drill program at Haukiaho, a zone approximately 20 kilometers south of the Company’s primary target area Kaukua South, have returned  significant widths and grades, including 72 meters at 1.8 g/t Palladium-equivalent “Pd_Eq”) (Hole LK21-071), on the Läntinen Koillismaa “LK”) PGE-Ni-Cu project in Finland, said Palladium One Mining Inc. “Palladium One” or the “Company”) (TSXV: PDM, FRA: 7N11, OTC: NKORF) today.

A total of 12 holes (1,943 metres) were drilled on the Haukiaho trend. This release contains the results from the first 7 holes of this program. The drilling was designed establish sufficient drill density to prepare a National Instrument 43-101 resource estimate at Haukiaho, which the Company anticipates completing in Q3 2021.

“Establishing a NI43-101 resource estimate at Haukiaho has been a priority for the Company given the robust historical data set available to the Company. Haukiaho was the original focus of the Phase I drill program in 2020, however, the discovery of Kaukua South led us towards first defining the potential of this new discovery and exploring the greater Kaukua area.  Despite this, Haukiaho was not forgotten and has remained an important part of our strategy to grow a multi-million ounce resource base. At 17 kilometers in length, the Haukiaho trend, currently represents the largest continuous patch of blue-sky potential on the LK property.” said Derrick Weyrauch, President and CEO.

Highlights

  • Drilling has returned significant widths and grades
  • Expanded higher grade areas within the known historic Haukiaho resource area
  • Expanded mineralization 100m to east of the historic resource
  • 72.2 meters grading 1.79 g/t Pd_Eq in hole LK21-071 starting 56m down hole, including 17.0 meters grading 2.23 g/t Pd_Eq
  • 15.7 meters grading 2.26 g/t Pd_Eq in hole LK21-069 including 3.6 meters grading 3.11 g/t Pd_Eq
  • 51.2 meters grading 1.07 g/t Pd_Eq in hole LK21-073 including 9.1 meters grading 2.10 g/t Pd_Eq
  • The historic Haukiaho resource is shallowly drilled, mostly above 200m in depth and therefore amendable to open pit mining

Haukiaho Historic Resource Estimate

In the 1980’s, Outokumpu  (a Finnish State-run mining company) prepared a resource estimate using very widely spaced holes along a portion of the Haukiaho trend, which estimated 7 million tonnes grading 0.38% Cu and 0.24% Ni, however importantly, no PGE assays were undertaken. The cut-off grade used was a 0.7% Copper_equivalent (defined as Cu% + 2 x Ni%).

Subsequently in 2013, Finore Mining Inc. completed a non-pit constrained NI43-101 historic resource estimate, over a much smaller strike length.  Using  a 0.1 g/t Pd cut-off, they estimated a resource of 1.13 million Pd_Eq ounces within 23.2 million tonnes grading 1.51 g/t Pd_Eq (0.31 g/t Pd, 0.12g/t Pt, 0.10 g/t Au, 0.21% Cu, and 0.14% Ni) (See news release August 12, 2019 and May 7, 2020).  This resource estimate encompassed widely spaced drilling with a focus on maximizing tonnage, not grade.

The Haukiaho trend is 17 kilometers long and the historic 2013 Haukiaho resource prepared by Finore covers less than 2 kilometers of this trend.  This knowledge coupled with the historic work by Outokumpu point to the enormous potential to significantly add resources at Haukiaho with disciplined execution of exploration activities.

While similar to the Kaukua deposit (See new release, September 30, 2019), the Haukiahio trend is more copper-nickel rich.  At Kaukua, approximately ~1/3 of the in-situ value per tonne is copper-nickel, while at Haukiaho copper-nickel represent approximately ~2/3s of the in-situ value.

Figure 1. LK Project location map showing 43-101 compliant Kaukua deposit and historic Haukiaho resource along with 2020 IP grids (blue lines) and current 2021 IP grid areas (black boxes). Yellow lines represent Exploration Permits, red lines represent Exploration Reservations held by the Company.

Figure 2. Plan map of Haukiaho 2020 IP chargeability anomalies and Palladium One drill holes locations.

Figure 3. Plan map of the Haukiaho historic 2013 Finore resource estimate represented by the > 0.5g/t Pd_Eq resource shape with Palladium One drill holes.

Figure 4. Haukiaho Cross section showing holes LK21-071, Finore hole HAU11-005, and geological survey of Finland (GTK) holes R-390 and R-389.

Table 1: Palladium One Haukiaho drill results

Hole

From
(m)

To
(m)

Width
(m)

Pd_Eq
g/t*

Pd
g/t

Pt
g/t

Au
g/t

Cu
%

Ni
%

LK20-008

17.3

33.5

16.2

1.99

0.38

0.15

0.14

0.26

0.20

Inc.

20.3

23.3

3.0

2.55

0.48

0.19

0.22

0.33

0.25

LK20-009

161.5

168.1

6.6

2.34

0.47

0.20

0.13

0.26

0.25

LK20-010

118.7

202.0

83.3

1.27

0.24

0.09

0.05

0.12

0.16

Inc.

166.8

201.0

34.3

2.09

0.47

0.20

0.10

0.20

0.22

Inc.

167.8

173.0

5.3

3.08

0.66

0.25

0.20

0.38

0.30

Inc.

20.3

23.3

3.0

2.55

0.48

0.19

0.22

0.33

0.25

LK21-067

No Significant values (collared in footwall rocks)

LK21-068

81.5

122.0

40.6

0.65

0.05

0.02

0.02

0.04

0.11

Inc.

106.2

120.0

13.9

0.80

0.12

0.05

0.02

0.06

0.12

Inc.

106.2

112.7

6.6

0.91

0.13

0.05

0.03

0.09

0.13

LK21-069

48.5

64.1

15.7

2.26

0.47

0.18

0.18

0.27

0.22

Inc.

48.5

60.0

11.6

2.53

0.52

0.19

0.18

0.30

0.25

Inc.

48.5

52.0

3.6

3.11

0.60

0.22

0.23

0.37

0.32

LK21-070

103.5

131.0

27.5

0.65

0.01

0.00

0.02

0.04

0.12

Inc.

113.0

119.0

6.0

0.83

0.02

0.00

0.04

0.09

0.14

LK21-071

55.8

128.0

72.2

1.79

0.37

0.15

0.14

0.22

0.17

Inc.

72.0

77.0

5.0

2.33

0.53

0.21

0.18

0.27

0.22

Inc.

74.0

75.5

1.5

3.20

0.75

0.29

0.23

0.39

0.29

And

86.2

94.0

7.8

2.74

0.53

0.21

0.23

0.32

0.27

And

111.0

128.0

17.0

2.23

0.53

0.21

0.18

0.28

0.18

Inc.

112.5

118.0

5.5

2.84

0.64

0.25

0.23

0.36

0.25

LK21-072

No Significant values (ended before zone)

LK21-073

75.8

127.0

51.2

1.07

0.15

0.06

0.06

0.13

0.13

Inc.

90.0

113.1

23.1

1.51

0.25

0.10

0.10

0.21

0.16

Inc.

90.8

99.9

9.1

2.10

0.37

0.15

0.16

0.27

0.21

Inc.

98.0

99.0

1.0

3.21

0.61

0.27

0.29

0.47

0.28

LK21-074

Pending

LK21-075

Pending

LK21-076

Pending

LK21-077

Pending

LK21-078

Pending

* Reported widths are “drilled widths” not true widths.
**Italicised orange highlighted results are previously released results see news release September 15, 2020

*Palladium Equivalent
Palladium equivalent is calculated using US$1,100 per ounce for palladium, US$950 per ounce for platinum, US$1,300 per ounce for gold, US$6,614 per tonne for copper, and US$15,4332 per tonne for nickel. This calculation is consistent with the calculation in the Company’s September 2019 NI 43-101 Kaukua resource estimate. Additionally, US$1,100 per ounce for palladium is consistent with the UBS January 2021 long-term consensus price forecast even though the current price of palladium is approximately US$2,800 per ounce.

QA/QC
The Phase I drilling program was carried out under the supervision of Neil Pettigrew, M.Sc., P. Geo., Vice President of Exploration and a director of the Company.

Drill core samples were split using a rock saw by Company staff, with half retained in the core box and stored indoors in a secure facility, in Taivalkoski, Finland. The drill core samples were transported by courier from the Company’s core handling facility in Taivalkoski, Finland, to ALS Global “ALS”) laboratory in Outokumpu, Finland. ALS, is an accredited lab and are ISO compliant (ISO 9001:2008, ISO/IEC 17025:2005). PGE analysis was performed using a 30 grams fire assay with an ICP-MS or ICP-AES finish. Multi-element analyses, including copper and nickel were analysed by four acid digestion using 0.25 grams with an ICP-AES finish.

Certified standards, blanks and crushed duplicates are placed in the sample stream at a rate of one QA/QC sample per 10 core samples. Results are analyzed for acceptance at the time of import. All standards associated with the results in this press release were determined to be acceptable within the defined limits of the standard used.

Qualified Person
The technical information in this release has been reviewed and verified by Neil Pettigrew, M.Sc., P. Geo., Vice President of Exploration and a director of the Company and the Qualified Person as defined by National Instrument 43-101.

About Palladium One
Palladium One Mining Inc. is an exploration company targeting district scale, platinum-group-element (PGE)-copper nickel deposits in Finland and Canada. Its flagship project is the Läntinen Koillismaa or LK Project, a palladium dominant platinum group element-copper-nickel project in north-central Finland, ranked by the Fraser Institute as one of the world’s top countries for mineral exploration and development. Exploration at LK is focused on targeting disseminated sulfides along 38 kilometers of favorable basal contact and building on an established NI 43-101 open pit resource.

ON BEHALF OF THE BOARD
“Derrick Weyrauch”
President & CEO, Director

For further information contact: Derrick Weyrauch, President & CEO
Email: [email protected]

Neither the TSX Venture Exchange nor its Market Regulator (as that term is defined in the policies of the TSX Venture Exchange) accepts responsibility for the adequacy or accuracy of this release.

This press release includes “forward-looking information” that is subject to a few assumptions, risks and uncertainties, many of which are beyond the control of the Company. Statements regarding listing of the Company’s common shares on the TSXV are subject to all of the risks and uncertainties normally incident to such events. Investors are cautioned that any such statements are not guarantees of future events and that actual events or developments may differ materially from those projected in the forward-looking statements. Such forward-looking statements represent management’s best judgment based on information currently available. Factors that could cause the actual results to differ materially from those in forward-looking statements include regulatory actions and general business conditions. Such forward-looking information reflects the Company’s views with respect to future events and is subject to risks, uncertainties and assumptions, including those set out in the Company’s annual information form dated April 29, 2020 and filed under the Company’s profile on SEDAR at www.sedar.com. The Company does not undertake to update forward?looking statements or forward?looking information, except as required by law. Investors are cautioned that any such statements are not guarantees of future performance and actual results or developments may differ materially from those projected in the forward-looking statements.

Release – Ceapro Inc. Announces Completion of Patient Enrollment in Clinical Study Evaluating Beta Glucan as a Cholesterol-Lowering Agent


Ceapro Inc. Announces Completion of Patient Enrollment in Clinical Study Evaluating Beta Glucan as a Cholesterol-Lowering Agent


– Clinical study evaluating the well-known health claims of beta glucan and its potentially beneficial approach for patients to lower plasma cholesterol –

– Study conducted in collaboration with the Montreal Heart Institute and led by MHI’s Montreal Health Innovations Coordinating Center (MHICC) –

– Topline data readout expected Q4 2021 –

EDMONTON, Alberta, May 26, 2021 (GLOBE NEWSWIRE) —  Ceapro Inc. (TSX-V: CZO) (“Ceapro” or the “Company”), a growth-stage biotechnology company focused on the development and commercialization of active ingredients for healthcare and cosmetic industries, today announced the completion of patient enrollment in its comparison study evaluating high-medium molecular weight beta glucan as a stand-alone or add-on therapy to statins (the “BetAvena study”) in subjects with hyperlipidemia.

The study is being conducted with the Montreal Heart Institute (MHI), led by Dr. Jean-Claude Tardif, Director of the Montreal Heart Institute Research Center and Principal Investigator for this clinical trial as part of a long-term collaboration.

“We are incredibly pleased with the flawless execution of this important clinical study, despite challenges posed by the COVID-19 pandemic. We are extremely grateful to Dr. Jean-Claude Tardif and his expert team at the Montreal Heart Institute and their dedication to getting this study across the finish line and providing the opportunity to assess and validate the well-known health benefits of beta glucan per the highest clinical practice standards. The amended protocol that we were granted for the study expanded our target addressable patient population, which provided both scientific and clinical value and aided in successfully completing patient enrollment. This is a major milestone for our Company as we expand as a biopharmaceutical company and we look forward to reporting topline data in the fourth quarter of this year,” stated Gilles Gagnon, M.Sc., MBA, President and CEO.

“With patient enrollment now complete, our team is focused on advancing this potential alternative treatment forward and bring the study to successful completion. Pending statistical review, the BetAvena study may represent a significant shift for the patient community hoping to achieve hyperlipidemia control with nutraceuticals such as Ceapro’s CP105F. We are impressed by the engagement of our clinical sites and our patients who had to compose with very difficult COVID circumstances,” added Dr. Tardif.

This multicenter, randomized, double-blind, parallel group, placebo-controlled study is conducted to determine the efficacy and safety of high-medium molecular weight beta glucan in subjects with hyperlipidemia (LDL-C level >130 mg/d L (3.37 mmol/L). The 18 to 24-month study enrolled approximately 264 subjects who cannot tolerate high doses of current treatments. The Company received approval from Health Canada in February 2020 to expand the inclusion criteria of the study to allow evaluation of enrolled subjects with confirmed pathophysiological condition of hyperlipidemia who voluntarily request to be treated with beta glucan only, without regular dosing of statins. Enrolled patients were randomized to receive either placebo, low, medium or high doses of beta glucan (500 mg tablet) as add-on therapy, or not, to atorvastatin 10 mg – 20 mg or an equivalent statin for a 12-week treatment period. The primary efficacy endpoint of the study is the change over 12 weeks in LDL-cholesterol.

The Company anticipates the statistical analysis to be completed this fall and subsequently submitted to Heath Canada. The Company expects to report topline data from the study in the fourth quarter of 2021.

About Ceapro Inc.

Ceapro Inc. is a Canadian biotechnology company involved in the development of proprietary extraction technology and the application of this technology to the production of extracts and “active ingredients” from oats and other renewable plant resources. Ceapro adds further value to its extracts by supporting their use in cosmeceutical, nutraceutical, and therapeutics products for humans and animals. The Company has a broad range of expertise in natural product chemistry, microbiology, biochemistry, immunology and process engineering. These skills merge in the fields of active ingredients, biopharmaceuticals and drug-delivery solutions. For more information on Ceapro, please visit the Company’s website at www.ceapro.com.

For more information contact:

Jenene Thomas
JTC Team, LLC
Investor Relations and Corporate Communications Advisor
T (US): +1 (833) 475-8247
E: [email protected]

Issuer:
Gilles R. Gagnon, M.Sc., MBA
President & CEO
T: 780-421-4555

Neither TSX Venture Exchange nor its Regulation Services Provider (as that term is defined in the policies of the TSX Venture Exchange) accepts responsibility for the adequacy or accuracy of this release


Source: Ceapro Inc.

Release – Comtech Telecommunications Corp. Awarded 1.6 Million Contract for High-Power Solid-State Amplifiers


Comtech Telecommunications Corp. Awarded $1.6 Million Contract for High-Power Solid-State Amplifiers


MELVILLE, N.Y.–(BUSINESS WIRE)–May 26, 2021– 
May 26, 2021— 
Comtech Telecommunications Corp. (NASDAQ: CMTL), a world leader in secure wireless communications technologies, announced today that during its third quarter of fiscal 2021, its 
New York-based subsidiary, 
Comtech PST Corp., which is part of Comtech’s Government Solutions segment, was awarded an additional 
$1.6 million contract for RF microwave solid-state amplifiers from a major domestic prime contractor, adding to an initial 
$1.7 million contract awarded earlier this fiscal year.

These very high-power solid-state amplifiers, which utilize the latest in solid-state GaN transistor technology, were developed in close cooperation with the prime contractor and are part of a complex RF microwave transmission system used by the 
U.S. Military.

“This additional order is another example of Comtech’s technical strength in delivering high-power solid-state transmitter solutions for military applications and the ongoing demand for our high-power solid-state amplifier products,” said  Fred Kornberg, Chairman of the Board and Chief Executive Officer of 
Comtech Telecommunications Corp.

Comtech PST Corp. (www.comtechpst.com) is a leading independent supplier of broadband, high-power, high performance RF microwave amplifiers and control components for use in a broad spectrum of applications including defense, medical, satellite communications systems and instrumentation.

Comtech Telecommunications Corp. is a leader in the global communications market headquartered in 
Melville, New York. With a passion for customer success, 
Comtech designs, produces and markets advanced secure wireless solutions to more than 1,000 customers in more than 100 countries. For more information, please visit www.comtechtel.com.

Certain information in this press release contains statements that are forward-looking in nature and involve certain significant risks and uncertainties. Actual results could differ materially from such forward-looking information. The Company’s 
Securities and Exchange Commission filings identify many such risks and uncertainties. Any forward-looking information in this press release is qualified in its entirety by the risks and uncertainties described in such 
Securities and Exchange Commission filings.

Media Contact:
Michael D. Porcelain, President and Chief Operating Officer

Comtech Telecommunications Corp.
631-962-7000
[email protected]

Source: 
Comtech Telecommunications Corp.

Release – ProMIS Neurosciences initiates commercialization of COVID-19 serology assay


ProMIS Neurosciences initiates commercialization of COVID-19 serology assay


Seasoned industry executive and entrepreneur, Owen Dempsey to lead the effort for ProMIS

TORONTO, Ontario and CAMBRIDGE, Massachusetts – May 25, 2021– ProMIS Neurosciences, Inc. (TSX: PMN); (OTCQB: ARFXF), a biotechnology company focused on the discovery and development of antibody therapeutics selectively targeting toxic oligomers implicated in the development of neurodegenerative diseases, today announced that it has initiated commercialization of its COVID-19 serology assay and has appointed Owen Dempsey to lead the commercialization program.

Owen’s professional work for the past 25 years has been to build companies founded to discover and commercialize antibodies in applications including life science research, pharmaceutical drug discovery, clinical diagnostics and therapeutic treatment of cancer, AIDS and other serious illness.  He has led private, venture-backed as well as NASDAQ-listed companies and is a past board member of ALDA, the Analytical, Life Science & Diagnostics Association.

 “I am delighted to lead this opportunity on behalf of ProMIS Neurosciences”, stated Owen Dempsey. “Our serology assay commercialization efforts will be targeting the need for a highly accurate test to detect, quantify and characterize antibodies against the virus causing COVID-19, either as a consequence of contracting the viral disease or in response to vaccination. Our initial focus will be on commercialization to the medical and public health community, vaccine developers, pharmaceutical companies, governmental agencies and other organizations.”

This advanced serology test developed by ProMIS Neurosciences measures not only serum antibodies to SARS-CoV-2, the novel coronavirus causing COVID-19, but also their protective activity against infection.  The assay simultaneously assesses antibody levels in the blood of study participants and their neutralizing activity against the original strain of SARS-CoV-2 as well as emerging variants.  Additional variants can be added to the assay as they are identified.  The assay utilizes an advanced, high-throughput, sensitive and accurate surface plasmon resonance (SPR) technology as opposed to traditional ELISA (enzyme-linked immunosorbent assay) methods.  

In commercializing an advanced serology testing platform, we aim to meet the needs of the medical community and investigators in academia, industry and government working to assess response and durability of response to vaccines as well as to monitor and assess antibody response to emerging strains of the virus..  As reported in the scientific literature, our accurate and sensitive format is capable of measuring neutralizing antibodies that inhibit coronavirus RBD binding to the human ACE2 receptor. This provides a powerful surrogate measure of antibody immunity without the need for live virus or pseudovirus formats. This and similar collaborative efforts may help to guide the need for boosters or modified vaccines addressing emerging strains and will inform the medical community’s preparedness to meet similar public threats to global health in the years ahead. 

It is important to note, as stated above that the initial marketing and commercialization of the assay will be directed only to organizations such as vaccine manufacturers, pharmaceutical companies and government organizations at the national and state/provincial level. The assay is not currently available to private individual consumers or the general public.

About ProMIS Neurosciences, Inc.

ProMIS Neurosciences, Inc. is a development stage biotechnology company focused on discovering and developing antibody therapeutics selectively targeting toxic oligomers implicated in the development and progression of neurodegenerative diseases, in particular Alzheimer’s disease (AD), amyotrophic lateral sclerosis (ALS) and Parkinson’s disease (PD). The Company’s proprietary target discovery engine is based on the use of two complementary techniques. The Company applies its thermodynamic, computational discovery platform -ProMIS and Collective Coordinates – to predict novel targets known as Disease Specific Epitopes on the molecular surface of misfolded proteins. Using this unique approach, the Company is developing novel antibody therapeutics for AD, ALS and PD.  ProMIS is headquartered in Toronto, Ontario, with offices in Cambridge, Massachusetts. ProMIS is listed on the Toronto Stock Exchange under the symbol PMN, and on the OTCQB Venture Market under the symbol ARFXF.


For further information about ProMIS Neurosciences, please consult the Company’s website at:  www.promisneurosciences.com


Follow us on Twitter

Like us on LinkedIn


For Investor Relations please contact:

Alpine Equity Advisors
Nicholas Rigopulos, President
[email protected]
Tel. 617 901-0785


The TSX has not reviewed and does not accept responsibility for the adequacy or accuracy of this release. This information release contains certain forward-looking information. Such information involves known and unknown risks, uncertainties and other factors that may cause actual results, performance or achievements to be materially different from those implied by statements herein, and therefore these statements should not be read as guarantees of future performance or results. Specifically, the Company’s effort to commercialize its COVID-19 serology assay may not succeed due to many known and unknown factors, including the emergence of competing products, lack of market acceptance for its test, the cost of production relative to the revenue generated, and/or changes in the need for COVID-19 serology tests. All forward-looking statements are based on the Company’s current beliefs as well as assumptions made by and information currently available to it as well as other factors. Readers are cautioned not to place undue reliance on these forward-looking statements, which speak only as of the date of this press release. Due to risks and uncertainties, including the risks and uncertainties identified by the Company in its public securities filings, actual events may differ materially from current expectations. The Company disclaims any intention or obligation to update or revise any forward-looking statements, whether as a result of new information, future events or otherwise.