Is the FOMC Walking a Tightrope


Image Credit: Francois de Halleux (Flickr)

The Fed is in a Box, Any of Its Options Could Create Problems


What does transitory mean? It means fleeting and temporary.  The “inflation is transitory” expectation has, over the past two months, become less probable. The last time we had economic weakness and inflation, was in the ’80s when the Fed (FOMC) found themselves needing to stimulate the economy by lowering rates while at the same time needing to stave off inflation with higher rates, back then we said, “the Fed is in a box.” Well, for those of us that have forty-plus years of economic memories, it feels like we’ve been here before.

Background

Officials at the U.S. Federal Reserve Bank are poised to begin withdrawing the liquidity in the system (economy) that was added in response to the reaction to the pandemic. Wall Street economists expect the Fed to announce a $15 billion reduction in monthly Treasury and mortgage-backed securities purchases beginning this month (November).  If $15 billion per month is withdrawn, all tapering will be out of the system by July of 2022.

The Fed has been using the “transitory” description when discussing inflation. If they continue to suggest it is temporary, the markets, stock and bond, may lose all confidence and could crumble. So the voting members may feel they have no choice but to become more hawkish at a time when U.S. economic growth is less than satisfactory.  Uncertainty as to fiscal spending plans adds another degree of difficulty for the Fed as they have incomplete information related to tax rates and government spending plans. Monetary and fiscal policy should work in conjunction with each other. Fiscal policy is up in the air. The Fed is, in a box, or boxed in. No matter what action or inaction they announce tomorrow, it will likely draw a negative (and positive) response on different fronts.

What to Listen For

On the top of Fed-watcher’s minds is whether the FOMC will continue its “transitory” description with respect to inflation.  Price increases are prevalent in everyone’s daily lives and have proved more persistent than central bankers had suggested they’d be. Fed Chairman Powell has remained consistent in his public expressions that rising prices are the result of the economy reopening and won’t be long-lived.  Investors will be listening for this same language, particularly those in more interest-sensitive sectors.  Eliminating all “transitory” language may perpetuate a bond market sell-off that could carry over into stocks.

Recent Economic Numbers

Fed watchers are beginning to have a more difficult time making the inflation-is-transitory case. They are looking at, for example,  the quarterly Employment Cost Index (ECI) released on Friday (October 29), which is the preferred wage cost measurement release of many economists. It includes full compensation costs rather than just payroll data.  The larger-than-expected rise in the third quarter ECI was the fastest pace of increase since they started measuring this almost 40 years ago. Labor costs, as a percentage of business expenses,  are often a companies’ highest expense. The ECI shows these costs are increasing rapidly as employers raise pay to attract workers. 

The labor shortage is helping to promulgate the “everything-shortage,” this scarcity of things is also providing inflationary fuel. Labor numbers will be reported this Friday when the Labor Department releases its October employment situation report.  Economists expect sporadic hiring and wages that are rising at an increased pace as millions of workers remain on the sidelines for reasons that are less understood. From a supply/demand standpoint,  if true labor-force participation is lower than Fed policymakers are accounting for, the U.S. economy is much closer to full employment than they thought and wage inflation as competition for employees continues will spiral upward. 

Against that potentiality, what if the Fed decides they can risk spooking the markets by eliminating the word “transitory” in their statement? After all, Powell recently said the Fed could accelerate the tapering process.  So it may. What is important for all investors to understand is that much of the Fed’s control over the economy is done outside of actual monetary policy and instead falls in setting expectations and providing confidence. For example, their words and promises.

Based on bond market movements, investors are already expecting that the Fed will raise rates sooner than the central bank has indicated. Economists at Goldman Sachs last week said, “We now expect core PCE inflation to remain above 3%—and core CPI inflation above 4%—when the taper concludes.” The PCE index is considered the Fed’s most worthwhile inflation gauge.

Can monetary policy impact supply shortages that have been caused by supply-chain issues? The trillions that consumers have in savings amounts to approximately 10% of GDP. The shortage problem is also being exacerbated by high demand. Monetary policy is meant to affect demand. Reducing demand by pulling cash out of the system and making money more expensive could help the supply chain catch up while slowing demand price pressures. But, this is where the Fed is in a box. Demand is already falling. Last week’s third-quarter GDP report reflected the slowest rate of growth since the pandemic inspired lockdowns.  As consumers retrenched, government spending fell, exports fell and business spending on plant and equipment declined. The increased prices are one cause of slowing consumption. It is conceivable that if rising rates and less liquidity through tapering further slows demand and price pressures decline, demand returns. This is possible, but a weak argument as consumers tend to buy when they believe products will cost more in the future.

Take-Away

For the FOMC voting members, they may feel “damned if they do, damned if they don’t,” as it relates to increased tapering and including the “transitory” language. While the future is always uncertain, market participants have eyes and can conduct their own analysis. If they lose confidence in the Fed having a steady and capable hand, they may panic. If they have confidence in the Fed’s words and actions, and those words are not pro-growth, they may also sell. This places the Fed in a box. Although the Fed’s mission isn’t market-related, severe reactions by the stock and bond markets reverberate through all sectors of the economy.

Paul Hoffman

Managing Editor, Channelchek


Suggested Reading:


Trimmed PCE Inflation vs the PCE Deflator


Inflation is No Baloney


Will Inflation be Transitory or Persistent?


Inflation’s Impact on Stocks, Four Scenarios


Sources:

https://www.ig.com/en-ch/financial-events/fomc-meeting-announcement
https://fred.stlouisfed.org/series/GDP

https://www.barrons.com/articles/federal-reserve-meeting-economic-growth-investors-51635839198?mod=hp_LEAD_1

https://www.barrons.com/articles/growth-slowdown-beyond-delta-variant-51631307629?mod=article_inline

https://www.reuters.com/business/goldman-sachs-brings-forward-us-rate-hike-projection-by-year-2021-11-01/


Stay up to date. Follow us:


Release – Seanergy Maritime Holdings Corp. Reports Record Financial Results for the Third Quarter and Nine-Month Period Ended September 30 2021


Seanergy Maritime Holdings Corp. Reports Record Financial Results for the Third Quarter and Nine-Month Period Ended September 30, 2021


Seanergy Maritime Holdings Corp. Reports Record Financial Results for the Third Quarter and NineMonth Period Ended September 30, 2021

Highlights of the Third Quarter of 2021:

  • Gross revenues: $50 million in Q3 2021, as compared to $20.4 million in Q3 2020, up 146%

  • Net Income: $20.1 million in Q3 2021, as compared to $3.6 million in Q3 2020, up 459%

  • EBITDA1: $30.1 million in Q3 2021, as compared to $12.7 million in Q3 2020, up 137%

  • Adjusted EBITDA1: $32.2 million in Q3 2021, as compared to $7.8 million in Q3 2020, up 312%

Highlights of the Nine Months ended September 30, 2021:

  • Gross revenues: $100 million in 9M 2021, as compared to $43.5 million in 9M 2020, up 130%

  • Net Income: $20.7 million in 9M 2021, as compared to a net loss of $16 million in 9M 2020

  • EBITDA1: $47.4 million in 9M 2021, as compared to $11.6 million in 9M 2020, up 307%

  • Adjusted EBITDA1: $51.4 million in 9M 2021, as compared to $7.3 million in 9M 2020, up 602%

First Nine Months of 2021 and Recent Developments:

  • Acquisition of 7 modern Japanese Capesizes and sale of our oldest vessel in 2021 to daterepresenting total investment of $193.2 million and fleet increase of 55%

  • Ten new time-charter employment agreements with world-renowned charterers

  • 100% of the fleet employed under time-charters (“T/Cs”), 88% of which at index-linked rates

  • Financing and refinancing transactions of $134.2 million

November 2, 2021 – Glyfada, Greece – Seanergy Maritime Holdings Corp. (the “Company”) (NASDAQ: SHIP), announced today its financial results for the third quarter ended September 30, 2021.

For the quarter ended September 30, 2021, the Company generated gross revenues of $50.0 million, a 146% increase compared to the third quarter of 2020. Adjusted EBITDA for the quarter was $32.2 million, from $7.8 million in the same period of 2020 . Net income for the third quarter was $20.1 million compared to net income of $3.6 million in the third quarter of 2020. The daily Time Charter Equivalent (“TCE”)1 of the fleet for the third quarter of 2021 was $30,764, marking a 90% increase compared to $16,219 for the same period of 2020.

For the nine-month period ended September 30, 2021, gross revenues were $100.0 million, increased by 130% when compared to $43.5 million in the same period of 2020. Adjusted EBITDA for the first nine months of 2021 was $51.4 million, compared to an adjusted EBITDA of $7.3 million in the same period of 2020. The daily TCE of the fleet for the first nine months of 2021 was $23,449 compared to $10,267 in the first nine months of 2020. The average daily OPEX was $5,806 compared to $5,573 in the respective period of 2020.

Cash and cash-equivalents, restricted cash, term deposits, including a short-term receivable from vessel sale proceeds as of September 30, 2021, stood at $52.6 million. The M/V Leadership was delivered to her new owners on September 30, 2021 and due to timing of payments, the gross proceeds of $13.3 million, including bunkers and other inventories, were received in the beginning of October. Shareholders’ equity at the end of the third quarter was $222.3 million, compared to $95.7 million on December 31, 2020. Long-term debt (senior and junior loans and other financial liabilities) net of deferred charges stood at $204.6 million as of September 30, 2021, from $169.8 million as of the end of 2020, representing a 20% increase. In the same period, following the addition of six of our new acquisitions and the removal of the M/V Leadership, the book value of our fleet increased by 55% to $396.8 million from $256.7 million.

Fourth Quarter 2021 TCE Guidance:

As of the date hereof, approximately 69% of the Company fleet’s expected operating days in the fourth quarter of 2021 have been fixed at an estimated TCE of approximately $38,440. Assuming that for the remaining operating days of our index-linked T/Cs, the respective vessels’ TCE will be equal to the average Forward Freight Agreement (“FFA”) rate of approximately $28,000 per day (based on the FFA curve of November 1, 2021), our estimated TCE for the fourth quarter will be approximately $35,2002. Our TCE guidance for the fourth quarter of 2021 includes certain conversions (6 vessels) of index-linked charters to fixed, which were concluded in the third quarter of 2021 as part of our freight hedging strategy. The following table provides the break-down:

Operating Days

TCE

TCE – fixed rate (index-linked conversion)

552

$31,273

TCE – fixed rate

184

$29,761

TCE – index linked unhedged

778

$39,281

Total / Average

1,514

$35,205


Stamatis Tsantanis, the Company’s Chairman & Chief Executive Officer, stated:

“I am very excited to announce our financial results for the third quarter and nine-month period that ended on September 30, 2021, marking a record profit for Seanergy since we started acquiring our current fleet in 2015. The exceptional financial performance of our Company is attributed to the combination of the well-timed acquisitions that we executed in the past year, as well as the highest dry bulk market of the last decade.

As far as our results for the third quarter of 2021 are concerned, our daily TCE was $30,764, outperforming our guidance for the quarter and marking an increase of 90% compared to the TCE of the third quarter of 2020. The TCE of the fleet for the first nine months of 2021 was $23,449 per day, increased by 128% when compared to a daily TCE of $10,267 in the same period of 2020. Our fourth quarter TCE performance to date and TCE guidance for the entire quarter is equally strong at $38,440 and $35,200 per day respectively. Adjusted EBITDA for the third quarter and first nine months of 2021 was $32.2 million and $51.4 million, respectively, as compared to an adjusted EBITDA of $7.8 million and $7.3 million in the respective periods of 2020. Net result for the quarter was a profit of $20.1 million increased by 459%, from $3.6 million in the same period of 2020. This impressive increase underscores the operating leverage of the Company and its tremendous upside potential in today’s earnings environment.

Regarding our fleet growth strategy, investment in vessel acquisitions in 2021 to date has totalled approximately $193.2 million for seven high quality Japan-built Capesize vessels with an average age of 11.1 years, with the most recent acquisition being that of the 2010-built M/V Dukeship. Within the third quarter, we took timely delivery of two Capesize vessels, while we also delivered the M/V Leadership to its new owners. The total investment has been fully funded by our strong cash reserves, as well as our new financing arrangements.

Concerning our commercial developments in 2021 to date, we have concluded ten new time-charter employment agreements with at least one-year duration, in each case with leading charterers in the Capesize sector. Following the recently agreed employment contracts for the M/Vs Dukeship and Goodship, 15 vessels will be employed on index-linked charters. This strategy has proven to be very efficient since our fleet’s earnings best reflect daily movements of the BCI and we are able to capitalize on market spikes. In most cases, the agreements entail options to convert the index-linked rate to a fixed one, based on the prevailing FFA curve, allowing us, at our option, to lock our future market exposure at profitable rates. By this, we have achieved what we believe to be the optimal positioning of our fleet for a commodities super-cycle.

On the financing front, since the beginning of 2021 we have concluded new financings and refinancings of $134.2 million while repaying $82.3 million on existing debt facilities. Since the start of the third quarter, we have agreed two new financings of approximately $30 million, while repaying $12.6 million on our existing financings. Specifically, we completed the financing of the M/V Friendship with one of our long-term lenders, while receiving a commitment letter from a major Greek Bank for a sustainability-linked loan to be secured by the M/V Worldship. Our weighted average interest rate for the first nine months of 2021 was reduced by approximately 130 basis points over the same period of 2020 and we expect this trend to continue in 2022.

With respect to our ESG initiatives, we have always been at the forefront of all major environmental regulations, and we are intensifying our efforts to meet IMO’s decarbonization targets for 2030. We have recently endorsed the Call to Action for Shipping Decarbonization, a global coalition of over 190 industry leaders and organizations representing the entire maritime value chain. In addition, we have signed agreements with DeepSea for the installation of Artificial Intelligence performance systems on our fleet and with Marsoft for the screening of selected vessels, which promotes transparency of our energy efficiency upgrades.

With a view to optimising the energy efficiency of our fleet, we have decided, in some cases in cooperation with our charterers, to install Energy Saving Devices (“ESDs”) on the entire fleet. This upgrade program will progress gradually, with the installation of the ESDs taking place during each vessel’s upcoming drydocking and is intended to ensure that the speed of our expanded fleet will not be materially impacted by the upcoming environmental regulations. Finally, we are investing in the research and development of emission reduction technologies, including biofuel blend trials, which is expected to contribute considerably to the transition to a greener shipping industry.

Regarding market conditions and future prospects, we have recently experienced the highest market levels of the last 12 years in the Capesize sector, with daily rates reaching $87,000 per day at the start of the fourth quarter. Notwithstanding the short-term correction of recent weeks, we believe that the Capesize market is supported by the most favourable demand-supply fundamentals of its recent history. More specifically, the Capesize orderbook still stands at the lowest level of the last 25 years and the upcoming environmental regulations are expected to lead to a significant vessel supply squeeze in the following years. In addition, demand for dry raw materials is supported by the global energy supply shortages, as well as the worldwide stimuli and infrastructure projects.

On that basis, we feel confident about the prospects of the Capesize market for years to come.”

Company Fleet following M/V Dukeship delivery:

Vessel Name

Vessel Class

Capacity (DWT)

Year Built

Yard

Scrubber Fitted

Employment Type

FFA conversion option(19)

Earliest T/C expiration

Patriotship

Capesize

181,709

2010

Imabari

Yes

T/C – fixed rate(1)

06/2022

Worldship

Capesize

181,415

2012

Koyo – Imabari

Yes

T/C – fixed rate(2)

09/2022

Hellasship

Capesize

181,325

2012

Imabari

T/C Index Linked(3)

04/2022

Fellowship

Capesize

179,701

2010

Daewoo

T/C Index Linked(4)

Yes

06/2022

Championship

Capesize

179,238

2011

Sungdong SB

Yes

T/C Index Linked(5)

Yes

11/2023

Partnership

Capesize

179,213

2012

Hyundai

Yes

T/C Index Linked(6)

Yes

06/2022

Knightship

Capesize

178,978

2010

Hyundai

Yes

T/C Index Linked(7)

05/2023

Lordship

Capesize

178,838

2010

Hyundai

Yes

T/C Index Linked(8)

Yes

05/2022

Goodship

Capesize

177,536

2005

Mitsui

T/C Index Linked(9)

Yes

08/2022

Friendship

Capesize

176,952

2009

Namura

T/C Index Linked(10)

12/2022

Tradership

Capesize

176,925

2006

Namura

T/C Index Linked(11)

Yes

05/2022

Flagship

Capesize

176,387

2013

Mitsui

T/C Index Linked(12)

Yes

05/2026

Gloriuship

Capesize

171,314

2004

Hyundai

T/C Index Linked(13)

Yes

01/2022

Geniuship

Capesize

170,057

2010

Sungdong SB

T/C Index Linked(14)

Yes

02/2022

Premiership

Capesize

170,024

2010

Sungdong SB

Yes

T/C Index Linked(15)

11/2022

Squireship

Capesize

170,018

2010

Sungdong SB

Yes

T/C Index Linked(16)

12/2022

Dukeship(17)

Capesize

181,453

2010

Japanese yard

T/C Index Linked(18)

Yes

12/2022

Total / Average age

3,011,083

11.7

(1) Chartered by a European cargo operator and delivered to the charterer on June 7, 2021 for a period of about 12 to about 18 months. The daily charter hire is fixed at $31,000.

(2) Chartered by a U.S. commodity trading company and delivered to the charterer on September 2, 2021 for a period of about 12 to about 16 months. The daily charter hire is fixed at $31,750.

(3) Chartered by NYK Line and delivered to the charterer on May 10, 2021 for a period of minimum 11 to maximum 15 months. The daily charter hire is based on the BCI.

(4) Chartered by Anglo American, a leading global mining company, and delivered to the charterer in June 2021 for a period of minimum 12 to about 15 months from the delivery date. The daily charter hire is based on the BCI.

(5) Chartered by Cargill and delivered to the charterer on November 7, 2018 for a period of employment of 60 months, with an additional period of about 24 to about 27 months at the charterer’s option. The daily charter hire is based on the BCI plus a net daily scrubber premium of $1,740.

(6) Chartered by a major European utility and energy company and delivered to the charterer on September 11, 2019 for a period of minimum 33 to maximum 37 months with an optional period of about 11 to maximum 13 months. The daily charter hire is based on the BCI.

(7) Chartered by Glencore and delivered to the charterer on May 15, 2020 for a period of about 36 to about 42 months with two optional periods of 11 to 13 months. The daily charter hire is based on the BCI.

(8) Chartered by a major European utility and energy company and delivered on August 4, 2019 for a period of minimum 33 to maximum 37 months with an optional period of about 11 to maximum 13 months. The daily charter hire is based on the BCI plus a net daily scrubber premium of $3,735 until May 2021.

(9) Chartered by an International commodities trader and will be delivered to the charterer by November 10, 2021 for a period of about 9 to about 12 months. The daily charter hire is based on the BCI.

(10) Chartered by NYK Line and was delivered to the charterer on July 29, 2021 for a period of minimum 17 to maximum 24 months. The daily charter hire is based on the BCI.

(11) Chartered by a major South Korean industrial company and was delivered to the charterer on June 15, 2021 for a period employment of minimum 11 to about 15 months. The daily charter hire is based on the BCI.

(12) Chartered by Cargill. The vessel was delivered to the charterer on May 10, 2021 for a period of 60 months. The daily charter hire is based at a premium over the BCI minus $1,325 per day.

(13) Chartered by Pacbulk Shipping and delivered to the charterer on April 23, 2020 initially for a period of about 4 to about 7 months, then for a further time charter period of about 10 to about 14 months. Upon expiration of the previous T/C period, in June 2021, the vessel commenced the second extension period up to minimum January 1, 2022 to maximum April 30, 2022. The daily charter hire is based on the BCI.

(14) Chartered by Pacbulk Shipping and delivered to the charterer on March 22, 2021 for a period of about 11 to about 14 months from the delivery date. The daily charter hire is based on the BCI.

(15) Chartered by Glencore and delivered to the charterer on November 29, 2019 for a period of minimum 36 to maximum 42 months with two optional periods of minimum 11 to maximum 13 months. The daily charter hire is based on the BCI plus a net daily scrubber premium of $2,055.

(16) Chartered by Glencore and delivered to the charterer on December 19, 2019 for a period of minimum 36 to maximum 42 months with two optional periods of minimum 11 to maximum 13 months. The daily charter hire is based on the BCI plus a net daily scrubber premium of $2,055.

(17) Expected delivery within November 2021.

(18) Chartered by NYK Line and will be delivered to the charterer upon its delivery to the Company for a period of about 13 to about 18 months. The daily charter hire is based on the BCI.

(19) The Company has the option to convert the index-linked rate to a fixed one for a period ranging between 2 and 12 months, based on the prevailing Capesize FFA Rate for the selected period.

Fleet Data:

(U.S. Dollars in thousands)

Q3 2021

Q3 2020

9M 2021

9M 2020

Ownership days (1)

1,477

975

3,632

2,795

Operating days (2)

1,439

973

3,494

2,737

Fleet utilization (3)

97.4%

99.8%

96.2%

97.9%

TCE rate (4)

$30,764

$16,219

$23,449

$10,267

Daily Vessel Operating Expenses (5)

$5,865

$5,984

$5,806

$5,573

(1) Ownership days are the total number of calendar days in a period during which the vessels in a fleet have been owned or chartered in. Ownership days are an indicator of the size of the Company’s fleet over a period and affect both the amount of revenues and the amount of expenses that the Company recorded during a period.

(2) Operating days are the number of available days in a period less the aggregate number of days that the vessels are off-hire due to unforeseen circumstances. Operating days includes the days that our vessels are in ballast voyages without having finalized agreements for their next employment.

(3) Fleet utilization is the percentage of time that the vessels are generating revenue and is determined by dividing operating days by ownership days for the relevant period.

(4) TCE rate is defined as the Company’s net revenue less voyage expenses during a period divided by the number of the Company’s operating days during the period. Voyage expenses include port charges, bunker (fuel oil and diesel oil) expenses, canal charges and other commissions. The Company includes the TCE rate, a non-GAAP measure, as it believes it provides additional meaningful information in conjunction with net revenues from vessels, the most directly comparable U.S. GAAP measure, and because it assists the Company’s management in making decisions regarding the deployment and use of the Company’s vessels and in evaluating their financial performance. The Company’s calculation of TCE rate may not be comparable to that reported by other companies. The following table reconciles the Company’s net revenues from vessels to the TCE rate.

(In thousands of U.S. Dollars, except operating days and TCE rate)

Q3 2021

Q3 2020

9M 2021

9M 2020

Net revenues from vessels

48,179

19,651

96,409

42,032

Less: Voyage expenses

3,910

3,870

14,477

13,930

Net operating revenues

44,269

15,781

81,932

28,102

Operating days

1,439

973

3,494

2,737

TCE rate

$30,764

$16,219

$23,449

$10,267

(5) Vessel operating expenses include crew costs, provisions, deck and engine stores, lubricants, insurance, maintenance and repairs. Daily Vessel Operating Expenses are calculated by dividing vessel operating expenses by ownership days for the relevant time periods. The Company’s calculation of daily vessel operating expenses may not be comparable to that reported by other companies. The following table reconciles the Company’s vessel operating expenses to daily vessel operating expenses.

(In thousands of U.S. Dollars, except ownership days and Daily Vessel Operating Expenses)

Q3 2021

Q3 2020

9M 2021

9M 2020

Vessel operating expenses

10,042

6,399

24,470

16,141

Less: Pre-delivery expenses

1,379

565

3,381

565

Vessel operating expenses before pre-delivery expenses

8,663

5,834

21,089

15,576

Ownership days

1,477

975

3,632

2,795

Daily Vessel Operating Expenses

$5,865

$5,984

$5,806

$5,573

Net Income / (Loss) to EBITDA and Adjusted EBITDA Reconciliation:

(In thousands of U.S. Dollars)

Q3 2021

Q3 2020

9M 2021

9M 2020

Net income/(loss)

20,064

3,592

20,704

(16,037)

Add: Net interest and finance cost

4,560

5,296

12,867

16,540

Add: Depreciation and amortization

5,490

3,835

13,827

11,143

EBITDA

30,114

12,723

47,398

11,646

Add: stock based compensation

2,773

236

4,704

825

Less: Gain on sale of vessel

(716)

(716)

Less: Gain on debt refinancing

(5,150)

(5,150)

Adjusted EBITDA

32,171

7,809

51,386

7,321

Earnings Before Interest, Taxes, Depreciation and Amortization (“EBITDA”) represents the sum of net income / (loss), interest and finance costs, interest income, depreciation and amortization and, if any, income taxes during a period. EBITDA is not a recognized measurement under U.S. GAAP. Adjusted EBITDA represents EBITDA adjusted to exclude stock-based compensation and the non-recurring gain on sale of vessel and gain on debt refinancing, which the Company believes are not indicative of the ongoing performance of its core operations.

EBITDA and adjusted EBITDA are presented as we believe that these measures are useful to investors as a widely used means of evaluating operating profitability. EBITDA and adjusted EBITDA as presented here may not be comparable to similarly titled measures presented by other companies. These non-GAAP measures should not be considered in isolation from, as a substitute for, or superior to, financial measures prepared in accordance with U.S. GAAP.

Interest and Finance Costs to Cash Interest and Finance Costs Reconciliation:

(In thousands of U.S. Dollars)

Q3 2021

Q3 2020

9M 2021

9M 2020

Interest and finance costs, net

(4,560)

(5,296)

(12,867)

(16,540)

Add: Amortization of deferred finance charges

739

189

2,441

538

Add: Amortization of convertible note beneficial conversion feature

772

1,457

2,010

3,873

Add: Amortization of other deferred charges (shares issued to third party)

77

129

251

430

Cash interest and finance costs

(2,972)

(3,521)

(8,165)

(11,699)

Third Quarter and Recent Developments:

Fleet Updates

M/V Friendship

In July 2021, the Company took delivery of the 176,952 dwt Capesize bulk carrier, built in 2009 in Japan, which was renamed M/V Friendship. The vessel has been fixed on a T/C with NYK Line, a leading Japanese charterer, with earliest redelivery to the Company in December 2022. The gross daily rate of the T/C is based on 102% of the BCI.

M/V Worldship

In August 2021, the Company took delivery of the 181,415 dwt Capesize bulk carrier, built in 2012 in Japan, which was renamed M/V Worldship. The M/V Worldship has been fixed on a T/C with a world-leading U.S. commodity trading company, at a gross daily rate of $31,750 with earliest redelivery to the Company in September 2022.

M/V Leadership

In June 2021, the Company agreed to sell the 2001-built M/V Leadership to an unaffiliated party for a net sale price of approximately $12.0 million. The vessel was delivered to her new owners on September 30, 2021. The sale improved the average age of the Company’s fleet.

M/V Dukeship

In October 2021, the Company agreed to acquire the 181,453 dwt Capesize bulk carrier, built in 2010 in Japan, which will be renamed M/V Dukeship. The purchase price of $34.3 million is expected to be funded with cash on hand. The M/V Dukeship is expected to be delivered within November 2021.

Commercial Updates

M/V Dukeship

The M/V Dukeship has been chartered to NYK at a rate linked to the BCI, for a period of about 13 to about 18 months starting as of the vessel’s delivery to the Company. In addition, the Company has the option to convert to a fixed rate based on the prevailing Capesize FFA for the selected period.

M/V Goodship

The M/V Goodship has been chartered to an international commodities trader and will be delivered to the charterer within November 2021 for a period of about 9 to about 12 months. The daily charter hire is based on the BCI. In addition, the Company has the option to convert to a fixed rate based on the prevailing Capesize FFA for the selected period

Financing Updates

Alpha Bank S.A.

On August 9, 2021, the Company entered into a $44.12 million credit facility to (i) refinance the previous facility of $31.12 million secured by the M/V Squireship and the M/V Lordship (“Tranche A”) and (ii) finance the acquisition of the 2009-built Capesize M/V Friendship (“Tranche B”). Tranche A has the same terms as the previous loan facility. The interest rate for Tranche B is LIBOR plus 3.25% per annum, and the term is four years. Tranche B is repayable through 4 quarterly instalments of $0.7 million followed by 12 quarterly instalments of $0.38 million and a balloon of $5.7 million payable together with the last instalment.

Commitment Letter – M/V Worldship

In October 2021, the Company obtained a commitment letter from a leading Greek bank for a sustainability- linked loan facility to finance part of the acquisition cost of the M/V Worldship. Pursuant to the commitment letter, the sustainability-linked loan will be for an amount of $16.85 million with a five-year term. The principal will be repaid through 4 quarterly instalments of $1.0 million, 2 quarterly instalments of $0.75 million, 14 quarterly instalments of $0.38 million and a final balloon payment of $6.1 million payable at maturity. The loan will be secured by, among other things, a mortgage on the M/V Worldship and a corporate guarantee by the Company. The interest rate will be 3.05% plus LIBOR per annum, which can be further improved based on certain emission reduction thresholds. The approval is subject to definitive documentation, which the Company expects to be completed within November 2021.

Update on Number of Shares Outstanding

As of November 1, 2021, the Company has 174,688,240 shares of common stock issued and outstanding. This includes 3,000,000 shares issued in October 2021 to Jelco Delta Holding Corp. (“Jelco”) following the conversion of $3,600,000 of the principal amount of the convertible note issued to Jelco on March 12, 2015, as amended to date, at the conversion price of $1.20 per share. As a result, the principal amount of the note was reduced from $3,800,000 to $200,000.

Seanergy Maritime Holdings Corp.

Unaudited Condensed Consolidated Balance Sheets
(In thousands of U.S. Dollars)

September 30,
2021

December 31, 2020*

ASSETS

Cash and cash equivalents, restricted cash, term deposits and short-term receivable from vessel sale proceeds

52,560

23,651

Vessels, net

396,792

256,737

Other assets

15,705

14,857

TOTAL ASSETS

465,057

295,245

LIABILITIES AND STOCKHOLDERS’ EQUITY

Long-term debt and other financial liabilities

204,639

169,762

Convertible notes

17,235

14,516

Other liabilities

20,932

15,273

Stockholders’ equity

222,251

95,694

TOTAL LIABILITIES AND STOCKHOLDERS’ EQUITY

465,057

295,245

* Derived from the audited consolidated financial statements as of the period as of that date

Seanergy Maritime Holdings Corp.
Unaudited Condensed Consolidated Statements of Operations
(In thousands of U.S. Dollars, except for share and per share data, unless otherwise stated)

Three months ended
September 30,

Nine months ended
September 30,

2021

2020

2021

2020

Revenues:

Vessel revenues

50,020

20,352

100,043

43,500

Commissions

(1,841

)

(701

)

(3,634

)

(1,468

)

Vessel revenue, net

48,179

19,651

96,409

42,032

Expenses:

Voyage expenses

(3,910

)

(3,870

)

(14,477

)

(13,930

)

Vessel operating expenses

(10,042

)

(6,399

)

(24,470

)

(16,141

)

Management fees

(400

)

(270

)

(1,029

)

(773

)

General and administrative expenses

(4,419

)

(1,537

)

(9,715

)

(4,682

)

Depreciation and amortization

(5,490

)

(3,835

)

(13,827

)

(11,143

)

Gain on sale of vessel

716

716

Operating income/(loss)

24,634

3,740

33,607

(4,637

)

Other expenses:

Interest and finance costs, net

(4,560

)

(5,296

)

(12,867

)

(16,540

)

Gain on debt refinancing

5,150

5,150

Other, net

(10

)

(2

)

(36

)

(10

)

Total other expenses, net:

(4,570

)

(148

)

(12,903

)

(11,400

)

Net income/(loss)

20,064

3,592

20,704

(16,037

)

Net income/(loss) per common share, basic

0.12

0.08

0.14

(0.57

)

Weighted average number of common shares outstanding, basic

166,710,006

46,144,608

147,403,541

28,118,984

Net income/(loss) per common share, diluted

0.10

0.04

0.13

(0.57

)

Weighted average number of common shares outstanding, diluted

205,974,543

89,041,036

186,370,709

28,118,984

About Seanergy Maritime Holdings Corp.

Seanergy Maritime Holdings Corp. is the only pure-play Capesize ship-owner publicly listed in the US. Seanergy provides marine dry bulk transportation services through a modern fleet of Capesize vessels. On a ‘fully-delivered’ basis, the Company’s fleet will consist of 17 Capesize vessels with an average age of 11.7 years and aggregate cargo carrying capacity of 3,011,083 dwt.

The Company is incorporated in the Marshall Islands and has executive offices in Glyfada, Greece. The Company’s common shares trade on the Nasdaq Capital Market under the symbol “SHIP”, its Class A warrants under “SHIPW” and its Class B warrants under “SHIPZ”.

Please visit our company website at: www.seanergymaritime.com.

Forward-Looking Statements

This press release contains forward-looking statements (as defined in Section 27A of the Securities Act of 1933, as amended, and Section 21E of the Securities Exchange Act of 1934, as amended) concerning future events. Words such as “may”, “should”, “expects”, “intends”, “plans”, “believes”, “anticipates”, “hopes”, “estimates” and variations of such words and similar expressions are intended to identify forward-looking statements. These statements involve known and unknown risks and are based upon a number of assumptions and estimates, which are inherently subject to significant uncertainties and contingencies, many of which are beyond the control of the Company. Actual results may differ materially from those expressed or implied by such forward-looking statements. Factors that could cause actual results to differ materially include, but are not limited to, the Company’s operating or financial results; the Company’s liquidity, including its ability to service its indebtedness; competitive factors in the market in which the Company operates; shipping industry trends, including charter rates, vessel values and factors affecting vessel supply and demand; future, pending or recent acquisitions and dispositions, business strategy, areas of possible expansion or contraction, and expected capital spending or operating expenses; risks associated with operations outside the United States; risks associated with the length and severity of the ongoing novel coronavirus (COVID-19) outbreak, including its effects on demand for dry bulk products and the transportation thereof; and other factors listed from time to time in the Company’s filings with the SEC, including its most recent annual report on Form 20-F. The Company’s filings can be obtained free of charge on the SEC’s website at www.sec.gov. Except to the extent required by law, the Company expressly disclaims any obligations or undertaking to release publicly any updates or revisions to any forward-looking statements contained herein to reflect any change in the Company’s expectations with respect thereto or any change in events, conditions or circumstances on which any statement is based.

For further information please contact:

Seanergy Investor Relations
Tel: +30 213 0181 522
E-mail: ir@seanergy.gr

Capital Link, Inc.
Paul Lampoutis
230 Park Avenue Suite 1536
New York, NY 10169
Tel: (212) 661-7566
E-mail: seanergy@capitallink.com

1 EBITDA and TCE rate are non-GAAP measures. Please see the reconciliation below of EBITDA to net income and TCE rate to net revenues from vessels, in each case the most directly comparable U.S. GAAP measure.
2 This guidance is based on certain assumptions and there can be no assurance that these TCE estimates, or projected utilization will be realized. TCE estimates include certain floating (index) to fixed rate conversions concluded in previous periods. For vessels on index-linked T/Cs, the TCE realized will vary with the underlying index, and for the purposes of this guidance, the TCE assumed for the remaining operating days of an index-linked T/C is equal to the average FFA rate of $28,000 per day for November and December 2021 as of November1, 2021. Spot estimates are provided using the load-to-discharge method of accounting. Load-to-discharge accounting recognizes revenues over fewer days as opposed to the discharge-to-discharge method of accounting used prior to 2018, resulting in higher rates for these days and only voyage expenses being recorded in the ballast days. Over the duration of the voyage (discharge-to-discharge) there is no difference in the total revenues and costs to be recognized. The rates quoted are for days currently contracted. Increased ballast days at the end of the quarter will reduce the additional revenues that can be booked based on the accounting cut-offs and therefore the resulting TCE will be reduced accordingly.

Comtech (CMTL) – Acacia Research Offers to Buy Comtech for $30 Share

Tuesday, November 02, 2021

Comtech (CMTL)
Acacia Research Offers to Buy Comtech for $30/Share

Comtech Telecommunications Corp. engages in the design, development, production, and marketing of products, systems, and services for advanced communications solutions in the United States and internationally. It operates in three segments: Telecommunications Transmission, Mobile Data Communications, and RF Microwave Amplifiers. The Telecommunications Transmission segment provides satellite earth station equipment and systems, over-the-horizon microwave systems, and forward error correction technology, which are used in various commercial and government applications, including backhaul of wireless and cellular traffic, broadcasting (including HDTV), IP-based communications traffic, long distance telephony, and secure defense applications. The Mobile Data Communications segment provides mobile satellite transceivers, and computers and satellite earth station network gateways and associated installation, training, and maintenance services; supplies and operates satellite packet data networks, including arranging and providing satellite capacity; and offers microsatellites and related components. The RF Microwave Amplifiers segment designs, develops, manufactures, and markets satellite earth station traveling wave tube amplifiers (TWTA) and broadband amplifiers. Its amplifiers are used in broadcast and broadband satellite communication; defense applications, such as telecommunications systems and electronic warfare systems; and commercial applications comprising oncology treatment systems, as well as to amplify signals carrying voice, video, or data for air-to-satellite-to-ground communications. The company serves satellite systems integrators, wireless and other communication service providers, broadcasters, defense contractors, military, governments, and oil companies. Comtech markets its products through independent representatives and value-added resellers. The company was founded in 1967 and is headquartered in Melville, New York.

Joe Gomes, Senior Research Analyst, Noble Capital Markets, Inc.

Joshua Zoepfel, Research Associate, Noble Capital Markets, Inc.

Refer to the full report for the price target, fundamental analysis, and rating.

    Acquisition Offer. Yesterday, Acacia Research (NASDAQ:ACTG) made an unsolicited and nonbinding offer to acquire Comtech for $790 million in cash, or $30 per share. The offer price is a 39% premium to Comtech’s closing share price on Friday. CMTL shares jumped 26% to close at $27.20 on the news. Comtech’s Board is evaluating the proposal in consultation with independent advisors.
    Who Is Acacia? Historically, Acacia’s legacy business was investing in, licensing, and enforcing patented technologies.  More recently, the Company has sought to acquire undervalued businesses with a primary focus on mature technology, life sciences, industrial, and certain financial services segments, and pursue opportunities for value creation that leverage Acacia’s significant capital resources …


This research is provided by Noble Capital Markets, Inc., a FINRA and S.E.C. registered broker-dealer (B/D).

*Analyst certification and important disclosures included in the full report. NOTE: investment decisions should not be based upon the content of this research summary.  Proper due diligence is required before making any investment decision. 

Chakana Copper Corp (CHKKF)(PERU:CA) – Closing in on Soledads Initial Resource Estimate

Tuesday, November 02, 2021

Chakana Copper Corp (CHKKF)(PERU:CA)
Closing in on Soledad’s Initial Resource Estimate

Noble Capital Markets research on Chakana Copper Corp is published under ticker symbols CHKKF and PERU:CA. The price target is in USD and based on ticker symbol CHKKF. Chakana Copper Corp is a Canadian-based minerals exploration company that is currently advancing the high-grade gold-copper-silver Soledad Project located in the Ancash region of Peru, a highly favorable mining jurisdiction with supportive communities. The Soledad Project consists of high-grade gold-copper-silver mineralization hosted in tourmaline breccia pipes. A total of 33,353 metres of drilling has been completed to-date, testing nine (9) of twenty-three (23) confirmed breccia pipes with more than 92 total targets. Chakana’s investors are uniquely positioned as the Soledad Project provides exposure to several metals including copper, gold, and silver.

Mark Reichman, Senior Research Analyst of Natural Resources, Noble Capital Markets, Inc.

Refer to the full report for the price target, fundamental analysis, and rating.

    Huancarama drill results. Chakana Copper released results from twelve resource definition holes drilled in Huancarama. The Huancarama breccia pipe is in the central part of Soledad and is one of six breccia pipes that will be included in the initial resource estimate which is expected to be completed in December. All holes intersected significant mineralization. Results are pending for thirteen additional holes associated with the resource definition drill program.

    Huancarama is unique.  Huancarama is part of a breccia complex with six outcropping breccias over a distance of 200 meters east-to-west. The resource drilling has focused on the east side of the breccia complex where two breccia pipes coalesce into one larger pipe with significant grades of copper, gold, and silver. Based on the outstanding results for holes drilled to a depth of about 300 meters …


This Company Sponsored Research is provided by Noble Capital Markets, Inc., a FINRA and S.E.C. registered broker-dealer (B/D).

*Analyst certification and important disclosures included in the full report. NOTE: investment decisions should not be based upon the content of this research summary.  Proper due diligence is required before making any investment decision. 

QuickChek – November 1, 2021


PDS Biotech Announces Agreement with University of Georgia to License Novel Proteins for Versamune-based Universal Flu Vaccine

PDS Biotechnology announced an agreement to license COBRA (Computationally Optimized Broadly Reactive Antigen) antigens from the University of Georgia

Research, News & Market Data on PDS Biotech

Watch recent presentation from PDS Biotech


Chakana Reports 113m of 0.90 g/t Gold, 0.92% Copper and 72.8 g/t Silver (2.13% Cu-Eq) in Huancarama at Soledad, Peru

Chakana Copper announced results from twelve resource definition holes drilled in Huancarama totaling 2,974.85m at the Soledad project, Ancash, Peru

Research, News & Market Data on Chakana Copper

Watch recent presentation from Chakana Copper


Helius Medical Technologies, Inc. to Release Third Quarter 2021 Financial Results on November 10, 2021

Helius Medical Technologies announced that the Company will release its third quarter 2021 financial results on Wednesday, November 10, 2021, after the market closes

Research, News & Market Data on Helius Medical

Watch recent presentation from Helius Medical


Comtech Confirms Receipt of Unsolicited Proposal

Comtech Telecommunications confirmed receipt of an unsolicited, non-binding proposal from Acacia Research Corporation (NASDAQ: ACTG)

Research, News & Market Data on Comtech

Watch recent presentation from Comtech


Cocrystal Pharma Submits Pre-Investigational New Drug Briefing Package to the FDA for Clinical Development Guidance of CDI-45205 for COVID-19 Treatment

Cocrystal Pharma announced the submission of a pre-Investigational New Drug briefing package to the U.S. Food and Drug Administration (FDA) for its broad-spectrum protease inhibitor CDI-45205 for the treatment of patients with COVID-19

Research, News & Market Data on Cocrystal Pharma

Watch recent presentation from Cocrystal Pharma


Energy Fuels Announces Q3-2021 Results, Including Robust Balance Sheet, Market-Leading U.S. Uranium Position & Commercial Rare Earth Production

Energy Fuels reported its financial results for the quarter ended September 30, 2021

Research, News & Market Data on Energy Fuels

Watch recent presentation from Energy Fuels


Capstone Green Energy (NASDAQ:CGRN) To Power Groundbreaking Tire Recycling Plant in Scotland

Capstone Green Energy announced that SCE Energy (scengy.com), Capstone’s exclusive distributor in Scotland and Northern United Kingdom, secured an order for four C1000 Signature Series microturbines for a groundbreaking tire recycling plant in Scotland

Research, News & Market Data on Capstone Green Energy

Watch recent presentation from Capstone Green Energy


Stay up to date. Follow us:


Release – Chakana Reports 113m of 0.90 gt Gold 0.92 Copper and 72.8 gt Silver (2.13 Cu-Eq) in Huancarama at Soledad Peru


Chakana Reports 113m of 0.90 g/t Gold, 0.92% Copper and 72.8 g/t Silver (2.13% Cu-Eq) in Huancarama at Soledad, Peru


Soledad Project Highlights Include:

  • 12 new resource definition holes at Huancarama reported, totalling 2,974.85m
  • Additional resource definition drill results pending for Breccia Pipe 5 “(Bx 5)” and Huancarama
  • Gradient-array induced-polarization (IP) geophysical survey completed over entire mineral system
  • Off-set IP surveys underway over high priority targets defined by gradient array and other data sets

Vancouver, British Columbia–(Newsfile Corp. – November 1, 2021) – Chakana Copper Corp. (TSXV: PERU) (OTCQB: CHKKF) (FSE: 1ZX) (the Company or Chakana“), is pleased to provide results from twelve resource definition holes drilled in Huancarama totaling 2,974.85m at the Soledad project, Ancash, Peru (see table below). The resource drilling is part of a fully funded 26,000m exploration and resource drilling program planned for 2021 (Fig. 1). These results compliment previous results from Huancarama and will increase confidence in the initial resource estimate covering six breccia pipes, which is anticipated to be completed by the end of 2021.

“Results for the resource definition drilling at Huancarama have been outstanding thus far. This is a large breccia pipe that is part of a much larger breccia complex. The resource drilling has focused on the east side of the breccia complex where two breccia pipes coalesce into one larger pipe with excellent grades for copper, gold, and silver. We have additional resource definition drill results to release for Bx 5 and Huancarama as we close in on the first resource ever for this new discovery,” stated President and CEO David Kelley.

Drill Results

Huancarama (Resource Definition)

DDH # From – To (m) Core Length (m) Au
g/t
Ag
g/t
Cu % Cu-eq
%*
Au-eq g/t*
SDH21-228 89.75 141.00 51.25 0.25 34.4 0.27 0.73 1.11
and 170.00 222.00 52.00 0.40 50.6 1.14 1.83 2.81
SDH21-230 90.00 93.25 3.25 1.53 285.2 5.75 9.19 14.06
and 125.00 200.00 75.00 0.56 44.3 0.34 1.08 1.66
and 219.00 221.00 2.00 2.94 132.6 1.07 4.13 6.31
SDH21-232 114.20 242.00 127.80 0.55 65.1 0.48 1.40 2.14
SDH21-237 123.00 236.00 113.00 0.90 72.8 0.92 2.13 3.26
SDH21-242 146.00 210.00 64.00 0.50 41.3 0.63 1.31 2.00
SDH21-245 152.00 217.00 65.00 0.31 40.7 0.70 1.25 1.91
SDH21-246 153.00 218.00 65.00 0.29 27.4 0.58 1.00 1.54
SDH21-247 170.35 199.00 28.65 0.45 68.3 0.86 1.74 2.66
and 283.00 323.15 40.15 0.22 30.0 0.67 1.07 1.64
SDH21-248 146.00 184.00 38.00 0.77 56.2 1.03 2.01 3.08
and 229.15 241.00 11.85 1.06 37.9 0.10 1.71
SDH21-249 53.60 128.55 74.95 0.32 82.4 0.42 1.33 2.04
SDH21-250 45.00 133.00 88.00 0.31 66.5 0.86 1.63 2.50
SDH21-251 85.00 221.00 136.00 0.29 26.6 0.30 0.72 1.10


* Cu_eq and Au_eq values were calculated using copper, gold, and silver. Metal prices utilized for the calculations are Cu – US$2.90/lb, Au – US$1,300/oz, and Ag – US$17/oz. No adjustments were made for recovery as the project is an early-stage exploration project and metallurgical data to allow for estimation of recoveries are not yet available. The formulas utilized to calculate equivalent values are Cu-eq (%) = Cu% + (Au g/t * 0.6556) + (Ag g/t * 0.00857) and Au-eq (g/t) = Au g/t + (Cu% * 1.5296) + (Ag g/t * 0.01307).

Huancarama

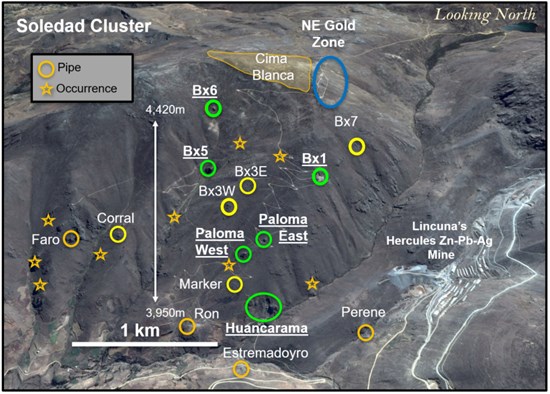
The Huancarama breccia pipe is in the central part of the project at an elevation of 3,950m and is one of six breccia pipes that will be included in our initial resource estimate (Fig. 1). The breccia pipe is part of a breccia complex with six outcropping breccias over a lateral distance of 200m east-west. Two of the breccias, separated by 50m at surface, coalesce at depth, forming a large breccia pipe approximately 100m x 60m in plan. Breccia has been intercepted to a depth of 492m below surface and remains open.

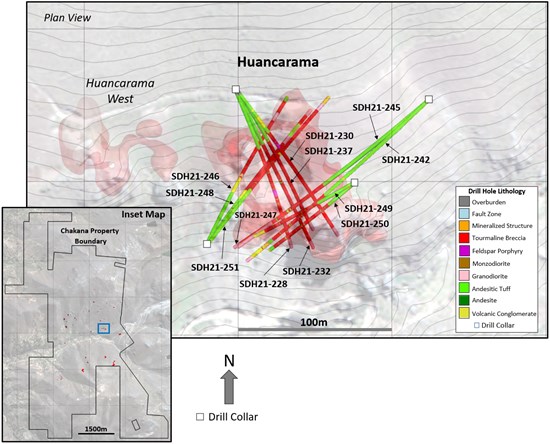
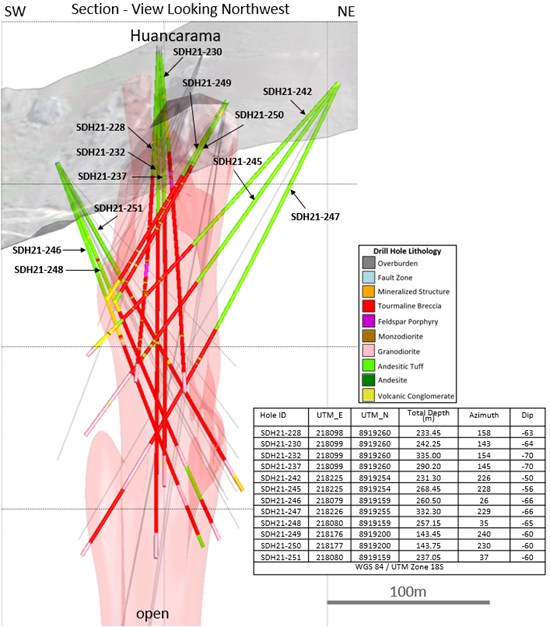
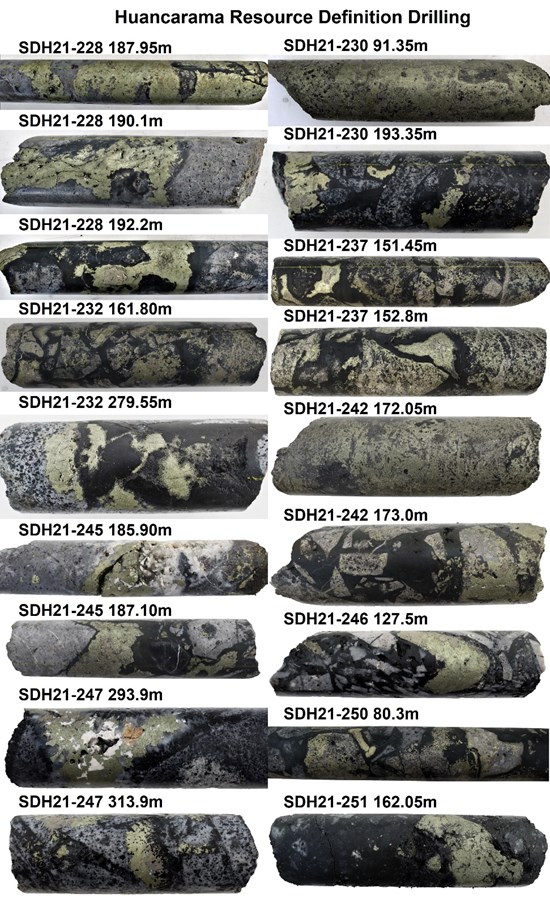
Drill holes described in this release were drilled from four different platforms and were designed to confirm the geometry and continuity of mineralization within the breccia pipe (Figs. 2 and 3). All holes intersected significant mineralization (see Figure 4 for select core photos of the mineralization). Thirteen additional holes have been drilled as part of the resource definition program; results for these holes are pending.

2021 Resource and Exploration Drill Program

A total of 23,947m (incorrectly reported in previous release) of drilling has been completed in 2021. The objectives of this drill program are to complete resource definition drilling on six initial breccia pipes to an approximate depth of 300m and test several new exploration targets. Breccia pipes that will be included in the initial resource estimate are: Bx 1, Bx 5, Bx 6, Paloma East, Paloma West, and Huancarama (Fig. 1). Additional resource definition drill results for Bx 5 and Huancarama are pending. During 2021 our drilling was focused on the north half of the project where drill permits are in place. Permitting for the south half of the project is well advanced. The southern half of the property hosts several outcropping mineralized tourmaline breccia pipes and has been recently covered by the Company’s ongoing geophysical program. Numerous targets exist, none of which have been drilled previously.

Geophysical Surveys

Gradient-array induced-polarization (IP) surveys have been completed over the entire 12km2 footprint of the Soledad mineral system. Off-set IP surveys are now in-progress covering high priority target areas. This work complements the extensive exploration database that supports our current inventory of 110 exploration targets. This new information identifies both new targets and prioritizes existing targets that will be tested when the exploration drilling programs resume.

About Chakana Copper

Chakana Copper Corp is a Canadian-based minerals exploration company that is currently advancing the Soledad Project located in the Ancash region of Peru, a highly favorable mining jurisdiction with supportive communities. The Soledad Project is notable for the high-grade copper-gold-silver mineralization that is hosted in tourmaline breccia pipes. A total of 60,854 metres in 261 diamond core holes for exploration and resource definition drilling have been completed since 2017, testing 16 of 110 total exploration targets, confirming that Soledad is a large, well-endowed mineral system with strong exploration upside. Chakana’s investors are uniquely positioned as the Soledad Project provides exposure to base and precious metals. For more information on the Soledad project, please visit the website at www.chakanacopper.com.

Sampling and Analytical Procedures

Chakana follows rigorous sampling and analytical protocols that meet or exceed industry standards. Core samples are stored in a secured area until transport in batches to the ALS facility in Callao, Lima, Peru. Sample batches include certified reference materials, blank, and duplicate samples that are then processed under the control of ALS. All samples are analyzed using the ME-MS41 (ICP technique that provides a comprehensive multi-element overview of the rock geochemistry), while gold is analyzed by AA24 and GRA22 when values exceed 10 g/t by AA24. Over limit silver, copper, lead and zinc are analyzed using the OG-46 procedure. Soil samples are analyzed by 4-acid (ME-MS61) and for gold by Fire Assay on a 30g sample (Au-ICP21).

Results of previous drilling and additional information concerning the Project, including a technical report prepared in accordance with National Instrument 43-101, are made available on Chakana’s SEDAR profile at www.sedar.com.

Qualified Person

David Kelley, an officer and a director of Chakana, and a Qualified Person as defined by NI 43-101, reviewed and approved the technical information in this news release.

ON BEHALF OF THE BOARD

(signed) “David Kelley
David Kelley
President and CEO

For further information contact:
Joanne Jobin, Investor Relations Officer
Phone: 647 964 0292
Email: jjobin@chakanacopper.com

Neither TSX Venture Exchange nor its Regulation Services Provider (as that term is defined in the policies of the Exchange) accepts responsibility for the adequacy or accuracy of this release.

Forward-looking Statement Advisory: This release may contain forward-looking statements. Forward-looking statements involve known and unknown risks, uncertainties, and other factors which may cause the actual results, performance, or achievements of Chakana to be materially different from any future results, performance, or achievements expressed or implied by the forward-looking statements. Forward looking statements or information relates to, among other things, the interpretation of the nature of the mineralization at the Soledad copper-gold-silver project (the “Project”), the potential to expand the mineralization, and to develop and grow a resource within the Project, the planning for further exploration work, the ability to de-risk the potential exploration targets, and our belief in the potential for mineralization within unexplored parts of the Project. These forward-looking statements are based on management’s current expectations and beliefs but given the uncertainties, assumptions and risks, readers are cautioned not to place undue reliance on such forward- looking statements or information. The Company disclaims any obligation to update, or to publicly announce, any such statements, events or developments except as required by law.

Cannot view this image? Visit: https://www.noblelinx.com/images/channelchek/image20211101-21.jpg

Figure 1 – View looking north showing outcropping breccia pipes and occurrences within the northern Soledad cluster. Pipes that will be included in the initial resource are shown in green (Bx 1, Bx 5, Bx 6, Paloma East, Paloma West, and Huancarama). Breccia pipes shown in yellow have had exploration drilling completed. Other pipes/occurrences and targets defined by other exploration data remain to be tested by drilling. Additional breccia pipes occur on the south half of the property and are not shown here.

Cannot view this image? Visit: https://www.noblelinx.com/images/channelchek/image20211101-22.jpg


Figure 2 – Map showing drill holes reported in this release and modeled breccia pipes at Huancarama (light red shape) based on all drill holes. Light gray contours are at 5m intervals. Blue rectangle in the inset map shows the area of Figure 2 within the overall Soledad property.

Cannot view this image? Visit: https://www.noblelinx.com/images/channelchek/image20211101-23.jpg


Figure 3 – 3D sectional view of Huancarama looking northwest. Light red 3D shape shows breccia pipe geometry based on all drill holes. Previous holes drilled shown in grey.


Cannot view this image? Visit: https://www.noblelinx.com/images/channelchek/image20211101-24.jpg

Figure 4 – Select core photos from Huancarama reported in this release: SDH21-228 (187.95m) semi-massive chalcopyrite-pyrite replacement of tourmaline breccia; SDH21-228 (190.1m) chalcopyrite filling open cavity in breccia; SDH21-228 (192.2m) chalcopyrite-tourmaline-cemented breccia; SDH21-230 (91.35m) massive chalcopyrite; SDH21-230 (193.35m) chalcopyrite-tourmaline-cemented breccia; SDH21-232 (161.80m) chalcopyrite-pyrite replacement of clasts; SDH21-232 (279.55m) chalcopyrite-tourmaline-cemented breccia; SDH21-237 (151.45m) chalcopyrite-tourmaline-cemented breccia and sulfide clast replacement; SDH21-237 (152.8m) chalcopyrite-tourmaline-cemented breccia and sulfide clast replacement; SDH21-242 (172.05m) semi-massive chalcopyrite-pyrite replacement breccia; SDH21-242 (173.0m) chalcopyrite replacement of clasts in mosaic breccia; SDH21-245 (185.9m) chalcopyrite-quartz cemented breccia; SDH21-245 (187.1m) chalcopyrite-tourmaline-cemented mosaic breccia; SDH21-246 (127.5m) chalcopyrite-tourmaline-cemented chaotic shingle breccia; SDH21-247 (293.9m) chalcopyrite-quartz-siderite-sphalerite filling cavity in breccia; SDH21-247 (313.9m) mosaic breccia with insipient granodiorite clast replacement by chalcopyrite; SDH21-250 (80.3m) chalcopyrite-tourmaline-cemented mosaic breccia and partial sulfide clast replacement; SDH21-251 (162.05m) mosaic breccia replaced by tourmaline-chalcopyrite. Core diameter is 6.35cm (HQ) in all instances.

Release – Helius Medical Technologies Inc. to Release Third Quarter 2021 Financial Results on November 10 2021


Helius Medical Technologies, Inc. to Release Third Quarter 2021 Financial Results on November 10, 2021


NEWTOWN, Pa., Nov. 01, 2021 (GLOBE NEWSWIRE) — Helius Medical Technologies, Inc. (NASDAQ: HSDT) (“Helius” or the “Company”), a neurotech company focused on neurological wellness, today announced that the Company will release its third quarter 2021 financial results on Wednesday, November 10, 2021, after the market closes.

Dane C. Andreeff, President and Chief Executive Officer, and Jeffrey S. Mathiesen, Chief Financial Officer, will host a conference call to discuss the results and provide a business update as follows:

Date:   Wednesday, November 10, 2021
Time:   5:00 p.m. Eastern Time
Toll free (U.S.):   (844) 348-4652
International:   (213) 358-0895
Conference ID:   9388362
Webcast:   https://edge.media-server.com/mmc/p/sbbrhapy
     

A replay of the call will be available for one week at (855) 859-2056 (U.S.) or (404) 537-3406 (international). The conference ID for the replay is 9388362. The webcast will be archived under the Newsroom section of the Company’s investor relations website.

About Helius Medical Technologies, Inc.

Helius Medical Technologies is a leading neurotech company in the medical device field focused on neurologic deficits using non-implantable platform technologies that amplify the brain’s ability to compensate and promote neuroplasticity, aiming to improve the lives of people dealing with neurologic diseases.

The Company’s first commercial product is the Portable Neuromodulation Stimulator (PoNS®). For more information, visit www.heliusmedical.com.

About the PoNS® Device and PoNS Therapy

The Portable Neuromodulation Stimulator (PoNS®) is an innovative non-surgical device, inclusive of a controller and mouthpiece, which delivers electrical stimulation to the surface of the tongue to provide treatment of gait deficit. The PoNS® device is indicated for use in the United States as a short-term treatment of gait deficit due to mild-to-moderate symptoms from multiple sclerosis (“MS”) and is to be used as an adjunct to a supervised therapeutic exercise program in patients 22 years of age and over by prescription only. It is authorized for sale in Canada as a class II, non-implantable, medical device intended as a short-term treatment (14 weeks) of gait deficit due to mild and moderate symptoms from MS, and chronic balance deficit due to mild-to-moderate traumatic brain injury (“mmTBI”) and is to be used in conjunction with physical therapy. The PoNS® is an investigational medical device in Australia (“AUS”) and is currently under premarket review by the AUS Therapeutic Goods Administration.

Investor Relations Contact:

Lisa M. Wilson, In-Site Communications, Inc.
T: 212-452-2793
E: lwilson@insitecony.com

Release – Comtech Confirms Receipt of Unsolicited Proposal


Comtech Confirms Receipt of Unsolicited Proposal


MELVILLE, N.Y.–(BUSINESS WIRE)–Nov. 1, 2021– 
November 1, 2021 
Comtech Telecommunications Corp. (NASDAQ: CMTL) today confirmed receipt of an unsolicited, non-binding proposal from 
Acacia Research Corporation (NASDAQ: ACTG).

Comtech’s Board of Directors is evaluating the proposal in consultation with independent advisors. The Board will determine the course of action that it believes is in the best interests of the Company and its stockholders. No stockholder action is required at this time.

Goldman Sachs is serving as exclusive financial advisor to 
Comtech and 
Proskauer Rose and 
Sidley Austin are serving as legal advisors.

About Comtech

Comtech Telecommunications Corp. is a leading global provider of next-generation 911 emergency systems and secure wireless communications technologies to commercial and government customers around the world. Headquartered in 
Melville, New York and with a passion for customer success, 
Comtech designs, produces and markets advanced and secure wireless solutions. For more information, please visit www.comtechtel.com.

Forward-Looking Statements

Certain information in this press release contains statements that are forward-looking in nature and involve certain significant risks and uncertainties, including about our business trajectory, future revenue and sales, acquisition strategy, and growth. Actual results could differ materially from such forward-looking information. Risks and uncertainties that could impact these forward-looking statements include: the possibility that the expected synergies and benefits from recent acquisitions will not be fully realized, or will not be realized within the anticipated time periods; the risk that the acquired businesses will not be integrated with the Company successfully; the possibility of disruption from recent acquisitions, making it more difficult to maintain business and operational relationships or retain key personnel; the risk that the Company will be unsuccessful in implementing a tactical shift in its Government Solutions segment away from bidding on large commodity service contracts and toward pursuing contracts for its niche products with higher margins; the nature and timing of receipt of, and the Company’s performance on, new or existing orders that can cause significant fluctuations in net sales and operating results; the timing and funding of government contracts; adjustments to gross profits on long-term contracts; risks associated with international sales; rapid technological change; evolving industry standards; new product announcements and enhancements; changing customer demands and or procurement strategies; changes in prevailing economic and political conditions; changes in the price of oil in global markets; changes in foreign currency exchange rates; risks associated with the Company’s legal proceedings, customer claims for indemnification, and other similar matters; risks associated with the Company’s obligations under its Credit Facility; risks associated with the Company’s large contracts; risks associated with the COVID-19 pandemic and related supply chain disruptions; and other factors described in this and the Company’s other filings with the 
Securities and Exchange Commission. We assume no obligation and do not intend to update these forward-looking statements or to conform these statements to actual results or to changes in our expectations.

Additional Information and Where to Find It

In connection with the Company’s Fiscal 2021 Annual Meeting of Stockholders (the “2021 Annual Meeting”), the Company plans to file with the 
Securities and Exchange Commission (“SEC”) and mail to the Company’s stockholders a definitive proxy statement, an accompanying BLUE proxy card and other relevant documents. The Company filed a preliminary proxy statement with the 
SEC on 
October 29, 2021. BEFORE MAKING ANY VOTING DECISION, THE COMPANY’S STOCKHOLDERS ARE URGED TO READ THE PROXY STATEMENT IN ITS ENTIRETY WHEN IT BECOMES AVAILABLE, THE ACCOMPANYING BLUE PROXY CARD AND ANY OTHER DOCUMENTS TO BE FILED WITH THE SEC IN CONNECTION WITH THE COMPANY’S 2021 ANNUAL MEETING OR INCORPORATED BY REFERENCE IN THE PROXY STATEMENT BECAUSE THEY WILL CONTAIN IMPORTANT INFORMATION ABOUT THE COMPANY’S 2021 ANNUAL MEETING AND THE PARTIES RELATED THERETO. The Company’s stockholders will be able to obtain a free copy of documents filed with the 
SEC at the SEC’s website at https://www.sec.gov or the Company’s website at https://www.comtechtel.com.

Participants in the Solicitation

The Company, its directors, and certain of its executive officers are, and certain other members of management and employees of the Company may be deemed, “participants” in the solicitation of proxies from stockholders in connection with the matters to be considered at the 2021 Annual Meeting. Information regarding the direct and indirect interests, by security holdings or otherwise, in the Company of the persons who are or may be, under the rules of the 
SEC, considered participants in the solicitation of the stockholders of the Company in connection with the Company’s 2021 Annual Meeting will be set forth in the Company’s proxy statement and other relevant documents to be filed with the 
SEC. You can find information about the Company’s executive officers and directors in the Company’s Annual Report on Form 10-K for the fiscal year ended 
July 31, 2021, the Company’s and such persons’ other filings with the 
SEC and in the Company’s definitive proxy statement in connection with the Company’s 2021 Annual Meeting when filed with the 
SEC.

Media Contact
Kekst CNC
Nicholas.Capuano@kekstcnc.com
(212) 521-4800

Investor Contact
Comtech Investor Relations
Investors@comtech.com
(631) 962-7005

Source: 
Comtech Telecommunications Corp.

Release – Cocrystal Pharma Submits Pre-Investigational New Drug Briefing Package to the FDA


Cocrystal Pharma Submits Pre-Investigational New Drug Briefing Package to the FDA for Clinical Development Guidance of CDI-45205 for COVID-19 Treatment


FDA’s response is expected to provide greater clarity and guidance on designing Phase 1 and Phase 2 clinical trials for CDI-45205

BOTHELL, Wash., Nov. 01, 2021 (GLOBE NEWSWIRE) — Cocrystal Pharma, Inc. (Nasdaq: COCP) (“Cocrystal” or the “Company”) announces the submission of a pre-Investigational New Drug (IND) briefing package to the U.S. Food and Drug Administration (FDA) for its broad-spectrum protease inhibitor CDI-45205 for the treatment of patients with COVID-19.

“The pre-IND submission is a critical step to obtain the FDA’s guidance on preclinical studies, manufacturing, toxicology, and clinical development plans for CDI-45205. We look forward to our communication with the FDA and advancing toward Phase 1 and Phase 2 clinical trials to address the unmet needs of patients and to contribute to global efforts to end this pandemic,” said Sam Lee, Ph.D., Cocrystal’s co-interim CEO and President.

“As with all of our antiviral candidates, we are exploring multiple routes of administration including oral, inhalation, and injection,” added Dr. Lee. “We anticipate that CDI-45205 is best suited for intranasal/pulmonary administration based on its novel mechanism of action and pharmacokinetic profile, with this route having the advantage of direct delivery to the respiratory system, a primary infection site for SARS-CoV-2. We are also advancing preclinical studies with our novel oral COVID-19 protease inhibitors developed using our proprietary structure-based drug discovery technology, and are very excited about potential multiple treatment options for COVID-19.”

“A number of drugs are being developed as COVID-19 treatments that were originally designed for other indications. These repurposed drugs or drug candidates are a good start for humanity, but likely not the best-in-class solution that will end the pandemic,” said James Martin, Cocrystal’s co-interim CEO and CFO. “Our drug candidates are specifically designed to target the viral replication enzymes and protease, which we believe makes it possible to develop effective treatments for COVID-19 and its variants.”

About CDI-45205

CDI-45205 is among a group of protease inhibitors obtained under an exclusive license agreement with Kansas State University Research Foundation (KSURF) in 2020. CDI-45205 and several analogs showed potent in vitro activity against the SARS-CoV-2 Delta (India/B.1.617.2), Gamma (Brazil/P.1), Alpha (United Kingdom/B.1.1.7) and Beta (South African/B.1.351) variants, surpassing the activity observed with the original Wuhan strain. CDI-45205 has also shown good bioavailability in mouse and rat pharmacokinetic studies via intraperitoneal injection, and no cytotoxicity against a variety of human cell lines. Preclinical research demonstrated a strong synergistic effect with the FDA-approved COVID-19 medicine remdesivir. Additionally, a proof-of-concept animal study demonstrated that daily injection of CDI-45205 exhibited favorable in vivo efficacy in MERS-CoV-2 infected mice.

About Cocrystal Pharma, Inc.

Cocrystal Pharma, Inc. is a clinical-stage biotechnology company discovering and developing novel antiviral therapeutics that target the replication process of coronaviruses (including SARS-CoV-2), influenza viruses, hepatitis C virus and noroviruses. Cocrystal employs unique structure-based technologies and Nobel Prize-winning expertise to create first- and best-in-class antiviral drugs. For further information about Cocrystal, please visit www.cocrystalpharma.com.

Cautionary Note Regarding Forward-Looking Statements

This press release contains forward-looking statements within the meaning of the Private Securities Litigation Reform Act of 1995, including statements regarding the FDA’s response to our recent submission for CDI-45205, the ability to develop and efficacy of potential treatments against COVID-19 and advance our product candidates into clinical trials, and our strategy with respect to clinical development. The words “believe,” “may,” “estimate,” “continue,” “anticipate,” “intend,” “should,” “plan,” “could,” “target,” “potential,” “is likely,” “will,” “expect” and similar expressions, as they relate to us, are intended to identify forward-looking statements. We have based these forward-looking statements largely on our current expectations and projections about future events. Some or all of the events anticipated by these forward-looking statements may not occur. Important factors that could cause actual results to differ from those in the forward-looking statements include, but are not limited to, the risks and uncertainties arising from the impact of the COVID-19 pandemic on the national and global economy, on our collaboration partners, CROs, CMOs, and on our Company, including manufacturing and research delays arising from raw material and test animal shortages and other supply chain disruptions, potential delays related to the FDA’s review of our submissions, receipt of regulatory approvals, the results of any future clinical trials, general risks arising from clinical trials, regulatory changes, and development of effective treatments and/or vaccines by competitors, including as part of the programs financed by the U.S. government. Further information on our risk factors is contained in our filings with the SEC, including our Annual Report on Form 10-K for the year ended December 31, 2020. Any forward-looking statement made by us herein speaks only as of the date on which it is made. Factors or events that could cause our actual results to differ may emerge from time to time, and it is not possible for us to predict all of them. We undertake no obligation to publicly update any forward-looking statement, whether as a result of new information, future developments or otherwise, except as may be required by law.

Investor Contact:
LHA Investor Relations
Jody Cain
310-691-7100
jcain@lhai.com

Source: Cocrystal Pharma, Inc.

Release – Energy Fuels Announces Q3-2021 Results


Energy Fuels Announces Q3-2021 Results, Including Robust Balance Sheet, Market-Leading U.S. Uranium Position & Commercial Rare Earth Production


Webcast on November 2, 2021

LAKEWOOD, Colo.Nov. 1, 2021 /CNW/ – Energy Fuels Inc. (NYSE American: UUUU) (TSX: EFR) (“Energy Fuels” or the “Company”) today reported its financial results for the quarter ended September 30, 2021. The Company’s quarterly report on Form 10-Q has been filed with the U.S. Securities and Exchange Commission (“SEC“) and may be viewed on the Electronic Document Gathering and Retrieval System (“EDGAR“) at www.sec.gov/edgar.shtml, on the System for Electronic Document Analysis and Retrieval (“SEDAR“) at www.sedar.com, and on the Company’s website at www.energyfuels.com. Unless noted otherwise, all dollar amounts are in U.S. dollars.

Highlights:

  • At September 30, 2021, the Company had a very robust balance sheet with $132.8 million of working capital, including $100.8 million of cash and marketable securities and $29.3 million of inventory. At current commodity prices, the Company’s product inventory has a value of $46.9 million.
  • During the quarter ended September 30, 2021, the Company incurred a net loss of $8.0 million, due primarily to increased development expenditures and other costs incurred in ramping up our mixed rare earth element (“REE“) carbonate (“RE Carbonate“) production at the White Mesa Mill in Utah (the “Mill“).
  • Between June 30, 2021 and October 15, 2021, the price of uranium rose 42%, mainly due to the entry of financial entities into the market who are buying uranium on the spot market with a stated intent to hold the inventory for the long-term.
  • With several existing uranium mines on standby and significant inventories of Company-produced, U.S.-origin uranium available for sale, the Company is actively seeking out opportunities to supply uranium to nuclear utilities under term contracts while also evaluating the potential to sell some inventory on the spot market.
  • The Company is in the process of ramping up to expected commercial-scale production of RE Carbonate in Q1-2021, and began deliveries of this intermediate REE product to a separation facility in Europe in July 2021.
  • The Company is currently in active discussions with several global suppliers of natural monazite ore to supply feed for this growing REE initiative, which has the potential to include the production of separated REE oxides in the future, subject to licensing, successful commissioning, and prevailing market conditions.
  • On October 27, 2021, the Company completed the sale of a package of non-core conventional uranium projects located in Utah and Colorado to Consolidated Uranium Inc. (“CUR”). Based on CUR’s closing share price of Cdn$2.95 on October 26, 2021, the U.S.-to-Canadian exchange rate as of closing, and assuming full performance of the stipulated deferred cash payments, the current value of this divestment is approximately $35.1 million, plus additional production payments totaling up to Cdn$5 million payable upon commencement of production from the projects in the future.
  • On July 29, 2021, the Company entered into a strategic alliance agreement with RadTran, LLC, a private technology development company, to evaluate the recovery of thorium and potentially radium from the Company’s RE Carbonate and uranium process streams for use in the production of medical isotopes for emerging targeted alpha therapy (“TAT“) cancer therapeutics.
  • On September 16 and 17, 2021, the Company hosted mining, environmental and political heavyweights at an Open House at its White Mesa Mill in Utah to showcase its uranium and REE activities. Utah Senators Mike Lee and Mitt Romney, Congressman John CurtisConstantine Karayannopoulos, CEO Neo Performance Materials, Dr. Kathryn Huff, Principal Deputy Assistant Secretary for Nuclear Energy in the U.S. Department of Energy and others, delivered remarks in person or virtually.
  • At the Open House, the Company also announced the establishment of its San Juan County Clean Energy Foundation, a fund specifically designed to contribute to the local communities, including Tribal communities, surrounding the Company’s White Mesa Mill in southeast Utah.

Mark S. Chalmers, Energy Fuels’ President and CEO, stated:

“Energy Fuels continues to make rapid progress toward positioning our White Mesa Mill as America’s “Critical Minerals Hub,” by maintaining the Mill’s key uranium and vanadium production capabilities while further diversifying our portfolio to include rare earth elements production – an exciting and strategically important move both domestically and for the Company. We also continue to watch the uranium markets closely in order to best evaluate our opportunities to capitalize on recent price increases and market improvements.

“After many years of low prices, uranium markets have recently sprung to life with significant price action. Between mid-August and mid-September, the spot price of uranium rose a staggering 66%, mainly due to significant spot purchases by financial entities who have stated their intention to hold the uranium for several years. Nuclear utilities, traders, and others have had access to plentiful uranium on the spot market for the past several years and, in many cases, depended on the spot market to meet their short- and mid-term fuel requirements and delivery commitments. These new purchasers of uranium are removing material from the spot market, thereby potentially creating a fundamental shift in the market by rapidly increasing demand. One could liken these entities to another major, new nuclear utility entering the scene and consuming large quantities of uranium, as this material is not expected to be available for sale in the foreseeable future, if ever. We believe this new dynamic could create opportunities for Energy Fuels to enter into long-term supply contracts for a portion of our production with nuclear utilities at prices, quantities and other terms that generate sufficient project cashflow, all while keeping the majority of our production leveraged to further potential increases in uranium prices.

“Earlier this year, Energy Fuels took major strides toward becoming a major player in the global rare earth element space. As I mentioned before, we are currently producing mixed rare earth carbonate from U.S.-sourced natural monazite sand at our White Mesa Mill. Because our product is ready for separation into individual rare earth oxides without further processing, we are currently producing an intermediate rare earth product in a more advanced form than any other U.S. company. We will be receiving additional shipments of natural monazite sand in Q4-2021 and throughout 2022, and we are in advanced discussions with several monazite suppliers around the world to secure a diverse supply of feed for this exciting initiative. We are also very excited about our Strategic Alliance with RadTran, which has the potential to help produce isotopes from our existing RE Carbonate and uranium process streams for use in cancer therapeutics that can improve human health and, ultimately, save lives. These two initiatives, which are complementary to our core uranium business, are examples of the unique and valuable capabilities of the White Mesa Mill.

“Our distinct competitive advantage over our peers is that we have the existing licenses and permits, longstanding experience and expertise, and unique facilities and projects in a diverse number of locations that, together, are able to recover, manage, process and dispose of radionuclide-bearing materials. This is why we are the number one uranium producer in the U.S. and why we believe we have the strong potential to become one of the lowest-cost, non-Chinese rare earth producers in the world. These unique capabilities also allow us to produce vanadium when market conditions warrant, execute our industry-leading, low-cost recycling programs, and pursue our innovative initiative with RadTran to recover thorium and radium for use in the medical isotopes needed for emerging cancer therapies. We will continue to seek new ways to leverage our unique capabilities with the ultimate goals of generating substantial free cashflow and creating shareholder value.”

Webcast at 4:00 pm ET on November 2, 2021:

Energy Fuels will be hosting a video webcast on November 2, 2021 at 4:00 pm ET (2:00 pm MT) to discuss its Q3-2021 financial results, uranium strategy, rare earth production and other corporate initiatives. To join the webcast and access the presentation and viewer-controlled webcast slides, please click on the link below:

Webcast Link

If you would like to participate in the webcast and ask questions, please dial in to 1-888-664-6392 (toll free in the U.S. and Canada).

A link to a recorded version of the proceedings will be available on the Company’s website shortly after the webcast by calling 1-888-390-0541 (toll free in the U.S. and Canada) and by entering the code 036877#. The recording will be available until November 16, 2021.

Selected Summary Financial Information:

$000’s, except per share data

Nine months ended
September 30, 2021

Nine months ended
September 30, 2020


Total revenues

$                   1,524

$                   1,274


Gross profit (loss)

796

(370)


Operating Loss

(25,570)

(23,624)


Net income (loss) attributable to the company

(29,562)

(22,699)


Basic and diluted loss per share

(0.21)

(0.19)


$000’s

As at September 30, 2021

As at December 31, 2020


Financial Position:


Working capital

$               132,793

$                 40,158


Property, plant and equipment, net

22,211

23,621


Mineral properties, net

83,539

83,539


Total assets

267,283

183,236


Total long-term liabilities

13,877

13,376


Financial Discussion:

At September 30, 2021, the Company had $132.8 million of working capital, including $100.8 million of cash and marketable securities and $29.3 million of inventory, including approximately 691,000 pounds of uranium and 1,672,000 pounds of high-purity vanadium, both in the form of immediately marketable product. The current spot price of U3O8, according to TradeTech, is $47.00 per pound (up 55% in 2021), and the current mid-point spot price of V2O5, according to Metal Bulletin, is $8.00 per pound (up 48% in 2021). Based on today’s spot prices, the Company’s uranium, vanadium, and RE Carbonate inventories have a current market value of $32.5 million, $13.4 million, and $1.0 million respectively, totaling $46.9 million

Following the quarter-end, on October 27, 2021, the Company completed the sale of certain non-core conventional assets to CUR. In addition to receiving $2 million cash at closing, the Company also now holds 19.9% of the outstanding shares of CUR having a current value of approximately $28.3 million.

During the quarter ended September 30, 2021, the Company incurred a net loss of $8.0 million, compared to a net loss of $8.9 million for the third quarter of 2020, and a net loss of $29.7 million year-to-date compared to $22.8 million during the first nine months of 2020. The increased net losses in 2021 are due primarily to increased development expenditures incurred in ramping up our RE Carbonate production at the Mill of $1.8 million during the quarter and $6.1 million year-to-date, and to underutilized capacity production costs applicable to rare earth concentrates during the quarter and year-to-date of $0.45 million. The underutilized capacity production costs are due to low throughput rates as the Mill ramps-up to commercial-scale production. To date, the Mill has focused on producing commercially salable RE Carbonate at low throughput rates and has been very pleased with the resulting product it is shipping for separation. The Mill expects to increase its throughput rates as its supplies of monazite sands increase. The Company is in advanced discussions with several monazite suppliers to secure additional supplies of monazite sands, and once secured, we expect these additional supplies will result in sufficient throughput to reduce underutilized capacity production costs and allow the Company to realize its expected margins on a continuous basis.

Commencement of Rare Earth Carbonate Deliveries in 2021:

In July, the Company commenced deliveries of RE Carbonate to the Silmet rare earth separations facility in Estonia, owned by Neo Performance Materials (“Neo“), creating a new United States-to-Europe rare earth supply chain. During the initial ramp-up of RE Carbonate production, the Company produced approximately 270 tonnes of RE Carbonate (containing approximately 120 tonnes of total rare earth oxides (“TREO“)) from natural monazite sands mined from heavy mineral sand (“HMS“) in Georgia, USA by The Chemours Company. Subject to final verification, initial analyses indicate that Energy Fuels’ RE Carbonate meets or surpasses the specifications of Neo’s separation facility.

Monazite sand is widely recognized as one of the most valuable rare earth minerals in the World, due to its superior distributions of magnetic REEs needed for various clean energy, defense and other advanced technologies. Monazite from the southeast U.S. typically contains roughly 55% TREO of which the magnetic elements neodymium and praseodymium (“NdPr”) comprise approximately 22% of the TREO. NdPr are among the most valuable of the rare earth elements, as they are the key ingredient in the manufacture of high-strength permanent magnets that are essential to the lightweight and powerful motors required in electric vehicles, permanent magnet wind turbines used for renewable energy generation, and a variety of other modern technologies, including, mobile devices and defense applications. U.S. Monazite also contains approximately 14.4% “heavy” rare earths on a TREO basis, including roughly 1.5% dysprosium and terbium which have additional important magnet and national defense applications.

Natural monazite sand is currently recovered as a low-cost byproduct of HMS operations in the U.S. and elsewhere in the world. The historic challenge with monazite is that it contains higher concentrations of natural uranium, thorium and other radionuclides relative to other minerals, thereby requiring specific licenses and specialized technical capabilities to handle and process. Energy Fuels currently holds the required licenses, and in 2021 we unlocked the value of this domestic resource. Energy Fuels’ commercial-scale production of RE Carbonate from U.S.-mined natural monazite sand positions Energy Fuels as the only company in North America currently producing a monazite-derived, enhanced rare earth material, and the only company in North America producing an intermediate rare earth product ready for separation without further processing.

The Company and Neo also announced the signing of a definitive supply agreement under which Energy Fuels will ship all or a portion of its RE Carbonate to Neo’s Silmet facility for processing into separated rare earth materials used in rare earth permanent magnets and other rare earth-based advanced materials. We believe the Company is well on its way to creating a new, low-cost, fully integrated U.S. rare earth supply chain that meets the highest global standards for environmental protection, sustainability and human rights, and that allows for source validation and tracking from mining through final end-use applications for manufacturers in North AmericaEuropeJapan and other nations.

We are currently scoping the potential to produce separated REE oxides using proven solvent extraction (“SX”) technology that we have utilized for the recovery of uranium and vanadium over the past 40+ years. We are also evaluating moving farther down the REE supply chain to produce certain rare earth metals, alloys and other advanced REE products.

Sale of Non-Core Conventional Assets to International Consolidated Uranium Inc:

On October 27, 2021, the Company completed the sale of a portfolio of non-core conventional uranium projects located in Utah and Colorado, including the Daneros mine, the Tony M mine, the Rim mine, the Sage Plain project, and several U.S. Department of Energy leases, to CUR. In addition, the Company and CUR entered into toll-milling and operating agreements with respect to the properties. The consideration payable by CUR to Energy Fuels included $2 million cash payable at closing, such number of shares that results in Energy Fuels holding 19.9% of the outstanding CUR common shares immediately after closing, Cdn$6 million of deferred cash payable over time, and up to Cdn$5 million of deferred cash payable on the commencement of commercial production at the properties. Through this accretive disposition, Energy Fuels believes the value of these high-quality, permitted, and past-producing mines can be unlocked for Company shareholders, while also allowing the Company to cut standby costs, earn management fees, and potentially realize toll milling fees in the future. Based on the October 26, 2021 CUR share price, exchange rates and assuming full performance of the agreement, the current value of this divestment is approximately $35.1 million, plus additional payments totaling up to Cdn$5 million payable upon commencement of production from the projects in the future.

Collaboration with RadTran, LLC on Recovering Medical Isotopes for Advanced Cancer Therapies:

On July 28, 2021, the Company announced the execution of a Strategic Alliance Agreement with RadTran, LLC, a technology development company focused on closing critical gaps in the procurement of medical isotopes for emerging TAT cancer therapeutics and other applications. Under this strategic alliance, the Company will evaluate the feasibility of recovering Th-232, and potentially Ra-226 from its existing uranium and RE Carbonate process streams at the Mill and, together with RadTran evaluate the feasibility of recovering Ra-228 from the Th-232 and Th-228 from the Ra-228 at the Mill using RadTran technologies. The recovered Ra-228, Th-228 and potentially Ra-226 would then be sold to pharmaceutical companies and others to produce Pb-212, Ac-225, Bi-213, Ra-224 and Ra-223, which are the leading medically attractive TAT isotopes for the treatment of cancer. Existing supplies of these isotopes for TAT applications are in short supply, and methods of production are costly and currently cannot be scaled to meet the demand as new drugs are developed and approved. This is a major roadblock in the research and development of new TAT drugs as pharmaceutical companies wait for scalable and affordable production technologies to become available. Under this exciting initiative, the Company has the potential to recycle valuable isotopes from its existing process streams, that would otherwise be lost to disposal, for use in the treatment of cancer.

Market Conditions

Uranium prices improved significantly during the quarter, while also exhibiting considerable volatility. Between June 30, 2021 and September 30, 2021, uranium prices rose from $32.40 per pound to $42.20 per pound (30% increase), reaching a high of $50.50 on September 17 and a low of $30.50 on August 13. Subsequent to the quarter, the uranium price dropped to $37.40 on October 8, then rose again to $46.00 on October 15. The outlook for uranium continues to improve, as demand continues to outpace supplies. In particular, financial intermediaries, including the Sprott Physical Uranium Trust (“SPUT”), entered the market to purchase uranium and build inventories for a long-term hold. On October 18, it was announced that a new Kazakh-led uranium fund was going to be created to similarly buy and hold uranium in inventory. Energy Fuels holds 691,000 pounds of uranium in inventory that we recently produced at our own facilities in the U.S. through our low-cost alternate feed material production, which is among the lowest-cost uranium production in the world today. In addition, the Company holds another approximately 252,000 pounds of U3O8 contained in stockpiled alternate feed material and ore inventory at the Mill that can be recovered relatively quickly. Between the finished inventory and stockpiled inventory, the Company holds over 900,000 pounds of U3O8 that can be sold immediately or in the near-term.

Vanadium prices were flat during the quarter, beginning the quarter at $8.75 per pound V2O5 and ending the quarter at $8.78 per pound V2O5. An improving global economy, coupled with political unrest in South Africa and other factors, has caused vanadium prices to rise nearly 63% this year, from $5.40 per pound as of December 25, 2020 to $8.78 per pound as of September 24, 2021. Vanadium is a valuable clean energy metal, historically used in steel, master alloys, and chemicals. It is also seeing considerable interest in emerging grid-scale battery technologies used to store renewable energy. Energy Fuels also holds about 1.7 million pounds of finished high-purity vanadium pentoxide in inventory, plus 1.5 to 3.0 million pounds of solubilized vanadium inventory in the Mill’s tailings solutions that we can recover relatively quickly. We also hold large quantities of high-grade vanadium resources at our standby mines where we recently developed new mining techniques that we believe can increase production and lower costs when mining resumes in the future. The Mill was the largest U.S. vanadium producer as recently as 2019.

Finally, REE prices remain strong with the price of NdPr oxide increasing 45% year to date from $78.50/kg on January 4, 2021 to $113.80/kg on September 29, 2021. The Company’s sales price for its RE Carbonate is currently based on the prices of REE oxides, with the price of NdPr being the primary driver of the Company’s RE Carbonate sales price at this time.

Operations Update and Outlook for Period Ending September 30, 2021

Overview

The Company continues to believe that uranium supply and demand fundamentals continue to point to higher sustained uranium prices in the future. In addition, the recent entry into the uranium market by financial entities purchasing uranium on the spot market to hold for the long-term has the potential to result in higher sustained spot and term prices and perhaps induce utilities to enter into long-term contracts with producers like Energy Fuels to ensure security of supply and more certain pricing. However, the recent, relatively short-term uranium price increases are not yet sufficient to justify commencing uranium production at the Company’s mines and ISR facilities. As a result, the Company expects to maintain uranium recovery at reduced levels, until such time when increased prices are sustained, suitable term sales contracts can be procured, or the U.S. government buys uranium from the Company following the establishment of the proposed U.S. Uranium Reserve. The Company also holds significant uranium inventories and is evaluating selling all or a portion of these inventories in response to future upside price volatility.

The Company will also continue to seek new sources of revenue, including through its emerging REE business, as well as new sources of Alternate Feed Materials and new fee processing opportunities at the Mill that can be processed under existing market conditions (i.e., without reliance on current uranium sales prices). The Company is also seeking new sources of natural monazite sands for its emerging REE business and continues its support of U.S. government activities to assist the U.S. uranium mining industry, including the proposed establishment of a U.S. Uranium Reserve.

Extraction and Recovery Activities Overview

During the nine months ended September 30, 2021, the Company did not recover significant quantities of U3O8. The Company expects to package insignificant quantities of U3O8 in the year ending December 31, 2021, focusing instead on ramping up and optimizing its mixed RE Carbonate production, while also enhancing its readiness to quickly resume uranium production at certain of its facilities. All uranium recovered during 2021 at the Mill is expected to be retained in-circuit at the Mill and not to be packaged in 2021. The Company does not plan to extract and/or recover any amounts of uranium of any significance from its Nichols Ranch Project in 2021, which was placed on standby in the second quarter of 2020 due to the depletion of its seven constructed wellfields. In addition, the Company expects to keep the Alta Mesa Project and its conventional mining properties on standby during 2021.

The Company expects to recover approximately 400 to 600 tonnes of mixed RE Carbonate at the Mill in 2021, containing approximately 180 to 270 tonnes of TREO, subject to the receipt of sufficient quantities of natural monazite sands, as it continues to ramp up its RE Carbonate production. These numbers are reduced from last quarter’s guidance for 2021 of approximately 700 to 1,100 tonnes of mixed RE Carbonate containing approximately 350 to 550 tonnes of TREO. The reduced RE Carbonate production is due to reduced supplies of monazite sands currently available from the Company’s supplier in Georgia, which are now expected to be approximately 800 tonnes of monazite sands per year, down from the previous expectation of approximately 2,500 tonnes per year. The Company is in advanced discussions with several monazite suppliers, including the Company’s existing supplier, to secure additional supplies of monazite sands, which if successful, would be expected to allow the Company to increase RE Carbonate production. The Company expects to produce no vanadium during 2021.

To date, the Company has strategically opted not to enter into any uranium sales commitments. However, the Company believes recent price increases and volatility have increased the potential for the Company to make spot sales. The Company is actively seeking term sales contracts with utilities at pricing that sustains production and covers corporate overhead. As a result, existing inventories may remain unchanged at approximately 691,000 pounds of U3O8 at year-end or may be reduced in the event the Company sells a portion of its inventory on the spot market in Q4-2021. All or a portion of V2O5 inventory is expected to be sold on the spot market if prices rise sufficiently above current levels, but otherwise maintained in inventory. The Company expects to sell all or a portion of its mixed RE Carbonate to Neo Performance Materials or other global separation facilities and/or to stockpile it for future production of separated REE oxides at the Mill or elsewhere.

About Energy Fuels: Energy Fuels is a leading U.S.-based uranium mining company, supplying U3O8 to major nuclear utilities. The Company also produces vanadium from certain of its projects, as market conditions warrant, and is ramping up to commercial-scale production of RE Carbonate in 2021. Its corporate offices are in Lakewood, Colorado near Denver, and all of its assets and employees are in the United States. Energy Fuels holds three of America’s key uranium production centers: the White Mesa Mill in Utah, the Nichols Ranch ISR Project in Wyoming, and the Alta Mesa ISR Project in Texas. The White Mesa Mill is the only conventional uranium mill operating in the U.S. today, has a licensed capacity of over 8 million pounds of U3O8 per year, and has the ability to produce vanadium when market conditions warrant, as well as RE Carbonate from various uranium-bearing ores. The Nichols Ranch ISR Project is currently on standby and has a licensed capacity of 2 million pounds of U3O8 per year. The Alta Mesa ISR Project is also currently on standby. In addition to the above production facilities, Energy Fuels also has one of the largest NI 43-101 compliant uranium resource portfolios in the U.S. and several uranium and uranium/vanadium mining projects on standby and in various stages of permitting and development. The primary trading market for Energy Fuels’ common shares is the NYSE American under the trading symbol “UUUU,” and the Company’s common shares are also listed on the Toronto Stock Exchange under the trading symbol “EFR.” Energy Fuels’ website is www.energyfuels.com.

Cautionary Note Regarding Forward-Looking Statements: This news release contains certain “Forward Looking Information” and “Forward Looking Statements” within the meaning of applicable United States and Canadian securities legislation, which may include, but are not limited to, statements with respect to: production and sales forecasts; costs of production; any expectation that the Company will continue to be ready to supply uranium into the proposed U.S. Uranium Reserve once it is established; scalability, and the Company’s ability and readiness to re-start, expand or deploy any of its existing projects or capacity to respond to any improvements in uranium market conditions or in response to the proposed Uranium Reserve; any expectation regarding any remaining dissolved vanadium in the White Mesa Mill’s tailings facility solutions; any expectation that the Company’s recently developed mining techniques can increase production and lower costs when vanadium mining resumes in the future; the ability of the Company to secure any new sources of alternate feed materials or other processing opportunities at the White Mesa Mill; expected timelines for the permitting and development of projects; the Company’s expectations as to longer term fundamentals in the market and price projections; any expectation that the Company will maintain its position as a leading uranium company in the United States; any expectation that the proposed Uranium Reserve will be implemented and if implemented the manner in which it will be implemented and the timing of implementation; any expectation with respect to timelines to production; any expectation that the Mill will be successful in producing RE Carbonate on a commercial basis; any expectation that Neo will be successful in separating the Mill’s RE Carbonate on a commercial basis; any expectation that Energy Fuels will be successful in developing U.S. separation, or other value-added U.S. REE production capabilities at the Mill, or otherwise; any expectation that the Company and Neo will be successful in jointly developing a fully integrated U.S.-European REE supply chain; any expectation that the Company will be successful in building a low-cost, fully integrated U.S. rare earth supply chain that meets the highest global standards for environmental protection, sustainability and human rights; any expectation with respect to the future demand for REEs; any expectation with respect to the quantities of monazite sands to be acquired by Energy Fuels, the quantities of RE Carbonate to be produced by the Mill or the quantities of contained TREO in the Mill’s RE Carbonate; any expectation that additional supplies of monazite sands will result in sufficient throughput at the Mill to reduce underutilized capacity production costs and allow the Company to realize its expected margins on a continuous basis; any expectation that the Company’s evaluation of thorium and potentially radium recovery at the Mill will be successful; any expectation that the potential recovery of medical isotopes from any thorium and radium recovered at the Mill will be feasible; any expectation that any thorium, radium and other isotopes can be recovered at the Mill and sold on a commercial basis; and any expectation as to the value to the Company of the divestment of its non-core assets to CUR. Generally, these forward-looking statements can be identified by the use of forward-looking terminology such as “plans,” “expects,” “does not expect,” “is expected,” “is likely,” “budgets,” “scheduled,” “estimates,” “forecasts,” “intends,” “anticipates,” “does not anticipate,” or “believes,” or variations of such words and phrases, or state that certain actions, events or results “may,” “could,” “would,” “might” or “will be taken,” “occur,” “be achieved” or “have the potential to.” All statements, other than statements of historical fact, herein are considered to be forward-looking statements. Forward-looking statements involve known and unknown risks, uncertainties and other factors which may cause the actual results, performance or achievements of the Company to be materially different from any future results, performance or achievements express or implied by the forward-looking statements. Factors that could cause actual results to differ materially from those anticipated in these forward-looking statements include risks associated with: commodity prices and price fluctuations; processing and mining difficulties, upsets and delays; permitting and licensing requirements and delays; changes to regulatory requirements; legal challenges; the availability of sources of alternate feed materials and other feed sources for the Mill; competition from other producers; public opinion; government and political actions; the appropriations for the proposed Uranium Reserve not being allocated to that program and the Uranium Reserve not being implemented; the manner in which the proposed Uranium Reserve, if established, will be implemented; the Company not being successful in selling any uranium into the proposed Uranium Reserve at acceptable quantities or prices, or at all; available supplies of monazite sands; the ability of the Mill to produce RE Carbonate to meet commercial specifications on a commercial scale at acceptable costs; the ability of Neo to separate the RE Carbonate produced by the Mill to meet commercial specifications on a commercial scale at acceptable costs; market factors, including future demand for REEs; the ability of the Mill to be able to separate thorium and potentially radium at reasonable costs or at all; the ability of the Company and RadTran to be able to recover other isotopes from thorium and radium recovered at the Mill at reasonable costs or at all; market prices and demand for medical isotopes; and the other factors described under the caption “Risk Factors” in the Company’s most recently filed Annual Report on Form 10-K, which is available for review on EDGAR at www.sec.gov/edgar.shtml, on SEDAR at www.sedar.com, and on the Company’s website at www.energyfuels.com. Forward-looking statements contained herein are made as of the date of this news release, and the Company disclaims, other than as required by law, any obligation to update any forward-looking statements whether as a result of new information, results, future events, circumstances, or if management’s estimates or opinions should change, or otherwise. There can be no assurance that forward-looking statements will prove to be accurate, as actual results and future events could differ materially from those anticipated in such statements. Accordingly, the reader is cautioned not to place undue reliance on forward-looking statements. The Company assumes no obligation to update the information in this communication, except as otherwise required by law.

SOURCE Energy Fuels Inc.

For further information: Investor Inquiries: Energy Fuels Inc., Curtis Moore, VP – Marketing and Corporate Development, (303) 974-2140 or Toll free: (888) 864-2125, investorinfo@energyfuels.com, www.energyfuels.com

Release – Capstone Green Energy To Power Groundbreaking Tire Recycling Plant in Scotland


Capstone Green Energy (NASDAQ:CGRN) To Power Groundbreaking Tire Recycling Plant in Scotland


Five C1000S Microturbines Will Provide 5MW of Clean and Green Power for the Ten Acre Recycling Plant

VAN NUYS, CA / ACCESSWIRE / November 1, 2021 / Capstone Green Energy Corporation (www.CapstoneGreenEnergy.com) (NASDAQ:CGRN), a global leader in carbon reduction and on-site resilient green energy solutions, announced today that SCE Energy (scengy.com), Capstone’s exclusive distributor in Scotland and Northern United Kingdom, secured an order for four C1000 Signature Series microturbines for a groundbreaking tire recycling plant in Scotland. This order adds to last year’s first C1000S order at the site and will see a total of five microturbine systems installed at the 4.2 hectare, or approximately 10 acre, tire processing facility.

This order is the first of its kind in Scotland and the largest in the United Kingdom (UK). The plant would be a UK first to devulcanise treated rubber to produce new products that include sheets, conveyor belts, shoe soles or rubber mats. The process is a better way of repurposing used rubber and will see every part of the waste tire broken down to be recycled or reused.

The cogeneration system will use low pressure natural gas to provide electricity and combined heat and power (CHP). The visionary project is a collaboration between SSH Recycling, ICDP Architects and SCE Energy.

“Capstone Green Energy, in partnership with SCE Energy, ICDP Architects and SSH Recycling, has designed a low emission and highly efficient CHP system to drive cost and carbon savings in this environmentally significant tire recycling operation,” said Darren Jamison, President and Chief Executive Officer of Capstone Green Energy. “In my opinion, this creative solution is nothing short of brilliant.” concluded Mr. Jamison.

“This is a groundbreaking project which will save over one million tons of carbon emissions annually and help Scotland reach its net carbon target,” said Willy Findlater, Lead Consultant and Project Manager for ICDP Architects.

The clean exhaust from the microturbines will be captured via heat exchangers and will provide heat and hot water to the processing plant, process equipment, storage buildings and offices. Not only is the system’s high efficiency expected to lower operating costs from their current cogeneration system, it will also provide environmental benefits by reducing carbon emissions.

Strict environmental challenges set by various government bodies gave the Capstone’s low emission microturbines a sizeable advantage over alternative technologies and equipment. Capstone microturbine systems dramatically reduce both criteria pollutant emissions and carbon emissions through use of low- or no-carbon generation, improved efficiency, reduced fuel needs and/or use of waste streams as fuel.

About Capstone Green Energy

Capstone Green Energy (www.CapstoneGreenEnergy.com) (NASDAQ:CGRN) is a leading provider of customized microgrid solutions and on-site energy technology systems focused on helping customers around the globe meet their environmental, energy savings, and resiliency goals. Capstone Green Energy focuses on four key business lines. Through its Energy as a Service (EaaS) business, it offers rental solutions utilizing its microturbine energy systems and battery storage systems, comprehensive Factory Protection Plan (FPP) service contracts that guarantee life-cycle costs, as well as aftermarket parts. Energy Conversion Products are driven by the Company’s industry-leading, highly efficient, low-emission, resilient microturbine energy systems offering scalable solutions in addition to a broad range of customer-tailored solutions, including hybrid energy systems and larger frame industrial turbines. The Energy Storage Products business line designs and installs microgrid storage systems creating customized solutions using a combination of battery technologies and monitoring software. Through Hydrogen Energy Solutions, Capstone Green Energy offers customers a variety of hydrogen products, including the Company’s microturbine energy systems.

For customers with limited capital or short-term needs, Capstone offers rental systems; for more information, contact: rentals@CGRNenergy.com. To date, Capstone has shipped over 10,000 units to 83 countries and estimates that, in FY21, it saved customers over $217 million in annual energy costs and approximately 397,000 tons of carbon. Total savings over the last three years are estimated at 1,115,100 tons of carbon and $698 million in annual energy savings.

For more information about the Company, please visit: www.CapstoneGreenEnergy.com. Follow Capstone Green Energy on TwitterLinkedInInstagramFacebook, and YouTube.

Cautionary Note Regarding Forward-Looking Statements

This release contains forward-looking statements as defined in the Private Securities Litigation Reform Act of 1995, including statements regarding expectations for green initiatives and execution on the Company’s growth strategy and other statements regarding the Company’s expectations, beliefs, plans, intentions, and strategies. The Company has tried to identify these forward-looking statements by using words such as “expect,” “anticipate,” “believe,” “could,” “should,” “estimate,” “intend,” “may,” “will,” “plan,” “goal” and similar terms and phrases, but such words, terms and phrases are not the exclusive means of identifying such statements. Actual results, performance and achievements could differ materially from those expressed in, or implied by, these forward-looking statements due to a variety of risks, uncertainties and other factors, including, but not limited to, the following: the ongoing effects of the COVID-19 pandemic; the availability of credit and compliance with the agreements governing the Company’s indebtedness; the Company’s ability to develop new products and enhance existing products; product quality issues, including the adequacy of reserves therefor and warranty cost exposure; intense competition; financial performance of the oil and natural gas industry and other general business, industry and economic conditions; the Company’s ability to adequately protect its intellectual property rights; and the impact of pending or threatened litigation. For a detailed discussion of factors that could affect the Company’s future operating results, please see the Company’s filings with the Securities and Exchange Commission, including the disclosures under “Risk Factors” in those filings. Except as expressly required by the federal securities laws, the Company undertakes no obligation to update or revise any forward-looking statements, whether as a result of new information, changed circumstances or future events or for any other reason.

CONTACT:
Capstone Green Energy
Investor and investment media inquiries:
818-407-3628
ir@CGRNenergy.com

SOURCE: Capstone Green Energy Corporation

Voyager Digital (VYGVF)(VOYG:CA) – Fiscal 2021 4Q and Full Year Results

Monday, November 01, 2021

Voyager Digital (VYGVF)(VOYG:CA)
Fiscal 2021 4Q and Full Year Results

Voyager Digital Ltd through its subsidiary, operates as a crypto asset broker that provides retail and institutional investors with a turnkey solution to trade crypto assets. The company offers investors execution, data, wallet and custody services through its institutional-grade open architecture platform.

Joe Gomes, Senior Research Analyst, Noble Capital Markets, Inc.

Joshua Zoepfel, Research Associate, Noble Capital Markets, Inc.

Refer to the full report for the price target, fundamental analysis, and rating.

    4Q21 Results. Voyager reported $109 million of revenue for the fiscal fourth quarter ended June 30th and $175.1 million for the fiscal year. We had projected revenue of $105 million and $171 million, respectively. Adjusted EBITDA was $21.2 million and $62.7 million, respectively. Voyager reported net income of $30.0 million for the fourth quarter and a net loss for the year of $51.5 million, or $0.39 per share.

    Metrics.  AUM of $6 billion and verified users of 2.4 million are both up from the October 6th release on preliminary 1Q22 results, of $5 billion and $2.15 million, illustrating the rapid growth potential of the Company, in our view. Fiscal year-end cash was $193.9 million and adjusted working capital was $207 million …


This Company Sponsored Research is provided by Noble Capital Markets, Inc., a FINRA and S.E.C. registered broker-dealer (B/D).

*Analyst certification and important disclosures included in the full report. NOTE: investment decisions should not be based upon the content of this research summary.  Proper due diligence is required before making any investment decision. 

Travelzoo (TZOO) – The Speedy Recovery Trips

Monday, November 01, 2021

Travelzoo (TZOO)
The Speedy Recovery Trips

Travelzoo is a US-based company which acts as a publisher of travel and entertainment offers. The company informs a varied number of members in Asia Pacific, Europe, and North America, as well as millions of website users, about the best travel, entertainment and local deals available from various companies. It provides travel, entertainment, and local businesses in a flexible manner to the various customer. The company operates in three geographic segments namely Asia Pacific, Europe, and North America. Travelzoo derives its revenue through advertising fees including listing fees paid by travel, entertainment, and local businesses to advertise their offers on company’s media properties. Most of the company’s revenue is derived from the North America.

Michael Kupinski, Director of Research, Noble Capital Markets, Inc.

Refer to the full report for the price target, fundamental analysis, and rating.

    Q3 disappoints. Total company revenues increased a solid 14% to $15.7 million, but it was well below our $20.7 million estimate and represented a sequential quarterly revenue decline from $19.1 million in Q2. Management believes that news about the Covid Delta variant, prospect of travel restrictions, kept travelers from booking, which adversely affected results.

    Despite revenue headwinds, Q4 is expected to be profitable.  The company has significantly reduced fixed costs and has the capability to report profits despite a slower than expected revenue recovery. Revenue visibility remains low. As such, we are lowering our Q4 revenue estimate from $22.5 million to $17.7 million. Our adj. EBITDA estimate is lowered from $6.7 million to $2.5 million. Nonetheless …


This Company Sponsored Research is provided by Noble Capital Markets, Inc., a FINRA and S.E.C. registered broker-dealer (B/D).

*Analyst certification and important disclosures included in the full report. NOTE: investment decisions should not be based upon the content of this research summary.  Proper due diligence is required before making any investment decision.