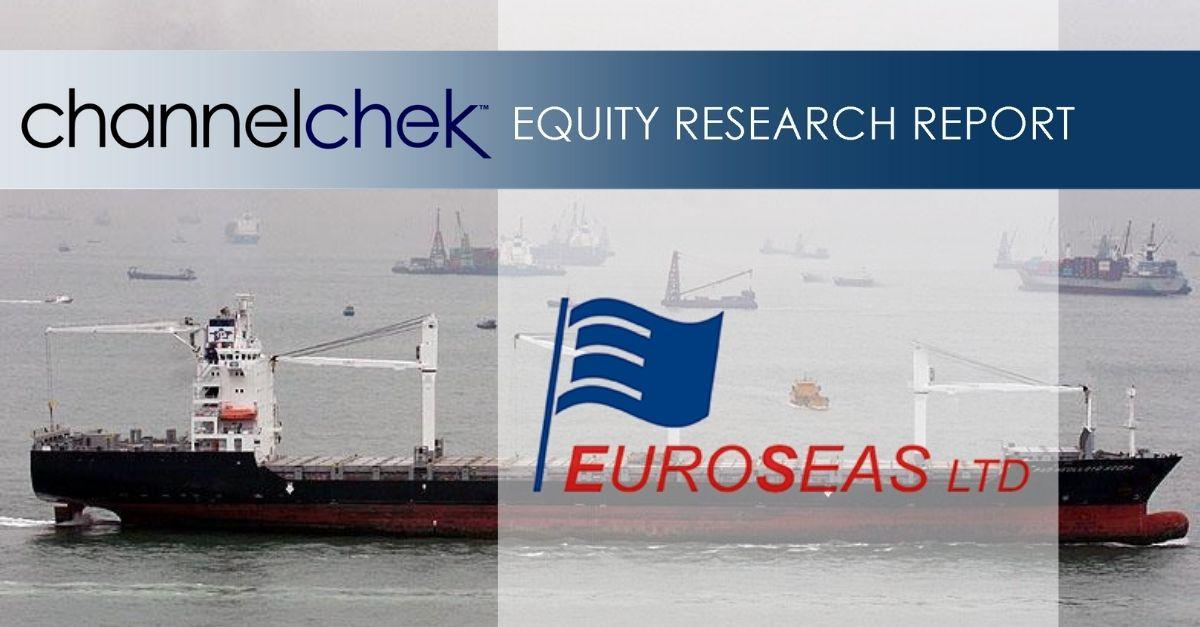
Euroseas (ESEA) – Attractive Acquisition and Watching Upcoming Charters

Friday, November 12, 2021

Euroseas (ESEA)
Attractive Acquisition and Watching Upcoming Charters

Euroseas Ltd. provides ocean-going transportation services worldwide. The company owns and operates containerships that transport dry and refrigerated containerized cargoes, including manufactured products and perishables; and drybulk carriers that transport iron ore, coal, grains, bauxite, phosphate, and fertilizers. As of March 31, 2017, it had a fleet of seven containerships; and six drybulk carriers, including three Panamax drybulk carriers, one Handymax drybulk carrier, one Kamsarmax drybulk carrier, and one Ultramax drybulk carrier. The company was founded in 2005 and is based in Maroussi, Greece.

Poe Fratt, Senior Research Analyst, Noble Capital Markets, Inc.

Refer to the full report for the price target, fundamental analysis, and rating.

    Intermediate acquisition enhances fleet and adds to forward cover. The acquisition of a 2005-built 6,350 TEU container ship (TBN Marcos V) for $40 million should close in late 4Q2021. A three-year time charter at $42.2k/day, which equates to annual EBITDA of close to $12 million, derisks the acquisition. We expect debt financing of $24.0 million to be announced by yearend.

    Results out next week.  3Q2021 Numbers will be out BMO on November 16th and management will host a call at 10am EST. Number is (877) 553-9962 and code is Euroseas. Our 3Q2021 EBITDA estimate is $13.8 million based on TCE rates of $19.1k/day. In addition to container market comments, we will be looking for details on the latest acquisitions and the contract status on the intermediate and four feeders …


This research is provided by Noble Capital Markets, Inc., a FINRA and S.E.C. registered broker-dealer (B/D).

*Analyst certification and important disclosures included in the full report. NOTE: investment decisions should not be based upon the content of this research summary.  Proper due diligence is required before making any investment decision. 

Onconova Therapeutics (ONTX) – 3Q Report Highlights Clinical Progress

Friday, November 12, 2021

Onconova Therapeutics (ONTX)
3Q Report Highlights Clinical Progress

Onconova Therapeutics Inc is a clinical-stage biopharmaceutical company operating in the US. It focuses on discovering and developing novel small molecule product candidates primarily to treat cancer. The company has created a library of targeted agents designed to work against cellular pathways important to cancer cells. Its product candidates are Single-agent IV rigosertib, Oral rigosertib + azacitidine, IV Briciclib, Recilisib, and ON 123300. The key product candidate Rigosertib is a small molecule which blocks cellular signaling by targeting RAS effector pathways.

Robert LeBoyer, Senior Research Analyst, Noble Capital Markets, Inc.

Refer to the full report for the price target, fundamental analysis, and rating.

    3Q21 reported. Onconova Therapeutics reported 3Q21 loss of $3.5 million or $(0.22) per share, compared with our estimated loss of $5.2 million or $(0.33) per share. On its quarterly conference call, the company reviewed clinical progress during the quarter and discussed plans for trials in 2022. Cash balance at the end of the quarter was $59.4 million.

    Narazaciclib updates.  The company gave an update on the two clinical dose escalation trials for narazaciclib, the new name for ON 123300. The US trial is enrolling its second dose cohort, while the study in China is in its fourth cohort. Data to establish safety and select the dose for Phase 3 is expected in 1H22. This Phase 2 study is expected to include multiple cancer types including patients with …


This Company Sponsored Research is provided by Noble Capital Markets, Inc., a FINRA and S.E.C. registered broker-dealer (B/D).

*Analyst certification and important disclosures included in the full report. NOTE: investment decisions should not be based upon the content of this research summary.  Proper due diligence is required before making any investment decision. 

One Stop Systems (OSS) – Post Call Commentary and Updated Models

Friday, November 12, 2021

One Stop Systems (OSS)
Post Call Commentary and Updated Models

One Stop Systems Inc is US-based company which is principally engaged in designing, manufacturing, marketing high-end systems for high performance computing (HPC) applications. The company offers custom servers, compute accelerators, solid-state storage arrays and system expansion systems. The product line of the company includes GPU Appliances, GPU Expansion, GPUs and co-processors, Flash storage arrays, Flash storage expansion, Servers, Disk Arrays, Desktop computing appliances, accessories and parts. The company delivers high-end technology to customers through the sale of equipment and software for use on their premises or through remote cloud access to secure data centres housing technology.

Joe Gomes, Senior Research Analyst, Noble Capital Markets, Inc.

Joshua Zoepfel, Research Associate, Noble Capital Markets, Inc.

Refer to the full report for the price target, fundamental analysis, and rating.

    Disguise. While we do not want to get ahead of ourselves given the ongoing impact of COVID worldwide, in the non-COVID 2019, disguise generated about $14 million of revenue for live event products. We would expect the majority of this revenue to return over time and will be additive to the current virtual products.

    New Platform.  While management was reserved in talking about the new platform before launch next week, we believe the new platform could be a game changer. A more standardized product than OSS’s historic custom products, the new platform should expand the market by enabling customers to go right out of the box. The platform is squarely focused on the AI Transportables market which typically …


This Company Sponsored Research is provided by Noble Capital Markets, Inc., a FINRA and S.E.C. registered broker-dealer (B/D).

*Analyst certification and important disclosures included in the full report. NOTE: investment decisions should not be based upon the content of this research summary.  Proper due diligence is required before making any investment decision. 

Capstone Green Energy (Nasdaq:CGRN) To Provide Onsite Power System To Wastewater Treatment Facility


Capstone Green Energy (Nasdaq:CGRN) To Provide Onsite Power System To Wastewater Treatment Facility


System Will Use Both Biogas and Natural Gas to Generate Electrical & Thermal Energy

VAN NUYS, CA / ACCESSWIRE / November 12, 2021 / Capstone Green Energy Corporation (www.CapstoneGreenEnergy.com) (NASDAQ:CGRN), (“Capstone,” the “Company,” “we” or “us”), a global leader in carbon reduction and on-site resilient green energy solutions, today announced that its Distributor in Romania, Servelect, has signed a contract to provide a Combined Heat and Power (CHP) system to Compania Aquaserv S.A., a wastewater treatment plant operator in Mures County, Romania.

The new utility grid-connected system will be built utilizing one Capstone Green Energy C600S microturbine and one C200S microturbine. All the energy produced on-site will be used within the wastewater treatment plant. The C600S unit will be fueled by the biogas resulting from anaerobic fermentation of sludge, while the C200S unit will use high-pressure natural gas from the local Romanian Distribution Network Operator (DNO).

This green energy project was pursued as it became clear that the site’s existing internal combustion engine cogeneration plant was reaching the end of its lifecycle. At the same time, rising electricity prices combined with investment opportunities for wastewater treatment cogeneration projects made it an ideal time for Compania Aquaserv S.A. to look for a more efficient and advanced cogeneration technology. The project is funded by the European Economic Area (EEA) and Norwegian grants. The EEA and Norwegian grants represent the contribution of Iceland, Liechtenstein, and Norway to reduce economic and social disparities in the European Economic Area and to strengthen bilateral relations with the 15 beneficiary states in Eastern and Southern Europe and the Baltic States.

“Producing biogas from municipal wastewater sludge is a well-known and widely used approach,” said Csaba Bauer, Head of Wastewater Treatment Department of Compania Aquaserv S.A. “Compania Aquaserv S.A. has over 20 years of experience using biogas in cogeneration plants to cover its energy consumption and thermal needs. In this way, we can optimize our operational costs for public sewage service, making it more affordable for the public,” added Mr. Bauer.

The system will include two compressors that will increase the pressure of both the biogas and natural gas. To provide maximum efficiency, the two Capstone Green Energy CHP systems will be directed to a recovery boiler by a manifold; in addition, the hot water produced will be used in the sludge drying process. Together with the compressors and the recovery boiler, the two CHP units will be integrated within the site’s existing Supervisory Control and Data Acquisition (SCADA) system. This allows for both local and remote monitoring, as well as manual and automatic operating modes. All together, the system is designed to provide 800 kWe electric and 1500 kWth thermal power. It is expected to be commissioned in March 2022.

“We are very excited to implement one of the first Capstone Green Energy cogeneration plants within a wastewater treatment plant in Romania. Servelect has been Aquaserv’s reliable partner since the beginning of the project, starting with the feasibility study, elaboration of the financing application, and now with the technical design and the actual implementation of the project,” said Iulia Bargauan, General Director of Servelect. “The new system will provide Aquaserv with cost savings, energy efficiency, and reduced carbon emissions,” added Ms. Bargauan.

“Wastewater treatment plants are among the best candidates for this kind of highly efficient green energy project. Not only is biogas a free, renewable fuel source for producing heat and electricity, it also eliminates the waste gas, which could otherwise be a global warming pollutant,” said Darren Jamison, Chief Executive Officer of Capstone Green Energy. “The kind of energy efficiency we can achieve at sites like Aquaserv S.A. offers the potential for greater operational cost savings, and with the kind of incentives that are currently available in many regions, the return on investment can be substantial,” concluded Mr. Jamison.

About Capstone Green Energy
Capstone Green Energy (www.CapstoneGreenEnergy.com) (NASDAQ:CGRN) is a leading provider of customized microgrid solutions and on-site energy technology systems focused on helping customers around the globe meet their environmental, energy savings, and resiliency goals. Capstone Green Energy focuses on four key business lines. Through its Energy as a Service (EaaS) business, it offers rental solutions utilizing its microturbine energy systems and battery storage systems, comprehensive Factory Protection Plan (FPP) service contracts that guarantee lifecycle costs, as well as aftermarket parts. Energy Generation Technologies (EGT) are driven by the Company’s industry-leading, highly efficient, low-emission, resilient microturbine energy systems offering scalable solutions in addition to a broad range of customer-tailored solutions, including hybrid energy systems and larger frame industrial turbines. The Energy Storage Solutions (ESS) business line designs and installs microgrid storage systems creating customized solutions using a combination of battery technologies and monitoring software. Through Hydrogen & Sustainable Products (H2S), Capstone Green Energy offers customers a variety of hydrogen products, including the Company’s microturbine energy systems.

For customers with limited capital or short-term needs, Capstone offers rental systems; for more information, contact: rentals@CGRNenergy.com. To date, Capstone has shipped over 10,000 units to 83 countries and estimates that, in FY21, it saved customers over $217 million in annual energy costs and approximately 397,000 tons of carbon. Total savings over the last three years are estimated to be approximately $698 million in energy savings and approximately 1,115,100 tons of carbon savings.

For more information about the Company, please visit www.CapstoneGreenEnergy.com. Follow Capstone Green Energy on TwitterLinkedInInstagramFacebook, and YouTube.

Cautionary Note Regarding Forward-Looking Statements
This release contains forward-looking statements as defined in the Private Securities Litigation Reform Act of 1995, including statements regarding expectations for green initiatives and execution on the Company’s growth strategy and other statements regarding the Company’s expectations, beliefs, plans, intentions, and strategies. The Company has tried to identify these forward-looking statements by using words such as “expect,” “anticipate,” “believe,” “could,” “should,” “estimate,” “intend,” “may,” “will,” “plan,” “goal” and similar terms and phrases, but such words, terms and phrases are not the exclusive means of identifying such statements. Actual results, performance and achievements could differ materially from those expressed in, or implied by, these forward-looking statements due to a variety of risks, uncertainties and other factors, including, but not limited to, the following: the ongoing effects of the COVID-19 pandemic; the availability of credit and compliance with the agreements governing the Company’s indebtedness; the Company’s ability to develop new products and enhance existing products; product quality issues, including the adequacy of reserves therefor and warranty cost exposure; intense competition; financial performance of the oil and natural gas industry and other general business, industry and economic conditions; the Company’s ability to adequately protect its intellectual property rights; and the impact of pending or threatened litigation. For a detailed discussion of factors that could affect the Company’s future operating results, please see the Company’s filings with the Securities and Exchange Commission, including the disclosures under “Risk Factors” in those filings. Except as expressly required by the federal securities laws, the Company undertakes no obligation to update or revise any forward-looking statements, whether as a result of new information, changed circumstances or future events or for any other reason.

CONTACT:
Capstone Green Energy
Investor and investment media inquiries:
818-407-3628
ir@CGRNenergy.com

SOURCE: Capstone Green Energy Corporation

QuickChek – November 12, 2021


Harte Hanks Generates $0.52 in EPS for Third Quarter of 2021

Harte Hanks announced financial results for the third quarter ended September 30, 2021

Research, News & Market Data on Harte Hanks

Watch recent presentation from Harte Hanks


ProMIS Neurosciences Announces Third Quarter 2021 Results

ProMIS Neurosciences announced its operational and financial results for the three and nine months ended September 30, 2021

Research, News & Market Data on ProMIS

Watch recent presentation from ProMIS


Capstone Green Energy (Nasdaq:CGRN) To Provide Onsite Power System To Wastewater Treatment Facility

Capstone Green Energy announced that its Distributor in Romania, Servelect, has signed a contract to provide a Combined Heat and Power (CHP) system to Compania Aquaserv S.A., a wastewater treatment plant operator in Mures County, Romania

Research, News & Market Data on Capstone Green Energy

Watch recent presentation from Capstone Green Energy


Stay up to date. Follow us:


ProMIS Neurosciences Announces Third Quarter 2021 Results


ProMIS Neurosciences Announces Third Quarter 2021 Results


TORONTO and CAMBRIDGE, Mass., Nov. 12, 2021 (GLOBE NEWSWIRE) — ProMIS Neurosciences, Inc. (TSX: PMN) (OTCQB: ARFXF) (“ProMIS or the Company”), a biotechnology company focused on the discovery and development of antibody therapeutics targeting toxic oligomers implicated in the development of neurodegenerative diseases, today announced its operational and financial results for the three and nine months ended September 30, 2021.

“We are pleased to be ramping up our efforts to advance our lead asset, PMN 310, closer toward the clinic,” said Gene Williams, ProMIS’ Chairman and CEO. “The financing we secured earlier this year is enabling us to unlock the potential of our platform, which we believe could have significant impact on the treatment of several neurological diseases, including Alzheimer’s Disease (AD), Parkinson’s Disease and ALS. The strengthening of our management team and Board this quarter has also enabled us to leverage worldwide development and patent expertise and strengthen our overall competitive position.”

Corporate Highlights

  • On July 2, 2021, the Company announced the voting results of its annual meeting of shareholders held on June 30, 2021, in Vancouver, British Columbia, Canada. All resolutions described in the Management Proxy Circular and placed before the meeting were approved by the shareholders.
  • On July 8, 2021, the Company announced that it had filed and obtained a receipt for the Prospectus with the securities regulators in each of the provinces and territories of Canada, except Quebec.
  • On August 25, 2021, we announced the closing of a public offering for gross proceeds of US$20,125,000 (CDN$25,522,525).
  • On October 7, 2021, we announced that we would hold a special general meeting of shareholders (the “Special Meeting”) on December 1, 2021. We set October 18, 2021, as the record date for the Special Meeting. The purpose of the Special Meeting is to ask shareholders to grant the Board of Directors the authority, exercisable in the Board’s discretion, to consolidate (or reverse split) the Company’s issued and outstanding common shares in furtherance of a potential listing of the Company’s shares on a stock exchange in the United States.

People

  • On September 1, 2021, the Company appointed Josh Mandel-Brehm to the board of directors. Mr. Mandel-Brehm has held various key business development and operations leadership roles at leading biotechnology companies.
  • On September 23, 2021, the Company appointed Maggie Shafmaster, JD, PhD, to the board of directors. Dr Shafmaster has approximately 30 years of experience providing intellectual property advice to biotechnology and pharmaceutical industries.

On October 22, 2021, the Company announced the expansion of its senior management team. The following changes were announced:

  • Eugene Williams, formerly Executive Chairman, takes on the role of Chairman and Chief Executive Officer (“CEO”), with immediate effect.
  • Dr. Elliot Goldstein resigned from his current role as CEO with immediate effect and continues to support us as President and special consultant to the CEO.
  • Gavin Malenfant joins our senior management team as Chief Operating Officer. Mr. Malenfant brings more than 30 years of biopharmaceutical experience to our team, with special focus on providing expert management and oversight of drug development programs. The top priority in the near term will be to support the timely development of the PMN310 program to completion of IND enabling activities, anticipated in the second half of 2022. He will be working with Mr. Williams and the leadership of the PMN310 project team, whose key members include:
    • Michael Grundman, MD, Senior Medical Adviser. Prior to joining the pharmaceutical industry, Dr. Grundman was Associate Director of the Alzheimer’s Disease Cooperative Study at the University of California, San Diego (“UCSD”) and is currently an Adjunct Professor of Neurosciences at UCSD. Dr. Grundman previously served on the FDA Peripheral and Central Nervous System Advisory Committee.
    • Ernest Bush, PhD, Head of Pharmacology/Toxicology. Dr. Bush has 35 years of experience working in the field of biomedical research and development, driving development of innovative therapies for treatment of human diseases. He has served as a consultant in non-clinical development providing advice and insight into Investigational New Drug (“IND”) enabling programs, pre-clinical data-set analysis for due diligence and evaluation and audits of Good Laboratory Practices (“GLP”) bioanalytical and toxicology facilities and studies.
    • Dennis Chen, PhD, Head of Manufacturing. Dennis has more than 25 years of prior pharmaceutical experience in working with companies from virtual to global and all phases of development. Dennis provides Regulatory Affairs, Chemistry, Chemistry, Manufacturing and Controls (“CMC”) and Biopharmaceutical Development support to ProMIS with expertise in peptides, proteins and oligonucleotides.

Financial Results

Results of Operations – Three months ended September 30, 2021 and 2020

The following table summarizes our results of operations for the three months ended September 30, 2021 and 2020:

    Three Months Ended          
    September 30,          
    2021     2020     Change  
       
Revenues   $ 5,101     $     $ 5,101  
Operating expenses                        
Research and development   $ 1,192,865     $ 1,053,769     $ 139,096  
General and administrative     852,695       510,264       342,431  
Total operating expenses     2,045,560       1,564,033       481,527  
Loss from operations     2,040,459       1,564,033       476,426  
Other income     (1,078,483 )           (1,078,483 )
Net loss   $ 961,976     $ 1,564,033     $ (602,057 )


Research and Development

Research and development expenses consist of the following:

    Three Months Ended          
    September 30,          
    2021     2020     Change  
       
Direct research and development expenses by program:   $ 590,940     $ 390,917     $ 200,023  
Indirect research and development expenses:                        
Personnel related (including stock-based compensation)     218,210       488,888       (270,678 )
Consulting expense     180,604       73,885       106,719  
Patent expense     187,734       98,411       89,323  
Amortization expense     15,377       1,668       13,709  
Total research and development expenses   $ 1,192,865     $ 1,053,769     $ 139,096  

The increase in research and development expense for the three months ended September 30, 2021, compared to the three months ended September 30, 2020, is primarily attributed to increased costs associated with external contract research organizations for internal programs of $200,023 as the company ramps up key internal programs, increased patent expense of $89,323 due to increased maintenance fees, increased outside consultants of $106,719 and increase in amortization of property and equipment and intangible asset of $13,709 offset by decreased contracted research salaries and associated costs of $247,792 due to reduction in compensation to management and attrition of contract staff and decreased share-based compensation of $22,886 due to the forfeiture of share options.

General and Administrative

General and administrative expenses consist of the following:

    Three Months Ended
September 30,
         
    2021     2020     Change  
       
Personnel related (including stock-based compensation)   $ 374,055     $ 242,571     $ 131,484  
Professional and consulting fees     470,493       337,446       133,047  
Facility-related and other     8,147       (69,753 )     77,900  
Total general and administrative expenses   $ 852,695     $ 510,264     $ 342,431  

The increase for the three months ended September 30, 2021, compared to the three same period in 2020, is primarily attributable to by an increase in share-based compensation of $212,237 due to the grant of share options, increased legal expense of $52,959, increased to other professional fees of $150,162 and foreign exchange losses of $88,451 due to the foreign exchange on U.S. denominated assets and liabilities offset by a reduction in contracted corporate salaries and associated facility costs of $91,304 due to reduction in compensation to management and attrition of contracted staff and decreased investor relations of $70,074 due to scale down of investor relations activities and consultants

Other Income

The increase in other income is primarily the change in the fair value of the derivative liability associated with the convertible debenture financing warrant liability arising from the August 2021 financing.

Results of Operations – Nine months ended September 30, 2021 and 2020

The following table summarizes our results of operations for the nine months ended September 30, 2021 and 2020:

    Nine Months Ended          
    September 30,          
    2021     2020     Change  
       
Revenues   $ 5,101     $ 1,578     $ 3,523  
Operating expenses                        
Research and development     2,451,985       2,926,242       (474,257 )
General and administrative     1,554,509       2,051,506       (496,997 )
Total operating expenses     4,006,494       4,977,748       (971,254 )
Loss from operations     4,001,393       4,976,170       (974,777 )
Other expense     4,857,346             4,857,346  
Net loss   $ 8,858,739     $ 4,976,170     $ 3,882,569  


Research and Development

Research and development expenses consist of the following:

    Nine Months Ended          
    September 30,          
    2021     2020     Change  
       
Direct research and development expenses by program:   $ 1,173,873     $ 885,179     $ 288,694  
Indirect research and development expenses:                        
Personnel related (including stock-based compensation)     476,161       1,566,083       (1,089,922 )
Consulting expense     370,052       176,898       193,154  
Patent expense     386,018       293,078       92,940  
Other operating costs     45,881       5,004       40,877  
Total research and development expenses   $ 2,451,985     $ 2,926,242     $ (474,257 )

The decrease in research and development expense for the nine months ended September 30, 2021, compared to the nine months ended September 30, 2020, reflects the conservation of cash resources and decreased contract salaries and associated costs of $921,576 due to reduction in compensation to management and attrition of contracted staff and decreased share-based compensation of $168,346 due to forfeiture of unvested/vested share options due to termination of consulting arrangement offset by increased costs associated with external contract research organizations for internal programs of $288,694 as the company ramps up key internal programs, increased patent expense of $92,940 due to increased maintenance fees, increased consulting expense of $193,154 and increase in amortization of property and equipment and intangible asset of $40,877.

General and Administrative

General and administrative expenses consist of the following:

    Nine Months Ended
September 30,
         
    2021     2020     Change  
       
Personnel related (including stock-based compensation)   $ 802,356     $ 910,769     $ (108,413 )
Professional and consulting fees     950,285       1,083,745       (133,460 )
Facility-related and other     (198,132 )     56,992       (255,124 )
Total general and administrative expenses   $ 1,554,509     $ 2,051,506     $ (496,997 )

The decrease for the nine months ended September 30, 2021, compared to the same period in 2020, is primarily attributable to a reduction in contracted corporate salaries and associated facility costs of $342,084 due to reduction in compensation to management and attrition of contracted staff, decreased investor relations of $451,033 due to a reduction of investor relation activities and consultants and foreign exchange gains of $204,561 on U.S. denominated assets and liabilities offset by increased legal expense of $152,531, increased other professional fees of 165,042 and increased share-based compensation of $183,108, related to the grant of share options.

Other Expense

The increase in other expense is primarily the valuation of the derivative liability associated with the convertible debenture financing.

Outlook

Going forward we will focus on therapeutic programs in our core business area of differentiated antibodies for neurodegenerative and other mis-folded protein diseases.

PMN310, ProMIS antibody therapy selective for toxic oligomers in Alzheimer’s disease, is our highest priority. In Q3, we made significant progress, in line with plans, on all the program elements discussed in the prospectus supplement in August 2021, including cell line development, GLP toxicology work, and CMC manufacturing. We are on track to complete all IND enabling work in H2 2022.

The top priority for our scientific validation efforts, largely centered in Dr. Neil Cashman’s lab at UBC, is currently our ALS portfolio. This portfolio includes antibodies targeting mis-folded forms of TDP-43, RACK1, SOD1, and ataxin2. The most advanced of these is the program targeting TDP-43. We have initiated both in vitro assays (assessing the impact of drug on motor neuron cell lines) and in vivo (mouse model) assays and expect readouts over the next several months.

In addition, we are continuing to expand the application of our unique discovery platform, with which we can “rationally design” antibodies to be selective for only mis-folded, pathogenic proteins involved in disease. Our Chief Physics Officer, David Wishart, and his team are pursuing multiple novel targets. We have acquired access to the AlphaFold database of over 300,000 normal protein conformations, which is the starting point for our predictions of conformational epitopes on mis-folded molecular species using our proprietary computational algorithm Collective Coordinates.

About ProMIS Neurosciences, Inc.

ProMIS Neurosciences, Inc. is a development stage biotechnology company focused on discovering and developing antibody therapeutics selectively targeting toxic oligomers implicated in the development and progression of neurodegenerative diseases, in particular Alzheimer’s disease (AD), amyotrophic lateral sclerosis (ALS) and Parkinson’s disease (PD). The Company’s proprietary target discovery engine is based on the use of two complementary techniques. The Company applies its thermodynamic, computational discovery platform – ProMIS™ and Collective Coordinates – to predict novel targets known as Disease Specific Epitopes on the molecular surface of misfolded proteins. Using this unique approach, the Company is developing novel antibody therapeutics for AD, ALS and PD. ProMIS is headquartered in Toronto, Ontario, with offices in Cambridge, Massachusetts. ProMIS is listed on the Toronto Stock Exchange under the symbol PMN, and on the OTCQB Venture Market under the symbol ARFXF.

Visit us at www.promisneurosciences.com, follow us on Twitter and LinkedIn

For Investor Relations please contact:
Alpine Equity Advisors
Nicholas Rigopulos, President
nick@alpineequityadv.com
Tel. 617 901-0785

The TSX has not reviewed and does not accept responsibility for the adequacy or accuracy of this release. This information release contains certain forward-looking information. Such information involves known and unknown risks, uncertainties and other factors that may cause actual results, performance or achievements to be materially different from those implied by statements herein, and therefore these statements should not be read as guarantees of future performance or results. All forward-looking statements are based on the Company’s current beliefs as well as assumptions made by and information currently available to it as well as other factors. Readers are cautioned not to place undue reliance on these forward-looking statements, which speak only as of the date of this press release. Due to risks and uncertainties, including the risks and uncertainties identified by the Company in its public securities filings, actual events may differ materially from current expectations. The Company disclaims any intention or obligation to update or revise any forward-looking statements, whether as a result of new information, future events or otherwise.

Source: ProMIS Neurosciences Inc.

Harte Hanks Generates $0.52 in EPS for Third Quarter of 2021


Harte Hanks Generates $0.52 in EPS for Third Quarter of 2021


Revenue increases 4%, net income of $4.4 million

AUSTIN, Texas
Nov. 11, 2021 /PRNewswire/ — Harte Hanks, Inc. (OTCQX: HRTH), a global customer experience company, today announced financial results for the third quarter ended September 30, 2021.

Third Quarter Operational and Financial Highlights

  • Revenues improved by 4% to 
    $49.6 million, compared to 
    $47.7 million in the same period last year.
  • $0.52 diluted EPS for Third Quarter of 2021 vs. (
    $0.27) for Third Quarter of 2020.
  • Operating income of 
    $4.2 million, compared to operating income of 
    $0.8 million in the same period last year.
  • Net income of 
    $4.4 million, compared to net loss of 
    ($1.6) million in the same period last year.
  • EBITDA improved to 
    $4.8 million compared to 
    $1.5 million in the same period last year.1

The third quarter results by segment were as follows:

1)    Customer Care$19.8 million in revenue, 40% of total – Revenue increased by 
$1.8 million from the previous year quarter and year-over-year EBITDA improved to 
$4.0 million from 
$3.0 million. Customer Care continued to experience strong revenue tailwinds from COVID-related project work. New business wins for the quarter included a healthcare insurance provider to deliver year-round customer care services. The customer chose 
Harte Hanks based on our extensive experience with supporting annual enrollment and our consistent ability to exceed 
Centers for Medicare & Medicaid Services delivery standards.

2)    Fulfillment & Logistics, $15.1 million in revenue, 30% of total – Revenue increased by 
$0.5 million compared to the previous year quarter and year-over-year EBITDA improved to 
$1.7 million from 
$0.3 million. New business wins for the quarter included an international financing company making its 
U.S. debut. Harte Hanks will fulfill point-of-purchase displays, printed sales materials, new customer welcome kits, and trade show equipment.

3)    Marketing Services, $14.7 million revenue, 30% of total – Revenue decreased by 
$0.5 million compared to the previous year quarter and year-over-year EBITDA improved to 
$2.8 million from 
$1.2 million. New business wins for the quarter included a leading health insurance provider. The customer selected 
Harte Hanks to provide strategy, analytics, and creative services to accelerate membership growth.

Harte Hanks CEO,  Brian Linscott, commented: “The new and refocused 
Harte Hanks delivered revenue growth and improved performance in each of our business segments with a 
$6.0 million positive swing in net income. Today, 
Harte Hanks is strategically well-positioned, offering compelling value to a growing roster of top-tier customers designed to enable sustained profitability. We remain focused on executing margin improvement initiatives across all segments. Looking into next year, we anticipate positive net income for the full year.”

Third Quarter 2021 Results

Third quarter revenues were $49.6 million, up from 
$47.7 million a year ago and up sequentially from 
$0.3 million in the second quarter of 2021. Continued growth in our Customer Care segment led our third quarter performance.

Third quarter operating income was 
$4.2 million, compared to 
$0.8 million in the third quarter of 2020. The improvement resulted from the Company’s revenue increases and cost reduction efforts, including an 8% reduction in production and distribution expense as well as a 34% reduction in restructuring expense.

Third quarter Adjusted Operating Income2 was 
$5.5 million, compared to 
$2.5 million in the third quarter of 2020. The improvement in Adjusted Operating Income reflects improved revenue and continued cost-cutting actions. Income attributable to common stockholders for the third quarter was $3.7 million, or $0.54 and 
$0.52 per basic and diluted share, respectively. 

Conference Call Information

The Company will host a conference call and live webcast to discuss these results today at 4:30 p.m. EST. To access the live call, please dial (888) 506-0059 (toll free) or (973) 528-0048 and, if requested, reference conference ID 663451. The conference call will also be webcast live in the Investors Events section of the 
Harte Hanks website https://investors.hartehanks.com/.

Following the conclusion of the live call, a telephonic replay will be available for 72 hours by dialing (877) 481-4010 or (919) 882-2331 and using the replay passcode 43515. The replay will also be available for at least 90 days in the Investors Events section of the 
Harte Hanks website.

About Harte Hanks: 


Harte Hanks
 (OTCMKTS: HRTH) is a leading global customer experience company whose mission is to partner with clients to provide them with CX strategy, data-driven analytics and actionable insights combined with seamless program execution to better understand, attract, and engage their customers.

Using its unparalleled resources and award-winning talent in the areas of Customer Care, Fulfillment and Logistics, and Marketing Services, 
Harte Hanks has a proven track record of driving results for some of the world’s premier brands including 
Bank of America, GlaxoSmithKline, Unilever, Pfizer, HBOMax, Volvo, 
Ford, FedEx, Midea, Sony, and IBM among others.  
Harte Hanks has over 2,500 employees in offices across the 
Americas
Europe and 
Asia Pacific.

For more information visit hartehanks.com

Cautionary Note Regarding Forward-Looking Statements:

Our press release and related earnings conference call contain “forward-looking statements” within the meaning of U.S. federal securities laws. All such statements are qualified by this cautionary note, provided pursuant to the safe harbor provisions of Section 27A of the Securities Act of 1933 and Section 21E of the Securities Exchange Act of 1934.  Statements other than historical facts are forward-looking and may be identified by words such as “may,” “will,” “expects,” “believes,” “anticipates,” “plans,” “estimates,” “seeks,” “could,” “intends,” or words of similar meaning.  These forward-looking statements are based on current information, expectations and estimates and involve risks, uncertainties, assumptions and other factors that are difficult to predict and that could cause actual results to vary materially from what is expressed in or indicated by the forward-looking statements.  In that event, our business, financial condition, results of operations or liquidity could be materially adversely affected and investors in our securities could lose part or all of their investments.  These risks, uncertainties, assumptions and other factors include: (a) local, national and international economic and business conditions, including (i) the outbreak of diseases, such as the COVID-19 coronavirus and new variants thereof, which has curtailed travel to and from certain countries and geographic regions, created supply chain disruption and shortages, disrupted business operations and reduced consumer spending,  (ii) market conditions that may adversely impact marketing expenditures and (iii) the impact of economic environments and competitive pressures on the financial condition, marketing expenditures and activities of our clients and prospects; (b) the demand for our products and services by clients and prospective clients, including (i) the willingness of existing clients to maintain or increase their spending on products and services that are or remain profitable for us, and (ii) our ability to predict changes in client needs and preferences; (c) economic and other business factors that impact the industry verticals we serve, including competition and consolidation of current and prospective clients, vendors and partners in these verticals; (d) our ability to manage and timely adjust our facilities, capacity, workforce and cost structure to effectively serve our clients; (e) our ability to improve our processes and to provide new products and services in a timely and cost-effective manner though development, license, partnership or acquisition; (f) our ability to protect our facilities against security breaches and other interruptions and to protect sensitive personal information of our clients and their customers; (g) our ability to respond to increasing concern, regulation and legal action over consumer privacy issues, including changing requirements for collection, processing and use of information; (h) the impact of privacy and other regulations, including restrictions on unsolicited marketing communications and other consumer protection laws; (i) fluctuations in fuel prices, paper prices, postal rates and postal delivery schedules; (j) the number of shares, if any, that we may repurchase in connection with our repurchase program; (k) unanticipated developments regarding litigation or other contingent liabilities; (l) our ability to complete anticipated divestitures and reorganizations, including cost-saving initiatives; (m) our ability to realize the expected tax refunds; and (n) other factors discussed from time to time in our filings with the Securities and Exchange Commission, including under “Item 1A. Risk Factors” in our Annual Report on Form 10-K for the year ended December 31, 2020 which was filed on March 24, 2021. The forward-looking statements in this press release and our related earnings conference call are made only as of the date hereof, and we undertake no obligation to update publicly any forward-looking statement, even if new information becomes available or other events occur in the future.

Supplemental Non-GAAP Financial Measures:

The Company reports its financial results in accordance with generally accepted accounting principles (“GAAP”). In this press release and our related earnings conference call, however, the Company may use certain non-GAAP measures of financial performance in order to provide investors with a better understanding of operating results and underlying trends to assess the Company’s performance and liquidity. We have presented herein a reconciliation of these measures to the most directly comparable GAAP financial measure.

The Company presents the non-GAAP financial measure “Adjusted Operating Income (Loss)” as a measure useful to both management and investors in their analysis of the Company’s financial results because it facilitates a period-to-period comparison of Operating Revenue and Operating Income (Loss) by excluding restructuring expense, impairment expense and stock-based compensation. The most directly comparable measure for this non-GAAP financial measure is Operating Income (Loss).

The Company also presents the non-GAAP financial measure “Adjusted EBITDA” as a supplemental measure of operating performance in order to provide an improved understanding of underlying performance trends. The Company defines “Adjusted EBITDA” as earnings before interest expense net, income tax expense (benefit), depreciation expense, restructuring expense, impairment expense, stock-based compensation expense, and other non-cash expenses. The most directly comparable measure for Adjusted EBITDA is Net Income (Loss). We believe Adjusted EBITDA is an important performance metric because it facilitates the analysis of our results, exclusive of certain non-cash items, including items which do not directly correlate to our business operations; however, we urge investors to review the reconciliation of non-GAAP Adjusted EBITDA to the comparable GAAP Net Income (Loss), which is included in this press release, and not to rely on any single financial measure to evaluate the Company’s financial performance.

The foregoing measures do not serve as a substitute and should not be construed as a substitute for GAAP performance, but provide supplemental information concerning our performance that our investors and we find useful. The Company evaluates its operating performance based on several measures, including these non-GAAP financial measures. The Company believes that the presentation of these non-GAAP financial measures in this press release and earnings conference call presentations are useful supplemental financial measures of operating performance for investors because they facilitate investors’ ability to evaluate the operational strength of the Company’s business. However, there are limitations to the use of these non-GAAP measures, including that they may not be calculated the same by other companies in our industry limiting their use as a tool to compare results. Any supplemental non-GAAP financial measures referred to herein are not calculated in accordance with GAAP and they should not be considered in isolation or as substitutes for the most comparable GAAP financial measures.

EBITDA is the Company’s measure of segment profitability. For additional information please see the Company’s Quarterly Report on Form 10-Q for the quarter ended 
September 30, 2021.

As used herein, ”
Harte Hanks” or “the Company” refers to Harte Hanks, Inc. and/or its applicable operating subsidiaries, as the context may require. 
Harte Hanks’ logo and name are trademarks of Harte Hanks.

Investor Relations Contact:

Rob Fink
FNK IR
HRTH@fnkir.com
646-809-4048

_______________________________

1 EBITDA is non-GAAP financial measures.  See “Supplemental Non-GAAP Financial Measures” below.  EBITDA is also the Company’s measure of segment profitability.  For additional information please see the Company’s Quarterly Report on Form 10-Q for the quarter ended September 30, 2021.

2 Adjusted Operating Income is a non-GAAP financial measure.  See “Supplemental Non-GAAP Financial Measures” below. 


Harte Hanks, Inc.

Condensed Consolidated Statements of Operations (Unaudited)


Three Months Ended
September 30,


Nine Months Ended
September 30,

In thousands, except per share data


2021


2020


2021


2020

Revenues


$          49,597


$     47,702


$   142,610


$     129,825

Operating expenses


Labor


27,165


27,041


81,883


76,601

Production and distribution


12,146


13,176


35,875


36,940

Advertising, selling, general and administrative


4,516


4,540


13,228


15,582

Restructuring expense


937


1,419


4,880


8,005

Depreciation expense


607


741


1,968


2,905

Total operating expenses


45,371


46,917


137,834


140,033

Operating Income (loss)


4,226


785


4,776


(10,208)

Other (income) expenses


Interest expense, net


222


274


645


882

Gain on extinguishment of debt (Paycheck Protection Program Term Note)


(10,000)


Other, net


(572)


2,185


(102)


4,511

Total other (income) expenses


(350)


2,459


(9,457)


5,393

Income (loss) before income taxes


4,576


(1,674)


14,233


(15,601)

Income tax expense (benefit)


172


(53)


1,018


(12,863)

Net income (loss)


4,404


(1,621)


13,215


(2,738)

Less Preferred Stock dividends


125


125


372


372

Less: Earnings attributable to participating securities


543


1,661


Income (loss) attributable to common stockholders


$            3,736


$     (1,746)


$     11,182


$     (3,110)


Income (loss) per common share


Basic


$              0.54


$       (0.27)


$        1.66


$       (0.48)

Diluted


$              0.52


$       (0.27)


$        1.57


$       (0.48)


Weighted-average common shares outstanding


Basic


6,889


6,523


6,743


6,432

Diluted


7,162


6,523


7,153


6,432


Harte Hanks, Inc.

Condensed Consolidated Balance Sheets (Unaudited)


In thousands, except per share data


September 30, 2021


December 31, 2020


ASSETS


Current Assets


Cash and cash equivalents


$           16,044


$              29,408

Restricted cash


2,645


4,154

Accounts receivable (less allowance for doubtful accounts of $411 at
September 30, 2020 and $241 at December 31, 2020)


52,574


41,533

Contract assets


333


613

Prepaid expenses


2,436


2,256

Prepaid income tax and income tax receivable


7,492


7,388

Other current assets


954


886

Total current assets


82,478


86,238


Net property, plant and equipment


7,140


5,878

Right-of-use assets


20,379


24,750

Other assets


2,467


2,632

   Total assets


$        112,464


$            119,498


LIABILITIES AND STOCKHOLDERS’ DEFICIT


Current liabilities


Accounts payable and accrued expenses


$          16,550


$              16,294

Accrued payroll and related expenses


6,256


5,248

Short-term debt


4,926

Deferred revenue and customer advances


4,977


4,661

Customer postage and program deposits


5,453


6,497

Other current liabilities


2,535


2,903

Short-term lease liabilities


6,615


6,663

Total current liabilities


42,386


47,192


Long-term debt


13,100


22,174

Pensions


64,341


67,490

Long-term lease liabilities


17,546


21,295

Other long-term liabilities


3,755


4,747

Total liabilities


141,128


162,898


Preferred Stock


9,723


9,723


Stockholders’ deficit


Common stock


12,121


12,121

Additional paid-in capital


290,333


383,043

Retained earnings


809,338


796,123

Less treasury stock


(1,085,312)


(1,178,799)

Accumulated other comprehensive loss


(64,867)


(65,611)

Total stockholders’ deficit


(38,387)


(53,123)


Total liabilities, Preferred Stock and stockholders’ deficit


$         112,464


$            119,498


Harte Hanks, Inc.

Reconciliations of Non-GAAP Financial Measures (Unaudited)


Three Months Ended
September 30,


Nine Months Ended
September 30,

In thousands, except per share data


2021


2020


2021


2020

Net Income (loss)


$        4,404


$     (1,621)


$ 13,215


$     (2,738)

Gain on extinguishment of debt


(10,000)


Income tax expense (benefit)


172


(53)


1,018


(12,863)

Interest expense, net


222


274


645


882

Other, net


(572)


2,185


(102)


4,511

Depreciation expense


607


741


1,968


2,905

EBITDA


$        4,833


$      1,526


$   6,744


$     (7,303)


Restructuring expense


937


1,419


4,880


8,005

Stock-based compensation


329


271


1,092


590

Adjusted EBITDA


$        6,099


$      3,216


$ 12,716


$      1,292


Operating income (loss)


$        4,226


$         785


$   4,776


$   (10,208)

Restructuring expense


937


1,419


4,880


8,005

Stock-based compensation


329


271


1,092


590

Adjusted operating income (loss)


$        5,492


$      2,475


$ 10,748


$     (1,613)

Adjusted operating margin (a)


11.1%


5.2%


7.5%


(1.2)%


(a) Adjusted Operating Margin equals Adjusted Operating Income (loss) divided by Revenues


Harte Hanks, Inc.

Statement of Operations by Segments (Unaudited)


Quarter ended September 30,


Marketing
Services 


Customer
Care


Fulfillment &
Logistics Services 


Restructuring


Unallocated
Corporate


Total


 (In thousands) 


2021


Revenues


$      14,729


$   19,768


$                  15,100


$                  —


$                    —


$    49,597

Segment Operating Expense


$      10,937


$   15,087


$                  12,695


$                  —


$               5,108


$    43,827

Restructuring


$              —


$           —


$                          —


$               937


$                    —


$         937

Contribution margin


$        3,792


$     4,681


$                     2,405


$              (937)


$             (5,108)


$      4,833

Overhead Allocation


$        1,020


$        667


$                        712


$                  —


$             (2,399)


$            —

EBITDA


$        2,772


$     4,014


$                     1,693


$              (937)


$             (2,709)


$      4,833

Depreciation 


$           117


$        195


$                        182


$                  —


$                  113


$         607

Operating income (loss)


$        2,655


$     3,819


$                     1,511


$              (937)


$             (2,822)


$      4,226


2020


Revenues


$      15,217


$   17,933


$                  14,552


$                  —


$                     —


$    47,702

Segment Operating Expense


$      12,835


$   14,097


$                  13,392


$                  —


$               4,433


$    44,757

Restructuring


$             —


$          —


$                          —


$            1,419


$                    —


$      1,419

Contribution margin


$        2,382


$     3,836


$                     1,160


$          (1,419)


$             (4,433)


$      1,526

Overhead Allocation


$        1,173


$        827


$                        886


$                 —


$             (2,886)


$           —

EBITDA


$        1,209


$     3,009


$                        274


$          (1,419)


$             (1,547)


$      1,526

Depreciation 


$           141


$        323


$                        138


$                 —


$                  139


$         741

Operating income (loss)


$        1,068


$     2,686


$                        136


$          (1,419)


$             (1,686)


$         785


SOURCE 
Harte Hanks, Inc.

Lithium Recycling is an EV Opportunity Not Yet on Many Investors’ Radar


Image Credit: Steve Jurvetson (Flickr)

Lithium Recycling Market Expected to Boom 20% Per Year with Battery Demand


The skyrocketing use of batteries and growing plans to include lithium-ion (Li-ion) batteries as a solution to many of today’s environmental initiatives has challenges. Not the least of these is that the mining of lithium has a number of negative impacts on the environment. One of these is water pollution from chemical leakage. From these issues, a rapidly growing recycling industry is blooming. The rapidly expanding lithium battery recycling business helps manufacturers ensure a sufficient quantity of lithium and other components for the continued creation of batteries and other applications.

The Market

As the need for minerals and other materials for Li-ion batteries burgeons from EV growth, the need for li-ion battery recycling methods and facilities has dramatically increased. According to Research
and Markets
 the market for recycling these batteries was $161.4 million in 2020. It is expected to grow almost 20% a year and is estimated to be 614% larger in 2030. This falls in line with other expectations. According to the International Energy
Agency (IEA)’s Sustainable Development Scenario,
the number of electric vehicles (excluding two- and three-wheelers) across the globe will increase to 245 million units by 2030, this, in turn, is expected to encourage the recycling of lithium-ion batteries to meet the future demand. Investors may find looking at companies involved in battery recycling, interesting and an alternative to expose your portfolio to the growth of EVs.

Investing
in Li-ion Recycling

One company accelerating its plans and making headway is Comstock Mining (LODE). Management has spent the last six months developing their capacity and expects to conduct lithium recycling in the first and second quarters of 2022. In a research report released today, Mark Reichmann, Noble Senior Natural Resources Analyst, discusses Comstock’s full transformation plans. The report explains many of Comstock’s other “green” initiatives, including mercury remediation, hemp-based fuels, and cellulosic fuels. Also, in the report, the analyst provides reasons for his current rating and price targets.

Take-Away

The pace of EVs expected to take to the highways over the next ten years, along with increasing needs for clean ion electricity storage, along the grid and in other applications, is stressing the supply and availability of lithium for manufacturing. Lithium mining is also a dirty process that is not considered environmentally friendly.

A growing solution is recycling which could provide an interesting opportunity for investors looking for alternative ways to be involved in the growth of the EV and green fuel initiatives.

Channelchek provides top-tier research to your inbox without the burden of a paywall; register now.

Paul Hoffman

Managing Editor, Channelchek

Suggested Reading:


Future for Lithium Prices Looks Strong Due to Expected Demand Growth for Evs


Lithium-Ion vs Hydrogen Fuel Cell


Investment Opportunities in Hydrogen


How Does the Buffett Gates Natrium Reactor Work?


Sources:

Noble Capital Markets Research
(11/12/21)

Research and Markets Li-ion Report

IEA’s Sustainable Development
Scenario


Stay up to date. Follow us:


Lithium Recycling is an EV Opportunity Not Yet on Many Investors Radar


Image Credit: Steve Jurvetson (Flickr)

Lithium Recycling Market Expected to Boom 20% Per Year with Battery Demand


The skyrocketing use of batteries and growing plans to include lithium-ion (Li-ion) batteries as a solution to many of today’s environmental initiatives has challenges. Not the least of these is that the mining of lithium has a number of negative impacts on the environment. One of these is water pollution from chemical leakage. From these issues, a rapidly growing recycling industry is blooming. The rapidly expanding lithium battery recycling business helps manufacturers ensure a sufficient quantity of lithium and other components for the continued creation of batteries and other applications.

The Market

As the need for minerals and other materials for Li-ion batteries burgeons from EV growth, the need for li-ion battery recycling methods and facilities has dramatically increased. According to Research
and Markets
 the market for recycling these batteries was $161.4 million in 2020. It is expected to grow almost 20% a year and is estimated to be 614% larger in 2030. This falls in line with other expectations. According to the International Energy
Agency (IEA)’s Sustainable Development Scenario,
the number of electric vehicles (excluding two- and three-wheelers) across the globe will increase to 245 million units by 2030, this, in turn, is expected to encourage the recycling of lithium-ion batteries to meet the future demand. Investors may find looking at companies involved in battery recycling, interesting and an alternative to expose your portfolio to the growth of EVs.

Investing
in Li-ion Recycling

One company accelerating its plans and making headway is Comstock Mining (LODE). Management has spent the last six months developing their capacity and expects to conduct lithium recycling in the first and second quarters of 2022. In a research report released today, Mark Reichmann, Noble Senior Natural Resources Analyst, discusses Comstock’s full transformation plans. The report explains many of Comstock’s other “green” initiatives, including mercury remediation, hemp-based fuels, and cellulosic fuels. Also, in the report, the analyst provides reasons for his current rating and price targets.

Take-Away

The pace of EVs expected to take to the highways over the next ten years, along with increasing needs for clean ion electricity storage, along the grid and in other applications, is stressing the supply and availability of lithium for manufacturing. Lithium mining is also a dirty process that is not considered environmentally friendly.

A growing solution is recycling which could provide an interesting opportunity for investors looking for alternative ways to be involved in the growth of the EV and green fuel initiatives.

Channelchek provides top-tier research to your inbox without the burden of a paywall; register now.

Paul Hoffman

Managing Editor, Channelchek

Suggested Reading:


Future for Lithium Prices Looks Strong Due to Expected Demand Growth for Evs


Lithium-Ion vs Hydrogen Fuel Cell


Investment Opportunities in Hydrogen


How Does the Buffett Gates Natrium Reactor Work?


Sources:

Noble Capital Markets Research
(11/12/21)

Research and Markets Li-ion Report

IEA’s Sustainable Development
Scenario


Stay up to date. Follow us:


Release – Harte Hanks Generates $0.52 in EPS for Third Quarter of 2021


Harte Hanks Generates $0.52 in EPS for Third Quarter of 2021


Revenue increases 4%, net income of $4.4 million

AUSTIN, Texas
Nov. 11, 2021 /PRNewswire/ — Harte Hanks, Inc. (OTCQX: HRTH), a global customer experience company, today announced financial results for the third quarter ended September 30, 2021.

Third Quarter Operational and Financial Highlights

  • Revenues improved by 4% to 
    $49.6 million, compared to 
    $47.7 million in the same period last year.
  • $0.52 diluted EPS for Third Quarter of 2021 vs. (
    $0.27) for Third Quarter of 2020.
  • Operating income of 
    $4.2 million, compared to operating income of 
    $0.8 million in the same period last year.
  • Net income of 
    $4.4 million, compared to net loss of 
    ($1.6) million in the same period last year.
  • EBITDA improved to 
    $4.8 million compared to 
    $1.5 million in the same period last year.1

The third quarter results by segment were as follows:

1)    Customer Care$19.8 million in revenue, 40% of total – Revenue increased by 
$1.8 million from the previous year quarter and year-over-year EBITDA improved to 
$4.0 million from 
$3.0 million. Customer Care continued to experience strong revenue tailwinds from COVID-related project work. New business wins for the quarter included a healthcare insurance provider to deliver year-round customer care services. The customer chose 
Harte Hanks based on our extensive experience with supporting annual enrollment and our consistent ability to exceed 
Centers for Medicare & Medicaid Services delivery standards.

2)    Fulfillment & Logistics, $15.1 million in revenue, 30% of total – Revenue increased by 
$0.5 million compared to the previous year quarter and year-over-year EBITDA improved to 
$1.7 million from 
$0.3 million. New business wins for the quarter included an international financing company making its 
U.S. debut. Harte Hanks will fulfill point-of-purchase displays, printed sales materials, new customer welcome kits, and trade show equipment.

3)    Marketing Services, $14.7 million revenue, 30% of total – Revenue decreased by 
$0.5 million compared to the previous year quarter and year-over-year EBITDA improved to 
$2.8 million from 
$1.2 million. New business wins for the quarter included a leading health insurance provider. The customer selected 
Harte Hanks to provide strategy, analytics, and creative services to accelerate membership growth.

Harte Hanks CEO,  Brian Linscott, commented: “The new and refocused 
Harte Hanks delivered revenue growth and improved performance in each of our business segments with a 
$6.0 million positive swing in net income. Today, 
Harte Hanks is strategically well-positioned, offering compelling value to a growing roster of top-tier customers designed to enable sustained profitability. We remain focused on executing margin improvement initiatives across all segments. Looking into next year, we anticipate positive net income for the full year.”

Third Quarter 2021 Results

Third quarter revenues were $49.6 million, up from 
$47.7 million a year ago and up sequentially from 
$0.3 million in the second quarter of 2021. Continued growth in our Customer Care segment led our third quarter performance.

Third quarter operating income was 
$4.2 million, compared to 
$0.8 million in the third quarter of 2020. The improvement resulted from the Company’s revenue increases and cost reduction efforts, including an 8% reduction in production and distribution expense as well as a 34% reduction in restructuring expense.

Third quarter Adjusted Operating Income2 was 
$5.5 million, compared to 
$2.5 million in the third quarter of 2020. The improvement in Adjusted Operating Income reflects improved revenue and continued cost-cutting actions. Income attributable to common stockholders for the third quarter was $3.7 million, or $0.54 and 
$0.52 per basic and diluted share, respectively. 

Conference Call Information

The Company will host a conference call and live webcast to discuss these results today at 4:30 p.m. EST. To access the live call, please dial (888) 506-0059 (toll free) or (973) 528-0048 and, if requested, reference conference ID 663451. The conference call will also be webcast live in the Investors Events section of the 
Harte Hanks website https://investors.hartehanks.com/.

Following the conclusion of the live call, a telephonic replay will be available for 72 hours by dialing (877) 481-4010 or (919) 882-2331 and using the replay passcode 43515. The replay will also be available for at least 90 days in the Investors Events section of the 
Harte Hanks website.

About Harte Hanks: 


Harte Hanks
 (OTCMKTS: HRTH) is a leading global customer experience company whose mission is to partner with clients to provide them with CX strategy, data-driven analytics and actionable insights combined with seamless program execution to better understand, attract, and engage their customers.

Using its unparalleled resources and award-winning talent in the areas of Customer Care, Fulfillment and Logistics, and Marketing Services, 
Harte Hanks has a proven track record of driving results for some of the world’s premier brands including 
Bank of America, GlaxoSmithKline, Unilever, Pfizer, HBOMax, Volvo, 
Ford, FedEx, Midea, Sony, and IBM among others.  
Harte Hanks has over 2,500 employees in offices across the 
Americas
Europe and 
Asia Pacific.

For more information visit hartehanks.com

Cautionary Note Regarding Forward-Looking Statements:

Our press release and related earnings conference call contain “forward-looking statements” within the meaning of U.S. federal securities laws. All such statements are qualified by this cautionary note, provided pursuant to the safe harbor provisions of Section 27A of the Securities Act of 1933 and Section 21E of the Securities Exchange Act of 1934.  Statements other than historical facts are forward-looking and may be identified by words such as “may,” “will,” “expects,” “believes,” “anticipates,” “plans,” “estimates,” “seeks,” “could,” “intends,” or words of similar meaning.  These forward-looking statements are based on current information, expectations and estimates and involve risks, uncertainties, assumptions and other factors that are difficult to predict and that could cause actual results to vary materially from what is expressed in or indicated by the forward-looking statements.  In that event, our business, financial condition, results of operations or liquidity could be materially adversely affected and investors in our securities could lose part or all of their investments.  These risks, uncertainties, assumptions and other factors include: (a) local, national and international economic and business conditions, including (i) the outbreak of diseases, such as the COVID-19 coronavirus and new variants thereof, which has curtailed travel to and from certain countries and geographic regions, created supply chain disruption and shortages, disrupted business operations and reduced consumer spending,  (ii) market conditions that may adversely impact marketing expenditures and (iii) the impact of economic environments and competitive pressures on the financial condition, marketing expenditures and activities of our clients and prospects; (b) the demand for our products and services by clients and prospective clients, including (i) the willingness of existing clients to maintain or increase their spending on products and services that are or remain profitable for us, and (ii) our ability to predict changes in client needs and preferences; (c) economic and other business factors that impact the industry verticals we serve, including competition and consolidation of current and prospective clients, vendors and partners in these verticals; (d) our ability to manage and timely adjust our facilities, capacity, workforce and cost structure to effectively serve our clients; (e) our ability to improve our processes and to provide new products and services in a timely and cost-effective manner though development, license, partnership or acquisition; (f) our ability to protect our facilities against security breaches and other interruptions and to protect sensitive personal information of our clients and their customers; (g) our ability to respond to increasing concern, regulation and legal action over consumer privacy issues, including changing requirements for collection, processing and use of information; (h) the impact of privacy and other regulations, including restrictions on unsolicited marketing communications and other consumer protection laws; (i) fluctuations in fuel prices, paper prices, postal rates and postal delivery schedules; (j) the number of shares, if any, that we may repurchase in connection with our repurchase program; (k) unanticipated developments regarding litigation or other contingent liabilities; (l) our ability to complete anticipated divestitures and reorganizations, including cost-saving initiatives; (m) our ability to realize the expected tax refunds; and (n) other factors discussed from time to time in our filings with the Securities and Exchange Commission, including under “Item 1A. Risk Factors” in our Annual Report on Form 10-K for the year ended December 31, 2020 which was filed on March 24, 2021. The forward-looking statements in this press release and our related earnings conference call are made only as of the date hereof, and we undertake no obligation to update publicly any forward-looking statement, even if new information becomes available or other events occur in the future.

Supplemental Non-GAAP Financial Measures:

The Company reports its financial results in accordance with generally accepted accounting principles (“GAAP”). In this press release and our related earnings conference call, however, the Company may use certain non-GAAP measures of financial performance in order to provide investors with a better understanding of operating results and underlying trends to assess the Company’s performance and liquidity. We have presented herein a reconciliation of these measures to the most directly comparable GAAP financial measure.

The Company presents the non-GAAP financial measure “Adjusted Operating Income (Loss)” as a measure useful to both management and investors in their analysis of the Company’s financial results because it facilitates a period-to-period comparison of Operating Revenue and Operating Income (Loss) by excluding restructuring expense, impairment expense and stock-based compensation. The most directly comparable measure for this non-GAAP financial measure is Operating Income (Loss).

The Company also presents the non-GAAP financial measure “Adjusted EBITDA” as a supplemental measure of operating performance in order to provide an improved understanding of underlying performance trends. The Company defines “Adjusted EBITDA” as earnings before interest expense net, income tax expense (benefit), depreciation expense, restructuring expense, impairment expense, stock-based compensation expense, and other non-cash expenses. The most directly comparable measure for Adjusted EBITDA is Net Income (Loss). We believe Adjusted EBITDA is an important performance metric because it facilitates the analysis of our results, exclusive of certain non-cash items, including items which do not directly correlate to our business operations; however, we urge investors to review the reconciliation of non-GAAP Adjusted EBITDA to the comparable GAAP Net Income (Loss), which is included in this press release, and not to rely on any single financial measure to evaluate the Company’s financial performance.

The foregoing measures do not serve as a substitute and should not be construed as a substitute for GAAP performance, but provide supplemental information concerning our performance that our investors and we find useful. The Company evaluates its operating performance based on several measures, including these non-GAAP financial measures. The Company believes that the presentation of these non-GAAP financial measures in this press release and earnings conference call presentations are useful supplemental financial measures of operating performance for investors because they facilitate investors’ ability to evaluate the operational strength of the Company’s business. However, there are limitations to the use of these non-GAAP measures, including that they may not be calculated the same by other companies in our industry limiting their use as a tool to compare results. Any supplemental non-GAAP financial measures referred to herein are not calculated in accordance with GAAP and they should not be considered in isolation or as substitutes for the most comparable GAAP financial measures.

EBITDA is the Company’s measure of segment profitability. For additional information please see the Company’s Quarterly Report on Form 10-Q for the quarter ended 
September 30, 2021.

As used herein, ”
Harte Hanks” or “the Company” refers to Harte Hanks, Inc. and/or its applicable operating subsidiaries, as the context may require. 
Harte Hanks’ logo and name are trademarks of Harte Hanks.

Investor Relations Contact:

Rob Fink
FNK IR
HRTH@fnkir.com
646-809-4048

_______________________________

1 EBITDA is non-GAAP financial measures.  See “Supplemental Non-GAAP Financial Measures” below.  EBITDA is also the Company’s measure of segment profitability.  For additional information please see the Company’s Quarterly Report on Form 10-Q for the quarter ended September 30, 2021.

2 Adjusted Operating Income is a non-GAAP financial measure.  See “Supplemental Non-GAAP Financial Measures” below. 


Harte Hanks, Inc.

Condensed Consolidated Statements of Operations (Unaudited)


Three Months Ended
September 30,


Nine Months Ended
September 30,

In thousands, except per share data


2021


2020


2021


2020

Revenues


$          49,597


$     47,702


$   142,610


$     129,825

Operating expenses


Labor


27,165


27,041


81,883


76,601

Production and distribution


12,146


13,176


35,875


36,940

Advertising, selling, general and administrative


4,516


4,540


13,228


15,582

Restructuring expense


937


1,419


4,880


8,005

Depreciation expense


607


741


1,968


2,905

Total operating expenses


45,371


46,917


137,834


140,033

Operating Income (loss)


4,226


785


4,776


(10,208)

Other (income) expenses


Interest expense, net


222


274


645


882

Gain on extinguishment of debt (Paycheck Protection Program Term Note)


(10,000)


Other, net


(572)


2,185


(102)


4,511

Total other (income) expenses


(350)


2,459


(9,457)


5,393

Income (loss) before income taxes


4,576


(1,674)


14,233


(15,601)

Income tax expense (benefit)


172


(53)


1,018


(12,863)

Net income (loss)


4,404


(1,621)


13,215


(2,738)

Less Preferred Stock dividends


125


125


372


372

Less: Earnings attributable to participating securities


543


1,661


Income (loss) attributable to common stockholders


$            3,736


$     (1,746)


$     11,182


$     (3,110)


Income (loss) per common share


Basic


$              0.54


$       (0.27)


$        1.66


$       (0.48)

Diluted


$              0.52


$       (0.27)


$        1.57


$       (0.48)


Weighted-average common shares outstanding


Basic


6,889


6,523


6,743


6,432

Diluted


7,162


6,523


7,153


6,432


Harte Hanks, Inc.

Condensed Consolidated Balance Sheets (Unaudited)


In thousands, except per share data


September 30, 2021


December 31, 2020


ASSETS


Current Assets


Cash and cash equivalents


$           16,044


$              29,408

Restricted cash


2,645


4,154

Accounts receivable (less allowance for doubtful accounts of $411 at
September 30, 2020 and $241 at December 31, 2020)


52,574


41,533

Contract assets


333


613

Prepaid expenses


2,436


2,256

Prepaid income tax and income tax receivable


7,492


7,388

Other current assets


954


886

Total current assets


82,478


86,238


Net property, plant and equipment


7,140


5,878

Right-of-use assets


20,379


24,750

Other assets


2,467


2,632

   Total assets


$        112,464


$            119,498


LIABILITIES AND STOCKHOLDERS’ DEFICIT


Current liabilities


Accounts payable and accrued expenses


$          16,550


$              16,294

Accrued payroll and related expenses


6,256


5,248

Short-term debt


4,926

Deferred revenue and customer advances


4,977


4,661

Customer postage and program deposits


5,453


6,497

Other current liabilities


2,535


2,903

Short-term lease liabilities


6,615


6,663

Total current liabilities


42,386


47,192


Long-term debt


13,100


22,174

Pensions


64,341


67,490

Long-term lease liabilities


17,546


21,295

Other long-term liabilities


3,755


4,747

Total liabilities


141,128


162,898


Preferred Stock


9,723


9,723


Stockholders’ deficit


Common stock


12,121


12,121

Additional paid-in capital


290,333


383,043

Retained earnings


809,338


796,123

Less treasury stock


(1,085,312)


(1,178,799)

Accumulated other comprehensive loss


(64,867)


(65,611)

Total stockholders’ deficit


(38,387)


(53,123)


Total liabilities, Preferred Stock and stockholders’ deficit


$         112,464


$            119,498


Harte Hanks, Inc.

Reconciliations of Non-GAAP Financial Measures (Unaudited)


Three Months Ended
September 30,


Nine Months Ended
September 30,

In thousands, except per share data


2021


2020


2021


2020

Net Income (loss)


$        4,404


$     (1,621)


$ 13,215


$     (2,738)

Gain on extinguishment of debt


(10,000)


Income tax expense (benefit)


172


(53)


1,018


(12,863)

Interest expense, net


222


274


645


882

Other, net


(572)


2,185


(102)


4,511

Depreciation expense


607


741


1,968


2,905

EBITDA


$        4,833


$      1,526


$   6,744


$     (7,303)


Restructuring expense


937


1,419


4,880


8,005

Stock-based compensation


329


271


1,092


590

Adjusted EBITDA


$        6,099


$      3,216


$ 12,716


$      1,292


Operating income (loss)


$        4,226


$         785


$   4,776


$   (10,208)

Restructuring expense


937


1,419


4,880


8,005

Stock-based compensation


329


271


1,092


590

Adjusted operating income (loss)


$        5,492


$      2,475


$ 10,748


$     (1,613)

Adjusted operating margin (a)


11.1%


5.2%


7.5%


(1.2)%


(a) Adjusted Operating Margin equals Adjusted Operating Income (loss) divided by Revenues


Harte Hanks, Inc.

Statement of Operations by Segments (Unaudited)


Quarter ended September 30,


Marketing
Services 


Customer
Care


Fulfillment &
Logistics Services 


Restructuring


Unallocated
Corporate


Total


 (In thousands) 


2021


Revenues


$      14,729


$   19,768


$                  15,100


$                  —


$                    —


$    49,597

Segment Operating Expense


$      10,937


$   15,087


$                  12,695


$                  —


$               5,108


$    43,827

Restructuring


$              —


$           —


$                          —


$               937


$                    —


$         937

Contribution margin


$        3,792


$     4,681


$                     2,405


$              (937)


$             (5,108)


$      4,833

Overhead Allocation


$        1,020


$        667


$                        712


$                  —


$             (2,399)


$            —

EBITDA


$        2,772


$     4,014


$                     1,693


$              (937)


$             (2,709)


$      4,833

Depreciation 


$           117


$        195


$                        182


$                  —


$                  113


$         607

Operating income (loss)


$        2,655


$     3,819


$                     1,511


$              (937)


$             (2,822)


$      4,226


2020


Revenues


$      15,217


$   17,933


$                  14,552


$                  —


$                     —


$    47,702

Segment Operating Expense


$      12,835


$   14,097


$                  13,392


$                  —


$               4,433


$    44,757

Restructuring


$             —


$          —


$                          —


$            1,419


$                    —


$      1,419

Contribution margin


$        2,382


$     3,836


$                     1,160


$          (1,419)


$             (4,433)


$      1,526

Overhead Allocation


$        1,173


$        827


$                        886


$                 —


$             (2,886)


$           —

EBITDA


$        1,209


$     3,009


$                        274


$          (1,419)


$             (1,547)


$      1,526

Depreciation 


$           141


$        323


$                        138


$                 —


$                  139


$         741

Operating income (loss)


$        1,068


$     2,686


$                        136


$          (1,419)


$             (1,686)


$         785


SOURCE 
Harte Hanks, Inc.

Release – ProMIS Neurosciences Announces Third Quarter 2021 Results


ProMIS Neurosciences Announces Third Quarter 2021 Results


TORONTO and CAMBRIDGE, Mass., Nov. 12, 2021 (GLOBE NEWSWIRE) — ProMIS Neurosciences, Inc. (TSX: PMN) (OTCQB: ARFXF) (“ProMIS or the Company”), a biotechnology company focused on the discovery and development of antibody therapeutics targeting toxic oligomers implicated in the development of neurodegenerative diseases, today announced its operational and financial results for the three and nine months ended September 30, 2021.

“We are pleased to be ramping up our efforts to advance our lead asset, PMN 310, closer toward the clinic,” said Gene Williams, ProMIS’ Chairman and CEO. “The financing we secured earlier this year is enabling us to unlock the potential of our platform, which we believe could have significant impact on the treatment of several neurological diseases, including Alzheimer’s Disease (AD), Parkinson’s Disease and ALS. The strengthening of our management team and Board this quarter has also enabled us to leverage worldwide development and patent expertise and strengthen our overall competitive position.”

Corporate Highlights

  • On July 2, 2021, the Company announced the voting results of its annual meeting of shareholders held on June 30, 2021, in Vancouver, British Columbia, Canada. All resolutions described in the Management Proxy Circular and placed before the meeting were approved by the shareholders.
  • On July 8, 2021, the Company announced that it had filed and obtained a receipt for the Prospectus with the securities regulators in each of the provinces and territories of Canada, except Quebec.
  • On August 25, 2021, we announced the closing of a public offering for gross proceeds of US$20,125,000 (CDN$25,522,525).
  • On October 7, 2021, we announced that we would hold a special general meeting of shareholders (the “Special Meeting”) on December 1, 2021. We set October 18, 2021, as the record date for the Special Meeting. The purpose of the Special Meeting is to ask shareholders to grant the Board of Directors the authority, exercisable in the Board’s discretion, to consolidate (or reverse split) the Company’s issued and outstanding common shares in furtherance of a potential listing of the Company’s shares on a stock exchange in the United States.

People

  • On September 1, 2021, the Company appointed Josh Mandel-Brehm to the board of directors. Mr. Mandel-Brehm has held various key business development and operations leadership roles at leading biotechnology companies.
  • On September 23, 2021, the Company appointed Maggie Shafmaster, JD, PhD, to the board of directors. Dr Shafmaster has approximately 30 years of experience providing intellectual property advice to biotechnology and pharmaceutical industries.

On October 22, 2021, the Company announced the expansion of its senior management team. The following changes were announced:

  • Eugene Williams, formerly Executive Chairman, takes on the role of Chairman and Chief Executive Officer (“CEO”), with immediate effect.
  • Dr. Elliot Goldstein resigned from his current role as CEO with immediate effect and continues to support us as President and special consultant to the CEO.
  • Gavin Malenfant joins our senior management team as Chief Operating Officer. Mr. Malenfant brings more than 30 years of biopharmaceutical experience to our team, with special focus on providing expert management and oversight of drug development programs. The top priority in the near term will be to support the timely development of the PMN310 program to completion of IND enabling activities, anticipated in the second half of 2022. He will be working with Mr. Williams and the leadership of the PMN310 project team, whose key members include:
    • Michael Grundman, MD, Senior Medical Adviser. Prior to joining the pharmaceutical industry, Dr. Grundman was Associate Director of the Alzheimer’s Disease Cooperative Study at the University of California, San Diego (“UCSD”) and is currently an Adjunct Professor of Neurosciences at UCSD. Dr. Grundman previously served on the FDA Peripheral and Central Nervous System Advisory Committee.
    • Ernest Bush, PhD, Head of Pharmacology/Toxicology. Dr. Bush has 35 years of experience working in the field of biomedical research and development, driving development of innovative therapies for treatment of human diseases. He has served as a consultant in non-clinical development providing advice and insight into Investigational New Drug (“IND”) enabling programs, pre-clinical data-set analysis for due diligence and evaluation and audits of Good Laboratory Practices (“GLP”) bioanalytical and toxicology facilities and studies.
    • Dennis Chen, PhD, Head of Manufacturing. Dennis has more than 25 years of prior pharmaceutical experience in working with companies from virtual to global and all phases of development. Dennis provides Regulatory Affairs, Chemistry, Chemistry, Manufacturing and Controls (“CMC”) and Biopharmaceutical Development support to ProMIS with expertise in peptides, proteins and oligonucleotides.

Financial Results

Results of Operations – Three months ended September 30, 2021 and 2020

The following table summarizes our results of operations for the three months ended September 30, 2021 and 2020:

    Three Months Ended          
    September 30,          
    2021     2020     Change  
       
Revenues   $ 5,101     $     $ 5,101  
Operating expenses                        
Research and development   $ 1,192,865     $ 1,053,769     $ 139,096  
General and administrative     852,695       510,264       342,431  
Total operating expenses     2,045,560       1,564,033       481,527  
Loss from operations     2,040,459       1,564,033       476,426  
Other income     (1,078,483 )           (1,078,483 )
Net loss   $ 961,976     $ 1,564,033     $ (602,057 )


Research and Development

Research and development expenses consist of the following:

    Three Months Ended          
    September 30,          
    2021     2020     Change  
       
Direct research and development expenses by program:   $ 590,940     $ 390,917     $ 200,023  
Indirect research and development expenses:                        
Personnel related (including stock-based compensation)     218,210       488,888       (270,678 )
Consulting expense     180,604       73,885       106,719  
Patent expense     187,734       98,411       89,323  
Amortization expense     15,377       1,668       13,709  
Total research and development expenses   $ 1,192,865     $ 1,053,769     $ 139,096  

The increase in research and development expense for the three months ended September 30, 2021, compared to the three months ended September 30, 2020, is primarily attributed to increased costs associated with external contract research organizations for internal programs of $200,023 as the company ramps up key internal programs, increased patent expense of $89,323 due to increased maintenance fees, increased outside consultants of $106,719 and increase in amortization of property and equipment and intangible asset of $13,709 offset by decreased contracted research salaries and associated costs of $247,792 due to reduction in compensation to management and attrition of contract staff and decreased share-based compensation of $22,886 due to the forfeiture of share options.

General and Administrative

General and administrative expenses consist of the following:

    Three Months Ended
September 30,
         
    2021     2020     Change  
       
Personnel related (including stock-based compensation)   $ 374,055     $ 242,571     $ 131,484  
Professional and consulting fees     470,493       337,446       133,047  
Facility-related and other     8,147       (69,753 )     77,900  
Total general and administrative expenses   $ 852,695     $ 510,264     $ 342,431  

The increase for the three months ended September 30, 2021, compared to the three same period in 2020, is primarily attributable to by an increase in share-based compensation of $212,237 due to the grant of share options, increased legal expense of $52,959, increased to other professional fees of $150,162 and foreign exchange losses of $88,451 due to the foreign exchange on U.S. denominated assets and liabilities offset by a reduction in contracted corporate salaries and associated facility costs of $91,304 due to reduction in compensation to management and attrition of contracted staff and decreased investor relations of $70,074 due to scale down of investor relations activities and consultants

Other Income

The increase in other income is primarily the change in the fair value of the derivative liability associated with the convertible debenture financing warrant liability arising from the August 2021 financing.

Results of Operations – Nine months ended September 30, 2021 and 2020

The following table summarizes our results of operations for the nine months ended September 30, 2021 and 2020:

    Nine Months Ended          
    September 30,          
    2021     2020     Change  
       
Revenues   $ 5,101     $ 1,578     $ 3,523  
Operating expenses                        
Research and development     2,451,985       2,926,242       (474,257 )
General and administrative     1,554,509       2,051,506       (496,997 )
Total operating expenses     4,006,494       4,977,748       (971,254 )
Loss from operations     4,001,393       4,976,170       (974,777 )
Other expense     4,857,346             4,857,346  
Net loss   $ 8,858,739     $ 4,976,170     $ 3,882,569  


Research and Development

Research and development expenses consist of the following:

    Nine Months Ended          
    September 30,          
    2021     2020     Change  
       
Direct research and development expenses by program:   $ 1,173,873     $ 885,179     $ 288,694  
Indirect research and development expenses:                        
Personnel related (including stock-based compensation)     476,161       1,566,083       (1,089,922 )
Consulting expense     370,052       176,898       193,154  
Patent expense     386,018       293,078       92,940  
Other operating costs     45,881       5,004       40,877  
Total research and development expenses   $ 2,451,985     $ 2,926,242     $ (474,257 )

The decrease in research and development expense for the nine months ended September 30, 2021, compared to the nine months ended September 30, 2020, reflects the conservation of cash resources and decreased contract salaries and associated costs of $921,576 due to reduction in compensation to management and attrition of contracted staff and decreased share-based compensation of $168,346 due to forfeiture of unvested/vested share options due to termination of consulting arrangement offset by increased costs associated with external contract research organizations for internal programs of $288,694 as the company ramps up key internal programs, increased patent expense of $92,940 due to increased maintenance fees, increased consulting expense of $193,154 and increase in amortization of property and equipment and intangible asset of $40,877.

General and Administrative

General and administrative expenses consist of the following:

    Nine Months Ended
September 30,
         
    2021     2020     Change  
       
Personnel related (including stock-based compensation)   $ 802,356     $ 910,769     $ (108,413 )
Professional and consulting fees     950,285       1,083,745       (133,460 )
Facility-related and other     (198,132 )     56,992       (255,124 )
Total general and administrative expenses   $ 1,554,509     $ 2,051,506     $ (496,997 )

The decrease for the nine months ended September 30, 2021, compared to the same period in 2020, is primarily attributable to a reduction in contracted corporate salaries and associated facility costs of $342,084 due to reduction in compensation to management and attrition of contracted staff, decreased investor relations of $451,033 due to a reduction of investor relation activities and consultants and foreign exchange gains of $204,561 on U.S. denominated assets and liabilities offset by increased legal expense of $152,531, increased other professional fees of 165,042 and increased share-based compensation of $183,108, related to the grant of share options.

Other Expense

The increase in other expense is primarily the valuation of the derivative liability associated with the convertible debenture financing.

Outlook

Going forward we will focus on therapeutic programs in our core business area of differentiated antibodies for neurodegenerative and other mis-folded protein diseases.

PMN310, ProMIS antibody therapy selective for toxic oligomers in Alzheimer’s disease, is our highest priority. In Q3, we made significant progress, in line with plans, on all the program elements discussed in the prospectus supplement in August 2021, including cell line development, GLP toxicology work, and CMC manufacturing. We are on track to complete all IND enabling work in H2 2022.

The top priority for our scientific validation efforts, largely centered in Dr. Neil Cashman’s lab at UBC, is currently our ALS portfolio. This portfolio includes antibodies targeting mis-folded forms of TDP-43, RACK1, SOD1, and ataxin2. The most advanced of these is the program targeting TDP-43. We have initiated both in vitro assays (assessing the impact of drug on motor neuron cell lines) and in vivo (mouse model) assays and expect readouts over the next several months.

In addition, we are continuing to expand the application of our unique discovery platform, with which we can “rationally design” antibodies to be selective for only mis-folded, pathogenic proteins involved in disease. Our Chief Physics Officer, David Wishart, and his team are pursuing multiple novel targets. We have acquired access to the AlphaFold database of over 300,000 normal protein conformations, which is the starting point for our predictions of conformational epitopes on mis-folded molecular species using our proprietary computational algorithm Collective Coordinates.

About ProMIS Neurosciences, Inc.

ProMIS Neurosciences, Inc. is a development stage biotechnology company focused on discovering and developing antibody therapeutics selectively targeting toxic oligomers implicated in the development and progression of neurodegenerative diseases, in particular Alzheimer’s disease (AD), amyotrophic lateral sclerosis (ALS) and Parkinson’s disease (PD). The Company’s proprietary target discovery engine is based on the use of two complementary techniques. The Company applies its thermodynamic, computational discovery platform – ProMIS™ and Collective Coordinates – to predict novel targets known as Disease Specific Epitopes on the molecular surface of misfolded proteins. Using this unique approach, the Company is developing novel antibody therapeutics for AD, ALS and PD. ProMIS is headquartered in Toronto, Ontario, with offices in Cambridge, Massachusetts. ProMIS is listed on the Toronto Stock Exchange under the symbol PMN, and on the OTCQB Venture Market under the symbol ARFXF.

Visit us at www.promisneurosciences.com, follow us on Twitter and LinkedIn

For Investor Relations please contact:
Alpine Equity Advisors
Nicholas Rigopulos, President
nick@alpineequityadv.com
Tel. 617 901-0785

The TSX has not reviewed and does not accept responsibility for the adequacy or accuracy of this release. This information release contains certain forward-looking information. Such information involves known and unknown risks, uncertainties and other factors that may cause actual results, performance or achievements to be materially different from those implied by statements herein, and therefore these statements should not be read as guarantees of future performance or results. All forward-looking statements are based on the Company’s current beliefs as well as assumptions made by and information currently available to it as well as other factors. Readers are cautioned not to place undue reliance on these forward-looking statements, which speak only as of the date of this press release. Due to risks and uncertainties, including the risks and uncertainties identified by the Company in its public securities filings, actual events may differ materially from current expectations. The Company disclaims any intention or obligation to update or revise any forward-looking statements, whether as a result of new information, future events or otherwise.

Source: ProMIS Neurosciences Inc.

Release – Capstone Green Energy To Provide Onsite Power System To Wastewater Treatment Facility


Capstone Green Energy (Nasdaq:CGRN) To Provide Onsite Power System To Wastewater Treatment Facility


System Will Use Both Biogas and Natural Gas to Generate Electrical & Thermal Energy

VAN NUYS, CA / ACCESSWIRE / November 12, 2021 / Capstone Green Energy Corporation (www.CapstoneGreenEnergy.com) (NASDAQ:CGRN), (“Capstone,” the “Company,” “we” or “us”), a global leader in carbon reduction and on-site resilient green energy solutions, today announced that its Distributor in Romania, Servelect, has signed a contract to provide a Combined Heat and Power (CHP) system to Compania Aquaserv S.A., a wastewater treatment plant operator in Mures County, Romania.

The new utility grid-connected system will be built utilizing one Capstone Green Energy C600S microturbine and one C200S microturbine. All the energy produced on-site will be used within the wastewater treatment plant. The C600S unit will be fueled by the biogas resulting from anaerobic fermentation of sludge, while the C200S unit will use high-pressure natural gas from the local Romanian Distribution Network Operator (DNO).

This green energy project was pursued as it became clear that the site’s existing internal combustion engine cogeneration plant was reaching the end of its lifecycle. At the same time, rising electricity prices combined with investment opportunities for wastewater treatment cogeneration projects made it an ideal time for Compania Aquaserv S.A. to look for a more efficient and advanced cogeneration technology. The project is funded by the European Economic Area (EEA) and Norwegian grants. The EEA and Norwegian grants represent the contribution of Iceland, Liechtenstein, and Norway to reduce economic and social disparities in the European Economic Area and to strengthen bilateral relations with the 15 beneficiary states in Eastern and Southern Europe and the Baltic States.

“Producing biogas from municipal wastewater sludge is a well-known and widely used approach,” said Csaba Bauer, Head of Wastewater Treatment Department of Compania Aquaserv S.A. “Compania Aquaserv S.A. has over 20 years of experience using biogas in cogeneration plants to cover its energy consumption and thermal needs. In this way, we can optimize our operational costs for public sewage service, making it more affordable for the public,” added Mr. Bauer.

The system will include two compressors that will increase the pressure of both the biogas and natural gas. To provide maximum efficiency, the two Capstone Green Energy CHP systems will be directed to a recovery boiler by a manifold; in addition, the hot water produced will be used in the sludge drying process. Together with the compressors and the recovery boiler, the two CHP units will be integrated within the site’s existing Supervisory Control and Data Acquisition (SCADA) system. This allows for both local and remote monitoring, as well as manual and automatic operating modes. All together, the system is designed to provide 800 kWe electric and 1500 kWth thermal power. It is expected to be commissioned in March 2022.

“We are very excited to implement one of the first Capstone Green Energy cogeneration plants within a wastewater treatment plant in Romania. Servelect has been Aquaserv’s reliable partner since the beginning of the project, starting with the feasibility study, elaboration of the financing application, and now with the technical design and the actual implementation of the project,” said Iulia Bargauan, General Director of Servelect. “The new system will provide Aquaserv with cost savings, energy efficiency, and reduced carbon emissions,” added Ms. Bargauan.

“Wastewater treatment plants are among the best candidates for this kind of highly efficient green energy project. Not only is biogas a free, renewable fuel source for producing heat and electricity, it also eliminates the waste gas, which could otherwise be a global warming pollutant,” said Darren Jamison, Chief Executive Officer of Capstone Green Energy. “The kind of energy efficiency we can achieve at sites like Aquaserv S.A. offers the potential for greater operational cost savings, and with the kind of incentives that are currently available in many regions, the return on investment can be substantial,” concluded Mr. Jamison.

About Capstone Green Energy
Capstone Green Energy (www.CapstoneGreenEnergy.com) (NASDAQ:CGRN) is a leading provider of customized microgrid solutions and on-site energy technology systems focused on helping customers around the globe meet their environmental, energy savings, and resiliency goals. Capstone Green Energy focuses on four key business lines. Through its Energy as a Service (EaaS) business, it offers rental solutions utilizing its microturbine energy systems and battery storage systems, comprehensive Factory Protection Plan (FPP) service contracts that guarantee lifecycle costs, as well as aftermarket parts. Energy Generation Technologies (EGT) are driven by the Company’s industry-leading, highly efficient, low-emission, resilient microturbine energy systems offering scalable solutions in addition to a broad range of customer-tailored solutions, including hybrid energy systems and larger frame industrial turbines. The Energy Storage Solutions (ESS) business line designs and installs microgrid storage systems creating customized solutions using a combination of battery technologies and monitoring software. Through Hydrogen & Sustainable Products (H2S), Capstone Green Energy offers customers a variety of hydrogen products, including the Company’s microturbine energy systems.

For customers with limited capital or short-term needs, Capstone offers rental systems; for more information, contact: rentals@CGRNenergy.com. To date, Capstone has shipped over 10,000 units to 83 countries and estimates that, in FY21, it saved customers over $217 million in annual energy costs and approximately 397,000 tons of carbon. Total savings over the last three years are estimated to be approximately $698 million in energy savings and approximately 1,115,100 tons of carbon savings.

For more information about the Company, please visit www.CapstoneGreenEnergy.com. Follow Capstone Green Energy on TwitterLinkedInInstagramFacebook, and YouTube.

Cautionary Note Regarding Forward-Looking Statements
This release contains forward-looking statements as defined in the Private Securities Litigation Reform Act of 1995, including statements regarding expectations for green initiatives and execution on the Company’s growth strategy and other statements regarding the Company’s expectations, beliefs, plans, intentions, and strategies. The Company has tried to identify these forward-looking statements by using words such as “expect,” “anticipate,” “believe,” “could,” “should,” “estimate,” “intend,” “may,” “will,” “plan,” “goal” and similar terms and phrases, but such words, terms and phrases are not the exclusive means of identifying such statements. Actual results, performance and achievements could differ materially from those expressed in, or implied by, these forward-looking statements due to a variety of risks, uncertainties and other factors, including, but not limited to, the following: the ongoing effects of the COVID-19 pandemic; the availability of credit and compliance with the agreements governing the Company’s indebtedness; the Company’s ability to develop new products and enhance existing products; product quality issues, including the adequacy of reserves therefor and warranty cost exposure; intense competition; financial performance of the oil and natural gas industry and other general business, industry and economic conditions; the Company’s ability to adequately protect its intellectual property rights; and the impact of pending or threatened litigation. For a detailed discussion of factors that could affect the Company’s future operating results, please see the Company’s filings with the Securities and Exchange Commission, including the disclosures under “Risk Factors” in those filings. Except as expressly required by the federal securities laws, the Company undertakes no obligation to update or revise any forward-looking statements, whether as a result of new information, changed circumstances or future events or for any other reason.

CONTACT:
Capstone Green Energy
Investor and investment media inquiries:
818-407-3628
ir@CGRNenergy.com

SOURCE: Capstone Green Energy Corporation

Harte Hanks (HRTH) – A Well-Oiled More Efficient Cash Flow Machine

Friday, November 12, 2021

Harte Hanks (HRTH)
A Well-Oiled, More Efficient, Cash Flow Machine

Harte-Hanks is a marketing services company that provides multichannel marketing solutions as well as consulting, data analytics, and strategic assessment. The company’s offerings focus on business-to-business, retail, finance, and automotive segments through digital, social, mobile, and print media offerings. Harte-Hanks strives to develop better customer relationships through its marketing and analytical services for clients. The majority of its revenue is derived from its marketing services in the retail, technology, and consumer brand segments.

Michael Kupinski, Director of Research, Noble Capital Markets, Inc.

Refer to the full report for the price target, fundamental analysis, and rating.

    A surprisingly strong Q3. Total company revenue increased a surprising 4.0% to $49.6 million, well above our $45.3 million estimate, fueled by a 10.2% increase in its Customer Care segment revenues. Customer Care revenues beat our estimate by a whopping 29.2%, as the Covid related customer did not go away as anticipate and the company gained additional clients. The company reported its 6th consecutive quarter of positive EBITDA, with adj. EBITDA beating expectations, $6.1 million versus our $3.3 million estimate.

    Favorable momentum.  Customer Care is expected to be stronger than originally expected as the Covid related business is not expected to fall off until next year. As a result, we are raising our Q4 total company revenue expectation from $42.5 million to $48.7 million. We are raising our Q4 adj. EBITDA estimate from $3.1 million to $4.4 million, bringing our full year 2021 adj. EBITDA estimate to …


This Company Sponsored Research is provided by Noble Capital Markets, Inc., a FINRA and S.E.C. registered broker-dealer (B/D).

*Analyst certification and important disclosures included in the full report. NOTE: investment decisions should not be based upon the content of this research summary.  Proper due diligence is required before making any investment decision.