Is Cathie Woods Innovation Fund Getting a ReBoot


Image: Diverse Stock Photos (Flickr)


Analyst Believes Tech and Innovation are Severely Oversold


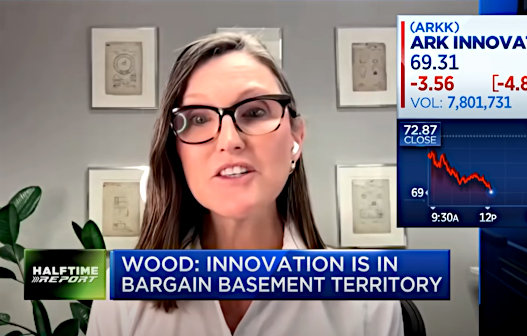
On Tuesday, it was reported that Cathie Wood’s Ark Innovation ETF experienced the highest amount of inflows since May of 2021. The fund returned over 10% during the week despite the Fed raising rates and guiding expectations toward continued increases. Does this mark the turnaround in the performance of innovative companies? JP Morgan’s Marko Kolanovic seems to think so.

According to a research note published on Thursday (March 17) from Marko
Kolanovic
, the market segment is cheap. The thoughts of the Global Head of Macro Quantitative and Derivatives Research for the investment bank are particularly noteworthy as his recent track record in related sectors is excellent. For example, Kolanovic warned
investors in 2021
about the bubble in innovation stocks, the potential for a commodity supercycle, and even geopolitical risks in 2022. These are eye-opening credentials, considering the AARK Innovation Fund is now down more than 50%, oil is up over 50%, and an unexpected war broke out in Europe.

Here’s Why

As we step into Spring 2022, we find many innovative tech stocks that had rocketed during the pandemic, now well off their highs – some more than 80% below their peak. Stocks that investors were tripping over themselves to buy as they marched higher in late 2020 and 2021 while their businesses caught investor attention are sitting at levels Kolanovic sees as an early turning point.

In his note he indicates that he believes the sell-off overshot to the downside and a turning point will come, even though risks remain in the stock market in general, “Markets may anticipate these turning points sooner, and we think it is time to start adding risk in many areas that overshot on the downside year-to-date,” Kolanovic said.


What’s Included in Forecast

JPM’s quant and derivatives head believes some of the collapse has been liquidity-driven. Beaten down sectors like biotech, emerging markets, innovation, and tech were all mentioned as providing opportunities. He pointed out that many of these market segments are trading at “all-time valuation lows (including previous recessions and periods of much higher interest rates).”

Kolanovic expects “great opportunities in high-beta, beaten-down segments that include innovation, tech, biotech, emerging markets.” While investors have been focusing their concerns on inflation and a potential recession, he doesn’t believe the US is headed toward a recession – though he’s not ruling out one in Europe or a further slowdown in the US.

The caution here is that investors need to do their homework, look at professional research and know
the company
.  Investors shouldn’t indiscriminately buy beaten-down tech stocks, he cautioned, as “not all assets are cheap” amid rising interest rates and a slowing US economy. “While the commodity supercycle will persist,” the strategist said, “the correction in bubble sectors is now likely finished, and geopolitical risk will likely start abating in a few weeks’ time (while a comprehensive resolution may take a few months),” Kolanovic wrote.

Paul Hoffman

Managing Editor, Channelchek


Suggested Reading


Cathie Wood is Even More Positive About Innovative Companies with Global Turmoil


Cathie Wood Thinks if There is No Blood in Your Street, You Should Move


Michael Burry’s Public Investments in SPACs, Prisons, and Electric Hogs


IRA Investments and Small Cap Stocks


Sources

https://www.bloomberg.com/news/articles/2022-03-17/jpmorgan-s-kolanovic-says-market-bubble-corrections-almost-done-l0va2ffi

https://www.cnbc.com/2022/03/17/jpmorgans-kolanovic-says-its-time-for-investors-to-start-adding-back-risk-.html


Stay up to date. Follow us:


Quantifying the Pandemic’s Impact on Disposition


Pandemic Mood: Much Worse than a Bad Monday


Peter Dizikes | MIT News
Office

The Covid-19 pandemic has been depressing, demoralizing, and stressful for people around the world. But is there any way to measure exactly how bad it has made everyone feel?

A new study led by MIT researchers attempts just that, through a massive examination of hundreds of millions social media posts in about 100 countries. The research, which analyzes the language terms used in social media, finds a pronounced drop in positive public sentiment after the pandemic set in during early 2020 — with a subsequent, incremental, halting return to prepandemic status.

To put that downturn in perspective, consider a prepandemic fact that the same kind of analysis uncovered: Typically, people express the most upbeat emotions on social media on weekends, and the most negative ones on Monday. Worldwide, the onset of the pandemic induced a negative turn in sentiment 4.7 times as large as the traditional weekend-Monday gap. Thus the early pandemic months were like a really, really bad Monday, on aggregate, globally, for social media users.

“The takeaway here is that the pandemic itself caused a huge emotional toll, four to five times the variation in sentiment observed in a normal week,” says Siqi Zheng, an MIT professor and co-author of a new paper detailing the study’s results.

The paper, “Global evidence of expressed sentiment alterations during the Covid-19 pandemic,” appears today in Nature Human Behaviour.


To conduct the study, the researchers examined 654 million location-identified social media posts from Twitter in about 100 countries. The posts appeared between Jan. 1, 2020, and May 31, 2020, an early phase of the global pandemic.

The researchers used natural-language processing software to evaluate the content of the social media, and examined the language of pandemic-period posts in relation to historical norms. Having previously studied the effects of pollution, extreme weather, and natural disasters on public sentiment, they found that the pandemic produced bigger changes in mood than those other circumstances.

“The reaction to the pandemic was also three to four times the change in response to extreme temperatures,” Fan observes. “The pandemic shock is even larger than the days when there is a hurricane in a region.”

The biggest drops in sentiment occurred in Australia, Spain, the United Kingdom, and Colombia. The countries least affected by the pandemic in these terms were Bahrain, Botswana, Greece, Oman, and Tunisia.

The study also revealed a potentially surprising fact about temporary lockdown policies — namely, that lockdowns did not appear to have much of an effect on the public mood.

“You can’t expect lockdowns to have the same effect on every country, and the distribution of responses is quite wide,” says Fan. “But we found the responses actually largely centered around a very small positive reaction [to lockdowns]. … It’s definitely not the overwhelmingly negative impact on people that might be expected.”

As to why people might have reacted like this, Zheng says, “On the one hand, lockdown policies might make people feel secure, and not as scared. On the other hand, in a lockdown when you cannot have social activities, it’s another emotional stress. The impact of lockdown policies perhaps runs in two directions.”

Because many factors might concurrently affect public sentiment during a lockdown, the researchers compared the mood of countries during lockdowns to those with similar characteristics that simultaneously did not enact the same policies.

The scholars also evaluated patterns of sentiment recovery during the early 2020 period, finding that some countries took as long as 29 days to erase half of the dropoff in sentiment they experienced; 18 percent of countries did not recover to their prepandemic sentiment level.

The new paper is part of the Global Sentiment project in Zheng’s Sustainable Urbanization Lab, which studies public sentiment as expressed through social media, rather than public-opinion polling.

“The traditional approach is to use surveys to measure well-being or happiness,” Zheng observes. “But a survey has smaller sample size and low frequency. This a real-time measure of people’s sentiment.”

Suggested Reading


Impact of Physical Nearness on Twitter Posts


Bond Market Understanding is Again Critical for Stock Investors


Covid-19, Scary vs. Dangerous (July 2020)


Michael Burry says COVID-19 Cure Worse than the Disease (April 2020)


Stay up to date. Follow us:


Release – Schwazze Announces Listing Of Common Shares On The NEO Exchange Under The Symbol SHWZ


Schwazze Announces Listing Of Common Shares On The NEO Exchange Under The Symbol SHWZ

Research, News, and Market Data on Schwazze


DENVER, March 17, 2022 /CNW/ – Medicine Man Technologies, Inc., dba Schwazze, (OTCQX: SHWZ) (“Schwazze” or the “Company”), is pleased to announce that it has received final approval from the NEO Exchange (the “NEO”) to list the Company’s common shares onto the NEO, a tier one Canadian stock exchange based in Toronto, Ontario.  The common shares are expected to begin trading on the NEO on March 23, 2022, under the symbol SHWZ.

Schwazze is currently listed on the OTCQX and believes that the additional listing onto the NEO, enabling the Company’s common shares to be traded on a senior exchange in Canada, will provide additional exposure to an increased number of retail and institutional investors.

“The NEO listing is an important milestone for Schwazze and provides an additional platform as we bring our story to new investor audiences, and we continue to execute our proven growth playbook as an MSO with a differentiated regional position.” commented Nancy Huber, Chief Financial Officer of Schwazze. “The NEO is now setting the pace for Cannabis companies who want to attract the right institutional attention and increase their liquidity.”

Schwazze public disclosure documents are available under Schwazze’s profiles on EDGAR at www.sec.gov and on SEDAR at www.sedar.com.

About Schwazze
Schwazze (OTCQX: SHWZ) is building a premier vertically integrated regional cannabis company with assets in Colorado and New Mexico and will continue to take its operating system to other states where it can develop a differentiated regional leadership position. Schwazze is the parent company of a portfolio of leading cannabis businesses and brands spanning seed to sale. The Company is committed to unlocking the full potential of the cannabis plant to improve the human condition. Schwazze is anchored by a high- performance culture that combines customer-centric thinking and data science to test, measure, and drive decisions and outcomes. The Company’s leadership team has deep expertise in retailing, wholesaling, and building consumer brands at Fortune 500 companies as well as in the cannabis sector. Schwazze is passionate about making a difference in our communities, promoting diversity and inclusion, and doing our part to incorporate climate-conscious best practices. Medicine Man Technologies, Inc. was Schwazze’s former operating trade name. The corporate entity continues to be named Medicine Man Technologies, Inc. Schwazze derives its name from the pruning technique of a cannabis plant to enhance plant structure and promote healthy growth.

About the Neo Exchange Inc.
The Neo Exchange Inc. is Canada’s Tier 1 stock exchange for the innovation economy, bringing together investors and capital raisers within a fair, liquid, efficient, and service-oriented environment. Fully operational since June 2015, NEO puts investors first and provides access to trading across all Canadian-listed securities on a level playing field. NEO lists companies and investment products seeking an internationally recognized stock exchange that enables investor trust, quality liquidity, and broad awareness including unfettered access to market data.

Forward-Looking Statements
This press release contains “forward-looking statements.” Such statements may be preceded by the words “plan,” “will,” “may,” “continue,” “predicts,” or similar words. Forward-looking statements include the Company’s expectations regarding the listing date for its common shares on the NEO and the expected benefits of listing on the NEO. Forward-looking statements are not guarantees of future events or performance, are based on certain assumptions, and are subject to various known and unknown risks and uncertainties, many of which are beyond the Company’s control and cannot be predicted or quantified. Consequently, actual events and results may differ materially from those expressed or implied by such forward-looking statements. Such risks and uncertainties include, without limitation, risks and uncertainties associated with (i) our inability to manufacture our products and product candidates on a commercial scale on our own or in collaboration with third parties; (ii) difficulties in obtaining financing on commercially reasonable terms; (iii) changes in the size and nature of our competition; (iv) loss of one or more key executives or scientists; (v) difficulties in securing regulatory approval to market our products and product candidates; (vi) our ability to successfully execute our growth strategy in Colorado and outside the state, (vii) our ability to consummate the acquisition described in this press release or to identify and consummate future acquisitions that meet our criteria, (viii) our ability to successfully integrate acquired businesses, including the acquisition described in this press release, and realize synergies therefrom, (ix) the ongoing COVID-19 pandemic, * the timing and extent of governmental stimulus programs, and (xi) the uncertainty in the application of federal, state and local laws to our business, and any changes in such lawsListing on the NEO is subject to satisfaction of the final listing conditions. The benefits of listing on the NEO depend on increased liquidity for the Company’s shareholders and exposure due to listing on a senior exchange. Such benefits may not be realized. More detailed information about the Company and the risk factors that may affect the realization of forward-looking statements is set forth in the Company’s filings with the Securities and Exchange Commission (SEC), including the Company’s Annual Report on Form 10-K and its Quarterly Reports on Form 10-Q. Investors and security holders are urged to read these documents free of charge on the SEC’s website at http://www.sec.gov. The Company assumes no obligation to publicly update or revise its forward-looking statements as a result of new information, future events or otherwise except as required by law.

SOURCE Medicine Man Technologies, Inc.

Release – Item 9 Labs Corp. to Acquire The Herbal Cure in Denver, Colorado


Item 9 Labs Corp. to Acquire The Herbal Cure in Denver, Colorado

Research, News, and Market Data on Item 9 Labs


  • Future Flagship Corporate Location Generated $5.4 Million in Revenue in 2021
  • Second Colorado Acquisition Fuels Market Expansion for the Company’s Dispensary Franchise, Unity Rd.
  • Acquisition Includes Cultivation License, Complementing the Company’s National Retail and Product Expansion Efforts

DENVERMarch 17, 2022 /PRNewswire/ — Item 9 Labs Corp. (OTCQX: INLB) (the “Company”) — a vertically integrated cannabis dispensary franchisor and operator that produces premium, award-winning products — announced today that it has signed an Asset Purchase Agreement (the “APA”) with The Herbal Cure, a medicinal and recreational dispensary and cultivator operating in Denver, Colorado.

The Herbal Cure was founded in 2010 and generated revenues of $5.4 million in 2021. Located in the desirable and central neighborhood of Washington Park in Denver, the 1,500 square-foot medicinal and recreational dispensary will be the Company’s future flagship location for the brand. Item 9 Labs Corp. anticipates the dispensary to be transitioned over to its cannabis dispensary franchise brand, Unity Rd., within six months of closing the acquisition, which is currently awaiting regulatory approval by Colorado’s Marijuana Enforcement Division (the “MED”) and the City of Denver.

The acquisition includes the current 5,000 square-foot facility, which has 3,500 square feet of space for on-site cultivation operations, corporate offices, team training and more. Item 9 Labs Corp. has room to expand the sales floor with additional point-of-sale terminals and expanded product assortment, in addition the potential to offer delivery services through one of the Company’s social equity partners.

On the cultivation side, the APA also consists of a 3,000 square-foot medicinal and recreational cultivation. The Company anticipates introducing its award-winning cannabis products from Item 9 Labs to the Colorado market in the year ahead. With nearly 30 podium finishes in Arizona marijuana competitions, Item 9 Labs is a trusted source for premium cannabis products with a catalog that spans 100-plus products across five core categories, including several active cannabis strains, cannabis vape products, premium concentrates and Orion vape technology.

“The Herbal Cure acquisition represents an accretive opportunity for the Company and is well-positioned with our national retail and product expansion strategy,” said the Company’s Chief Strategy Officer, Jeffrey Rassas.

Unity Rd. is the growth vehicle that will bring Item 9 Labs products to new markets. The Company is focusing product expansion efforts on states such as Colorado, where there are two to three Unity Rd. shops in operation to ease new market product entry and focus operations. In Colorado, Unity Rd. currently has a franchise shop located in Boulder as well as a corporate shop opening in the next few months in Adams County that will later be sold to a Unity Rd. franchise partner. This expansion strategy gives the Company’s dispensary franchise partners front-of-the-line access to a reliable, award-winning product supply chain. The Unity Rd. brand also benefits from the national product consistency that consumers have come to expect from franchise brands.

“With The Herbal Cure dispensary ideally located in South Denver, we anticipate seeing accelerated brand penetration in the market thanks to heightened exposure amongst daily commuters as well as high traffic from tourism, especially during the summer months,” said the Company’s Vice President of Mergers and Acquisitions, Mark Busch. “This flagship location is a tremendous value-add for the Unity Rd. brand as we develop in the Colorado market and is a premier avenue for our plan to bring our Item 9 Labs products to the state.”

In addition to Colorado, Item 9 Labs Corp. is actively seeking acquisitions of cannabis dispensaries in key markets in ArizonaMichigan and Oklahoma to convert into the Unity Rd. brand. Currently, the dispensary franchise has multiple agreements signed with nearly 20 entrepreneurial groups who are in various stages of development nationwide. It offers entrepreneurs the tools, resources, systems and training needed to successfully run a cannabis dispensary in their market, meanwhile maintaining full ownership of their business and dispensary license.

More Information on Item 9 Labs Corp. and its brands:
Visit https://item9labscorp.com/

Cannabis Operators Interested in Selling Their Dispensary License:
Contact Mark Busch at acquisitions@item9labs.com

About Item 9 Labs Corp.
Item 9 Labs Corp. (OTCQX: INLB) is a vertically integrated cannabis operator and dispensary franchisor delivering premium products from its large-scale cultivation and production facilities in the United States. The award-winning Item 9 Labs brand specializes in best-in-class products and user experience across several cannabis categories. The company also offers a unique dispensary franchise model through the national Unity Rd. retail brand. Easing barriers to entry, the franchise provides an opportunity for both new and existing dispensary owners to leverage the knowledge, resources, and ongoing support needed to thrive in their state compliantly and successfully. Item 9 Labs brings the best industry practices to markets nationwide through distinctive retail experience, cultivation capabilities, and product innovation. The veteran management team combines a diverse skill set with deep experience in the cannabis sector, franchising, and the capital markets to lead a new generation of public cannabis companies that provide transparency, consistency, and well-being. Headquartered in Arizona, the company is currently expanding its operations space by up to 640,000-plus square feet on its 50-acre site, one of the largest properties in Arizona zoned to grow and cultivate flower. For additional information, visit https://investors.item9labscorp.com/.

Forward-Looking Statements
This press release contains forward-looking statements within the meaning of the safe harbor provisions of the Private Securities Litigation Reform Act of 1995. Such statements involve risks and uncertainties, including, but not limited to, risks and effects of legal and administrative proceedings and governmental regulation, especially in a foreign country, future financial and operational results, competition, general economic conditions, proposed transactions that are not legally binding obligations of the company and the ability to manage and continue growth. Should one or more of these risks or uncertainties materialize, or should underlying assumptions prove incorrect, actual outcomes may vary materially from those indicated. Important factors that could cause actual results to differ materially from the forward-looking statements we make in this news release include the introduction of new technology, market conditions and those set forth in reports or documents we file from time to time with the SEC. We undertake no obligation to revise or update such statements to reflect current events or circumstances after the date hereof or to reflect the occurrence of unanticipated events.

Media Contact:
Item 9 Labs Corp.
Jayne Levy, VP of Communications
Jayne@item9labs.com

Investor Contact:
Item 9 Labs Corp.
800-403-1140
Investors@item9labscorp.com

SOURCE Item 9 Labs Corp.

Pangaea Logistics (PANL) – Post Call Update – Weakness Not Warranted

Friday, March 18, 2022

Pangaea Logistics (PANL)
Post Call Update – Weakness Not Warranted

Pangaea Logistics Solutions Ltd and its subsidiaries provide seaborne drybulk transportation services. It transports drybulk cargos including grains, coal, iron, ore, pig, iron, hot briquetted iron, bauxite, alumina, cement clinker, dolomite and limestone. The firm’s services include cargo loading, cargo discharge, vessel chartering, voyage planning and technical vessel management. The company derives all of its revenues from contracts of affreightment, voyage charters and time charters. Its strategy depends on focusing on increasing strategic contracts of affreightment, expanding capacity and flexibility by increasing its owned fleet and increasing backhaul focus and fleet efficiency.

Poe Fratt, Senior Research Analyst, Logistics, Noble Capital Markets, Inc.

Refer to the full report for the price target, fundamental analysis, and rating.

    Call highlights. Favorable dry bulk market fundamentals, especially the low order book, intact despite the ongoing market reset due to Russian sanctions. No concerns about counter party risk even though expanding receivables triggered $1.5 million increase in doubtful accounts. Bunker fuel prices have moved up, but typically hedging 75% of fuel consumption helps temper impact.

    No change in 2022 EBITDA estimate of $98.0 million based on TCE rates of $24.8k/day.  Well positioned after positive developments last year. Strong 2021 results make comps tough, but this year should be solid and TCE rate on 1Q2022 forward cover approximates $26.5k/day. Positive outlook based on a consistent commercial strategy that adds value in different market environments, a leading Ice Class …


This Company Sponsored Research is provided by Noble Capital Markets, Inc., a FINRA and S.E.C. registered broker-dealer (B/D).

*Analyst certification and important disclosures included in the full report. NOTE: investment decisions should not be based upon the content of this research summary. Proper due diligence is required before making any investment decision. 


Release – Alvopetro Announces 33 Increase In Quarterly Dividend To US$0.08 Per Share Year-End 2021 Financial Results


Alvopetro Announces 33% Increase In Quarterly Dividend To US$0.08 Per Share, Year-End 2021 Financial Results, Filing Of Annual Information Form And An Operational Update

Research, News, and Market Data on Alvopetro Energy


CALGARY, ABMarch 17, 2022 /CNW/ – Alvopetro Energy Ltd. (TSXV:ALV) (OTCQX: ALVOF) announces a US$0.08 per common share dividend, our year-end 2021 financial results, filing of our annual information form and an operational update.

All references herein to $ refer to United States dollars, unless otherwise stated and all tabular amounts are in thousands of United States dollars, except as otherwise noted.

President and CEO, Corey Ruttan commented:

“With ongoing strong performance from our Caburé project, along with the recent increase in our realized natural gas pricing to US$11.28/Mcf, we are pleased to announce a 33% increase in our quarterly dividend.  We continue to target a balanced and disciplined stakeholder return and organic growth model and on March 2, 2022, we commenced our 2022 drilling campaign targeting the first of two, high-impact, conventional natural gas exploration prospects.”

Dividend

Alvopetro announces that our Board of Directors has declared a quarterly dividend of $0.08 per common share, payable in cash on April 14, 2022, to shareholders of record at the close of business on March 31, 2022. This dividend is designated as an “eligible dividend” for Canadian income tax purposes.  Alvopetro’s cash flows are linked to US dollars and as such, dividends are being paid in US dollars.

Dividend payments to non-residents of Canada will be subject to withholding taxes at the Canadian statutory rate of 25%.  Shareholders may be entitled to a reduced withholding tax rate under a tax treaty between their country of residence and Canada.  For further information, see Alvopetro’s website at  https://alvopetro.com/Dividends-Non-resident-Shareholders.

Operational Update

Our average daily sales have continued at consistent rates following our fourth quarter 2021 average of 2,432 boepd, averaging 2,509 boepd in January 2022 and 2,479 boepd in February 2022.  Effective February 1, 2022, our natural gas price increased 48% to BRL1.94/m3 ($11.28/Mcf based on our average heat content and the average February 2022 BRL/USD foreign exchange rate of 5.1966).  Our new contracted price is effective for all natural gas sales from February 1 to July 31, 2022.

On March 2, 2022, we spud our 182-C1 well on Block 182, the first of two conventional natural gas exploration wells planned for 2022.  We anticipate the well will take approximately 42 days to drill and thereafter the rig will move to the 183-B1 well on the adjacent Block 183. Following these two wells, we plan to drill our first fit-for-purpose Murucututu development well. 

We have now completed construction of our Murucututu pipeline and are currently installing field production facilities.  We expect our 183(1) well to be tied-in and on production in the second quarter.

December 31, 2021 Reserves and Net Asset Value

On March 8, 2022, Alvopetro announced its December 31, 2021 reserves based upon the independent reserve assessment and evaluation prepared by GLJ Ltd. (“GLJ”) dated March 7, 2022 with an effective date of December 31, 2021 (the “GLJ Reserves and Resources Report”). The GLJ Report assigned total proved plus probable (“2P”) reserves of 8.7 MMboe and a before tax value discounted at 10% of $297.0 million.  Following this evaluation and based on updated year-end 2021 financial results, the Company’s net asset value based on its 2P reserves is $299.6 million, reflecting CAD$11.18 per common share. The GLJ Reserves and Resources Report also included an assessment of the Murucututu natural gas resource which has not been reflected in the table below, with risked best estimate contingent resource of 3.5 MMboe and risked best estimate prospective resource of 12.1 MMboe (before tax net present value, discounted at 10% of $60.7 million and $208.7 million, respectively).


Base Net Asset Value (in $000s, other than per share amounts)


Total Proved


Total Proved plus Probable

Total Proved plus Probable plus Possible

Before Tax Net Present Value(a)discounted at 10%

173,759

297,000

416,723

Working capital, net of debt – as of December 31, 2021(b)

2,552

2,552

2,552

Total Base Net Asset Value (b)(c)(d)

176,311

299,552

419,275

CAD$ per basic share(e)

6.58

11.18

15.65

(a)

See “Oil and Natural Gas Reserves” section within this new release

(b)

See “Non-GAAP and Other Financial Measures” section within this new release

(c)

Alvopetro has reflected the contractual obligations pursuant to our September 2018 Gas Treatment Agreement with Enerflex, including the equipment rental component of the agreement which is treated as a right of use asset and reflected as a capital lease obligation on our financial statements. As the future capital lease payments reduce the forecasted future net revenue in all reserves categories, the capital lease obligation as reflected on the Company’s financial statements has not been included in the table above.

(d)

The net asset value reflected above includes the present value of before tax cash flows from the Company’s reserves only. No amounts have been included with respect to contingent or prospective resource volumes.

(e)

Converted to CAD$ based on the exchange rate on March 17, 2022. The per share calculation is computed based on 33.9 million common shares outstanding as of March 17, 2022.

Financial and Operating Highlights – Fourth Quarter of 2021

  • Our daily sales averaged 2,432 boepd in Q4 2021, a 25% increase from the Q4 2020 average of 1,950 boepd and a 1% decrease from the Q3 2021 average of 2,459 boepd. In Q4 2021, 95.7% of our sales volumes were from natural gas with 4.2% from NGLs from condensate and the remainder from crude oil sales.
  • Our operating netback of $36.38 per boe in Q4 2021 improved 30% from Q4 2020 due to an increase in our realized natural gas price and improved commodity prices overall, offset by increased royalties. The current quarter’s netback was consistent with Q3 2021.
  • We reported net income of $2.6 million, compared to $2.8 million in Q4 2020 and $1.5 million in Q3 2021.
  • We generated funds flow from operations in Q4 2021 of $6.5 million ($0.19 per basic share and $0.18 per diluted share) and cash flows from operating activities of $7.1 million ($0.21 per basic share and $0.20 per diluted share).
  • Capital expenditures totaled $1.5 million, focused on our Murucututu/Gomo pipeline extension.
  • We declared our second dividend of $0.06 per share to shareholders of record on December 30, 2021. Total dividends of $2.0 million were paid on January 14, 2022.
  • As at December 31, 2021, we had a net working capital surplus of $9.1 million, including $11.5 million in cash and cash equivalents. The Company’s working capital net of our credit facility balance of $6.5 million improved to $2.6 million, compared to $0.3 million as of September 30, 2021. In February 2022, we repaid an additional $1.5 million of our Credit Facility, bringing the outstanding balance to $5.0 million.

Financial and Operating Highlights – Year-End 2021

  • Our annual sales averaged 2,358 boepd (95.5% natural gas, 4.4% NGLs from condensate and marginal crude oil production).
  • We recognized net income of $6.6 million, compared to $5.7 million in 2020.
  • We generated funds flow from operations of $24.6 million ($0.74 per basic share on $0.71 per diluted share) compared to $6.2 million in 2020 ($0.19 per basic share and $0.18 per diluted share).
  • Capital expenditures totaled $4.5 million, focused on our Murucututu pipeline extension and our initial costs for our planned 2022 exploration program.
  • We completed a share restructuring in September 2021, involving a share repurchase and a consolidation resulting in a reduction in our common shares outstanding from 99.8 million to 32.9 million immediately following the restructuring.
  • We commenced quarterly dividend payments of $0.06/share, with dividends declared to shareholders of record on September 29, 2021 and December 30, 2021.

The following table provides a summary of Alvopetro’s financial and operating results for periods noted. The consolidated financial statements with the Management’s Discussion and Analysis (“MD&A”) are available on our website at www.alvopetro.com and will be available on the System for Electronic Document Analysis and Retrieval (SEDAR) website at www.sedar.com.

As at and Three MonthsEnded December 31,

Year EndedDecember 31,

2021

2020

Change (%)

2021

2020

Financial

($000s, except where noted)

Natural gas, oil and condensate sales

9,896

5,887

68

34,980

11,308

Net income

2,575

2,754

(6)

6,614

5,706

      Per share – basic ($)

0.08

0.08

0.20

0.17

      Per share – diluted ($)(1)

0.07

0.08

(13)

0.19

0.16

Cash flow from operating activities

7,088

3,124

127

24,291

3,061

      Per share – basic ($)

0.21

0.09

133

0.73

0.09

      Per share – diluted ($)(1)

0.20

0.09

122

0.70

0.09

Funds flow from operations (2)

6,480

4,252

52

24,637

6,216

      Per share – basic ($)

0.19

0.13

46

0.74

0.19

      Per share – diluted ($)(1)

0.18

0.13

38

0.71

0.18

Capital expenditures(3)

1,470

452

225

4,513

3,814

Total assets

81,231

80,388

1

81,231

80,388

Cash and cash equivalents

11,469

5,159

122

11,469

5,159

Net working capital surplus (2)

9,097

5,539

64

9,097

5,539

Working capital, net of debt (net debt)(2) 

2,552

(9,884)

126

2,552

(9,884)

Weighted average shares outstanding (000s)

      Basic

33,824

33,086

2

33,103

32,871

      Diluted (1)

35,986

33,557

7

34,928

35,145

Operations

Natural gas, crude oil and natural gas liquids sales:

      Natural gas (Mcfpd)

13,966

11,163

25

13,517

5,346

      NGLs – condensate (bopd)

103

89

16

103

44

      Oil (bopd)

2

2

5

      Total (boepd)

2,432

1,950

25

2,358

940

Average realized prices(2):

      Natural gas ($/Mcf)

7.07

5.36

32

6.50

5.36

      NGL – condensate ($/bbl)

84.36

46.97

80

75.89

46.57

      Oil ($/bbl)

76.47

63.61

36.81

      Company total ($/boe)

44.22

32.82

35

40.64

32.88

Operating netback ($/boe) (2)

      Realized sales price

44.22

32.82

35

40.64

32.88

      Royalties

(4.22)

(1.51)

179

(3.61)

(2.15)

      Production expenses

(3.62)

(3.39)

7

(3.64)

(3.88)

      Operating netback

36.38

27.92

30

33.39

26.85

Notes:

(1)

The weighted average number of diluted common shares outstanding in the computation of funds flow from operations and cash flows from operating activities per share is the same as for net income per share.

(2)

See “Non-GAAP and Other Financial Measures” section within this news release.

(3)

Includes non-cash capital expenditures of $0.4 million for the year-ended December 31, 2020.

2021 Results Webcast

Alvopetro will host a live webcast to discuss the 2021 financial results at 8:00 am Mountain time on March 18, 2022. Details for joining the event are as follows:

DATE: March 18, 2022TIME: 8:00 AM Mountain/10:00 AM EasternLINK: https://zoom.us/j/99386897923 DIAL-IN NUMBERS: https://zoom.us/u/aixrWbAbO WEBINAR ID: 993 8689 7923

The webcast will include a question and answer period. Online participants will be able to ask questions through the Zoom portal. Dial-in participants can email questions directly to socialmedia@alvopetro.com.

Corporate Presentation

Alvopetro’s updated corporate presentation is available on our website at:

http://www.alvopetro.com/corporate-presentation

Social Media

Follow Alvopetro on our social media channels at the following links:

Twitter – https://twitter.com/AlvopetroEnergy Instagram – https://www.instagram.com/alvopetro/ LinkedIn – https://www.linkedin.com/company/alvopetro-energy-ltd

Alvopetro Energy Ltd.’s vision is to become a leading independent upstream and midstream operator in Brazil. Our strategy is to unlock the on-shore natural gas potential in the state of Bahia in Brazil, building off the development of our Caburé natural gas field and our strategic midstream infrastructure.

Neither the TSX Venture Exchange nor its Regulation Services Provider (as that term is defined in the policies of the TSX Venture Exchange) accepts responsibility for the adequacy or accuracy of this news release.

All amounts contained in this new release are in United States dollars, unless otherwise stated and all tabular amounts are in thousands of United States dollars, except as otherwise noted.

Abbreviations:

2P

=

proved plus probable reserves

boepd

=

barrels of oil equivalent (“boe”) per day

bopd

=

barrels of oil and/or natural gas liquids (condensate) per day

BRL

=

Brazilian Real

CAD$

=

Canadian dollars

m3

=

cubic metre

Mboe

=

thousand barrels of oil equivalent

MMboe

=

million barrels of oil equivalent

Mcf

=

thousand cubic feet

MMcf

=

million cubic feet

MMcfpd

=

million cubic feet per day

NGLs

=

natural gas liquids

Q3 2021

=

three months ended September 30, 2021

Q4 2020

=

three months ended December 31, 2020

Q4 2021

=

three months ended December 31, 2021

Oil and Natural Gas Reserves

The disclosure in this news release summarizes certain information contained in the GLJ Reserves and Resources Report but represents only a portion of the disclosure required under NI 51-101. For additional details, see our news release dated March 8, 2022. Full disclosure with respect to the Company’s reserves as at December 31, 2021 is contained in the Company’s annual information form for the year ended December 31, 2021 which has been filed on SEDAR (www.sedar.com). All net present values in this press release are based on estimates of future operating and capital costs and GLJ’s forecast prices as of December 31, 2021. The reserves definitions used in this evaluation are the standards defined by the Canadian Oil and Gas Evaluation Handbook (COGEH) reserve definitions and are consistent with NI 51-101 and used by GLJ. The net present values of future net revenue attributable to the Alvopetro’s reserves estimated by GLJ do not represent the fair market value of those reserves. Other assumptions and qualifications relating to costs, prices for future production and other matters are summarized herein. The recovery and reserve estimates of the Company’s reserves provided herein are estimates only and there is no guarantee that the estimated reserves will be recovered. Actual reserves may be greater than or less than the estimates provided herein. Possible reserves are those additional reserves that are less certain to be recovered than probable reserves. There is a 10% probability that the quantities actually recovered will equal or exceed the sum of proved plus probable plus possible reserves.

Contingent Resources

This news release discloses estimates of Alvopetro’s contingent resources and the net present value associated with net revenues associated with the production of such contingent resources as included in the GLJ Reserves and Resources Report. There is no certainty that it will be commercially viable to produce any portion of such contingent resources and the estimated future net revenues do not necessarily represent the fair market value of such contingent resources. Estimates of contingent resources involve additional risks over estimates of reserves. For additional details with respect to Alvopetro’s contingent resources evaluated as at December 31, 2021, see our news release dated March 8, 2022 and additional details contained in the Company’s annual information form for the year ended December 31, 2021 which has been filed on SEDAR (www.sedar.com).

Prospective Resources

This news release discloses estimates of Alvopetro’s prospective resources included in the GLJ Reserves and Resources Report. There is no certainty that any portion of the prospective resources will be discovered and even if discovered, there is no certainty that it will be commercially viable to produce any portion. Estimates of prospective resources involve additional risks over estimates of reserves. The accuracy of any resources estimate is a function of the quality and quantity of available data and of engineering interpretation and judgment. While resources presented herein are considered reasonable, the estimates should be accepted with the understanding that reservoir performance subsequent to the date of the estimate may justify revision, either upward or downward. For additional details with respect to Alvopetro’s prospective resources evaluated as at December 31, 2021, see our news release dated March 8, 2022 and additional details contained in the Company’s annual information form for the year ended December 31, 2021 which has been filed on SEDAR (www.sedar.com).

Non-GAAP and Other Financial Measures

This news release contains references to various non-GAAP financial measures, non-GAAP ratios, capital management measures and supplementary financial measures as such terms are defined in National Instrument 52-112  Non-GAAP and Other Financial Measures Disclosure.  Such measures are not recognized measures under GAAP and do not have a standardized meaning prescribed by IFRS and might not be comparable to similar financial measures disclosed by other issuers. While these measures may be common in the oil and gas industry, the Company’s use of these terms may not be comparable to similarly defined measures presented by other companies. The non-GAAP and other financial measures referred to in this report should not be considered an alternative to, or more meaningful than measures prescribed by IFRS and they are not meant to enhance the Company’s reported financial performance or position. These are complementary measures that are used by management in assessing the Company’s financial performance, efficiency and liquidity and they may be used by investors or other users of this document for the same purpose. Below is a description of the non-GAAP financial measures, non-GAAP ratios, capital management measures and supplementary financial measures used in this news release. For more information with respect to financial measures which have not been defined by GAAP, including reconciliations to the closest comparable GAAP measure, see the “Non-GAAP Measures and Other Financial Measures” section of the Company’s MD&A which may be accessed through the SEDAR website at www.sedar.com.  

Non-GAAP Financial Measures

Operating netback

Operating netback is calculated as natural gas, oil and condensate revenues less royalties and production expenses. This calculation is provided in the “Operating Netback” section of the Company’s MD&A using our IFRS measures. The Company’s MD&A may be accessed through the SEDAR website at SEDAR website at www.sedar.com.  Operating netback is a common metric used in the oil and gas industry used to demonstrate profitability from operations.

Net Asset Value

Net asset value is calculated as the net present value of the Company’s 2P reserves discounted at 10% (before-tax) plus the Company’s working capital net of debt as of December 31, 2021. Working capital net of debt is a capital management measure described in further detail below The Company uses net asset value as a way to reflect the Company’s aggregate value of oil and gas reserves and working capital net of debt.

Non-GAAP Financial Ratios

Operating netback per boe

Operating netback is calculated on a per unit basis, which is per barrel of oil equivalent (“boe”). It is a common non-GAAP measure used in the oil and gas industry and management believes this measurement assists in evaluating the operating performance of the Company. It is a measure of the economic quality of the Company’s producing assets and is useful for evaluating variable costs as it provides a reliable measure regardless of fluctuations in production. Alvopetro calculated operating netback per boe as operating netback divided by total sales volumes (barrels of oil equivalent).  This calculation is provided in the “Operating Netback” section of the Company’s MD&A using our IFRS measures. The Company’s MD&A may be accessed through the SEDAR website at SEDAR website at www.sedar.com.  Operating netback is a common metric used in the oil and gas industry used to demonstrate profitability from operations on a per unit basis (boe).

Funds Flow from Operations Per Share

Funds flow from operations per share is a non-GAAP ratio that includes all cash generated from operating activities and is calculated before changes in non-cash working capital, divided by the weighted the weighted average shares outstanding for the respective period. For the periods reported in this news release the cash flows from operating activities per share and funds flow from operations per share is as follows:

Three Months Ended

December 31,

Year Ended

December 31,

$ per share

2021

2020

2021

2020

Per basic share:

Cash flows from operating activities

0.21

0.09

0.73

0.09

Funds flow from operations

0.19

0.13

0.74

0.19

Per diluted share:

Cash flows from operating activities

0.20

0.09

0.70

0.09

Funds flow from operations

0.18

0.13

0.71

0.18

Net Asset Value Per Share

Net asset value is calculated as the net asset value (discussed above) divided by the total shares outstanding, which is 33,903,629 as of the date of this news release. Net asset value per share is stated in CAD$ using the March 17, 2022 USD/CAD exchange rate of 1.265.   The Company uses net asset value per share as a way to reflect the Company’s aggregate value of oil and gas reserves and working capital net of debt on a per share basis.

Capital Management Measures

Funds Flow from Operations 

Funds flow from operations is a non-GAAP capital management measure that includes all cash generated from operating activities and is calculated before changes in non-cash working capital. The most comparable GAAP measure to funds flow from operations is cash flows from operating activities. Management considers both funds flow from operations important as it helps evaluate financial performance and demonstrates the Company’s ability to generate sufficient cash to fund future growth opportunities. Funds flow from operations should not be considered an alternative to, or more meaningful than, cash flows from operating activities however management finds that the impact of working capital items on the cash flows reduces the comparability of the metric from period to period. A reconciliation of funds flow from operations to cash flows from operating activities is as follows:

Three Months Ended

December 31,

Year Ended

December 31,

2021

2020

2021

2020

Cash flows from operating activities

7,088

3,124

24,291

3,061

Add back changes in non-cash working capital

(608)

1,128

346

3,155

Funds flow from operations

6,480

4,252

24,637

6,216

Net Working Capital

Net working capital is computed as current assets less current liabilities. Net working capital is a measure of liquidity, is used to evaluate financial resources, and is calculated as follows: 

As at December 31,

2021

2020

Total current assets

17,188

8,487

Total current liabilities

(8,091)

(2,948)

Net working capital surplus

9,097

5,539

Working Capital Net of Debt (Net Debt)

Working capital net of debt is computed as net working capital surplus decreased by the carrying amount of the Credit Facility. Working capital net of debt is used by management to assess the Company’s overall financial position. As of December 31, 2021, Alvopetro’s net working capital surplus exceeds the balance outstanding on the Credit Facility.

As at December 31,

2021

2020

Net working capital surplus

9,097

5,539

Credit Facility, balance outstanding

(6,545)

(15,423)

Working capital, net of debt (net debt)

2,552

(9,884)

Supplementary Financial Measures

Average realized natural gas price – $/Mcf” is comprised of natural gas sales as determined in accordance with IFRS, divided by the Company’s natural gas sales volumes.

Average realized NGL – condensate price – $/bbl” is comprised of condensate sales as determined in accordance with IFRS, divided by the Company’s NGL sales volumes from condensate.

Average realized oil price – $/bbl” is comprised of oil sales as determined in accordance with IFRS, divided by the Company’s oil sales volumes.

Average realized price – $/boe” is comprised of natural gas, condensate and oil sales as determined in accordance with IFRS, divided by the Company’s total natural gas, condensate and oil sales volumes (barrels of oil equivalent).

Royalties per boe” is comprised of royalties, as determined in accordance with IFRS, divided by the total natural gas, condensate and oil sales volumes (barrels of oil equivalent).

Production expenses per boe” is comprised of production expenses, as determined in accordance with IFRS, divided by the total natural gas, condensate and oil sales volumes (barrels of oil equivalent).

Forward-Looking Statements and Cautionary Language

This news release contains “forward-looking information” within the meaning of applicable securities laws. The use of any of the words “will”, “expect”, “intend” and other similar words or expressions are intended to identify forward-looking information. Forward–looking statements involve significant risks and uncertainties, should not be read as guarantees of future performance or results, and will not necessarily be accurate indications of whether or not such results will be achieved. A number of factors could cause actual results to vary significantly from the expectations discussed in the forward-looking statements. These forward-looking statements reflect current assumptions and expectations regarding future events. Accordingly, when relying on forward-looking statements to make decisions, Alvopetro cautions readers not to place undue reliance on these statements, as forward-looking statements involve significant risks and uncertainties. More particularly and without limitation, this news release contains forward-looking information concerning the plans relating to the Company’s operational activities, the expected natural gas price, gas sales and gas deliveries under Alvopetro’s long-term gas sales agreement, forecasted earnings, and the Company’s plans for dividends in the future. The forward–looking statements are based on certain key expectations and assumptions made by Alvopetro, including but not limited to equipment availability, the timing of regulatory licenses and approvals, the success of future drilling, completion, testing, recompletion and development activities, the outlook for commodity markets and ability to access capital markets, the impact of the COVID-19 pandemic and other significant worldwide events, the performance of producing wells and reservoirs, well development and operating performance, foreign exchange rates, general economic and business conditions, weather and access to drilling locations, the availability and cost of labour and services, environmental regulation, including regulation relating to hydraulic fracturing and stimulation, the ability to monetize hydrocarbons discovered, the regulatory and legal environment and other risks associated with oil and gas operations. The reader is cautioned that assumptions used in the preparation of such information, although considered reasonable at the time of preparation, may prove to be incorrect. Actual results achieved during the forecast period will vary from the information provided herein as a result of numerous known and unknown risks and uncertainties and other factors. In addition, the declaration, timing, amount and payment of future dividends remain at the discretion of the Board of Directors. Although Alvopetro believes that the expectations and assumptions on which such forward-looking information is based are reasonable, undue reliance should not be placed on the forward-looking information because Alvopetro can give no assurance that it will prove to be correct. Readers are cautioned that the foregoing list of factors is not exhaustive. Additional information on factors that could affect the operations or financial results of Alvopetro are included in our annual information form which may be accessed on Alvopetro’s SEDAR profile at www.sedar.com. The forward-looking information contained in this news release is made as of the date hereof and Alvopetro undertakes no obligation to update publicly or revise any forward-looking information, whether as a result of new information, future events or otherwise, unless so required by applicable securities laws.

SOURCE Alvopetro Energy Ltd.

Item 9 Labs (INLB) – Further Expansion into Colorado

Friday, March 18, 2022

Item 9 Labs (INLB)
Further Expansion into Colorado

Item 9 Labs Corp. (OTCQX: INLB) is a vertically integrated cannabis operator and dispensary franchisor delivering premium products from its large-scale cultivation and production facilities in the United States. The award-winning Item 9 Labs brand specializes in best-in-class products and user experience across several cannabis categories. The company also offers a unique dispensary franchise model through the national Unity Rd. retail brand. Easing barriers to entry, the franchise provides an opportunity for both new and existing dispensary owners to leverage the knowledge, resources, and ongoing support needed to thrive in their state compliantly and successfully. Item 9 Labs brings the best industry practices to markets nationwide through distinctive retail experience, cultivation capabilities, and product innovation. The veteran management team combines a diverse skill set with deep experience in the cannabis sector, franchising, and the capital markets to lead a new generation of public cannabis companies that provide transparency, consistency, and well-being. Headquartered in Arizona, the company is currently expanding its operations space by 650,000+ square feet on its 50-acre site, one of the largest properties in Arizona zoned to grow and cultivate flower. For additional information, visit item9labscorp.com.

Joe Gomes, Senior Research Analyst, Noble Capital Markets, Inc.

Joshua Zoepfel, Research Associate, Noble Capital Markets, Inc.

Refer to the full report for the price target, fundamental analysis, and rating.

    The Acquisition. Hot on the heels of the announced Reg A offering, Item 9 Labs’ is acquiring The Herbal Cure, a medicinal and recreational dispensary and cultivator in Denver. Herbal Cure had revenues of $5.4 million in 2021, and will be transitioning over the Unity Rd. brand over the next six months, pending approval from Colorado’s Marijuana Enforcement Division (the “MED”) and the City of Denver. Terms of the deal were not released.

    A Path for Item 9 Products.  With a 3,000 square-foot medicinal and recreational cultivation facility, The Herbal Cure will enable Item 9 Labs to introduce its award-winning cannabis products to the Colorado market in the year ahead. Item 9 will have a built-in base of three dispensaries through which to sell its product and the potential to penetrate non-Unity Rd. dispensaries …


This Company Sponsored Research is provided by Noble Capital Markets, Inc., a FINRA and S.E.C. registered broker-dealer (B/D).

*Analyst certification and important disclosures included in the full report. NOTE: investment decisions should not be based upon the content of this research summary. Proper due diligence is required before making any investment decision. 


Release – ProMIS Neurosciences Announces Fiscal Year 2021 Results


ProMIS Neurosciences Announces Fiscal Year 2021 Results

News and Market Data on ProMIS Neurosciences


TORONTO, Ontario and CAMBRIDGE, Massachusetts , March 17, 2022 (GLOBE NEWSWIRE) — ProMIS Neurosciences, Inc. (TSX: PMN) (OTCQB: ARFXF) (“ProMIS” or the “Company”), a biotechnology company focused on the discovery and development of antibody therapeutics targeting misfolded proteins such as toxic oligomers, implicated in the development of neurodegenerative diseases, today announced its operational and financial results for the fiscal year ended December 31, 2021.

“2021 was an excellent year for ProMIS including strong capital formation which enabled us to advance and expand our portfolio of differentiated therapeutic product candidates such as Alzheimer’s disease (AD), ALS, and Schizophrenia,” said Gene Williams, ProMIS’ Chairman and CEO.   “We feel privileged that leading global experts continue to join our Scientific Advisory Board (SAB), accomplished executives are joining our Board of Directors, and that we have been able to supplement our strong management team, and we expect to continue those trends. We were grateful for the strong shareholder support for the resolution necessary to qualify for a potential listing on a major North American stock exchange presuming we meet the required listing standards. While biotechnology markets and specific disease sectors within biotechnology have cyclical ups and downs, we are well positioned to continue making substantive progress in our programs that could allow us to capitalize when markets rebound, as we believe they will.”

PMN310, an antibody selective for toxic oligomers in AD, is ProMIS’ lead product candidate. In the fourth quarter of 2021, the Company made significant progress on the program elements.

Producer cell line development is advancing. The genetic sequence of PMN310 has been transfected into Chinese hamster ovary (CHO) cells, the standard production cells for antibody manufacturing. We have contractually secured manufacturing slots for material to be used in Good Laboratory Practice (GLP) toxicology studies and for current Good Manufacturing Practice (cGMP) material for use in the initial clinical trials of PMN310, if allowed to proceed. In addition, we have contractually secured slots for GLP toxicology studies of various durations in nonhuman primates to support our single ascending dose/multiple ascending dose (SAD/MAD) trials. We have initiated pilot toxicology and pharmacokinetics (PK) studies to provide important information to support our GLP toxicology studies. We expect those PK studies to be completed in the second quarter of 2022. We also have secured slots for pilot and GLP tissue cross reactivity (TCR) studies, which are required for an investigational new drug (IND) application, in addition to GLP toxicology. The pilot TCR study was initiated fourth quarter of 2021 with an expected completion in second quarter 2022. Development of assays to measure drug levels in both nonhuman primate and human studies have been initiated and are expected to complete development in second quarter of 2022. Vendors have been contracted to perform these assays for our GLP studies.

In addition, in March 2022, we announced the results from a study assessing chronic systemic administration of PMN310 in a transgenic mouse model of Alzheimer’s disease, where the cognitive deficit is driven by toxic amyloid-beta oligomers. The results were positive, showing that PMN310 prevented a cognitive deficit as measured by performance in the water maze task.   

Cash expenditures for PMN310 in the six months ended December 31, 2021 were approximately $3.8 million. The largest component of this was a $2.7 million up-front and additional payments to our manufacturing vendor to secure manufacturing slots necessary for the filing of an IND and dosing of patients in our initial clinical trials. In addition, $834,000 of other external expenses and $326,000 was incurred for consulting fees of the program team, not including allocations of senior management time.

ALS Portfolio, including TAR-DNA binding protein 43 (TDP-43)

The top priority for our scientific validation efforts, largely centered in Dr. Neil Cashman’s laboratory at the University of British Columbia (UBC), is the Company’s ALS portfolio. This portfolio includes antibodies targeting misfolded forms of TDP-43, RACK1, and superoxide dismustase 1 (SOD1). TDP-43 is the focus of the PMN267 program. We are conducting both in vitro assays (assessing the impact of the drug on patient-derived motor neuron cell lines) and in vivo assays (mouse model) and expect initial data in the first half of 2022. In addition, we are exploring different therapeutic modalities in our ALS portfolio. We have disclosed data from our proof of concept work exploring “intrabody” versions of TDP-43 antibodies, a research proxy for a vectorized antibody in a gene therapy vector. We believe this therapeutic approach could enhance therapeutic benefit inside the motor neurons where misfolded TDP-43 aggregates are a root cause of disease pathology, leading to toxic misfolding of other proteins including RACK1 and SOD1. ProMIS’ capability to create highly selective antibodies is most critical in this application, since physiologically important TDP-43 is active inside the neuron and should be avoided by the intrabodies in order to reduce the possibility of harmful side effects. Based on the characterization of selected antibodies/intrabodies to date, we have declared PMN267 as our lead product candidate for the treatment of ALS. In addition, with world expert RNA scientist Dr. Michelle Hastings, ProMIS is exploring antisense oligonucleotide (ASO) therapeutic approaches, and with Dr. Justin Yerbury, is exploring protein degradation (PROTACS) approaches in ALS.

While targeting individual misfolded proteins is expected to provide a benefit, we believe an optimal disease modifying therapeutic approach to ALS may require addressing multiple misfolded protein targets (TDP-43, RACK1, and SOD1), with different modalities (antibody, gene therapy vectorized antibody, ASO, PROTAC). We are exploring the scientific interaction between therapies addressing these various targets, and our goal is to identify and develop a portfolio of complementary therapies that alone and/or together may play a significant role in effectively treating disease.

In the six months ended December 31, 2021, our total expenditures for the ALS portfolio were $299,000, not including allocations of senior management time.

Other key projects

In the six months ended December 31, 2021 we made significant progress on other key projects, in addition to our top priorities PMN310 for AD and PMN267 for ALS. We have engaged with a leading global expert in alpha synuclein to collaborate on further in vitro and in vivo validation of our potential therapies targeting alpha synuclein, both as extracellular antibodies and as intrabodies. Based on the characterization of selected antibodies to date, we have declared PMN442 as our lead alpha synuclein product candidate. Data from in vivo testing in mouse disease models are expected in the second half of 2022.

In our amyloid vaccine program, based on successful pilot work, University of Saskatchewan vaccine and infectious disease organization (VIDO) is conducting mouse studies in collaboration with ProMIS for the development of an optimized vaccine against Alzheimer’s disease, conjugating our peptide antigens to a carrier protein in formulation with an adjuvant. David Wishart, our Chief Physics Officer, and his team, are pursuing multiple novel targets including DISC1 involved in the pathogenesis of schizophrenia.

Recent Corporate Highlights

On May 12, 2021, Rudolph Tanzi, Ph.D., was appointed as the Chair of the Company’s Scientific Advisory Board (SAB). Dr. Tanzi is the Joseph P. and Rose F. Kennedy Professor of Neurology at Harvard University and Vice-Chair of Neurology, Director of the Genetics and Aging Research Unit, and Co-Director of the Henry and Allison McCance Center for Brain Health at Massachusetts General Hospital.

On May 21, 2021, the Company re-initiated the path to an IND application for PMN310 in Alzheimer’s with the start of producer cell line development. This key first step in the manufacturing of antibody therapeutics is being conducted by Selexis, SA, using its proprietary SUREtechnology Platform™.

On May 27, 2021, Dr. David Wishart, Distinguished University Professor in the Departments of Biological Sciences and Computing Science at the University of Alberta, was appointed as Chief Physics Officer.

On June 3, 2021, the Company announced that it had filed a preliminary Prospectus with the securities regulators in each of the provinces and territories of Canada, except Quebec. The Prospectus, when made final, will allow the Company to make offerings of common shares, warrants, units, debt securities, subscription receipts, convertible securities or any combination thereof for up to an aggregate total of US$50 million during the 25-month period that the Prospectus is effective.

On July 2, 2021, the Company announced the voting results of its annual meeting of shareholders held on June 30, 2021, in Vancouver, British Columbia, Canada. All resolutions described in the Management Proxy Circular and placed before the meeting were approved by the shareholders.

On July 8, 2021, the Company announced that it had filed and obtained a receipt for the Prospectus with the securities regulators in each of the provinces and territories of Canada, except Quebec.

On August 25, 2021, the Company announced the closing of a public offering for gross proceeds of US$20,125,000 (CDN$25,522,525).

On October 7, 2021, ProMIS announced that it would hold a special general meeting of shareholders (the “Special Meeting”) on December 1, 2021. The Company set October 18, 2021, as the record date for the Special Meeting. The purpose of the Special Meeting was to ask shareholders to grant the Board the authority, exercisable in the Board’s discretion, to consolidate (or reverse split) the Company’s issued and outstanding common shares in furtherance of a potential listing of the Company’s shares on a stock exchange in the United States, subject to meeting applicable quantitative and qualitative listing standards of such stock exchange. There can be no assurance that the Company will complete a listing on a stock exchange in the United States.

On December 2, 2021, the shareholders of the Company passed the share consolidation resolution at its special general meeting of shareholders.

On January 18, 2022, ProMIS appointed Dr. Carsten Korth to its SAB.

On January 27, 2022, ProMIS appointed Dr. Cheryl Wellington to its SAB.

On February 3, 2022, ProMIS appointed Dr. Guy Rouleau and Dr. Alain Dagher to its Scientific Advisory Board.

Financial highlights as of and for the year ended December 31, 2021, include:

  • In March 2021, the Company completed a US$7.0 million (CDN$8.7 million) private placement of unsecured convertible debentures (Debentures).

  • In August 2021, the Company raised gross proceeds of $25,522,525 ($23,426,746 net of share issuance costs).

  • On December 31, 2021, the Company had funds available for operating activities (cash, cash equivalents and short-term investments) of $21,486,042, as compared to $1,071,004 at December 31, 2020. Our cash is sufficient to finance the Company’s operations through the end of 2023.

Additions to Board of Directors

  • On May 19, 2021, the Company appointed Neil Warma, to the Company’s Board of Directors. Mr. Warma has been a healthcare entrepreneur for more than 25 years having managed and advised numerous biotechnology and pharmaceutical companies.
  • On September 1, 2021, the Company appointed Josh Mandel-Brehm to the Board of Directors. Mr. Mandel-Brehm has held various key business development and operations leadership roles at leading biotechnology companies.
  • On September 23, 2021, the Company appointed Maggie Shafmaster, JD, Ph.D., to the Board of Directors. Dr. Shafmaster has approximately 30 years of experience providing intellectual property advice to biotechnology and pharmaceutical industries.

Senior Management Team

On October 22, 2021, the Company announced the expansion of its senior management team. The following changes were announced:

  • Eugene Williams, formerly Executive Chairman, takes on the role of Chairman and Chief Executive Officer (“CEO”), with immediate effect.
  • Dr. Elliot Goldstein resigned from his current role as CEO with immediate effect and continues to support us as President and special consultant to the CEO.
  • Gavin Malenfant joined our senior management team as Chief Operating Officer. Mr. Malenfant brings more than 30 years of biopharmaceutical experience to our team, with special focus on providing expert management and oversight of drug development programs. The top priority in the near term will be to support the timely development of the PMN310 program to completion of IND enabling activities, anticipated in the second half of 2022. 

Financial Results

Results of Operations – For the years ended December 312021 and 2020

The following table summarizes our results of operations for the years ended December 31, 2021 and 2020:

    Years Ended          
    December 31,          
    2021     2020     Change  
       
Revenues   $ 16,410     $ 1,787     $ 14,623  
Operating expenses                        
Research and development     6,310,299       3,183,149       3,127,150  
General and administrative     4,224,609       2,481,030       1,743,579  
Total operating expenses     10,534,908       5,664,179       4,870,729  
Loss from operations     10,518,498       5,662,392       4,856,106  
Other expense     1,265,917             1,265,917  
Net loss   $ 11,784,415     $ 5,662,392     $ 6,122,023  

Revenues

The increase in revenues in the year ended December 31, 2021 represent royalties received on the Company’s assays.

Research and Development

Research and development expenses consist of the following:

    Years Ended          
    December 31,          
    2021     2020     Change  
       
Direct research and development expenses by program:   $ 4,293,649     $ 976,700     $ 3,316,949    
Indirect research and development expenses:                        
Personnel related (including stock-based compensation)     812,278       1,672,145       (859,867 )  
Consulting expense     588,164       173,712       414,452    
Patent expense     557,957       344,864       213,093    
Other operating costs     58,251       15,728       42,523    
Total research and development expenses   $ 6,310,299     $ 3,183,149     $ 3,127,150    

The increase in research and development expense for the year ended December 31, 2021, compared to the year ended December 31, 2020, reflects increased costs associated with external contract research organizations for internal programs of $3,316,949 as the Company ramps up key internal programs and contract research organization costs, increased patent expense of $213,093 due to increased maintenance and filing fees, increased consulting expense of $414,452 and increase in amortization of property and equipment and intangible asset of $42,523 offset by decreased contract salaries and associated costs of $859,867 due to reduction in compensation to management and attrition of contracted staff and decreased share-based compensation of $154,015 due to forfeiture of unvested/vested share options due to termination of consulting arrangement.

General and Administrative

General and administrative expenses consist of the following:

    Years Ended December 31,          
    2021     2020     Change  
    (in thousands)  
Personnel related (including stock-based compensation)   $ 1,279,197     $ 1,191,967     $ 87,230  
Professional and consulting fees     2,801,237       1,311,427       1,489,810  
Facility-related and other     144,175       (22,364 )     166,539  
Total general and administrative expenses   $ 4,224,609     $ 2,481,030     $ 1,743,579  

The increase for the year ended December 31, 2021, compared to the same period in 2020, is primarily attributable to an increase in legal expenses of $159,113, increased other professional, legal and consulting fees of 423,378, additional one-time fees of $459,051 related to a potential listing on a stock exchange in the United States, (subject to meeting applicable quantitative and qualitative listing standards of such stock exchange), increased share-based compensation of $306,695 related to the grant of share options, expensing of share issuance costs associated with the issuance of warrants in the August 2021 financing and base shelf costs of $717,806 and foreign exchange of expense of $166,539 on U.S. denominated assets and liabilities offset by a reduction in contracted corporate salaries and associated facility costs of $219,465 due to reduction in compensation to management and attrition of contracted staff and a decreased investor relations of $332,558 due to a reduction of investor relation activities and consultants.   Note that there can be no assurance that the Company will complete a listing on a stock exchange in the United States.  

Other Expense

The increase in other expense is primarily the valuation of the derivative liability associated with the convertible debenture financing and associated interest expense of $2,990,375 offset by the decrease in fair value of the warrant liability of $1,411,467 and the gain on the sale of lab equipment of $75,198.

About ProMIS Neurosciences, Inc.

ProMIS Neurosciences, Inc. is a development stage biotechnology company focused on discovering and developing antibody therapeutics selectively targeting toxic oligomers implicated in the development and progression of neurodegenerative diseases, in particular Alzheimer’s disease (AD), amyotrophic lateral sclerosis (ALS) and Parkinson’s disease (PD). The Company’s proprietary target discovery engine is based on the use of two complementary techniques. The Company applies its thermodynamic, computational discovery platform -ProMIS™ and Collective Coordinates – to predict novel targets known as Disease Specific Epitopes on the molecular surface of misfolded proteins. Using this unique approach, the Company is developing novel antibody therapeutics for AD, ALS and PD. ProMIS is headquartered in Toronto, Ontario, with offices in Cambridge, Massachusetts. ProMIS is listed on the Toronto Stock Exchange under the symbol PMN, and on the OTCQB Venture Market under the symbol ARFXF.

Visit us at www.promisneurosciences.com, follow us on Twitter and LinkedIn

For Investor Relations please contact:
Alpine Equity Advisors
Nicholas Rigopulos, President
nick@alpineequityadv.com
Tel. 617 901-0785

The TSX has not reviewed and does not accept responsibility for the adequacy or accuracy of this release. Certain information in this news release constitutes forward-looking statements and forward-looking information (collectively, ??”forward-looking information”) within the meaning of applicable securities laws. In some cases, but not necessarily in all cases, forwardlooking information can be identified by the ?use of forward-looking terminology such as “plans”, “targets”, “expects” or “does not expect”, “is expected”, “an opportunity exists”, ??”is positioned”, “estimates”, “intends”, “assumes”, “anticipates” or “does not anticipate” or “believes”, or variations of such words and ?phrases or state that certain actions, events or results “may”, “could”, “would”, “might”, “will” or “will be taken”, “occur” or “be ?achieved”. In addition, any statements that refer to expectations, projections or other characterizations of future events or ?circumstances contain forward-looking information. ?Specifically, this news release contains forward-looking information relating to future management and Board composition of the Company; the potential listing of the Company’s shares on a stock exchange in the United States; the expectation that markets will rebound; the expected completion date of various studies and timelines for the development of assays; the potential benefits of targeting misfolded proteins; and the timing of PMN 442 in vivo testing data in mouse disease models. Statements containing forward-looking information are not historical facts but instead represent management’s current ?expectations, estimates and projections regarding the future of our business, future plans, strategies, projections, anticipated events ?and trends, the economy and other future conditions. Forward-looking information is necessarily based on a number of opinions, ?assumptions and estimates that, while considered reasonable by the Company as of the date of this news release, are subject to ?known and unknown risks, uncertainties, assumptions and other factors that may cause the actual results, level of activity, ?performance or achievements to be materially different from those expressed or implied by such forward-looking information. Important factors that could cause actual results and financial condition to differ materially from those indicated in the forward-looking information include, among others, the factors discussed throughout the “Risk Factors” section of the Company’s most recently filed annual information form available on www.SEDAR.com. Except as required by applicable securities laws, the Company undertakes no obligation to publicly update any forward-looking information, whether written or oral, that may be made from time to time, whether as a result of new information, future developments or otherwise.

Source: ProMIS Neurosciences Inc.

Release – Sierra Metals Reports 2021 Consolidated Financial Results And Announces 2022 Guidance


Sierra Metals Reports 2021 Consolidated Financial Results And Announces 2022 Guidance

Research, News, and Market Data on Sierra Metals


CONFERENCE CALL MARCH 17, 2022 – NEW TIME – NOW AT 11:00 AM (EDT)

(All $ figures reported in USD)

  • Revenue from metals payable of $272.0 million in 2021, an increase of 10% from 2020 annual revenue of $246.9 million, largely a result of the increase in realized prices for all metals as compared to 2020;
  • Adjusted EBITDA(1) of $104.7 million for 2021, which is a 2% increase from the adjusted EBITDA of $102.8 million for 2020. The increase in adjusted EBITDA is due to the increase in gross margins at the Yauricocha and Cusi mines;
  • Net loss attributable to shareholders for 2021 was $27.4 million or of $(0.17) per share compared to a net income of $23.4 million or $0.14 per share in 2020. Net losses for the year ended 2021 include a non-cash impairment charge of $35 million related to the Cusi mine;
  • Adjusted net income attributable to shareholders of $21.6 million or $0.13 per share for 2021;
  • Operating cash flows before movements in working capital of $93.4 million for 2021, a 4% decrease from $97.8 million in 2020, due to higher G&A costs in 2021;
  • 2021 consolidated annual ore throughput of 2,902,220 tonnes, an increase of 3% over 2020, mainly driven by the higher throughputs from the Yauricocha and Cusi mines, offset by a decline in the Bolivar annual throughput due to a reduced workforce;
  • Consolidated copper equivalent production of 90 million pounds, a decrease of 24% as compared to 2020, due to a combination of production issues at Bolivar and lower grades at Yauricocha, where a 12% increase in annual throughput at Yauricocha, did not compensate for the lower grades:
  • Consolidated All-In sustaining costs (“AISC”) (1) per copper equivalent pound (2) sold of $3.40 in 2021, or 60% higher than AISC in 2020, driven by higher sustaining capital and the 27% decrease in copper equivalent payable pounds in 2021 compared to 2020;
  • $34.9 million of cash and cash equivalents as at December 31, 2021;
  • Net Debt of $45.9 million as at December 31, 2021.
  • A shareholder conference call to be held Thursday, March 17, 2022, at 11:00 AM (EDT)
    (1) This is a non-IFRS performance measure, see Non-IFRS Performance Measures section of the MD&A. (2) Copper equivalent pounds and silver equivalent ounces for Q4 2021 were calculated using the following realized prices: $23.41/oz Ag, $4.40/lb Cu, $1.55/lb Zn, $1.06/lb Pb, $1,795/oz Au. Copper equivalent pounds and silver equivalent ounces for Q4 2020 were calculated using the following realized prices: $24.30/oz Ag, $3.32/lb Cu, $1.22/lb Zn, $0.89/lb Pb, $1,859/oz Au. Copper equivalent pounds and silver equivalent ounces for full year 2021 were calculated using the following realized prices: $25.21/oz Ag, $4.23/lb Cu, $1.37/lb Zn, $1.00/lb Pb, $1,796/oz Au. Copper equivalent pounds and silver equivalent ounces for full year 2020 were calculated using the following realized prices: $20.59/oz Ag, $2.80/lb Cu, $1.03/lb Zn, $0.83/lb Pb, $1,771/oz Au.

TORONTO–(BUSINESS WIRE)– Sierra Metals Inc. (TSX:SMT)(BVL:SMT)(NYSE American:SMTS) (“Sierra Metals” or the “Company”) today reported revenue of $272.0 million and an adjusted EBITDA of $104.7 million on the throughput of 2.9 million tonnes and metal production of 89.9 million copper equivalent pounds for the year ended December 31, 2021.

The following table displays selected financial and operational information for the three months and year ended December 31, 2021:

Three Months Ended Year Ended
(In thousands of dollars, except per share and cash cost amounts, consolidated figures unless noted otherwise) December 31, 2021 December 31, 2020 December 31, 2021 December 31, 2020
Operating
Ore Processed / Tonnes Milled


590,057


778,236


2,902,220


2,828,877

Silver Ounces Produced (000’s)


805


922


3,527


3,465

Copper Pounds Produced (000’s)


6,071


10,626


31,757


44,262

Lead Pounds Produced (000’s)


6,011


7,630


30,816


32,972

Zinc Pounds Produced (000’s)


14,913


21,612


79,281


81,868

Gold Ounces Produced


1,863


3,363


9,572


13,771

Copper Equivalent Pounds Produced (000’s)1


17,841


29,267


89,926


118,214

 
Cash Cost per Tonne Processed

$

58.21


$

44.42

$

48.69


$

40.81

Cash Cost per CuEqLb2

$

2.29


$

1.31

$

1.81


$

1.13

AISC per CuEqLb2

$

4.13


$

2.56

$

3.40


$

2.12

 
Cash Cost per CuEqLb (Yauricocha)2

$

1.61


$

1.16

$

1.46


$

1.01

AISC per CuEqLb (Yauricocha)2

$

3.09


$

2.47

$

2.77


$

2.11

Cash Cost per CuEqLb (Bolivar)2

$

5.29


$

1.35

$

2.18


$

1.13

AISC per CuEqLb (Bolivar)2

$

8.58


$

2.34

$

4.22


$

1.88

Cash Cost per AgEqOz (Cusi)2

$

11.80


$

15.70

$

16.71


$

16.62

AISC per AgEqOz (Cusi)2

$

21.09


$

28.18

$

28.15


$

25.26

Financial
Revenues

$

62,240


$

76,218

$

272,014


$

246,888

Adjusted EBITDA2

$

18,843


$

33,725

$

104,732


$

102,833

Operating cash flows before movements in working capital

$

15,419


$

32,259

$

93,405


$

97,757

Adjusted net income attributable to shareholders2

$

5,443


$

8,670

$

21,571


$

30,817

Net income (loss) attributable to shareholders3

$

(34,716

)

$

7,603

$

(27,363

)

$

23,419

Cash and cash equivalents

$

34,929


$

71,473

$

34,929


$

71,473

Working capital

$

17,321


$

70,885

$

17,321


$

70,885

 
(1) Copper equivalent pounds and silver equivalent ounces for Q4 2021 were calculated using the following realized prices: $23.41/oz Ag, $4.40/lb Cu, $1.55/lb Zn, $1.06/lb Pb, $1,795/oz Au. Copper equivalent pounds and silver equivalent ounces for Q4 2020 were calculated using the following realized prices: $24.30/oz Ag, $3.32/lb Cu, $1.22/lb Zn, $0.89/lb Pb, $1,859/oz Au. Copper equivalent pounds and silver equivalent ounces for full year 2021 were calculated using the following realized prices: $25.21/oz Ag, $4.23/lb Cu, $1.37/lb Zn, $1.00/lb Pb, $1,796/oz Au. Copper equivalent pounds and silver equivalent ounces for full year 2020 were calculated using the following realized prices: $20.59/oz Ag, $2.80/lb Cu, $1.03/lb Zn, $0.83/lb Pb, $1,771/oz Au.
(2) This is a non-IFRS performance measure, see Non-IFRS Performance Measures section of the MD&A.
(3) Net loss attributable to shareholders for Q4 and year 2021 includes an impairment charge of $35.0 million on the Cusi mine.

Luis Marchese, CEO of Sierra Metals, stated:“Despite the unprecedented difficulties of 2021, the Company reported a slight increase to Adjusted EBTIDA of $104.7 million. While consolidated annual ore throughput increased, Yauricocha and Cusi metal production did not fully compensate for the lower throughput and grades at Bolivar, resulting in a marked decline in consolidated copper equivalent production of 24% year over year. We are taking significant steps to improve operations at our Bolivar Mine, including a substantial allocation of 2022 budgeted capital expenditures toward reducing backlog of infill drilling and mine development, improved availability of equipment and controls, detailed review of processes and a thorough review of the current organization. We are focused on Bolivar’s operational turnaround so that it can deliver on its potential, by H2 2022.

He continued, “In addition to an emphasis on operational improvements at Bolivar, the Company is committed to delivering on the goals outlined in its new strategy in Q4 of 2021. A strategic review of Cusi is underway, changes have been made to the organizational structure to better align all operations and achieve goals, and with a heightened focus on ESG, the Company’s inaugural sustainability report is planned for completion in 2022.”

He concluded,“We entered 2022 with a renewed motivation to address major challenges and deliver meaningful returns to our shareholders. COVID-19 safety protocols remain in place and with operations returning to normal, the Company expects to be able to fully catch up and meet its operational and growth initiatives in 2022. Major growth projects at the Yauricocha Mine include the expansion of the tailings dam and sinking of the Yauricocha shaft. At the Bolivar mine, growth will be focused around the expansion of plant capacity and the integration tunnel which will link the mine to the mill, creating efficiencies and cost reduction by eliminating truck haulage of ore to the mill. Both projects are planned for completion by the end of Q4 2022. Additionally, we are committed to continuing to grow our reserve and resource base. An intense infill drilling program is planned for the year and we expect to complete MRMR updates and include the Technical Reports for the Yauricocha and Bolivar Mines in 2022. We are optimistic that these updated reports will provide for expanded reserves and resources at the mines.”

12M 2021 Operating Highlights

Consolidated annual ore throughput of 2,902,220 tonnes, an increase of 3% over 2020, mainly driven by the higher throughputs from the Yauricocha and Cusi mines, offset by a decline in the Bolivar annual throughput.

The Yauricocha mine received its Informe Tecnico Minero (“ITM”) permit in June 2021, allowing for an operating capacity of 3,600 tpd. Achieving the maximum annual permitted capacity, throughput at Yauricocha was 1,256,847 tonnes, or an increase of 12% from the 2020 annual production.

Annual throughput of 295,771 tonnes at Cusi was 28% higher as the mine operated throughout the year, as compared to the year 2020, when almost four months of production was lost during the care and maintenance period resulting from the government mandated shutdown.

The Bolivar mine achieved annual throughput of 1,349,602 tonnes, which was 9% lower than the 2020 throughput, as the mine continued to face manpower issues such as reduced workforce due to COVID and high turnover in middle and senior management.

Consolidated copper equivalent production dropped 24% as compared to 2020 due to the aforementioned production issues at Bolivar and as higher throughput at Yauricocha could not compensate from lower grades during the year. Metal production was higher at Cusi, driven by higher throughput and grades.

Yauricocha’s cash cost per copper equivalent payable pound was $1.46 (2020 – $1.01), and AISC per copper equivalent payable pound of $2.77 (2020 – $2.11).

Bolivar’s cash cost per copper equivalent payable pound was $2.18 (2020 – $1.13), and AISC per copper equivalent payable pound was $4.22 (2020 – $1.88).

Cusi’s cash cost per silver equivalent payable ounce was $16.71 (2020 – $16.62), and AISC per silver equivalent payable ounce was $28.59 (2020 – $25.26).

Click here to review the full details of the Q4 2021 production highlights.

Q4 and 12M 2021 Financial Highlights

Revenue from metals payable of $272.0 million in 2021, an increase of 10% from 2020 annual revenue of $246.9 million. Higher revenue was largely a result of the increase in realized prices for all metals as compared to 2020;

Adjusted EBITDA(1) of $104.7 million for 2021, which is a 2% increase from the adjusted EBITDA of $102.8 million for 2020;

Net loss attributable to shareholders for 2021 was $27.4 million (2020: $23.4 million) or $(0.17) per share (basic and diluted) (2020: $0.14) Net losses for Q4 and the year ended 2021 included an impairment charge of $35.0 million related to the Cusi mine;

Adjusted net income attributable to shareholders (1) of $21.6 million, or $0.13 per share, for 2021 was lower than the adjusted net income of $30.8 million, or $0.19 per share for 2020;

Cash flow generated from operations before movements in working capital of $93.4 million for 2021 was lower than the $97.8 million in 2020, mainly due to higher G&A costs in 2021; and

Cash and cash equivalents of $34.9 million and working capital of $17.3 million as at December 31, 2021 compared to $71.5 million and $70.9 million, respectively, at the end of 2020. Cash and cash equivalents decreased during 2021 as the $70.9 million used in investing activities and $36.9 million used in financing activities exceeded cash generated from operating activities of $71.4 million.

(1) This is a non-IFRS performance measure, see Non-IFRS Performance Measures section of the MD&A.

Project Development

On August 16, 2021, the Company reported the inclusion of iron ore production in the 10,000 tonnes per day (“tpd”) Preliminary Economic Assessment (“PEA”) for its Bolivar Mine. The updated PEA indicated an incremental benefit of after-tax NPV (@8%) of $78.2 million and IRR of 69.0% versus the NPV of $57.4 million and IRR of 27.9% reported in the original PEA. A National Instrument 43-101 (“NI 43-101”) technical report was filed on SEDAR and with the U.S. Securities and Exchange Commission on September 29, 2021. Click here to review the press release containing highlights of the Bolivar PEA.

After the close of the year, the Company announced positive results of the updated PEA on expansion of its Yauricocha Mine. This updated PEA included the last reported resource dated March 31, 2021 and revised Prefeasibility Study (“PFS”) level operating and capital expenditure. The Technical Report was filed on March 3, 2022. Click here to review the press release containing highlights of the updated Yauricocha PEA.

Exploration Highlights

Peru:

  • During the year, 9,719 meters of surface exploration using diamond drills were carried out in the Kilkasca, El Estacion, Yauricocha Medio, Fortuna and Exito zones. Further, 18,509 meters of underground exploration was completed with the aim of replacing and increasing the mineral resources exploited during the year.

Mexico:

   Bolivar

  • During the year, 19,804 meters of infill drilling program was carried out at Bolivar including 13,072 meters in the El Gallo zone and 4,422 meters in the Bolivar West zone; and
  • 25,260 meters of brownfield exploration was completed in the Bolivar West and La Montura zones.

   Cusi

  • The Infill Drilling program was carried out in the NorthEast and the North-NorthWest system, with the objective to define the continuity and the grades of both systems. 21,059 meters of drilling was completed, including 4,702 meters of definition drilling into these systems with the termite rig; and
  • Brownfield exploration drilling program started at San Juan, San Antonio and Gallo Back veins and 4,703 meters of drilling was completed during the year.

IMPAIRMENT CHARGE

In Q4 2021, the Company announced its increased focus on copper and other steel-making products, including the strategic review process for the silver-producing Cusi Mine in Mexico. As part of this process, the carrying value of Cusi was reviewed. As a result, a non-cash impairment charge of $35 million was recognized for the year ended December 31, 2021.

2022 Guidance

Production Guidance

The year 2021 was a challenging year for the mining operations of the Company due to the decrease in grades at Yauricocha and Bolivar, and availability of ore, as lack of equipment and decrease in manpower impacted development mainly at the Bolivar mine. Despite the COVID related issues, operations at Yauricocha and Cusi are gradually returning to normalcy. However, the Company anticipates that the backlog of ongoing operational challenges at Bolivar will be overcome during the year, leading to much improved production starting Q3 2022. During this period, the Company’s focus will be on increasing the infill drilling and development and the expansion of the plant facility with the objective to gradually achieve an average Q4 2022 throughput rate at Bolivar of 5,600 tpd, as compared to the 3,000 tpd in Q1 2022. With addressing of these development issues in the mine and plant infrastructure expansion, a much-improved performance is anticipated in the second half of the year. In view of this, full year guidance for the year has been split into H1 and H2 2022.

A table summarizing 2022 production guidance has been provided below:

H1 2022 H2 2022 2022 Guidance
Low High Low High Low High
 
Silver (oz)

1,490,500

1,591,500

1,712,000

1,769,000

3,202,500

3,360,500

Gold (oz)

5,000

6,000

10,500

11,500

15,500

17,500

Zinc (000 lbs)

23,500

27,500

25,500

27,000

49,000

54,500

Lead (000 lbs)

8,500

9,500

8,000

8,000

16,500

17,500

Copper (000 lbs)

13,500

16,500

21,000

24,500

34,500

41,000


Copper equivalent pounds (000’s)(1)

34,000

39,500

45,500

50,100

79,500

89,700


(1) Copper equivalent guidance is calculated using the March 2022 CIBC analyst consensus commodity price forecast: $23.68/oz Ag, $4.22/lb Cu, $1.42/lb Zn, $0.99/lb Pb, $1,789/oz Au.

2022 Cost Guidance

A mine by mine breakdown of 2022 production guidance, cash costs and all-in sustaining costs (“AISC”) are included in the table below. All costs are in USD. Cash costs and AISC guidance is shown per copper equivalent payable pound at Yauricocha and Bolivar, and silver equivalent payable ounce at Cusi.

Equivalent Production

Cash cost range per

AISC(2) range per

Range (1)

CuEqLb or AgEqOz

CuEqLb or AgEqOz

 
Yauricocha

Cu Eq Lbs (000s)

45,000 – 49,000 $2.00 – $2.15 $2.90 – $3.10
Bolivar

Cu Eq Lbs (000s)

23,800 – 29,900 $2.15 – $2.30 $3.50 – $3.85
Cusi

Ag Eq Oz (000s)

1,750 – 1,850 $16.45 – $16.50 $22.00 – $23.00


(1) Copper equivalent guidance is calculated using the March 2022 CIBC analyst consensus commodity price forecast: $23.68/oz Ag, $4.22/lb Cu, $1.42/lb Zn, $0.99/lb Pb, $1,789/oz Au.

(2) AISC includes treatment and refining charges, selling costs, G&A costs and sustaining capital expenditure.

2022 EBITDA Guidance

Consolidated EBITDA Guidance including corporate expenses, at consensus prices(1), is expected to be between $90.0 million and $105.0 million, which is broken down as follows:

EBITDA Range H1 2022 EBITDA Range H2 2022 Full Year EBITDA Range
(Amounts in $M) Low High Low High Low High
 
Yauricocha

22.1


26.2


30.9


33.8


53.0


60.0


Bolivar

3.3


5.8


31.7


36.2


35.0


42.0


Cusi

3.0


3.4


4.0


4.6


7.0


8.0


Corporate

(2.4

)

(2.4

)

(2.6

)

(2.6

)

(5.0

)

(5.0

)

Total

26.0


33.0


64.0


72.0


90.0


105.0


(1) March 2022 CIBC analyst consensus commodity price forecast: $23.68/oz Ag, $4.22/lb Cu, $1.42/lb Zn, $0.99/lb Pb, $1,789/oz Au.

2022 Capital Expenditures

A breakdown by mine of the throughput and planned capital investments is shown in the following table:

CAPEX Range (Amounts in $M)
Sustaining Growth Total
 
Yauricocha

12

17

29

Bolivar

23

10

33

Cusi

6

6

Greenfield Exploration

1

1

 
Total

41

28

69

Total sustaining capital for 2022 is expected to be $41.0 million, mainly comprising of mine development ($5.3 million), ventilation infrastructure ($2.5 million) and mine camp ($1.3 million) in Yauricocha, and infill drilling ($5.5 million), mine development ($7.2 million) and tailings dam ($6.9 million) at the Bolivar mine. The intensive infill drilling program of approximately 80,000 meters is planned for the year with the objective of increasing the reserves. Sustaining capital at Cusi is expected to be $6.0 million, including $3.0 million for mine development and the remainder for equipment replacement and tailings dam.

Growth capital for 2022 is projected at $28.0 million. Major growth projects at the Yauricocha mine include tailings dam expansion ($7.7 million), Yauricocha shaft and related integration access ($5.8 million) and exploration ($3.0 million). At the Bolivar mine, growth capital is mainly focused around the afore-mentioned expansion of plant capacity ($6.2 million) and the integration tunnel ($3.5 million), with planned completion of both projects by the end of Q3 2022.

Management will continue to review metal prices and its EBITDA performance throughout the year, while continuing to explore value enhancing opportunities. The management also retains the option to adjust the 2022 capital expenditure plan should business conditions experience any dramatic changes within the year.

Annual SEC Filing completed by Sierra Metals

Sierra Metals has completed its annual SEC filing. Copies of these documents can be found at www.sierrametals.com on the Investors Page under Financial Information. Shareholders may request a hard copy of the complete audited financial statements free of charge upon request.

Conference Call Webcast

Sierra Metals’ senior management will host a conference call on Thursday, March 17, 2022, at 11:00 AM (EDT) to discuss the Company’s financial and operating results for the three months and year ended December 31, 2021.

Via Webcast:

A live audio webcast of the meeting will be available on the Company’s website:

https://event.on24.com/wcc/r/3574382/FCCE4F2A0F9D10DD9ADA273BDF220BF7

The webcast, along with presentation slides, will be archived for 180 days on www.sierrametals.com.

Via phone:

For those who prefer to listen by phone, dial-in instructions are below. To ensure your participation, please call approximately five minutes prior to the scheduled start time of the call.

US/CAN dial-in number (Toll Free): 1 844 200 6205
US dial-in number (Local): 1 646 904 5544
Canada dial-in number (Local): 1 226 828 7575
All other locations: +1 929 526 1599
Participant access code: 017137

Press *1 to ask a question, *2 to withdraw your question, or *0 for operator assistance.

Quality Control

Américo Zuzunaga, FAusIMM CP (Mining Engineer) and Vice President of Corporate Planning, is a Qualified Person under National Instrument 43-101 – Standards of Disclosure for Mineral Projects.

About Sierra Metals

Sierra Metals Inc. is a diversified Canadian mining company with Green Metal exposure including increasing copper production and base metal production with precious metals byproduct credits, focused on the production and development of its Yauricocha Mine in Peru, and Bolivar and Cusi Mines in Mexico. The Company is focused on increasing production volume and growing mineral resources. Sierra Metals has recently had several new key discoveries and still has many more exciting brownfield exploration opportunities at all three Mines in Peru and Mexico that are within close proximity to the existing mines. Additionally, the Company also has large land packages at all three mines with several prospective regional targets providing longer-term exploration upside and mineral resource growth potential.

The Company’s Common Shares trade on the Bolsa de Valores de Lima and on the Toronto Stock Exchange under the symbol “SMT” and on the NYSE American Exchange under the symbol “SMTS”.

For further information regarding Sierra Metals, please visit www.sierrametals.com or contact:

Continue to Follow, Like and Watch our progress:

Webwww.sierrametals.com | Twittersierrametals | FacebookSierraMetalsInc | LinkedInSierra Metals Inc | Instagramsierrametals

Forward-Looking Statements

This press release contains “forward-looking information” and “forward-looking statements” within the meaning of Canadian and U.S. securities laws (collectively, “forward-looking information”). Forward-looking information includes, but is not limited to, statements with respect to the date of the 2020 Shareholders’ Meeting and the anticipated filing of the Compensation Disclosure. Any statements that express or involve discussions with respect to predictions, expectations, beliefs, plans, projections, objectives, assumptions or future events or performance (often, but not always, using words or phrases such as “expects”, “anticipates”, “plans”, “projects”, “estimates”, “assumes”, “intends”, “strategy”, “goals”, “objectives”, “potential” or variations thereof, or stating that certain actions, events or results “may”, “could”, “would”, “might” or “will” be taken, occur or be achieved, or the negative of any of these terms and similar expressions) are not statements of historical fact and may be forward-looking information.

Forward-looking information is subject to a variety of risks and uncertainties, which could cause actual events or results to differ from those reflected in the forward-looking information, including, without limitation, the risks described under the heading “Risk Factors” in the Company’s annual information form dated March 16, 2022 for its fiscal year ended December 31, 2021 and other risks identified in the Company’s filings with Canadian securities regulators and the United States Securities and Exchange Commission, which filings are available at www.sedar.com and www.sec.gov, respectively.

The risk factors referred to above are not an exhaustive list of the factors that may affect any of the Company’s forward-looking information. Forward-looking information includes statements about the future and is inherently uncertain, and the Company’s actual achievements or other future events or conditions may differ materially from those reflected in the forward-looking information due to a variety of risks, uncertainties and other factors. The Company’s statements containing forward-looking information are based on the beliefs, expectations, and opinions of management on the date the statements are made, and the Company does not assume any obligation to update such forward-looking information if circumstances or management’s beliefs, expectations or opinions should change, other than as required by applicable law. For the reasons set forth above, one should not place undue reliance on forward-looking information.

Investor Relations
Sierra Metals Inc.
Tel: +1 (416) 366-7777
Email: info@sierrametals.com

Luis Marchese
CEO
Sierra Metals Inc.
Tel: +1 (416) 366-7777

Source: Sierra Metals Inc.

Has Uranium Demand Changed with Russia Ukraine War?


The importance of Dependable Energy, Even Nuclear, is Heightened in Recent War


Energy is important. After food and air, energy is the next most critical in day-to-day life. Since the beginning of 2022, uranium investments are up about 30%, since Russia’s invasion of Ukraine, the performance is even better. Although the yellow metal has not had the performance of crude oil, its large upward price move highlights the importance of energy resources and current fragility, especially as nations seek to lessen their use of traditional energy sources.

The mineral itself is not easily traded on open exchanges using futures contracts to the same extent that other commodities are. The reasons are obvious. But, according to data from UxC, uranium prices climbed to $59.75 a pound on March 10. That is the highest in eleven years. That’s when uranium went through a few bad years following a massive earthquake and tsunami in Japan which led to a power outage and meltdown at the Fukushima Daiichi nuclear plant, (March of 2011). This event caused a change in thinking and retrenchment of nations as they rethought their power strategy and decided to phase out nuclear on safety concerns. The price of uranium tumbled shortly after.


Recent History

Uranium prices had been trading around $43 before Russia invaded Ukraine on Feb. 24th. Uncertainty around any event historically causes risk assets to tumble and consumers’ necessities to strengthen. While the invasion hasn’t had an immediate impact on demand, or supply, there is speculation that the trend toward nuclear may increase at a faster pace than recent years, countries may even maintain existing plants longer than announced and perhaps build modern generation facilities, especially in Europe as they diversify away from natural gas provided by Russia.

Some countries are changing their positions on non-carbon emitting nuclear that they took, possibly as a knee-jerk reaction, after Fukushima. Belgium has adjusted its position on its 2025 deadline to phase out its seven nuclear power plants. The country’s Federal Agency for Nuclear Control announced some reactors may operate beyond 2025 if removing them puts energy supply security at risk.


Current State

Russia’s war with Ukraine has raised global risks to energy supplies. Since Russia is among the world’s biggest exporters of oil and natural gas, oil prices have climbed to their highest levels since 2008, while gas prices (Dutch TTF), have recently bounced off record highs.

While the US is not dependent on Russian oil or natural gas, it has relied on Russia for 16% of its enriched uranium supply, while Europe relies on Russia for 20%.

Global nuclear-power generation grew by 3.5% in 2021. China had the largest increase of growth measuring 11%. The US actually shrank 1.5%.  


Other Uranium Demand

Investors of physical uranium are adding to the demand for U308. A physical investment takes production offline, so those in a physical trust enhance positive price action. The Sprott Physical Uranium Trust (SRUUF), the world’s largest physical uranium fund, has seen its stores of the fuel climb to over 51 million pounds from 18.1 million a year ago, and its net asset value grow to over $3 billion from $630 million since its launch. In 2022 lone shares of the trust have climbed more than 20% this year (a/o March 15).

Increased interest in uranium investments comes as much of the world has adopted an anti-carbon position related to climate change commitments. Nuclear power does not emit carbon in the generation process and can produce significant energy without regard to sun or wind conditions. The stigma of being an environmental nightmare has shifted to one of being an environmental savior. As other types of fuels costs rise, so will the alternative uranium.


Paul Hoffman

Managing Editor, Channelchek


Suggested Reading


Why Uranium Mining Stocks Can Continue Climbing Higher


How Does Uranium Fit Into the ESG Energy Landscape?


AMC is Thinking Outside the Box Office and Diversifying


Why JP Morgan’s Guru has Maintained a Positive Stance on Stocks


Sources

https://www.energy.gov/ne/articles/nuclear-power-most-reliable-energy-source-and-its-not-even-close

https://www.world-nuclear-news.org/Articles/Belgian-regulator-says-reactors-could-operate-beyo

https://www.iea.org/fuels-and-technologies/nuclear


Stay up to date. Follow us:


Sierra Metals Reports 2021 Consolidated Financial Results And Announces 2022 Guidance


Sierra Metals Reports 2021 Consolidated Financial Results And Announces 2022 Guidance

Research, News, and Market Data on Sierra Metals


CONFERENCE CALL MARCH 17, 2022 – NEW TIME – NOW AT 11:00 AM (EDT)

(All $ figures reported in USD)

  • Revenue from metals payable of $272.0 million in 2021, an increase of 10% from 2020 annual revenue of $246.9 million, largely a result of the increase in realized prices for all metals as compared to 2020;
  • Adjusted EBITDA(1) of $104.7 million for 2021, which is a 2% increase from the adjusted EBITDA of $102.8 million for 2020. The increase in adjusted EBITDA is due to the increase in gross margins at the Yauricocha and Cusi mines;
  • Net loss attributable to shareholders for 2021 was $27.4 million or of $(0.17) per share compared to a net income of $23.4 million or $0.14 per share in 2020. Net losses for the year ended 2021 include a non-cash impairment charge of $35 million related to the Cusi mine;
  • Adjusted net income attributable to shareholders of $21.6 million or $0.13 per share for 2021;
  • Operating cash flows before movements in working capital of $93.4 million for 2021, a 4% decrease from $97.8 million in 2020, due to higher G&A costs in 2021;
  • 2021 consolidated annual ore throughput of 2,902,220 tonnes, an increase of 3% over 2020, mainly driven by the higher throughputs from the Yauricocha and Cusi mines, offset by a decline in the Bolivar annual throughput due to a reduced workforce;
  • Consolidated copper equivalent production of 90 million pounds, a decrease of 24% as compared to 2020, due to a combination of production issues at Bolivar and lower grades at Yauricocha, where a 12% increase in annual throughput at Yauricocha, did not compensate for the lower grades:
  • Consolidated All-In sustaining costs (“AISC”) (1) per copper equivalent pound (2) sold of $3.40 in 2021, or 60% higher than AISC in 2020, driven by higher sustaining capital and the 27% decrease in copper equivalent payable pounds in 2021 compared to 2020;
  • $34.9 million of cash and cash equivalents as at December 31, 2021;
  • Net Debt of $45.9 million as at December 31, 2021.
  • A shareholder conference call to be held Thursday, March 17, 2022, at 11:00 AM (EDT)
    (1) This is a non-IFRS performance measure, see Non-IFRS Performance Measures section of the MD&A. (2) Copper equivalent pounds and silver equivalent ounces for Q4 2021 were calculated using the following realized prices: $23.41/oz Ag, $4.40/lb Cu, $1.55/lb Zn, $1.06/lb Pb, $1,795/oz Au. Copper equivalent pounds and silver equivalent ounces for Q4 2020 were calculated using the following realized prices: $24.30/oz Ag, $3.32/lb Cu, $1.22/lb Zn, $0.89/lb Pb, $1,859/oz Au. Copper equivalent pounds and silver equivalent ounces for full year 2021 were calculated using the following realized prices: $25.21/oz Ag, $4.23/lb Cu, $1.37/lb Zn, $1.00/lb Pb, $1,796/oz Au. Copper equivalent pounds and silver equivalent ounces for full year 2020 were calculated using the following realized prices: $20.59/oz Ag, $2.80/lb Cu, $1.03/lb Zn, $0.83/lb Pb, $1,771/oz Au.

TORONTO–(BUSINESS WIRE)– Sierra Metals Inc. (TSX:SMT)(BVL:SMT)(NYSE American:SMTS) (“Sierra Metals” or the “Company”) today reported revenue of $272.0 million and an adjusted EBITDA of $104.7 million on the throughput of 2.9 million tonnes and metal production of 89.9 million copper equivalent pounds for the year ended December 31, 2021.

The following table displays selected financial and operational information for the three months and year ended December 31, 2021:

Three Months Ended Year Ended
(In thousands of dollars, except per share and cash cost amounts, consolidated figures unless noted otherwise) December 31, 2021 December 31, 2020 December 31, 2021 December 31, 2020
Operating
Ore Processed / Tonnes Milled


590,057


778,236


2,902,220


2,828,877

Silver Ounces Produced (000’s)


805


922


3,527


3,465

Copper Pounds Produced (000’s)


6,071


10,626


31,757


44,262

Lead Pounds Produced (000’s)


6,011


7,630


30,816


32,972

Zinc Pounds Produced (000’s)


14,913


21,612


79,281


81,868

Gold Ounces Produced


1,863


3,363


9,572


13,771

Copper Equivalent Pounds Produced (000’s)1


17,841


29,267


89,926


118,214

 
Cash Cost per Tonne Processed

$

58.21


$

44.42

$

48.69


$

40.81

Cash Cost per CuEqLb2

$

2.29


$

1.31

$

1.81


$

1.13

AISC per CuEqLb2

$

4.13


$

2.56

$

3.40


$

2.12

 
Cash Cost per CuEqLb (Yauricocha)2

$

1.61


$

1.16

$

1.46


$

1.01

AISC per CuEqLb (Yauricocha)2

$

3.09


$

2.47

$

2.77


$

2.11

Cash Cost per CuEqLb (Bolivar)2

$

5.29


$

1.35

$

2.18


$

1.13

AISC per CuEqLb (Bolivar)2

$

8.58


$

2.34

$

4.22


$

1.88

Cash Cost per AgEqOz (Cusi)2

$

11.80


$

15.70

$

16.71


$

16.62

AISC per AgEqOz (Cusi)2

$

21.09


$

28.18

$

28.15


$

25.26

Financial
Revenues

$

62,240


$

76,218

$

272,014


$

246,888

Adjusted EBITDA2

$

18,843


$

33,725

$

104,732


$

102,833

Operating cash flows before movements in working capital

$

15,419


$

32,259

$

93,405


$

97,757

Adjusted net income attributable to shareholders2

$

5,443


$

8,670

$

21,571


$

30,817

Net income (loss) attributable to shareholders3

$

(34,716

)

$

7,603

$

(27,363

)

$

23,419

Cash and cash equivalents

$

34,929


$

71,473

$

34,929


$

71,473

Working capital

$

17,321


$

70,885

$

17,321


$

70,885

 
(1) Copper equivalent pounds and silver equivalent ounces for Q4 2021 were calculated using the following realized prices: $23.41/oz Ag, $4.40/lb Cu, $1.55/lb Zn, $1.06/lb Pb, $1,795/oz Au. Copper equivalent pounds and silver equivalent ounces for Q4 2020 were calculated using the following realized prices: $24.30/oz Ag, $3.32/lb Cu, $1.22/lb Zn, $0.89/lb Pb, $1,859/oz Au. Copper equivalent pounds and silver equivalent ounces for full year 2021 were calculated using the following realized prices: $25.21/oz Ag, $4.23/lb Cu, $1.37/lb Zn, $1.00/lb Pb, $1,796/oz Au. Copper equivalent pounds and silver equivalent ounces for full year 2020 were calculated using the following realized prices: $20.59/oz Ag, $2.80/lb Cu, $1.03/lb Zn, $0.83/lb Pb, $1,771/oz Au.
(2) This is a non-IFRS performance measure, see Non-IFRS Performance Measures section of the MD&A.
(3) Net loss attributable to shareholders for Q4 and year 2021 includes an impairment charge of $35.0 million on the Cusi mine.

Luis Marchese, CEO of Sierra Metals, stated:“Despite the unprecedented difficulties of 2021, the Company reported a slight increase to Adjusted EBTIDA of $104.7 million. While consolidated annual ore throughput increased, Yauricocha and Cusi metal production did not fully compensate for the lower throughput and grades at Bolivar, resulting in a marked decline in consolidated copper equivalent production of 24% year over year. We are taking significant steps to improve operations at our Bolivar Mine, including a substantial allocation of 2022 budgeted capital expenditures toward reducing backlog of infill drilling and mine development, improved availability of equipment and controls, detailed review of processes and a thorough review of the current organization. We are focused on Bolivar’s operational turnaround so that it can deliver on its potential, by H2 2022.

He continued, “In addition to an emphasis on operational improvements at Bolivar, the Company is committed to delivering on the goals outlined in its new strategy in Q4 of 2021. A strategic review of Cusi is underway, changes have been made to the organizational structure to better align all operations and achieve goals, and with a heightened focus on ESG, the Company’s inaugural sustainability report is planned for completion in 2022.”

He concluded,“We entered 2022 with a renewed motivation to address major challenges and deliver meaningful returns to our shareholders. COVID-19 safety protocols remain in place and with operations returning to normal, the Company expects to be able to fully catch up and meet its operational and growth initiatives in 2022. Major growth projects at the Yauricocha Mine include the expansion of the tailings dam and sinking of the Yauricocha shaft. At the Bolivar mine, growth will be focused around the expansion of plant capacity and the integration tunnel which will link the mine to the mill, creating efficiencies and cost reduction by eliminating truck haulage of ore to the mill. Both projects are planned for completion by the end of Q4 2022. Additionally, we are committed to continuing to grow our reserve and resource base. An intense infill drilling program is planned for the year and we expect to complete MRMR updates and include the Technical Reports for the Yauricocha and Bolivar Mines in 2022. We are optimistic that these updated reports will provide for expanded reserves and resources at the mines.”

12M 2021 Operating Highlights

Consolidated annual ore throughput of 2,902,220 tonnes, an increase of 3% over 2020, mainly driven by the higher throughputs from the Yauricocha and Cusi mines, offset by a decline in the Bolivar annual throughput.

The Yauricocha mine received its Informe Tecnico Minero (“ITM”) permit in June 2021, allowing for an operating capacity of 3,600 tpd. Achieving the maximum annual permitted capacity, throughput at Yauricocha was 1,256,847 tonnes, or an increase of 12% from the 2020 annual production.

Annual throughput of 295,771 tonnes at Cusi was 28% higher as the mine operated throughout the year, as compared to the year 2020, when almost four months of production was lost during the care and maintenance period resulting from the government mandated shutdown.

The Bolivar mine achieved annual throughput of 1,349,602 tonnes, which was 9% lower than the 2020 throughput, as the mine continued to face manpower issues such as reduced workforce due to COVID and high turnover in middle and senior management.

Consolidated copper equivalent production dropped 24% as compared to 2020 due to the aforementioned production issues at Bolivar and as higher throughput at Yauricocha could not compensate from lower grades during the year. Metal production was higher at Cusi, driven by higher throughput and grades.

Yauricocha’s cash cost per copper equivalent payable pound was $1.46 (2020 – $1.01), and AISC per copper equivalent payable pound of $2.77 (2020 – $2.11).

Bolivar’s cash cost per copper equivalent payable pound was $2.18 (2020 – $1.13), and AISC per copper equivalent payable pound was $4.22 (2020 – $1.88).

Cusi’s cash cost per silver equivalent payable ounce was $16.71 (2020 – $16.62), and AISC per silver equivalent payable ounce was $28.59 (2020 – $25.26).

Click here to review the full details of the Q4 2021 production highlights.

Q4 and 12M 2021 Financial Highlights

Revenue from metals payable of $272.0 million in 2021, an increase of 10% from 2020 annual revenue of $246.9 million. Higher revenue was largely a result of the increase in realized prices for all metals as compared to 2020;

Adjusted EBITDA(1) of $104.7 million for 2021, which is a 2% increase from the adjusted EBITDA of $102.8 million for 2020;

Net loss attributable to shareholders for 2021 was $27.4 million (2020: $23.4 million) or $(0.17) per share (basic and diluted) (2020: $0.14) Net losses for Q4 and the year ended 2021 included an impairment charge of $35.0 million related to the Cusi mine;

Adjusted net income attributable to shareholders (1) of $21.6 million, or $0.13 per share, for 2021 was lower than the adjusted net income of $30.8 million, or $0.19 per share for 2020;

Cash flow generated from operations before movements in working capital of $93.4 million for 2021 was lower than the $97.8 million in 2020, mainly due to higher G&A costs in 2021; and

Cash and cash equivalents of $34.9 million and working capital of $17.3 million as at December 31, 2021 compared to $71.5 million and $70.9 million, respectively, at the end of 2020. Cash and cash equivalents decreased during 2021 as the $70.9 million used in investing activities and $36.9 million used in financing activities exceeded cash generated from operating activities of $71.4 million.

(1) This is a non-IFRS performance measure, see Non-IFRS Performance Measures section of the MD&A.

Project Development

On August 16, 2021, the Company reported the inclusion of iron ore production in the 10,000 tonnes per day (“tpd”) Preliminary Economic Assessment (“PEA”) for its Bolivar Mine. The updated PEA indicated an incremental benefit of after-tax NPV (@8%) of $78.2 million and IRR of 69.0% versus the NPV of $57.4 million and IRR of 27.9% reported in the original PEA. A National Instrument 43-101 (“NI 43-101”) technical report was filed on SEDAR and with the U.S. Securities and Exchange Commission on September 29, 2021. Click here to review the press release containing highlights of the Bolivar PEA.

After the close of the year, the Company announced positive results of the updated PEA on expansion of its Yauricocha Mine. This updated PEA included the last reported resource dated March 31, 2021 and revised Prefeasibility Study (“PFS”) level operating and capital expenditure. The Technical Report was filed on March 3, 2022. Click here to review the press release containing highlights of the updated Yauricocha PEA.

Exploration Highlights

Peru:

  • During the year, 9,719 meters of surface exploration using diamond drills were carried out in the Kilkasca, El Estacion, Yauricocha Medio, Fortuna and Exito zones. Further, 18,509 meters of underground exploration was completed with the aim of replacing and increasing the mineral resources exploited during the year.

Mexico:

   Bolivar

  • During the year, 19,804 meters of infill drilling program was carried out at Bolivar including 13,072 meters in the El Gallo zone and 4,422 meters in the Bolivar West zone; and
  • 25,260 meters of brownfield exploration was completed in the Bolivar West and La Montura zones.

   Cusi

  • The Infill Drilling program was carried out in the NorthEast and the North-NorthWest system, with the objective to define the continuity and the grades of both systems. 21,059 meters of drilling was completed, including 4,702 meters of definition drilling into these systems with the termite rig; and
  • Brownfield exploration drilling program started at San Juan, San Antonio and Gallo Back veins and 4,703 meters of drilling was completed during the year.

IMPAIRMENT CHARGE

In Q4 2021, the Company announced its increased focus on copper and other steel-making products, including the strategic review process for the silver-producing Cusi Mine in Mexico. As part of this process, the carrying value of Cusi was reviewed. As a result, a non-cash impairment charge of $35 million was recognized for the year ended December 31, 2021.

2022 Guidance

Production Guidance

The year 2021 was a challenging year for the mining operations of the Company due to the decrease in grades at Yauricocha and Bolivar, and availability of ore, as lack of equipment and decrease in manpower impacted development mainly at the Bolivar mine. Despite the COVID related issues, operations at Yauricocha and Cusi are gradually returning to normalcy. However, the Company anticipates that the backlog of ongoing operational challenges at Bolivar will be overcome during the year, leading to much improved production starting Q3 2022. During this period, the Company’s focus will be on increasing the infill drilling and development and the expansion of the plant facility with the objective to gradually achieve an average Q4 2022 throughput rate at Bolivar of 5,600 tpd, as compared to the 3,000 tpd in Q1 2022. With addressing of these development issues in the mine and plant infrastructure expansion, a much-improved performance is anticipated in the second half of the year. In view of this, full year guidance for the year has been split into H1 and H2 2022.

A table summarizing 2022 production guidance has been provided below:

H1 2022 H2 2022 2022 Guidance
Low High Low High Low High
 
Silver (oz)

1,490,500

1,591,500

1,712,000

1,769,000

3,202,500

3,360,500

Gold (oz)

5,000

6,000

10,500

11,500

15,500

17,500

Zinc (000 lbs)

23,500

27,500

25,500

27,000

49,000

54,500

Lead (000 lbs)

8,500

9,500

8,000

8,000

16,500

17,500

Copper (000 lbs)

13,500

16,500

21,000

24,500

34,500

41,000


Copper equivalent pounds (000’s)(1)

34,000

39,500

45,500

50,100

79,500

89,700


(1) Copper equivalent guidance is calculated using the March 2022 CIBC analyst consensus commodity price forecast: $23.68/oz Ag, $4.22/lb Cu, $1.42/lb Zn, $0.99/lb Pb, $1,789/oz Au.

2022 Cost Guidance

A mine by mine breakdown of 2022 production guidance, cash costs and all-in sustaining costs (“AISC”) are included in the table below. All costs are in USD. Cash costs and AISC guidance is shown per copper equivalent payable pound at Yauricocha and Bolivar, and silver equivalent payable ounce at Cusi.

Equivalent Production

Cash cost range per

AISC(2) range per

Range (1)

CuEqLb or AgEqOz

CuEqLb or AgEqOz

 
Yauricocha

Cu Eq Lbs (000s)

45,000 – 49,000 $2.00 – $2.15 $2.90 – $3.10
Bolivar

Cu Eq Lbs (000s)

23,800 – 29,900 $2.15 – $2.30 $3.50 – $3.85
Cusi

Ag Eq Oz (000s)

1,750 – 1,850 $16.45 – $16.50 $22.00 – $23.00


(1) Copper equivalent guidance is calculated using the March 2022 CIBC analyst consensus commodity price forecast: $23.68/oz Ag, $4.22/lb Cu, $1.42/lb Zn, $0.99/lb Pb, $1,789/oz Au.

(2) AISC includes treatment and refining charges, selling costs, G&A costs and sustaining capital expenditure.

2022 EBITDA Guidance

Consolidated EBITDA Guidance including corporate expenses, at consensus prices(1), is expected to be between $90.0 million and $105.0 million, which is broken down as follows:

EBITDA Range H1 2022 EBITDA Range H2 2022 Full Year EBITDA Range
(Amounts in $M) Low High Low High Low High
 
Yauricocha

22.1


26.2


30.9


33.8


53.0


60.0


Bolivar

3.3


5.8


31.7


36.2


35.0


42.0


Cusi

3.0


3.4


4.0


4.6


7.0


8.0


Corporate

(2.4

)

(2.4

)

(2.6

)

(2.6

)

(5.0

)

(5.0

)

Total

26.0


33.0


64.0


72.0


90.0


105.0


(1) March 2022 CIBC analyst consensus commodity price forecast: $23.68/oz Ag, $4.22/lb Cu, $1.42/lb Zn, $0.99/lb Pb, $1,789/oz Au.

2022 Capital Expenditures

A breakdown by mine of the throughput and planned capital investments is shown in the following table:

CAPEX Range (Amounts in $M)
Sustaining Growth Total
 
Yauricocha

12

17

29

Bolivar

23

10

33

Cusi

6

6

Greenfield Exploration

1

1

 
Total

41

28

69

Total sustaining capital for 2022 is expected to be $41.0 million, mainly comprising of mine development ($5.3 million), ventilation infrastructure ($2.5 million) and mine camp ($1.3 million) in Yauricocha, and infill drilling ($5.5 million), mine development ($7.2 million) and tailings dam ($6.9 million) at the Bolivar mine. The intensive infill drilling program of approximately 80,000 meters is planned for the year with the objective of increasing the reserves. Sustaining capital at Cusi is expected to be $6.0 million, including $3.0 million for mine development and the remainder for equipment replacement and tailings dam.

Growth capital for 2022 is projected at $28.0 million. Major growth projects at the Yauricocha mine include tailings dam expansion ($7.7 million), Yauricocha shaft and related integration access ($5.8 million) and exploration ($3.0 million). At the Bolivar mine, growth capital is mainly focused around the afore-mentioned expansion of plant capacity ($6.2 million) and the integration tunnel ($3.5 million), with planned completion of both projects by the end of Q3 2022.

Management will continue to review metal prices and its EBITDA performance throughout the year, while continuing to explore value enhancing opportunities. The management also retains the option to adjust the 2022 capital expenditure plan should business conditions experience any dramatic changes within the year.

Annual SEC Filing completed by Sierra Metals

Sierra Metals has completed its annual SEC filing. Copies of these documents can be found at www.sierrametals.com on the Investors Page under Financial Information. Shareholders may request a hard copy of the complete audited financial statements free of charge upon request.

Conference Call Webcast

Sierra Metals’ senior management will host a conference call on Thursday, March 17, 2022, at 11:00 AM (EDT) to discuss the Company’s financial and operating results for the three months and year ended December 31, 2021.

Via Webcast:

A live audio webcast of the meeting will be available on the Company’s website:

https://event.on24.com/wcc/r/3574382/FCCE4F2A0F9D10DD9ADA273BDF220BF7

The webcast, along with presentation slides, will be archived for 180 days on www.sierrametals.com.

Via phone:

For those who prefer to listen by phone, dial-in instructions are below. To ensure your participation, please call approximately five minutes prior to the scheduled start time of the call.

US/CAN dial-in number (Toll Free): 1 844 200 6205
US dial-in number (Local): 1 646 904 5544
Canada dial-in number (Local): 1 226 828 7575
All other locations: +1 929 526 1599
Participant access code: 017137

Press *1 to ask a question, *2 to withdraw your question, or *0 for operator assistance.

Quality Control

Américo Zuzunaga, FAusIMM CP (Mining Engineer) and Vice President of Corporate Planning, is a Qualified Person under National Instrument 43-101 – Standards of Disclosure for Mineral Projects.

About Sierra Metals

Sierra Metals Inc. is a diversified Canadian mining company with Green Metal exposure including increasing copper production and base metal production with precious metals byproduct credits, focused on the production and development of its Yauricocha Mine in Peru, and Bolivar and Cusi Mines in Mexico. The Company is focused on increasing production volume and growing mineral resources. Sierra Metals has recently had several new key discoveries and still has many more exciting brownfield exploration opportunities at all three Mines in Peru and Mexico that are within close proximity to the existing mines. Additionally, the Company also has large land packages at all three mines with several prospective regional targets providing longer-term exploration upside and mineral resource growth potential.

The Company’s Common Shares trade on the Bolsa de Valores de Lima and on the Toronto Stock Exchange under the symbol “SMT” and on the NYSE American Exchange under the symbol “SMTS”.

For further information regarding Sierra Metals, please visit www.sierrametals.com or contact:

Continue to Follow, Like and Watch our progress:

Webwww.sierrametals.com | Twittersierrametals | FacebookSierraMetalsInc | LinkedInSierra Metals Inc | Instagramsierrametals

Forward-Looking Statements

This press release contains “forward-looking information” and “forward-looking statements” within the meaning of Canadian and U.S. securities laws (collectively, “forward-looking information”). Forward-looking information includes, but is not limited to, statements with respect to the date of the 2020 Shareholders’ Meeting and the anticipated filing of the Compensation Disclosure. Any statements that express or involve discussions with respect to predictions, expectations, beliefs, plans, projections, objectives, assumptions or future events or performance (often, but not always, using words or phrases such as “expects”, “anticipates”, “plans”, “projects”, “estimates”, “assumes”, “intends”, “strategy”, “goals”, “objectives”, “potential” or variations thereof, or stating that certain actions, events or results “may”, “could”, “would”, “might” or “will” be taken, occur or be achieved, or the negative of any of these terms and similar expressions) are not statements of historical fact and may be forward-looking information.

Forward-looking information is subject to a variety of risks and uncertainties, which could cause actual events or results to differ from those reflected in the forward-looking information, including, without limitation, the risks described under the heading “Risk Factors” in the Company’s annual information form dated March 16, 2022 for its fiscal year ended December 31, 2021 and other risks identified in the Company’s filings with Canadian securities regulators and the United States Securities and Exchange Commission, which filings are available at www.sedar.com and www.sec.gov, respectively.

The risk factors referred to above are not an exhaustive list of the factors that may affect any of the Company’s forward-looking information. Forward-looking information includes statements about the future and is inherently uncertain, and the Company’s actual achievements or other future events or conditions may differ materially from those reflected in the forward-looking information due to a variety of risks, uncertainties and other factors. The Company’s statements containing forward-looking information are based on the beliefs, expectations, and opinions of management on the date the statements are made, and the Company does not assume any obligation to update such forward-looking information if circumstances or management’s beliefs, expectations or opinions should change, other than as required by applicable law. For the reasons set forth above, one should not place undue reliance on forward-looking information.

Investor Relations
Sierra Metals Inc.
Tel: +1 (416) 366-7777
Email: info@sierrametals.com

Luis Marchese
CEO
Sierra Metals Inc.
Tel: +1 (416) 366-7777

Source: Sierra Metals Inc.

AMC Theatres CEO Calls Gold Mining Investment Truly Terrific Opportunity


AMC is Thinking Outside the Box Office and Diversifying


AMC Entertainment (AMC) has just taken business diversification in a surprising direction. The company known for movie theatres announced that it has taken a 22% stake in a gold and silver mining company. The company, Hycroft Mining Holdings (HYMC), has a 71,000-acre gold mine in Northern Nevada. AMC’s announcement explains that an equal and simultaneous stake in Hycroft was also taken by Eric Sprott. Sprott is a major investment player in gold, silver, and other metals.


The Deal

AMC will invest $27.9 million in cash in Hycroft in exchange for 23.4 million warrant units, with each unit consisting of one common share of Hycroft and one common share purchase warrant. The units are priced at $1.193 a share, while each purchase warrant is priced at about $1.07 a share and carries a five-year term. HYMC had been trading in the $0.30 to $0.33 range during the first week of March. As of 10 am the day after the announcement (March 17), HYMC is trading at $1.40 per share.

AMC also was granted the right to appoint someone to Hycroft’s board.

Eric Sprott’s investment was made through a holding company for Sprott, not the alternative investment manager owned by Mr. Sprott, Sprott Inc. The holding company will make an equal investment in Hycroft with the same terms.

Together, AMC and Sprott are investing $56 million in the mining company.

The chairman and CEO of AMC said “Our investment to buy 22% of Hycroft Mining Holding Corporation, and to receive an additional 23.4 million warrants in Hycroft at $1.07 per share is a truly terrific opportunity to potentially strengthen and enrich our company, and thereby create significant value for AMC Entertainment shareholders.It is appealing that the investment requires the commitment of only a nominal amount of AMC cash.”

Diane Garrett, President, CEO and Acting Chairman of Hycroft, commented, “We couldn’t be more

pleased to announce this transformational investment in the future of Hycroft, anchored by Eric Sprott,

one of the world’s leading precious metals investors, and AMC Entertainment Holdings, which has proven its expertise and ability to address liquidity challenges and to raise capital to optimize the value of significant underlying assets.


About the Mine

Hycroft Mining Holding Corporation is a US-based gold and silver development company that owns the Hycroft Mine. This is a well-established asset located 54 miles West of Winnemucca, Nevada. The 71,000-acre property (Manhattan, NY is 15,000 acres) is an open-pit leach operation.

According to the company website, the Hycroft mine is one of the world’s largest precious metals deposits. The mineral resources include:

  • Gold – 9.65 million ounces M&I / 5.0 million ounces inferred
  • Silver – 456 million ounces M&I / 150.4 million ounces inferred
  • Gold equivalent – 15.3 million ounces M&I / 6.9 million ounces inferred

Permits are in place for both heap leach and milling operations. There is substantial equipment and infrastructure in place.

Management is focused on transforming Hycroft into a large-scale mining operation by developing a process capable of extracting the large sulfide gold and silver mineral resources on site, in addition to existing oxide processing capabilities.


Thinking Outside the Box Office

“To state the obvious, one would not normally think that a movie theatre company’s core competency includes gold or silver mining,” said AMC CEO Adam Aron. The company is using the capital acquired during the meme stock short squeeze climb to strategically help a company in an uncorrelated industry navigate liquidity issues.

This is not the first time AMC has taken an untraditional step. In August of 2021, AMC made the business decision that its theatres would
accept
bitcoin
and three other cryptocurrencies for online ticket sales and concessions.

During the big meme stock trading frenzy, silver had a significant rally that lasted a few days, otherwise precious metals producers have been ignored by the retail investors embracing the r/wallstreetbets style. This announcement may put the significant opportunities in small miners on their radar at a time when resources are top performers.

Channelchek has a wealth of data and in-depth research on small publicly traded companies in the mining sector. Following this link then clicking “Metals & Mining” is an excellent way to become acquainted with North American mining companies and their underlying fundamentals.

Paul Hoffman

Managing Editor, Channelchek


Suggested Content


Metals and Mining Industry Report


Aurania Resources C-Suite Interview (Video)


Newrange Gold C-Suite Interview (Video)


Sierra Metals Virtual Roadshow (Video)


Sources

http://www.hycroftmining.com/wp-content/uploads/03-14-2022-Hycroft-Investment-by-Sprott-and-AMC.pdf

https://investor.amctheatres.com/newsroom/news-details/2022/AMC-Entertainment-Holdings-Inc.-Announces-Significant-Investment-Buying-22-of-Hycroft-Mining-Holding-Corporation/default.aspx


Stay up to date. Follow us:


Release – Element79 Gold to Provide Further Insight and Analysis on High-Grade Peruvian Gold Portfolio


Element79 Gold to Provide Further Insight and Analysis on High-Grade Peruvian Gold Portfolio

News and Market Data on Element79 Gold


VANCOUVER, BC / ACCESSWIRE / March 17, 2022 / Element79 Gold Corp. (CSE:ELEM)(OTC PINK:ELMGF)(FSE:7YS) (“Element79 Gold“, the “Company“) is pleased to present further insight and analysis on its recently acquired high-grade Peruvian gold portfolios. In a news release dated March 10th, 2022 (or the “Prior Release), The Company announced it signed a Letter of Intent (“LOI) to acquire all of the issued and outstanding securities of Calipuy Resources Inc. (“Calipuy”) and all of its assets and undertakings. Calipuy holds 100% interest in two past-producing high-grade gold-silver mines: The past-producing Lucero Mine (“Lucero”), one of the highest-grade underground mines in Peru’s history(1) at grades averaging 19.0g/t Au Equivalent (“Au Eq”) (14.0 g/t gold and 373 g/t silver)(2), as well as the past-producing Machacala Mine (“Machacala”) which averaged production grades of 10.5 g/t Au Eq (6.0 g/t gold and 340 g/t silver)(5). Operations were suspended in 2005 at Lucero and 1991 at Machacala due to the persistence of low gold and silver prices at the time.
The purpose of this corporate update is to provide a comprehensive discussion and analysis on the strategic reasoning behind the acquisition of the Lucero and Machacala projects, and why Element79 Gold believes that the integration of this new portfolio will help elevate the Company amongst its junior resource exploration peers. Details of the LOI and NSR can be found in the Prior Release. The Prior Release additionally highlights material and technical details of the Lucero and Machacala properties, including a recent 43-101 report on Lucero compiled by Mining Plus.

Diversification of Element79 Gold

Having a portfolio of previously-producing assets that have the near-term potential to be brought back into production provides the Company with a pathway to revenue, which would fund day-to-day administration and offset future exploration and development plans. In completing this acquisition Element79 Gold would now have a well-diversified portfolio of assets including greenfield, advanced 43-101 resource stage, and historic high-grade past- producing mines that have the potential to become producers again in the near term. The cycle of self-reliance and cash flow generation will continue to elevate Element79 Gold to a premiere resource exploration company.

Unique Features of the Lucero and Machacala Past-Producing Mines

Formerly operated as the Shila mine from 1989 to 2005, Lucero consists of 10,805 hectares located in the Shila range of southern Peru, which contains several historic high grade gold-silver mines(1). Lucero consistently delivered high grades during 16 years of operations, and between 1998 and 2004 reported production averaging approximately 18,800 ounces of gold and 435,000 ounces of silver per year at grades of 19.0 g/t Au Eq (14.0 g/t gold and 373 g/t silver),(2) with recoveries at the ore processing facility averaging 94.5% for gold and 85.5% for silver(1).

Infrastructure highlights for the past-producing Lucero Mine include three-phase electrical energy from the national grid that’s available in the town of Chachas 40km from the property. Subject to permitting, surface water is available in streams and small lakes throughout the year. Structures endowed with precious metals have been exploited at Lucero and surrounding areas by artisanal and formal miners over many years. Mining activity targeting high-grade veins is thought to date back to the Inca period(2).

“Lucero offers a rare opportunity to explore for not only an underground high-grade low sulphidation system but potentially an open pit-able high sulphidation system as well,” commented Neil Pettigrew, M.Sc., P.Geo, Director of Element79 Gold. “This past-producing mine has never experienced modern exploration techniques and I am very confident that significant gold-silver resources are to be found.”

The past-producing Machacala mine was first commercially mined in the 1950s before being acquired and operated by Minera Santa Isabel, S.A. from 1979 to 1991 which mined 230,000 metric tonnes averaging 10.5 g/t Au Eq (6.0 g/t Au and 340 g/t Ag) representing 78,000 Au Eq ounces.(6) Operations were suspended in 1991 due to the persistence of a low gold ($360/oz) and silver ($3.81/oz) price.. Machacala hosts multiple low-sulphidation epithermal Au-Ag veins, of which only four have been only modestly exploited.(4)

In addition, Machacala includes 200,000 tonnes of historic, non-43-101 compliant tailings, which were estimated in 1997 by Gold Hawk to contain grades of 1.26 g/t gold and 74 g/t silver.(8) Previous metallurgical studies by Gold Hawk show 87% recoveries of gold and 50%+ recovery of silver in 24 hours of leaching of un-milled tailings, with re-milling able to increase recoveries to 90% of gold and 73% of silver in 24 hours of leaching.(9)

ESG Initiatives

Element79 Gold is committed to the highest levels of corporate governance, and continues to make improvements towards social responsibilities. The Company believes it’s their duty as a global company to be a pioneer in relation to their ESG policies. Over the past few decades, the resource exploration sector has been met with some well-warranted environmental and social criticisms. Our goal is to stop the stigmatization that all resource exploration companies are the same, and that the Company can actually do some “net good”.

Examples of new initiatives is the onboarding of a community ambassador. This person will act as a liaison between the neighbouring communities that the Company will be operating in, and Element79 Gold. This individual will ensure that all local concerns are addressed, and that they will always feel like they have a voice at the table.

Another example will be the hiring of local geologists and operating companies. The purpose of this will be to not only stimulate the local economy and provide jobs for the communities, but to also consider their professional insights as these groups have a lifetime of knowledge to offer Element79 Gold areas that they’re well-familiarized in.

Lastly the Company will look towards commencing philanthropic initiatives such as donating to clean drinking water and other giveback programs in late 2022. These programs will be designed to ensure that Element79 Gold is well integrated to the communities they’ll be working beside.

All gold Equivalent calculations were performed using $1,650/oz gold, and $22/oz silver in line with the Company’s Maverick Springs 43-101 resource estimate, (see news release January 31st, 2022).

Qualified Person

The technical information in this release has been reviewed and verified by Neil Pettigrew, M.Sc., P. Geo., Director of Element79 Gold and a “qualified person” as defined by National Instrument 43-101.

About Element79 Gold

Element79 Gold is a mineral exploration company focused on the acquisition, exploration and development of mining properties for gold and associated metals. Element79 Gold has acquired its flagship Maverick Springs Project located in the famous gold mining district of northeastern Nevada, USA, between the Elko and White Pine Counties, where it has recently completed a 43-101-compliant, pit-constrained mineral resource estimate reflecting an Inferred resource of 3.71 million ounces of gold equivalent grading 0.92 Au Eq (0.34 g/t Au and 43.5 g/t Ag) with an effective date of Feb. 4, 2022. The acquisition of the Maverick Springs Project also included a portfolio of 15 properties along the Battle Mountain trend in Nevada, which the Company is analyzing for further merit of exploration, along with the potential for sale or spin-out. In British Columbia, Element79 Gold has executed a Letter of Intent to acquire a private company which holds the option to 100% interest of the Snowbird High-Grade Gold Project, which consists of 10 mineral claims located in Central British Columbia, approximately 20km west of Fort St. James. In Peru, Element79 Gold has signed a letter of intent to acquire the business and assets of Calipuy Resources Inc., which holds 100% interest in the Lucero Mine, one of the highest-grade underground mines to be commercially mined in Peru’s history, as well as the Machacala Mine. The Company also has an option to acquire 100% interest in the Dale Property which consists of 90 unpatented mining claims located approximately 100 km southwest of Timmins, Ontario, Canada in the Timmins Mining Division, Dale Township. For more information about the Company, please visit www.element79.gold or www.element79gold.com

Contact Information

For corporate matters, please contact:

James C. Tworek, Chief Executive Officer
E-mail: jt@element79gold.com

For investor relations inquiries, please contact:

Investor Relations Department
Phone: +1 (604) 200-3608
E-mail: investors@element79gold.com

Cautionary Note Regarding Forward Looking Statements

This press contains “forward?looking information” and “forward-looking statements” under applicable securities laws (collectively, “forward?looking statements”). These statements relate to future events or the Company’s future performance, business prospects or opportunities that are based on forecasts of future results, estimates of amounts not yet determinable and assumptions of management made in light of management’s experience and perception of historical trends, current conditions and expected future developments. Forward-looking statements include, but are not limited to, statements with respect to the Company’s business strategy; future planning processes; exploration activities; the timing and result of exploration activities; capital projects and exploration activities and the possible results thereof; acquisition opportunities; and the impact of acquisitions, if any, on the Company. Assumptions may prove to be incorrect and actual results may differ materially from those anticipated. Consequently, forward-looking statements cannot be guaranteed. As such, investors are cautioned not to place undue reliance upon forward-looking statements as there can be no assurance that the plans, assumptions or expectations upon which they are placed will occur. All statements other than statements of historical fact may be forward?looking statements. Any statements that express or involve discussions with respect to predictions, expectations, beliefs, plans, projections, objectives or future events or performance (often, but not always, using words or phrases such as “seek”, “anticipate”, “plan”, “continue”, “estimate”, “expect”, “may”, “will”, “project”, “predict”, “forecast”, “potential”, “target”, “intend”, “could”, “might”, “should”, “believe” and similar expressions) are not statements of historical fact and may be “forward?looking statements”.

Actual results may vary from forward-looking statements. Forward-looking statements are subject to known and unknown risks, uncertainties and other factors that may cause actual results to materially differ from those expressed or implied by such forward-looking statements, including but not limited to: the duration and effects of the coronavirus and COVID-19; risks related to the integration of acquisitions; actual results of exploration activities; conclusions of economic evaluations; changes in project parameters as plans continue to be refined; commodity prices; variations in ore reserves, grade or recovery rates; actual performance of plant, equipment or processes relative to specifications and expectations; accidents; labour relations; relations with local communities; changes in national or local governments; changes in applicable legislation or application thereof; delays in obtaining approvals or financing or in the completion of development or construction activities; exchange rate fluctuations; requirements for additional capital; government regulation; environmental risks; reclamation expenses; outcomes of pending litigation; limitations on insurance coverage as well as those factors discussed in the Company’s other public disclosure documents, available on www.sedar.com. Although the Company has attempted to identify important factors that could cause actual results to differ materially from those contained in forward-looking statements, there may be other factors that cause results not to be as anticipated, estimated or intended. The Company believes that the expectations reflected in these forward?looking statements are reasonable, but no assurance can be given that these expectations will prove to be correct and such forward?looking statements included herein should not be unduly relied upon. These statements speak only as of the date hereof. The Company does not intend, and does not assume any obligation, to update these forward-looking statements, except as required by applicable laws.

Sources

  1. https://web.archive.org/web/20220308020414/https://condorresources.com/portfolio/lucero/
  2. https://web.archive.org/web/20220308020532/https://www.sandstormgold.com/our-royalties/lucero/
  3. https://web.archive.org/web/20220308020649/https://www.sec.gov/Archives/edgar/data/1397970/000118374013000409/f8k08162013ex99-2.htm
  4. https://web.archive.org/web/20220308020657/https://www.affinitygold.com/machacala-highlights
  5. https://www.bnamericas.com/en/news/Gold_Hawk_Buys_Machala_Project
  6. Gold Hawk Resources Inc News Release, 2004-04-26
  7. https://web.archive.org/web/20220308020657/https://www.affinitygold.com/machacala-highlights
  8. Gold Hawk Resources Inc News Release, 2004-06-28
  9. Affinity Gold Corp. Corporate Presentation March 2013.

SOURCE: Element79 Gold Corp.