This Week’s Economic Focus Will be on PCE Inflation
It’s the last trading week of the month, quarter, and first half of 2023. The Fed Chair is scheduled to speak on Wednesday at the ECB Forum on Central Bank Policy, and the Fed’s favored inflation gauge will be released on Friday. As we approach the 2023 halfway point, the S&P 500 is up 13.25% YTD. Historically, whenever the S&P 500 is up at least 10% YTD at the end of June, the index ends the year up on the year 82% of the time. However, it gained 7.7% on average for those years, which suggests some gains were given back in the average year.
Monday 6/26
• The ECB Forum on Central Banking 2023 is a three day event beginning Monday. The US Federal Reserve Chairman will take part in a panel discussion Wednesday.
Tuesday 6/27
• 8:30 PM ET, Durable Goods orders are forecasted to have fallen 1.0 percent in May after April’s 1.1 percent rise. Ex-transportation orders are seen unchanged with core capital goods orders, after jumping 1.3 percent in April, rising a further 0.6 percent.
• 10:00 AM ET, Consumer Confidence is expected to rebound slightly in June to 103.7 versus May’s 102.3 which was better than expected but still down 1.4 points from April. The index has sat at depressed levels for the past year.
• 1:00 PM ET, Money Supply, including the closely watched M2 will be released. M2 had stood at $20,673.1 Billion as of the last reporting. The act of the Fed tightening credit conditions, is typically orchestrated by reducing money in the system which can be expected to reduce money supply by its two most watched measures, M1 and M2.
Wednesday 6/28
• 9:30 AM ET, at 2:30 PM in Portugal a panel discussion on policy will be modersated by CNBCs Sara Eisen. The four member panel will include J. Powell, US Federal Reserve, A. Bailey, Bank of England, C. Lagarde, ECB, and K. Ueda, Bank of Japan.
• 10:30 AM ET, The Energy Information Administration (EIA) provides weekly information on petroleum inventories in the U.S., whether produced here or abroad. The level of inventories helps determine prices for petroleum products.
Thursday 6/29
• 8:30 AM ET, First quarter GDP third estimate is expected to show 1.4% growth. While this is not e a strong pace, it indicates the US is not currently in a recession.
• 8:30 AM ET, Jobless Claims for the week ending June 24 are expected to be 270,000 versus a second straight and elevated 264,000 in the two prior weeks and 262,000 the week before.
• 4:30 PM ET, Factors Affecting Reserve Balances, otherwise known as The Fed’s Balance Sheet or the H.4.1 report is a weekly report of a consolidated balance sheet for all 12 Reserve Banks that lists factors supplying reserves into the banking system and factors absorbing reserves from the system. The report is officially named Factors Affecting Reserve Balances, otherwise known as the “H.4.1” report.
Friday 6/30
• 8:30 AM ET, Personal Income and Outlays, including PCE Inflation, will be released as part of a data set. Income is expected to rise 0.4 percent in May, with consumption expenditures expected to increase by 0.2 percent. These would compare with April’s 0.4 percent gain for income and 0.8 percent jump for consumption. PCE Inflation readings for May are expected at monthly increases of 0.1 percent overall and 0.4 percent for the core (versus April’s respective increases of 0.4 percent for both) for annual rates of 3.8 and 4.7 percent (versus April’s 4.4 and 4.7 percent).
• 10:00 AM ET, Consumer Sentiment is expected to end the first half of 2023 at 63.9 for June, this would be up nearly 4 points from May.
What Else
The summer doldrums is a Wall Street term for reduced trading activity between Memorial Day and Labor Day. Many professional investors take time off from work during the summer; this means portfolios are in the hands of the second-string portfolio managers that are there to monitor and maintain but not take big positions or make big decisions. Volume is often reduced, which could cause exaggerated swings in prices.
Lifeway Foods, Inc. (LWAY), which has been recognized as one of Forbes’ Best Small Companies, is America’s leading supplier of the probiotic fermented beverages. Wherever you are on Monday, you can attend the virtual roadshow and better understand directly from management the many intricacies of the probiotic food business as it relates to Lifeway. Should you have a question for management, there will be an ample Q&A period for participants to get their questions answered.
Almost No One Uses Bitcoin as Currency, New Data Proves. It’s Actually More Like Gambling
In recent weeks the asset status of Bitcoin has gained additional legitimacy as an asset but has done little to bolster any claim that it is a medium of exchange for goods and services. Does this matter? A Senior Lecturer on Economics and Society shares his thoughts on the present and future of Bitcoin and how that compares with its promise. – Paul Hoffman, Managing Editor, Channelchek
Bitcoin boosters like to claim Bitcoin, and other cryptocurrencies, are becoming mainstream. There’s a good reason to want people to believe this.
The only way the average punter will profit from crypto is to sell it for more than they bought it. So it’s important to talk up the prospects to build a “fear of missing out”.
There are loose claims that a large proportion of the population – generally in the range of 10% to 20% – now hold crypto. Sometimes these numbers are based on counting crypto wallets, or on surveying wealthy people.
But the hard data on Bitcoin use shows it is rarely bought for the purpose it ostensibly exists: to buy things.
Little Use for Payments
The whole point of Bitcoin, as its creator “Satoshi Nakamoto” stated in the opening sentence of the 2008 white paper outlining the concept, was that:
A purely peer-to-peer version of electronic cash would allow online payments to be sent directly from one party to another without going through a financial institution.
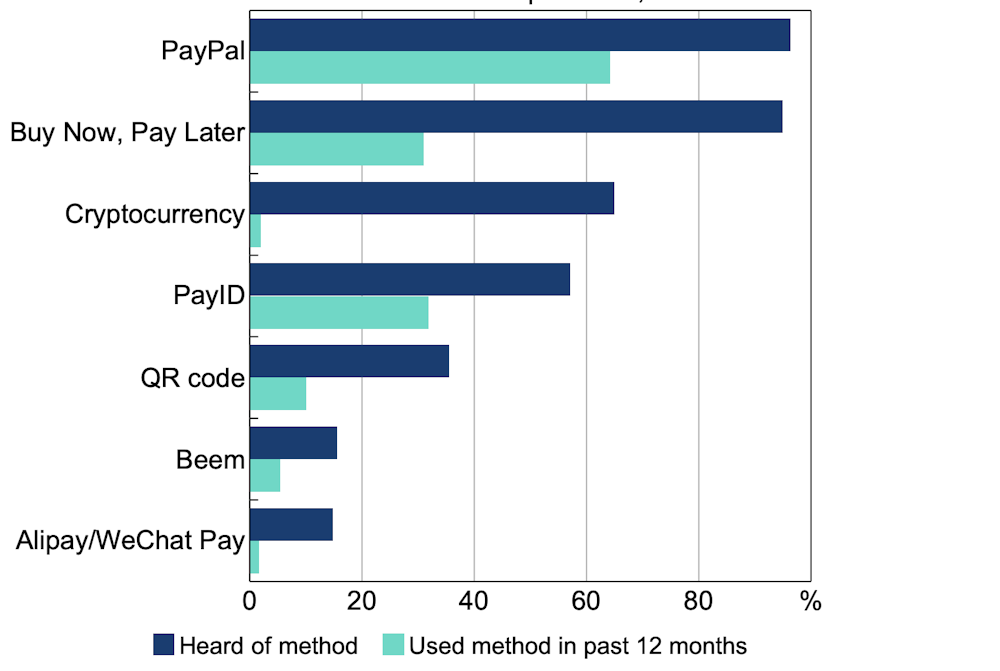
The latest data demolishing this idea comes from Australia’s central bank.
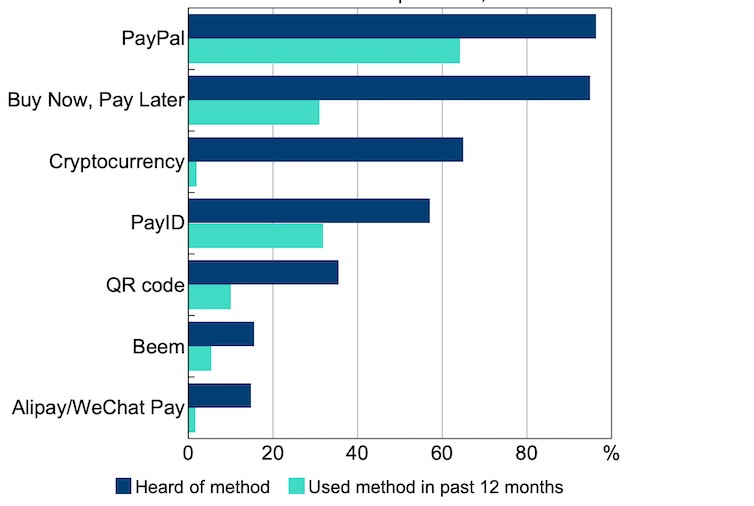
Every three years the Reserve Bank of Australia surveys a representative sample of 1,000 adults about how they pay for things. As the following graph shows, cryptocurrency is making almost no impression as a payments instrument, being used by no more than 2% of adults.
Payment Methods Being Used by Australians
Reserve Bank calculations of Australians’ awareness vs use of different payment methods, based on Ipsos data.
By contrast more recent innovations, such as “buy now, pay later” services and PayID, are being used by around a third of consumers.
These findings confirm 2022 data from the US Federal Reserve, showing just 2% of the adult US population made a payment using a cryptocurrrency, and Sweden’s Riksbank, showing less than 1% of Swedes made payments using crypto.
The Problem of Price Volatility
One reason for this, and why prices for goods and services are virtually never expressed in crypto, is that most fluctuate wildly in value. A shop or cafe with price labels or a blackboard list of their prices set in Bitcoin could be having to change them every hour.
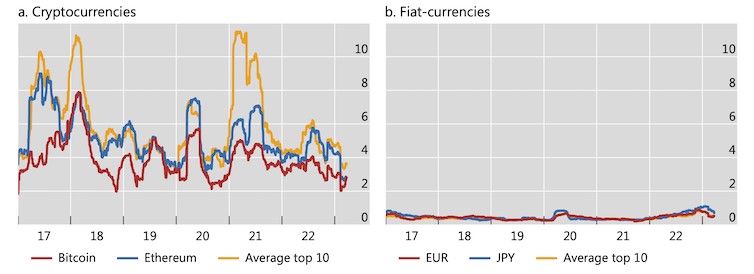
The following graph from the Bank of International Settlements shows changes in the exchange rate of ten major cryptocurrencies against the US dollar, compared with the Euro and Japan’s Yen, over the past five years. Such volatility negates cryptocurrency’s value as a currency.
There have been attempts to solve this problem with so-called “stablecoins”. These promise to maintain steady value (usually against the US dollar).
But the spectacular collapse of one of these ventures, Terra, once one of the largest cryptocurrencies, showed the vulnerability of their mechanisms. Even a company with the enormous resources of Facebook owner Meta has given up on its stablecoin venture, Libra/Diem.
This helps explain the failed experiments with making Bitcoin legal tender in the two countries that have tried it: El Salvador and the Central African Republic. The Central African Republic has already revoked Bitcoin’s status. In El Salvador only a fifth of firms accept Bitcoin, despite the law saying they must, and only 5% of sales are paid in it.
Storing Value, Hedging Against Inflation
If Bitcoin’s isn’t used for payments, what use does it have?
The major attraction – one endorsed by mainstream financial publications – is as a store of value, particularly in times of inflation, because Bitcoin has a hard cap on the number of coins that will ever be “mined”.
In terms of quantity, there are only 21 million Bitcoins released as specified by the ASCII computer file. Therefore, because of an increase in demand, the value will rise which might keep up with the market and prevent inflation in the long run.
The only problem with this argument is recent history. Over the course of 2022 the purchasing power of major currencies (US, the euro and the pound) dropped by about 7-10%. The purchasing power of a Bitcoin dropped by about 65%.
Speculation or Gambling?
Bitcoin’s price has always been volatile, and always will be. If its price were to stabilize somehow, those holding it as a speculative punt would soon sell it, which would drive down the price.
But most people buying Bitcoin essentially as a speculative token, hoping its price will go up, are likely to be disappointed. A BIS study has found the majority of Bitcoin buyers globally between August 2015 and December 2022 have made losses.
The “market value” of all cryptocurrencies peaked at US$3 trillion in November 2021. It is now about US$1 trillion.
Bitcoins’s highest price in 2021 was about US$60,000; in 2022 US$40,000 and so far in 2023 only US$30,000. Google searches show that public interest in Bitcoin also peaked in 2021. In the US, the proportion of adults with internet access holding cryptocurrencies fell from 11% in 2021 to 8% in 2022.
UK government research published in 2022 found that 52% of British crypto holders owned it as a “fun investment”, which sounds like a euphemism for gambling. Another 8% explicitly said it was for gambling.
The UK parliament’s Treasury Committee, a group of MPs who examine economics and financial issues, has strongly recommended regulating cryptocurrency as form of gambling rather than as a financial product. They argue that continuing to treat “unbacked crypto assets as a financial service will create a ‘halo’ effect that leads consumers to believe that this activity is safer than it is, or protected when it is not”.
Whatever the merits of this proposal, the UK committtee’s underlying point is solid. Buying crypto does have more in common with gambling than investing. Proceed at your own risk, and and don’t “invest” what you can’t afford to lose.
This article was republished with permission from The Conversation, a news site dedicated to sharing ideas from academic experts. It represents the research-based findings and thoughts of, John Hawkins, Senior Lecturer, Canberra School of Politics, Economics and Society, University of Canberra.
Different investment timelines call for different investments.
Have you ever looked at a chart of a company you were interested in, let’s say year-to-date, and thought, wow, this company has just dipped to where it could be expected to start to bring in buyers and go up? Then you look at a five-year chart, and the same stock has been trending down for years, and is actually close to where, from a longer-term perspective, a technical analyst would view it as more likely to weaken. Based on time perspective, both expectations can coincide with each other. This is why it is important to understand your own investment time frame before pulling the trigger on a stock.
The big question that needs to be answered first is, are you expecting the trade to work out in minutes, weeks, or years? Often this is based on any future needs of your invested capital.
If a trader is trying to make incremental income, they may use a five-minute chart. An investor looking to gain by holding weeks or months may use a one or three-year chart. Longer-term investors, those that are looking to put to bed what they hope will be the next Apple or Tesla in terms of performance, may look at charts using 20 years, or the “Max” time period.
Those that are longer-term investors can be less cautious about the exact timing on most investments, or less concerned about deciding if this is the ideal timing. This is especially relevant today in light of recession talk, rate increases, global risk, and other possible disruptions.
In fact, last year’s downward market direction was a wake up call for a lot of less seasoned investors, coming off so many so many positive years before. And this years retracement back up, is a good reminder that over time, markets have always broken new highs.
As mentioned above, when times are less certain, the investor that is looking to hold for an extended period, is the investor less likely to question their decision; many actually average into a position based on calendar buys, not price targets.
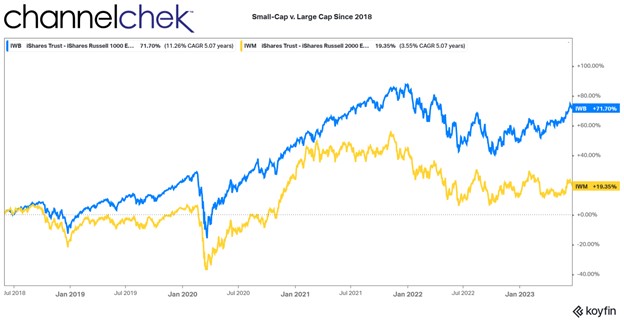
Having the long view, or deciding uncertain markets has dictated a longer view, would likely steer the investor to include smaller companies. Smaller companies have had the best long-term performance. It’s a category that may be more volatile but over time, has served investors better.
Over the past few years, small cap stocks have participated far less in the upward trend. That is less than larger companies (on average) and far less than they have versus their own historical average relative to large caps.
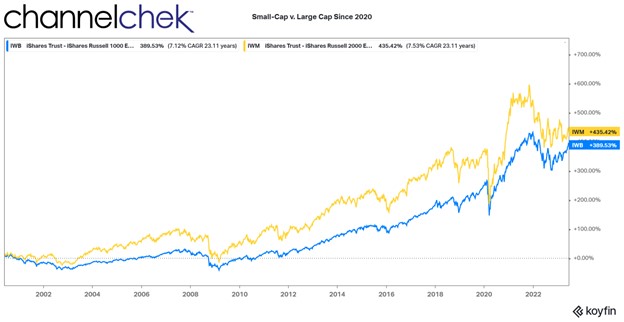
The chart above compares performance since the beginning of the decade of the Russell 2000 Large Cap performance (blue) to the Russell 2000 Small Cap index (gold). One thing that is evident immediately is the small cap stocks outperformed large caps long term by a large margin over time. The second is the trend is up. If you’d like, add a third which is there has been a significant dip in value (last year’s bear market).
“From our perspective, the uncertain present offers a highly opportune time to invest in small caps for the long run.” —Francis Gannon, Co-CIO Gannon Investment Partners (June 13. 2023)
Long term investors looking at this scenario could easily make a case for getting involved knowing that small caps historically overperform large caps. So if an investor is looking to maximize return, large caps may not have the highest probabilities. The above graph makes both points clear.
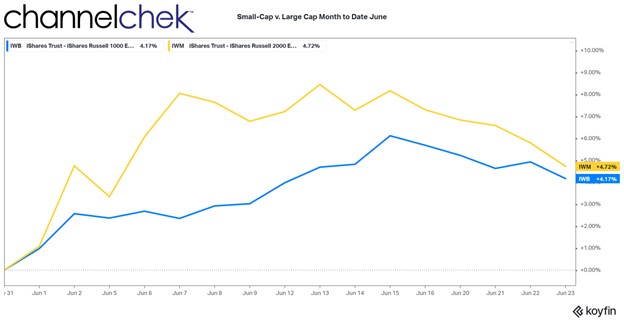
This second chart begins only five year ago. If one was to look at it by itself, the trendline over the years is upward, with gains in both large cap and small cap . But the large caps have a steeper upward pace. On the other hand, small caps are noticeably flat since the beginning of 2022.
The last chart is just since the beginning of this month. Small cap stocks seem to finally have caught their tailwind, going up by more on most up days, and coming down by less on down days. Time will tell if this is a trend that will continue.
The small cap stock index won’t catch the large caps over night. If it happens, it will be months or years before investors that have been in small caps catch and pass those that have been in large cap stocks. Those investing now will outperform those that got in earlier. Of course, long-term investors are cautioned to also be diversified across many industries and of even market cap sectors.
Perhaps rebalancing the allocation after so many periods of small cap underperformance is a strategy that fits all the basic tenets that have been true of long-term investing.
They are:
Over time the stock market goes up and breaks new records.
Diversified portfolios spread risk and are less volatile.
Rebalance so allocations in sectors that have done well are not now undermining your asset mix.
Take Away
One can look at the same stock, over different time periods and see completely different trends. Those investing longer term, providing the company or industry isn’t in a decades long tailspin, reduce the risk of loss by letting time iron out the ups and downs.
Small cap stocks over time have outperformed larger companies. Assuming this hasn’t changed, when the volatility is “ironed out” small caps have a lot of catching up to do before they pass. This argues that they will return even greater comparative performance than if they were already ahead in recent years.
How Will AI Affect Workers? Tech Waves of the Past Show How Unpredictable the Path Can Be
The explosion of interest in artificial intelligence has drawn attention not only to the astonishing capacity of algorithms to mimic humans but to the reality that these algorithms could displace many humans in their jobs. The economic and societal consequences could be nothing short of dramatic.
The route to this economic transformation is through the workplace. A widely circulated Goldman Sachs study anticipates that about two-thirds of current occupations over the next decade could be affected and a quarter to a half of the work people do now could be taken over by an algorithm. Up to 300 million jobs worldwide could be affected. The consulting firm McKinsey released its own study predicting an AI-powered boost of US$4.4 trillion to the global economy every year.
The implications of such gigantic numbers are sobering, but how reliable are these predictions?
This article was republished with permission from The Conversation, a news site dedicated to sharing ideas from academic experts. It represents the research-based findings and thoughts of Bhaskar Chakravorti, Dean of Global Business, The Fletcher School, Tufts University.
I lead a research program called Digital Planet that studies the impact of digital technologies on lives and livelihoods around the world and how this impact changes over time. A look at how previous waves of such digital technologies as personal computers and the internet affected workers offers some insight into AI’s potential impact in the years to come. But if the history of the future of work is any guide, we should be prepared for some surprises.
The IT Revolution and the Productivity Paradox
A key metric for tracking the consequences of technology on the economy is growth in worker productivity – defined as how much output of work an employee can generate per hour. This seemingly dry statistic matters to every working individual, because it ties directly to how much a worker can expect to earn for every hour of work. Said another way, higher productivity is expected to lead to higher wages.
Generative AI products are capable of producing written, graphic and audio content or software programs with minimal human involvement. Professions such as advertising, entertainment and creative and analytical work could be among the first to feel the effects. Individuals in those fields may worry that companies will use generative AI to do jobs they once did, but economists see great potential to boost productivity of the workforce as a whole.
The Goldman Sachs study predicts productivity will grow by 1.5% per year because of the adoption of generative AI alone, which would be nearly double the rate from 2010 and 2018. McKinsey is even more aggressive, saying this technology and other forms of automation will usher in the “next productivity frontier,” pushing it as high as 3.3% a year by 2040.That sort of productivity boost, which would approach rates of previous years, would be welcomed by both economists and, in theory, workers as well.
If we were to trace the 20th-century history of productivity growth in the U.S., it galloped along at about 3% annually from 1920 to 1970, lifting real wages and living standards. Interestingly, productivity growth slowed in the 1970s and 1980s, coinciding with the introduction of computers and early digital technologies. This “productivity paradox” was famously captured in a comment from MIT economist Bob Solow: You can see the computer age everywhere but in the productivity statistics.
Digital technology skeptics blamed “unproductive” time spent on social media or shopping and argued that earlier transformations, such as the introductions of electricity or the internal combustion engine, had a bigger role in fundamentally altering the nature of work. Techno-optimists disagreed; they argued that new digital technologies needed time to translate into productivity growth, because other complementary changes would need to evolve in parallel. Yet others worried that productivity measures were not adequate in capturing the value of computers.
For a while, it seemed that the optimists would be vindicated. In the second half of the 1990s, around the time the World Wide Web emerged, productivity growth in the U.S. doubled, from 1.5% per year in the first half of that decade to 3% in the second. Again, there were disagreements about what was really going on, further muddying the waters as to whether the paradox had been resolved. Some argued that, indeed, the investments in digital technologies were finally paying off, while an alternative view was that managerial and technological innovations in a few key industries were the main drivers.
Regardless of the explanation, just as mysteriously as it began, that late 1990s surge was short-lived. So despite massive corporate investment in computers and the internet – changes that transformed the workplace – how much the economy and workers’ wages benefited from technology remained uncertain.
Early 2000s: New Slump, New Hype, New Hopes
While the start of the 21st century coincided with the bursting of the so-called dot-com bubble, the year 2007 was marked by the arrival of another technology revolution: the Apple iPhone, which consumers bought by the millions and which companies deployed in countless ways. Yet labor productivity growth started stalling again in the mid-2000s, ticking up briefly in 2009 during the Great Recession, only to return to a slump from 2010 to 2019.
Smartphones have led to millions of apps and consumer services but have also kept many workers more closely tethered to their workplaces. (Credit: Campaigns of the World)
Throughout this new slump, techno-optimists were anticipating new winds of change. AI and automation were becoming all the rage and were expected to transform work and worker productivity. Beyond traditional industrial automation, drones and advanced robots, capital and talent were pouring into many would-be game-changing technologies, including autonomous vehicles, automated checkouts in grocery stores and even pizza-making robots. AI and automation were projected to push productivity growth above 2% annually in a decade, up from the 2010-2014 lows of 0.4%.But before we could get there and gauge how these new technologies would ripple through the workplace, a new surprise hit: the COVID-19 pandemic.
The Pandemic Productivity Push – then Bust
Devastating as the pandemic was, worker productivity surged after it began in 2020; output per hour worked globally hit 4.9%, the highest recorded since data has been available.
Much of this steep rise was facilitated by technology: larger knowledge-intensive companies – inherently the more productive ones – switched to remote work, maintaining continuity through digital technologies such as videoconferencing and communications technologies such as Slack, and saving on commuting time and focusing on well-being.
While it was clear digital technologies helped boost productivity of knowledge workers, there was an accelerated shift to greater automation in many other sectors, as workers had to remain home for their own safety and comply with lockdowns. Companies in industries ranging from meat processing to operations in restaurants, retail and hospitality invested in automation, such as robots and automated order-processing and customer service, which helped boost their productivity.
But then there was yet another turn in the journey along the technology landscape.
The 2020-2021 surge in investments in the tech sector collapsed, as did the hype about autonomous vehicles and pizza-making robots. Other frothy promises, such as the metaverse’s revolutionizing remote work or training, also seemed to fade into the background.
In parallel, with little warning, “generative AI” burst onto the scene, with an even more direct potential to enhance productivity while affecting jobs – at massive scale. The hype cycle around new technology restarted.
Looking Ahead: Social Factors on Technology’s Arc
Given the number of plot twists thus far, what might we expect from here on out? Here are four issues for consideration.
First, the future of work is about more than just raw numbers of workers, the technical tools they use or the work they do; one should consider how AI affects factors such as workplace diversity and social inequities, which in turn have a profound impact on economic opportunity and workplace culture.
For example, while the broad shift toward remote work could help promote diversity with more flexible hiring, I see the increasing use of AI as likely to have the opposite effect. Black and Hispanic workers are overrepresented in the 30 occupations with the highest exposure to automation and underrepresented in the 30 occupations with the lowest exposure. While AI might help workers get more done in less time, and this increased productivity could increase wages of those employed, it could lead to a severe loss of wages for those whose jobs are displaced. A 2021 paper found that wage inequality tended to increase the most in countries in which companies already relied a lot on robots and that were quick to adopt the latest robotic technologies.
Second, as the post-COVID-19 workplace seeks a balance between in-person and remote working, the effects on productivity – and opinions on the subject – will remain uncertain and fluid. A 2022 study showed improved efficiencies for remote work as companies and employees grew more comfortable with work-from-home arrangements, but according to a separate 2023 study, managers and employees disagree about the impact: The former believe that remote working reduces productivity, while employees believe the opposite.
Third, society’s reaction to the spread of generative AI could greatly affect its course and ultimate impact. Analyses suggest that generative AI can boost worker productivity on specific jobs – for example, one 2023 study found the staggered introduction of a generative AI-based conversational assistant increased productivity of customer service personnel by 14%. Yet there are already growing calls to consider generative AI’s most severe risks and to take them seriously. On top of that, recognition of the astronomical computing and environmental costs of generative AI could limit its development and use.
Finally, given how wrong economists and other experts have been in the past, it is safe to say that many of today’s predictions about AI technology’s impact on work and worker productivity will prove to be wrong as well. Numbers such as 300 million jobs affected or $4.4 trillion annual boosts to the global economy are eye-catching, yet I think people tend to give them greater credibility than warranted.
Also, “jobs affected” does not mean jobs lost; it could mean jobs augmented or even a transition to new jobs. It is best to use the analyses, such as Goldman’s or McKinsey’s, to spark our imaginations about the plausible scenarios about the future of work and of workers. It’s better, in my view, to then proactively brainstorm the many factors that could affect which one actually comes to pass, look for early warning signs and prepare accordingly.
The history of the future of work has been full of surprises; don’t be shocked if tomorrow’s technologies are equally confounding.
There is Record Government Funding for Energy, According to a New Report
Governments around the globe spent a lot of money on energy research and development last year, according to data presented in the newly released World Energy Investment 2023 report. As presented, government investment in newer technology hit record highs in 2022. The report lays out how unevenly the money is distributed. It’s no surprise that ever-increasing amounts have been allocated to clean energy technologies. Understanding these allocations can be helpful to both the public and private investors involved or seeking to be involved in an industry that is considered a necessity for life.
The report also shows that investment in energy innovation increased. But cautions that a weaker economy may lead to a reduced ability to fund newer ideas, especially those that rely on private capital. This could possibly create a period where the fast pace of innovation, improvement, and efficiency tapers.
In addition to possible increased economic weakness as a risk, countries are turning their focus closer to home. Many are investing in their own clean energy industries. This also risks decelerating the “clean energy” pace – cooperation between countries helps lubricate development, and poorer countries, potentially with a larger carbon footprint per capita, benefit from the assistance of the global community. The report shows an expectation that sharing of information and technology decreased in 2022, but the G7 and G20 are starting to address the barriers to energy R&D investment and the disparities between countries.
The report also shows that investment in clean energy technologies is significantly outpacing spending on fossil fuels, as affordability and security concerns triggered by the global energy crisis strengthen the momentum behind more sustainable options.
Public spending on all energy research and development is estimated to have grown by $US 44 billion or 10% in 2022, with 80% estimated to have been spent to benefit “clean energy.” As far as non-government investments, listed companies in energy-related sectors, demonstrated a similar rise in R&D budgets in 2022, while early-stage venture capital investment into clean energy start-ups reached a new high of $US 6.7 billion. These solid outcomes came despite higher costs of capital and pervading economic uncertainty.
Early-stage equity funding for energy start-ups had its biggest year ever in 2022, with increases in most clean energy technology areas. Funding for start-ups in CO2 capture, energy efficiency, nuclear and renewables nearly doubled or more than doubled from 2021, which was already much higher than the average of the preceding decade. This type of funding supports technology testing and design and plays a critical role in honing good ideas and adapting them to market opportunities.
Growth-stage funding, which requires more capital but funds less risky innovation, rose by only 1% in 2022 and was very weak in Q1 2023, indicating that the value of growth-stage deals for energy start-ups could fall by nearly 60% in 2023. Prevailing macroeconomic conditions have slowed the amount of capital available and raised the cost of scaling up businesses.
The report indicates that early-stage equity funding for energy start-ups is booming, led by clean mobility and renewables, but later-stage funding is eroding.
Take Away
Overall, the World Energy Investment 2023 report shows that there is an increase of 10% in investment in energy innovation. This increase is both in government-related funding and public/private sector investment. The pace has helped many companies blossom and brought ideas to light, but there are some risks that this may have peaked.
Outside of newer energy solutions, fossil fuels represent about 20% of the capital allocated to energy.
Dollar Global Usefulness Can Not Easily be Replaced
The prospect of the dollar being knocked from its perch as the primary fiat currency is worrisome to many Americans. Anxiety has been recently increased by news of short-term arrangements in which countries want to exchange more directly with one another in their native currency. China has established quite a few of these agreements over the past year. But is the widespread global use of the dollar in jeopardy?
Daniel Gros is a Professor of Practice and Director of the Institute for European Policymaking at Bocconi University. In the article below, originally published in The Conversation, Professor Gros offers his insight and expectations for the US currency.
Is the end of the dollar’s reign upon us? The prospect is worrisome to Americans.
The position of the US dollar in the global league table of foreign exchange reserves held by other countries is closely watched. Every slight fall in its share is interpreted as confirmation of its imminent demise as the preferred global currency for financial transactions.
The recent drama surrounding negotiations about raising the limit on US federal government debt has only fuelled these predictions by “dollar doomsayers”, who believe repeated crises over the US government’s borrowing limit weakens the country’s perceived stability internationally.
But the real foundation of its dominance is global trade – and it would be very complicated to turn the tide of these many transactions away from the US dollar.
The international role of a global currency in financial markets is ultimately based on its use in non-financial transactions, especially as what’s called an “invoicing currency” in trade. This is the currency in which a company charges its customers.
Modern trade can involve many financial transactions. Today’s supply chains often see goods shipped across several borders, and that’s after they are produced using a combination of intermediate inputs, usually from different countries.
Suppliers may also only get paid after delivery, meaning they have to finance production beforehand. Obtaining this financing in the currency in which they invoice makes trade easier and more cost effective.
In fact, it would be very inconvenient for all participants in a value chain if the invoicing and financing of each element of the chain happened in a different currency. Similarly, if most trade is invoiced and financed in one currency (the US dollar at present), even banks and firms outside the US have an incentive to denominate and settle financial transactions in that currency.
This status quo becomes difficult to change because no individual organisation along the chain has an incentive to switch currencies if others aren’t doing the same.
This is why the US dollar is the most widely used currency in third-country transactions – those that don’t even involve the US. In such situations it’s called a vehicle currency. The euro is used mainly in the vicinity of Europe, whereas the US dollar is widely used in international trade among Asian countries. Researchers call this the dominant currency paradigm.
The convenience of using the US dollar, even outside its home country, is further buttressed by the openness and size of US financial markets. They make up 36% of the world’s total or five times more than the euro area’s markets. Most trade-related financial transactions involve the use of short-term credit, like using a credit card to buy something. As a result, the banking systems of many countries must then be at least partially based on the dollar so they can provide this short-term credit.
And so, these banks need to invest in the US financial markets to refinance themselves in dollars. They can then provide this to their clients as dollar-based short-term loans.
It’s fair to say, then, that the US dollar has not become the premier global currency only because of US efforts to foster its use internationally. It will also continue to dominate as long as private organisations engaged in international trade and finance find it the most convenient currency to use.
What Could Knock the US Dollar Off its Perch?
Some governments such as that of China might try to offer alternatives to the US dollar, but they are unlikely to succeed.
Government-to-government transactions, for example for crude oil between China and Saudi Arabia, could be denominated in yuan. But then the Saudi government would have to find something to do with the Chinese currency it receives. Some could be used to pay for imports from China, but Saudi Arabia imports a lot less from China (about US$30 billion) than it exports (about US$49 billion) to the country.
The US$600 billion Public Investment Fund (PIF), Saudi Arabia’s sovereign wealth fund, could of course use the yuan to invest in China. But this is difficult on a large scale because Chinese currency remains only partially “convertible”. This means that the Chinese authorities still control many transactions in and out of China, so that the PIF might not be able to use its yuan funds as and when it needs them. Even without convertibility restrictions, few private investors, and even fewer western investment funds, would be keen to put a lot of money into China if they are at the mercy of the Communist party.
China is of course the country with the strongest political motives to challenge the hegemony of the US dollar. A natural first step would be for China to diversify its foreign exchange reserves away from the US by investing in other countries. But this is easier said than done.
There are few opportunities to invest hundreds or thousands of billions of dollars outside of the US. Figures from the Bank of International Settlements show that the euro area bond market – a place for investors to finance loans to Euro area companies and governments – is worth less than one third of that of the US.
Also, in any big crisis, other major OECD economies like Europe and Japan are more likely to side with the US than China – making such a decision is even easier when they are using US dollars for trade. It was said that states accounting for one-half of the global population refused to condemn Russia’s invasion of Ukraine, but this half does not account for a large share of global financial markets.
Similarly, it shouldn’t come as a surprise that democracies dominate the world financially. Companies and financial markets require trust and a well-established rule of law. Non-democratic regimes have no basis for establishing the rule of law and every investor is ultimately subject to the whims of the ruler.
When it comes to global trade, currency use is underpinned by a self-reinforcing network of transactions. Because of this, and the size of the US financial market, the dollar’s dominant position remains something for the US to lose rather for others to gain.
With BlackRock filing for a Bitcoin-related ETF this month, and then Citadel, Charles Schwab, and Fidelity backing a cryptocurrency exchange, there is again talk of Bitcoin (BTC) more than retracing its previous all-time high. BlackRock’s proposed product is designed, as are other crypto ETFs, to trade like a stock. This helps satisfy those that want ease of trading, exposure of their qualified retirement money, and all investments on one statement. A consolidated statement is also a benefit of Citadel, Schwab, and Fidelity’s exchange plans.
This adds fuel to the momentum Bitcoin has relative to other assets.
Another reason for increased expectations for Bitcoin’s performance is, next year Bitcoin’s is scheduled to halve, sometimes called its “halving event.” This halving happens every four years as Bitcoin rewards to miners are cut in half (miner’s payout will be reduced to 3.125 BTC). The event is viewed as positive for Bitcoin’s price. This is because halving helps in reducing supply. Historically, halving has brought higher Bitcoin values.
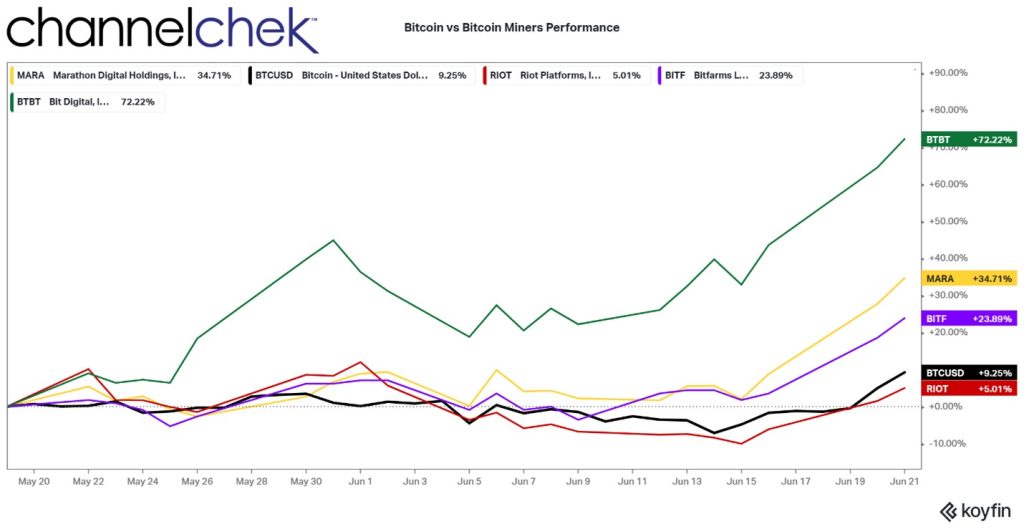
Exposure to Bitcoin price movements are, for some investors, already in their traditional brokerage accounts, and when desired, has found its way into IRA’s and other tax-advantaged retirement accounts. This is accomplished using the strong correlation between Bitcoin mining stocks, and the trend and momentum of Bitcoins measured against US Dollar value (BTCUSD) .
Over the past month as Bitcoin rose more than double that of the S&P 500 as a percentage, many Bitcoin mining stocks crushed the crypto’s performance. Both Bitcoin and Bitcoin miners historically move in the same direction, but the magnitude varies.
Currently, many mining stocks are experiencing a much greater magnitude.
To demonstrate how mining stocks provide stock portfolios the overall direction of Bitcoin, but differ in terms of degree, the chart above plots four Bitcoin mining companies against the BTCUSD. The overall direction is visually correlated to $Dollar/Bitcoin percentage moves. However, there are huge variations in that performance. The top performer represented above is Bit Digital, Inc. (BTBT). The New York-headquartered, large-scale mining business, with operations across the U.S. and Canada also acts as a validator of Ethereum. This is common stock and avoids the contortions and management fees of gaining exposure through an ETF, and of course, can be obtained through an investors traditional stockbroker. While Bit Digital rose 72.22% during the last 30 days, Bitcoin rose near 10%.
The weakest Bitcoin mining company pictured here is Riot. Riot has deployed one of the mining industry’s largest fleets of self-mining hardware. While the period represented above is only the past 30 days, Bitcoin strength is still represented in this laggard.
Take Away
The new possibility that BlackRock gets approval for a Bitcoin ETF and that a consortium of brokerage firms create a crypto exchange, is expected to lead to a growth in demand for cryptocurrency. Investors may be able to capture directional performance of Bitcoin using the stocks of Bitcoin miners, and have these assets listed on their current brokerage holding reports, and even house them in qualified tax-advantaged accounts.
The launch of a Bitcoin ETF could certainly help increase exposure to the token and drive up demand because it makes it easier for consumers to purchase, and crypto exchanges have also come under regulatory scrutiny as of late. If an investor is looking to accomplish this, they may wish to evaluate whether they can meet their needs using Bitcoin mining stocks.
Are Higher Interest Rates Going to Be Devastatingly Expensive to the US Treasury?
The Federal Open Market Committee (FOMC) has raised the overnight Fed Funds target rate from near zero to around 5% in less than a year and a half. That multiple from its starting point is huge and, as designed, driven up other rates, both savings and lending. Given the pace that rates have gone up, the cost of refinancing or rolling existing debt for the federal and municipal governments, businesses, and households, has obviously experienced a large cost increase. When treasury debt matures, the US government decides whether to “roll over” their debt by issuing new securities at the current rate—or find other resources to repay borrowers. When rolling, far more is required to be borrowed just to stay even and cover interest rate costs. Below we use numbers from Federal Reserve branch to determine how much more it will cost.
The Federal Reserve Bank of St Louis (FRED), compiled data on the increased cost of US borrowing as a direct result of the Federal Reserve’s tighter monetary policy. The sheer magnitude of the amount borrowed, and the impact of interest rates make clear the US either will be increasing its borrowings, just to stay even with rollovers, or will need to cut back by spending. Cutting back spending removes economic stumulus. Below are the FRED numbers on how interest costs are expected to change.
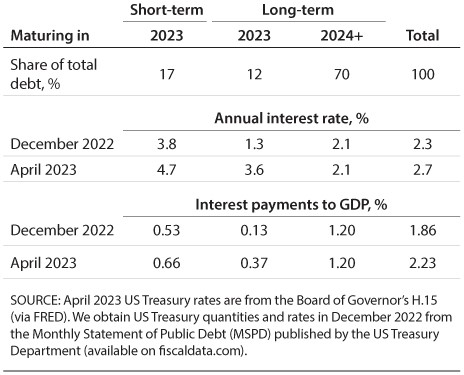
US Government Debt Breakdown
The total public debt, according to the US Treasury Department, is just over $31.4 trillion
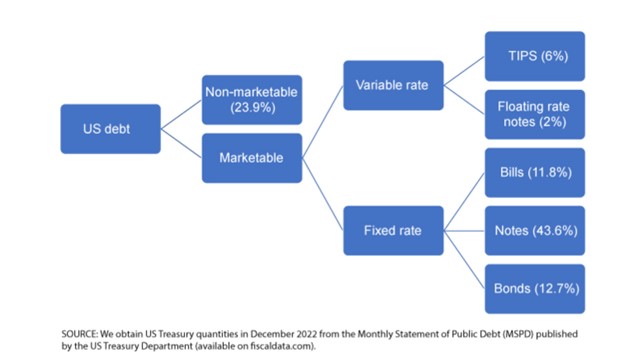
Of the $31.4 trillion, about $7.5 trillion or 23.9% is nonmarketable debt—mainly consisting of the social security trust fund, military retirement funds, and the civil service retirement fund.
That leaves $23.9 trillion in marketable debt. $2.5 trillion is in variable-rate debt and increases when rates rise. The variable category is made up of Treasury inflation-indexed notes (TIPS) and floating-rate notes (FRNs). TIPS make up 6% of the overall US debt, have original maturities of 5, 10, or 30 years. FRNs make up only 2% of US debt, have maturity of 2 years, and interest payments are based on a fixed spread and a variable index rate calculated weekly.
Then there are $21.4 trillion in fixed-rate marketable securities. This final category contains bills, notes, and bonds, which make up 11.8%, 43.6%, and 12.7% of the US debt, respectively. The only differences in these instruments is that bills are discounted to yield the rate, while notes and bonds have semiannual interest rate payments. “notes” is the term used from 2-10 year maturities, bonds are from 10-20 years
Focusing only on the 68.1% fixed-rate of marketable U.S. debt, consisting of bills, notes, and bonds and for ease, using end of the year December 2022 to use specific securities and their roll dates, this is what the St. Louis Federal Reserve laid out.
The debt maturing each year has been broken down into different colors below by maturity. For example, the orange portion of the 2023 column represents two-year US Treasury debt maturing in the year 2023.
Notice about 30% of existing debt is maturing in 2023. And nearly 62% of existing US debt is coming due in the nine years after 2023. Finally, 18% of existing Treasury debt is very long dated and will not come due for at least 10 years. So 82% will reset at current rates within the next nine years.
Maturity Dispersion
Aside from quantity and maturity, the calculations aren’t complete without factoring in the yield of the current debt. Remember, the current interest rate levels are not the first time visiting 4% or higher.
FRED used data on quantities and prices from December 2022 and compared it with the interest expense the US government would pay on the same quantity of debt using the new, higher interest rates in April 2023. Here, FRED assumed that the US government will keep the same debt schedule as in 2022. In other words, for any debt maturing during 2023, the government will issue another security with the same quantity and maturity—but at the new interest rate. They define short-term debt as any security with maturity less than or equal to one year and long-term debt as any security with maturity greater than one year.
Maturing Interest Rate, New Interest Rate
Short-term debt maturing in 2023 makes up about 17% of the outstanding. However, because this debt is short term, most of it had already been rolled over at higher interest rates in 2022. The December 2022 average rate on the short-term debt was already 3.8% and therefore increased only 0.9%—to 4.7%—in April. The long-term debt maturing in 2023 is almost 12% of debt, and the average rate increases from 1.3% to 3.6%, which is fairly large. Long-term debt maturing after 2024 will have the same interest rate, since the federal government is not rolling it over in 2023. Long-term debt makes up just over 70% of the existing debt.
To get some idea of the magnitude of $98 billion, the St. Louis Fed provided two examples: First, the Federal Reserve pays the Treasury Department revenue or remittances, which basically contain all remaining Fed revenue after operating expense. Fed remittances were $105 billion in 2021 and were negative $54 billion in 2022, in part due to the increases in interest rates. In 2021, this was an example of an inflow, or payment, to the government. Second, an example of an outflow, or expense incurred by the government, the US Department of Transportation spent $114 billion in 2022.
Bringing in the variable rate debt that we excluded earlier, the Congressional Budget Office (CBO) has forecasted for interest expense payments over GDP in the next 10 years. The CBO’s projections include variable-rate marketable securities—TIPS and FRNs—so they of course will of course be added to the fixed rate securities.
Take Away
What the US government spends, is generally stimulative. Money spent on interest would also seem to work its way into the system and be stimulative, but in the face of inflation, more goods or services is not necessarily attainable with the larger payments.
The US government had $21.4 trillion in outstanding US Treasury debt as of December 2022. Given large increases to interest rates over the past year, FRED estimated that it will cost the US government an additional $98 billion to pay interest on their debt in 2023.
The estimate is close to that made by the CBO as well. While the number seems large, relative to flows in and out of the US Treasury it is in line and not by comparison large.
The report from the Federal Reserve Branch concluded if long-term rates remain high, servicing the debt will become a larger and larger portion of the overall government expense.
The Importance Of Securities Research and Analysis May Inspire A Reversal in Regulations
The US Securities and Exchange Commission has avoided confrontation for a few years with European Union securities laws by extending exceptions to US brokers in the states that are subject to the EU’s MIFID II rules. The rules require that brokers charge clients separately for their analysis on stocks or bonds, and not provide it as an accommodation. In the US, charging for “advice” would cause brokers to have to register with FINRA as Investment Advisors – this opens up a new set of difficulties. The stand-off has been headed for a showdown for a while, and this coming July 3rd is when the SEC exception that exempts brokers expires.
Will Showdown be Averted?
The SEC exceptions to US brokers that have EU clients have been in place for five years, occasionally being extended – but the last extension expiring in a few weeks, may not get pushed out. SEC Chair Gary Gensler has been emphatic that he does not intend to extend any longer. The EU’s Markets in Financial Instruments directive threw a monkey wrench into a long-held custom of sell-side research by banning the common practice of accommodating clients by not directly charging for bond or equity analysis. Instead, in effect, “bundling” the service with research costs covered by trading commissions.
During the time that the EU has had MiFID II in place, an explicit price tag for research to investors has resulted in reduced company stock coverage. The new and growing concern is that the rules are hurting Europe’s financial markets — especially its small-caps. This is an important driver for the EU to consider a different tack.
Until now, without the SEC exemption from domestic rules, brokers in the huge US economy would have had to figure out how to take payment for research from their clients bound by MiFID. Or, alternatively, their clients would do without this important investment tool. The timeline is tight, but the problem for US brokers may be averted if the EU lawmakers act.
Will Europe Change Course?
With the SEC’s no-action letter expiring, the timing couldn’t be better. Investment firms following the rules of both regulators would cause a situation where US firms stop providing as much investment research to buy-side investors. Equity research is not only important to investors evaluating companies, but it is important to the companies themselves that need to be understood in order to attract capital and have enough active trading in their company to maintain suitable liquidity. This is especially true of small-cap and microcap stocks.
According to Reuters, the “states will seek a near total U-turn on the rules behind so-called unbundling.” MiFID II reforms, in place since 2018, may be adjusted to not conflict with the US model that separates brokers and investment advisors, requiring different licensing and different responsibilities of each.
The proposals suggest that an investment firm would only have to inform clients whether they are paying for research along with trading jointly, and record the charges attributable to each. This is different from unbundling, where from the client’s perspective, the research is a separate product, and decided on and paid for as an add-on to any other business.
Investors Could Win
While it was unclear how the showdown might come to an end, the new proposal, a dramatic turnaround from the EU on its current regulations, could finally resolve the regulator’s game of chicken and, at the same time, create an environment where investors benefit from more available information.
The original EU rule was intended to separate what lawmakers thought could be conflicts of interest when the selling broker also provides research while at the same time may have other banking and business relationships with the company it is providing research on.
The EU’s answer was to separate the two. But over time, according to Reuters, “evidence suggests research provision across the region has suffered as a result.” It lead to less research being distributed, which is viewed as negative to investors and the investor process.
What’s the Next Step?
The EU States’ plan talks with the European Parliament. The final shape of any regulatory changes will be decided in the negotiations, and the exact timetable for a conclusion is not yet clear.
Take Away
The prospect of a flip-flop on the MiFID rules comes at a key moment for the brokerage and securities research industries. In the US, a waiver allowing brokers to charge European clients separately for trading and for research is about to expire. At expiration, they’d have to adapt to the regulatory mismatch or drop the clients.
The drama is set against a very tight timeline.
As an interesting note, Channelchek is a platform that houses quality equity research and data on small and microcap companies. The information is at no cost to investors and is in no way tied to securities transactions. If you haven’t signed up to view this research, do this now.
This Week We’ll See if the Small-Cap Rally Continues, and Which Individual Stocks Move from the Russell Reconstitution
The FOMC interest rate pause at 5.00-5.25% last week created investor uncertainty as there was little forward guidance as the policymakers insist they remain data dependent. Chair Jerome Powell was emphatic in his comments to the press on Wednesday that getting inflation down to the 2 percent average inflation target is the FOMC’s unanimous goal – although there may be differences on the speed or level at which rates need to be adjusted.
Powell will have the spotlight again this week as he gives two testimony’s, the first on Wednesday before the House Financial Services Panel, and then on Thursday before the Senate Banking Committee.
While the mood of markets is still apprehensive, this did not stop the S&P 500 from rallying and reaching the highest weekly close since April 2022.
Monday 6/19
• US Markets closed in celebration of the Juneteenth holiday.
Tuesday 6/20
• 8:30 PM ET, May Housing starts are expected to hold steady after experiencing a bounce in April. Exonomists expect May’s starts to have been 1.433 million, they were 1.416 million in April.
Wednesday 6/21
• 10:00 AM ET, Federal Reserve Chairman Powell will appear before House Financial Services Panel.
• 10:00 AM – 4:00 PM ET, While Fed Chair Powell will be getting the attention as he reads prepared remarks and answers question, the day will be filled with other FOMC members speaking and sharing their view and outlook for the first time since the June FOMC meeting concluded. This includes Lisa Cook at 10:00 AM ET, Philip Jefferson also at 10:00 AM ET, Austan Goolsbee at 12:25 PM ET, and Loretta Mester at 4:00 PM ET.
Thursday 6/22
• 8:30 AM ET, Jobless Claims for the June 17 week, is expected to remain near the previous weeks level. The consensus is 261,000 versus 262,000 last week.
• 10:00 AM ET, Existing Home sales for May are expected to slip slightly to a 4.25 million rate. The National Association of Realtors described sales as “bouncing back and forth” but remaining “above recent cyclical lows.”
• 10:00 AM ET, Federal Reserve Chairman Powell will again be the focus as he appears before the Senate Banking Panel.
• 10:00 AM ET, The Index of Leading Indicators was down by 0.6 percent in April, for May it is expected to post a 14th straight decline, the consensus is down 0.7 percent. This index has been in sharp decline and has long been a trendline toward slow or no economic growth. signaling a pending recession.
• 4:30 PM ET, Factors Affecting Reserve Balances, otherwise known as The Fed’s Balance Sheet or the H.4.1 report is a weekly report of a consolidated balance sheet for all 12 Reserve Banks that lists factors supplying reserves into the banking system and factors absorbing reserves from the system. The report is officially named Factors Affecting Reserve Balances, otherwise known as the “H.4.1” report.
Friday 6/23
• 9:45 AM ET, The Purchasing Managers Index (PMI) is not expected to show significant change in June compared to May; manufacturing underperformed at 48.5 and services even though services were strong at 53.5.
What Else
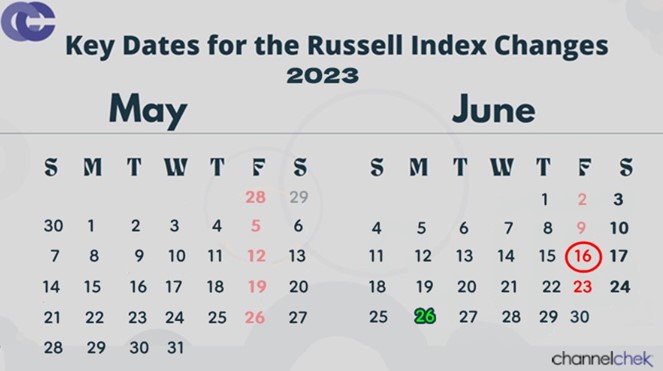
On Friday the Russell Indexes will have new components beginning the moment the market closes. The following Monday morning the indexes will reflect these changes, and index funds that are designed to match the performance of the funds will hopefully have gotten their trades off in time. Expect some interesting moves of a few stocks on Friday as a result.
Small-cap stocks have joined the stock market rally in June and, according to an article in Morningstar, “trouncing the larger indexes.”
Noble Capital Markets has been hosting road shows of interesting small-cap companies in various cities and towns throughout the US. This week features a very busy week with company’s speaking to potential investors in St. Louis and Florida. Also there will be two virtual events, so that no one is excluded by geography. Become informed here.
Will Copyright Law Favor Artificial Intelligence End Users?
In 2022, an AI-generated work of art won the Colorado State Fair’s art competition. The artist, Jason Allen, had used Midjourney – a generative AI system trained on art scraped from the internet – to create the piece. The process was far from fully automated: Allen went through some 900 iterations over 80 hours to create and refine his submission.
Yet his use of AI to win the art competition triggered a heated backlash online, with one Twitter user claiming, “We’re watching the death of artistry unfold right before our eyes.”
As generative AI art tools like Midjourney and Stable Diffusion have been thrust into the limelight, so too have questions about ownership and authorship.
These tools’ generative ability is the result of training them with scores of prior artworks, from which the AI learns how to create artistic outputs.
Should the artists whose art was scraped to train the models be compensated? Who owns the images that AI systems produce? Is the process of fine-tuning prompts for generative AI a form of authentic creative expression?
This article was republished with permission from The Conversation, a news site dedicated to sharing ideas from academic experts. It represents the research-based findings and thoughts of, Robert Mahari, JD-PhD Student, Massachusetts Institute of Technology (MIT), Jessica Fjeld, Lecturer on Law, Harvard Law School, and Ziv Epstein, PhD Student in Media Arts and Sciences, Massachusetts Institute of Technology (MIT).
On one hand, technophiles rave over work like Allen’s. But on the other, many working artists consider the use of their art to train AI to be exploitative.
We’re part of a team of 14 experts across disciplines that just published a paper on generative AI in Science magazine. In it, we explore how advances in AI will affect creative work, aesthetics and the media. One of the key questions that emerged has to do with U.S. copyright laws, and whether they can adequately deal with the unique challenges of generative AI.
Copyright laws were created to promote the arts and creative thinking. But the rise of generative AI has complicated existing notions of authorship.
Photography Serves as a Helpful Lens
Generative AI might seem unprecedented, but history can act as a guide.
Take the emergence of photography in the 1800s. Before its invention, artists could only try to portray the world through drawing, painting or sculpture. Suddenly, reality could be captured in a flash using a camera and chemicals.
As with generative AI, many argued that photography lacked artistic merit. In 1884, the U.S. Supreme Court weighed in on the issue and found that cameras served as tools that an artist could use to give an idea visible form; the “masterminds” behind the cameras, the court ruled, should own the photographs they create.
From then on, photography evolved into its own art form and even sparked new abstract artistic movements.
AI Can’t Own Outputs
Unlike inanimate cameras, AI possesses capabilities – like the ability to convert basic instructions into impressive artistic works – that make it prone to anthropomorphization. Even the term “artificial intelligence” encourages people to think that these systems have humanlike intent or even self-awareness.
This led some people to wonder whether AI systems can be “owners.” But the U.S. Copyright Office has stated unequivocally that only humans can hold copyrights.
So who can claim ownership of images produced by AI? Is it the artists whose images were used to train the systems? The users who type in prompts to create images? Or the people who build the AI systems?
Infringement or Fair Use?
While artists draw obliquely from past works that have educated and inspired them in order to create, generative AI relies on training data to produce outputs.
This training data consists of prior artworks, many of which are protected by copyright law and which have been collected without artists’ knowledge or consent. Using art in this way might violate copyright law even before the AI generates a new work.
Still from ‘All watched over by machines of loving grace’ by Memo Akten, 2021. Created using custom AI software. Memo Akten, CC BY-SA
For Jason Allen to create his award-winning art, Midjourney was trained on 100 million prior works.
Was that a form of infringement? Or was it a new form of “fair use,” a legal doctrine that permits the unlicensed use of protected works if they’re sufficiently transformed into something new?
While AI systems do not contain literal copies of the training data, they do sometimes manage to recreate works from the training data, complicating this legal analysis.
Will contemporary copyright law favor end users and companies over the artists whose content is in the training data?
To mitigate this concern, some scholars propose new regulations to protect and compensate artists whose work is used for training. These proposals include a right for artists to opt out of their data’s being used for generative AI or a way to automatically compensate artists when their work is used to train an AI.
Muddled Ownership
Training data, however, is only part of the process. Frequently, artists who use generative AI tools go through many rounds of revision to refine their prompts, which suggests a degree of originality.
Answering the question of who should own the outputs requires looking into the contributions of all those involved in the generative AI supply chain.
The legal analysis is easier when an output is different from works in the training data. In this case, whoever prompted the AI to produce the output appears to be the default owner.
However, copyright law requires meaningful creative input – a standard satisfied by clicking the shutter button on a camera. It remains unclear how courts will decide what this means for the use of generative AI. Is composing and refining a prompt enough?
Matters are more complicated when outputs resemble works in the training data. If the resemblance is based only on general style or content, it is unlikely to violate copyright, because style is not copyrightable.
The illustrator Hollie Mengert encountered this issue firsthand when her unique style was mimicked by generative AI engines in a way that did not capture what, in her eyes, made her work unique. Meanwhile, the singer Grimes embraced the tech, “open-sourcing” her voice and encouraging fans to create songs in her style using generative AI.
If an output contains major elements from a work in the training data, it might infringe on that work’s copyright. Recently, the Supreme Court ruled that Andy Warhol’s drawing of a photograph was not permitted by fair use. That means that using AI to just change the style of a work – say, from a photo to an illustration – is not enough to claim ownership over the modified output.
While copyright law tends to favor an all-or-nothing approach, scholars at Harvard Law School have proposed new models of joint ownership that allow artists to gain some rights in outputs that resemble their works.
In many ways, generative AI is yet another creative tool that allows a new group of people access to image-making, just like cameras, paintbrushes or Adobe Photoshop. But a key difference is this new set of tools relies explicitly on training data, and therefore creative contributions cannot easily be traced back to a single artist.
The ways in which existing laws are interpreted or reformed – and whether generative AI is appropriately treated as the tool it is – will have real consequences for the future of creative expression.
Investors Already Wary of Big Tech’s Dizzying Heights May Deviate Away From Swelling Large Cap Weightings
What’s different about this year’s Russell Index Reconstitution?
When the market closes on Friday, June 23rd , the overall FTSE Russell 3000 index and the other indexes that it impacts, including the Russell 1000 Large-cap and Russell 2000 Small-cap index, will be rebalanced to reflect current market-cap size. When the bell rings on Monday June 26th, the indexes will have different members and adjusted weighting of those constituents. Some market watchers and analysts expect this year to be a “headache” for active portfolio managers. Here’s why.
The new FTSE Russell makeup is already known. There is only a small chance a change in that might occur between now and Friday, it is largely assured that the reconstitution will increase the concentration of the top ten biggest companies in the large-cap Russell 1000 Index to a historical high of 29%. Active managers that are already underweighted mega-caps and big tech represented in the large-cap indexes will have to decide if they are going to increase holdings or be even more underweighted in comparison to an index that investors are likely to compare them to.
Additionally, while active fund managers are freer to weight their portfolios (within the boundaries of the fund’s prospectus), investors tend to compare the returns of index funds to the performance of managed funds when investing. This would increase the size of the bet in terms of fund percentage for managed funds, some already underweighted in tech. They’ll have a decision to make.
Further confusing things on the large-cap side is that the wisdom of diversification is being tested. If ten of the largest company’s make up 29% of an index, one that financial advisors and mom-and-pop investors are comparing them to, then roughly mimicking its concentrations would reduce diversification. Investing in a fund with a more even balance of stocks had once been the primary driver of mutual funds’ growth in popularity.
The rebalancing will heap a higher weighting to mega-cap names, including those referred to as FAANG stocks. This group of companies have already had tremendous gains this year, a pace that history would indicate is not sustainable.
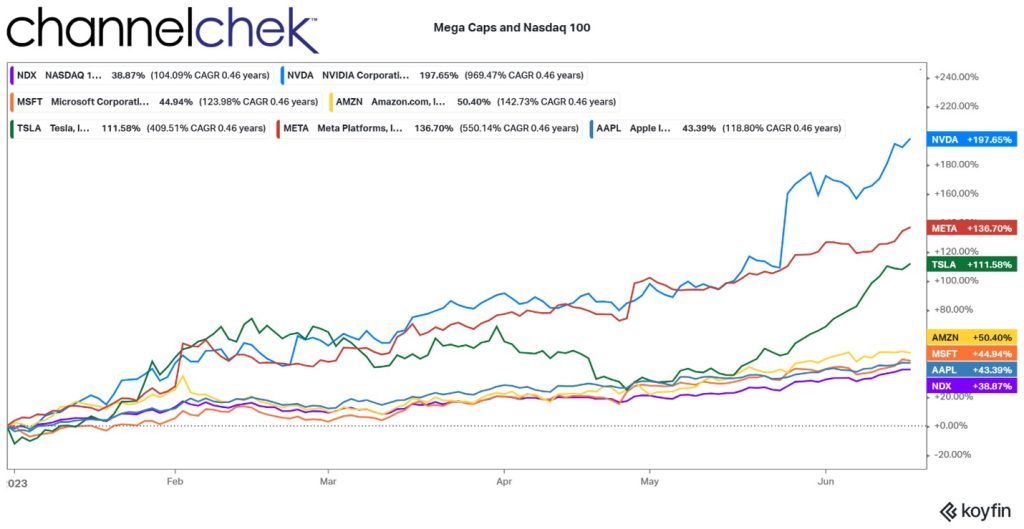
Just look at the numbers, as we near the mid-year mark in 2023.
To date the top 100 stocks in the Nasdaq, heavily weighted with mega-caps and large-cap tech, has increased 38.87%. Using historical returns, most would forecast that these topstocks have much more downside for the next six months than upside. Yet, to stay on the same playing field with index funds, managed money would have to bet against stock market history.
The largest of stocks, as demonstrated below, are pulling a lot of weight. Nvidia (NVDA) is up nearly 200%, Meta (META) returned 137%, Tesla (TSLA) is also up over 100%. A fund manager with flexibility could be torn; on the one hand, afraid to bet against such momentum, on the other, historical probabilities suggest they should.
There’s recent evidence that portfolio managers are looking for value away from the mega-cap stocks that have had the kind of run that in some cases made them twice as expensive. The Russell Small-cap Index, which is part of the June rebalancing is made up of the lowest 2,000 companies in terms of market cap of the broader Russell 3000. June has been a great month for the index so far. The index month-to-date is up 7.75% compared to the Nasdaq 100’s 6.56%. This beats June’s returns for Microsoft (MSFT), Apple (AAPL), and Amazon, among others. The performance, which includes an increase of 3.6% and a 2.8% jump on June 6th indicates investors are rotating away from large-cap stocks that have become historically expensive and into smaller companies that are cheap by historical standards.
The reconstitution also provides investors in the weeks and hours leading up to the rebalance to speculate on how the rebalance will impact individual stocks. Since the preliminary list of changes was announced last month, companies expected to be added to the Russell 1000 Index have gained 4.9%, while the those that moved to a smaller-cap index have grown 11.3%, according to data compiled by Wells Fargo (6/14/23).
Take Away
The Russell Reconstitution elevates the percentage weighting of mega-cap tech stocks that usually trade in rough tandem. Mutual fund managers, and other managed money will have to rethink their weighting of a sector that has already skyrocketed on speculation of future growth.
There has already been signs of a slowdown of interest in mega-tech, compared to a significant increase in attention to small-caps that are cheap by most measures. If the rotation continues, money managers that adhere to tried and true wisdom related to diversification, and metrics like P/E ratios, may wind up the year outperforming the indexed funds they tend to be compared to.
June Quad-Witching is the Friday Before a Three-Day Weekend
Double, triple, and quadruple witching hours are often characterized by increased stock market activity as traders manage expiring positions in the last hours of trading. Friday, June 16th is a quadruple witching which may demonstrate increased activity as it leads into a weekend where markets are closed on Monday.
The term “quadruple witching hour” is used to describe the simultaneous expiration of stock options, stock index futures, and stock index options and single stock futures contracts on the same day. This happens only four times a year on the third Friday just before a quarter end. The same expiration date of all three types of stock derivatives can cause unusual swings as expiring derivative positions can cause increased trading volume and unusual price action in the underlying assets as traders close, roll, or offset expiring derivative positions, particularly in the final hour of trading.
Options Expirations and Futures Contracts
Stock index options, and stock options, are financial instruments that grant the holder the contractual right, but not the obligation, to buy (call option), or sell (put option) a specific quantity of an underlying security or value of an underlying index at a predetermined price (strike price) within a specified period. The final day of the period is known as the option’s expiration date.
Stock index options are options based on the broad market indexes, such as the S&P 500 or the NASDAQ-100. These options give investors exposure to the overall market’s performance rather than individual stocks.
Stock options work similarly, but are based not on index values, but on stock price.
Stock index futures and single stock index futures are contracts that obligate (not optional) traders to buy or sell an index at a specific price or a single stocks at a specific price on a future date.
Expiration Fridays often witness heightened trading activity, as investors attempt to rebalance portfolios and positions. This can cause increased volume and produce significant price fluctuations in the underlying, impacting both individual stocks and the overall market.
Arbitrage Opportunities
Though much of the trading in closing, opening, and offsetting futures and options contracts during witching days is related to the squaring of positions, this increased, and at times, frantic activity can create price inefficiencies, this may provide short-term arbitrage opportunities for those skilled and quick enough.
The arbatrageurs would generate even more volume into the close on quadruple witching days as traders attempt to profit on small price imbalances with large trades that may execute a buy and sell in seconds.
Additional Reasons To Care About Triple Witching
As four types of derivatives, with related underlying indexes and securities expire, traders, especially before a long weekend, will often seek to close out all of their open positions well in advance of the close. This can lead to increased trading volume and intraday swings. Traders with large short positions are particularly exposed to price movements that could be more difficult to manage leading up to expiration. Arbitrageurs try to take advantage of abnormal price action, this actually serves to keep prices more in synch.
The higher trading volumes can be one-sided and potentially result in wider bid-ask spreads and greater slippage. Investors mindful of the potential one-sided liquidity challenges may decide to wait for the smoke to clear the following week, or see if they can benefit by feeding into demand if they can.
Traders who are skilled at interpreting trends, and have great execution, may find quick opportunities to make money during these multiple expiration dates.
Take Away
Quadruple expiration dates, which happen four times a year, can have significant implications for traders and investors. It is best to, at a minimum, know the dates to understand unusual price moves. Understanding the intricacies of option expiration, and multiple witching hours helps investors navigate markets. Advanced traders may even find ways to capitalize on the moves intraday.
June 2023 is unusual in that the quadruple witching hour comes before a three-day weekend; this could push more volatility to earlier periods during the afternoon.


