Investment Articles from the First Half, That are Still Well-Worth Understanding

The Markets During the First Half of 2023 Were Reflective of the People that Trade Them

Financial markets reflect the collective actions and expectations of market participants. This includes rational analysis, irrational emotions, and at times less than rational analysis. The emotions and number crunching get their cue from a daily barrage of information including: profits, policy, panic, prices, politics, purchasing power, the president …and that’s just the Ps. So each day, as Channelchek prepares to deliver research, articles, and pertinent video content to subscriber’s inboxes, we plow through an abundance of information and hope to share what is either not being addressed or covered, or present front page news from the point of view of seasoned investors, not less experienced news writers.

Below are six articles, one from each month this year. Although I have favorites not included here, and these may not have been the most read or shared, they told a slightly expanded story than found on the mainstream take on the subject and are still relevant to some investors.  

As a content provider to this popular investment research platform, my job is not to call the market; it is to present thoughts and knowledge to help investors make decisions on small and microcap stocks along with the overall universe of investment opportunities. The insights below from earlier this year are still quite current, and worth digesting.  

January 2023

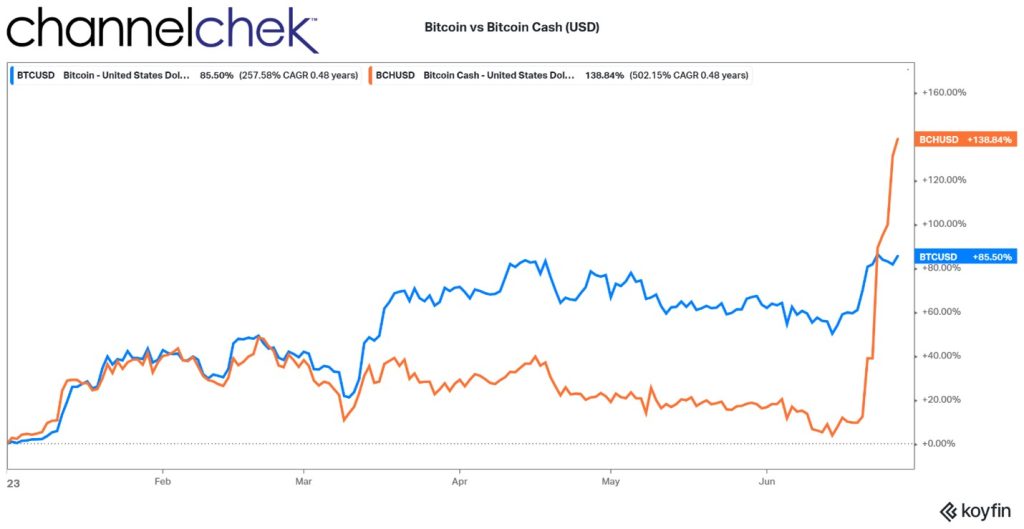
Will Three Bank Regulators Kill Cryptocurrency in 2023?

On the very first business day of 2023, three regulators announced concerns over businesses involved in cryptocurrency citing the lack of oversight, lack of standards, and unknown risk. As the year progressed, the three federal agencies, which do not include work on oversight being done by the SEC or CFTC, are now working hard to regulate what banks can do involving crypto. The SEC for its part has been creating headaches for some of the larger crypto exchanges. Banks are having a particularly difficult time incorporating the asset in their business.

February 2023

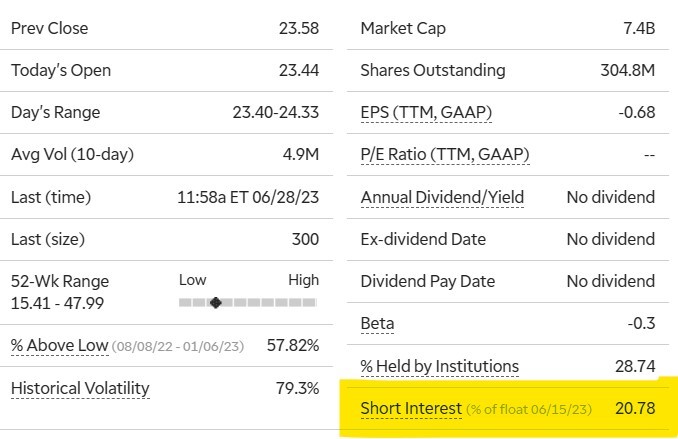
Michael Burry Warns Against the Market Hoping for Economic Weakness

Investment content providers love Michael Burry. The reason is that readership goes through the roof whenever his name is mentioned. Still, if there is nothing to write about the subject, or if it is old news, the writer, blogger, or vlogger is doing investors a disservice.

We’re choosy about when to take one of Burry’s rare tweets and decipher them for readers. But, we always try to be among the first when his fund’s public holdings are reported each quarter on SEC form 13-F. But there are only few times during the year when there is actually worthwhile news. This is because Burry is usually tightlipped. Unless required by a regulator, the successful hedge fund manager is out of the public spotlight, presumably crunching numbers and rebuilding old guitars.

This article is good advice that can be used any time the Fed is trying to reel in inflation.

March 2023

The CFA Institute Makes First Major Change to Program Since Inception

It was 1963 the last time the CFA Institute (Chartered Financial Analyst) made any changes to their prestigious designation. However, the investment world is changing, and the CFA Institute is responding in order to better serve those that benefit from the services of skilled analysts. In 2023 CFA candidates will have more choices, more study material available, and the ability to take credit for their rigorous studies beginning after passing Level I.

Some thoughts on why, eligibility, and the new focus are presented here along with how it should help keep the credential fresh and more useful.  

April 2023

U.S. Money Supply, Here’s Why it’s Critical for Inflation Forecasts

It wasn’t too long ago that the Federal Reserve did not announce its intentions. If a Fed-watcher or market participant wanted to know for certain if the FOMC adjusted monetary policy, the best they could do is see if measures of money supply increased or decreased. Weeks later the FOMC Minutes would be released, and the markets would know for sure what the Fed did at the previous meeting.

When the Fed became more transparent, the market focus on money-supply disappeared. This has now reversed as the stimulative money that had been injected into the economy to prevent undue weakness during the pandemic is now being methodically removed via quantitative tightening (Q.T.). The renewed focus on M2 is to make sure the Fed sticks with its plan. Signs that it may not be impact the amount of money available to chase goods and services, this impacts inflation.

The Fed’s battle to drain the cash put into the system, and do it in a way that doesn’t crash banks, or the overall economy is perilous, is continuing and well worth understanding.

May 2023

Solid Evidence a Recession is Unlikely this Year

Economists and news writers have been negative about the economic outlook, scaring people with the word recession since before the year even began. And while there are some weaknesses, the stimulative money supply is still exceedingly high, jobs are more abundant than workers, and home sales have not reacted as expected when mortgage rates rise from 3% to 7%.

The often-repeated line that the downward slope of the yield curve is a time-tested indicator of an impending recession was the echo chamber talking point that probably didn’t apply to this economy because of a novel Fed policy.

From a textbook position, those saying a negative yield curve indicates a recession got the answer right if they were taking a college quiz. However, those that were saying this inverted yield curve indicates a recession may have flunked. And if you copied off the economist next to you, and they somehow missed that the Fed owned 33% of all U.S. Treasuries outstanding, and because of their policy of yield-curve-control, the yield curve was not market-driven, and therefore not a reliable indicator of anything. What we know is that when the Fed buys one out of every three bonds, it leaves a mark on the area of the curve that they are active.

With higher than expected GDP released last week, most have stopped talking about a recession in 2023. We put out several articles beginning in 2022 explaining why others may have this yield curve indicator wrong, this is addition is most recent.

I highly recommend reviewing this article if your summer backyard barbecues include conversations about economic strength (or weakness).

June 2023

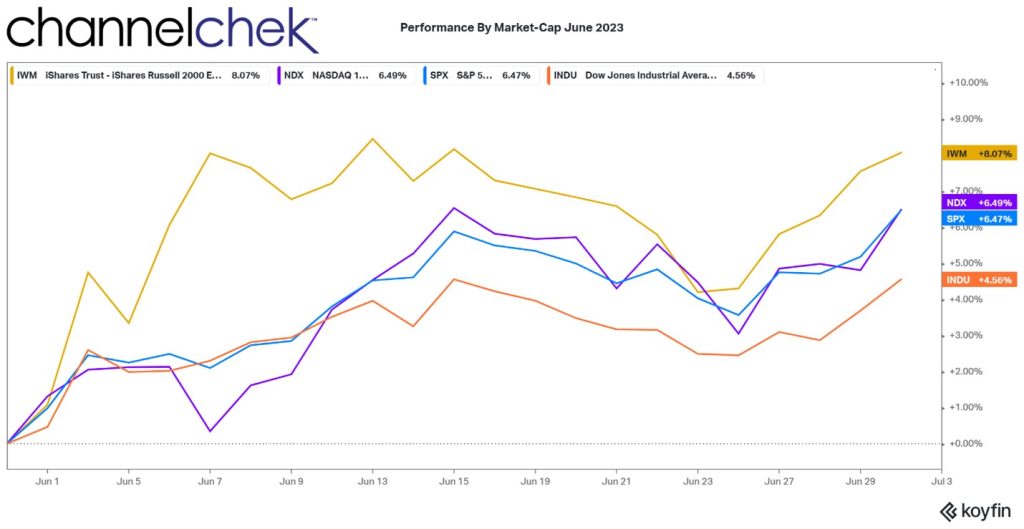
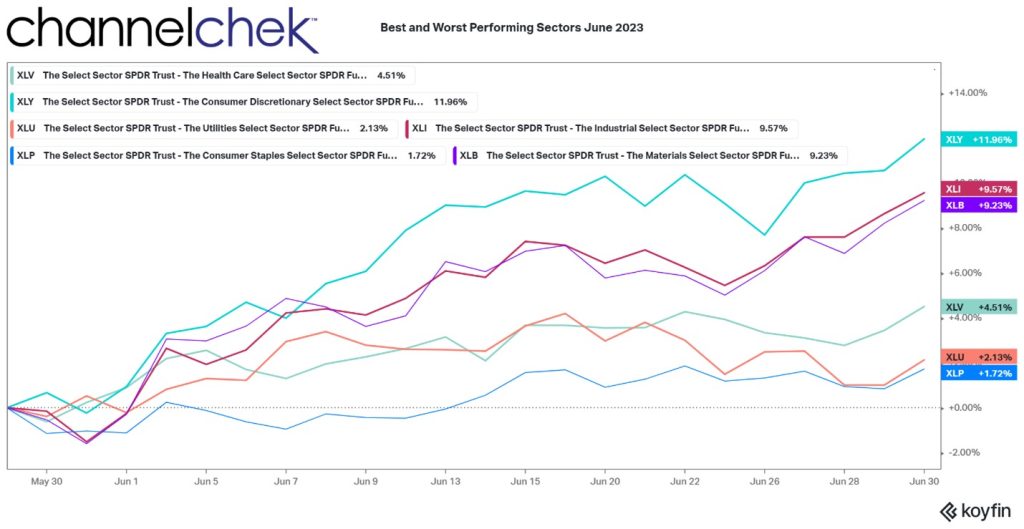
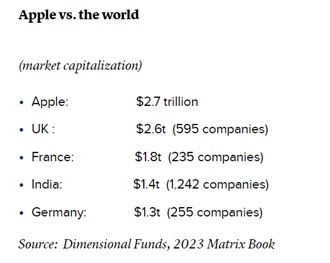
Why Small Cap Stocks Started to Attract Mega Cap Investors

Small Cap stocks had been lagging behind larger companies. Historically they are more volatile, but investors expect to be compensated over time for the additional risk they take. Yet, over a longer than normal period, they still lagged. This seemed to have changed; during the first week in June there were some days that small company returns had a little more giddy-up than they had in recent months or years. On June 6th we published the above article.

Small cap stocks finished the month well ahead of the large caps and even mega-cap companies. This momentum has carried into the second half.

Let’s Start the Second Half of 2023 Together

If you are one of our free subscribers, thank you for trusting us as one of your news and research resources.

If you have not yet signed up, now is a great time to make sure you don’t miss any research, videos, special events, and market insights. Sign up here.

I hope you found these six articles compelling, and if you have not registered for no-cost insights to your inbox each day, here’s your chance to start the second half with a slightly different investment angle.

Paul Hoffman

Managing Editor, Channelchek

What Investors Learned in June That They Can Use in July

Looking Back at the Markets in June and Forward to July

Enthusiasm in the overall stock market was strong in June, the major indices were all up, and every S&P sector closed in positive territory. In fact, there was spectacular performance across market caps as Apple (AAPL) became the first company to reach a $3 trillion market cap, and noteworthy among small caps, Bitcoin mining company Bit Digital (BTBT) was up another 20% and a staggering 685% on the year during the last week in June. The across-the-board positive sentiment came during a month when the market was disappointed by the Federal Reserve’s continued hawkish bias.

Two dark clouds that the markets had hanging over them as they entered June were a possible U.S. default on debt and talk of a recession later this year. A higher debt ceiling law was signed on June 5, and a strong jobs report and higher-than-expected first-quarter GDP have for most, pushed most recession forecasts into 2024 or later. June’s performance may reflect a celebration and feelings of relief from both concerns.

Consumer confidence improved in June to its highest level since January 2022, reflecting a big jump in outlook and expectations. This surprise positive mood is reflected in stock market rotations experienced during June in both market-cap and market sectors.

Image Credit: Koyfin

Look Back

Four broad stock market indices were positive in June. In order, the Russell 2000 Small Caps, Nasdaq 100 Large Caps, the S&P 500 Large Caps, and the Dow Jones Industrials. Small cap stocks are the big winner in June as investors went looking for value. The Russell 2000 rose 8.07%. The smaller stocks may now have more positive impetus that could carry over into July as a report released last week by Goldman Sachs estimates that based on their models, small cap stocks could rise 14% over the next 12 months.  

While small cap stocks had their stars, the Nasdaq maintained a startling pace as big tech retained its appeal despite individual company market caps that have exceeded those of developed countries. The Nasdaq 100 was up 6.49% in June. The S&P 500 nearly matched Nasdaq with a 6.47% return. The Dow 30 Industrials, which have had a difficult few months, returned 4.56% to investors.

Source: Koyfin

Market Sector Lookback

Of the 11 S&P market sectors (SPDRs), even the lowest performer had an impressive one-month return. The chart above reflects the three best-performing sectors and the three worst. The performance indicates that there was a sector rotation away from defensive stocks during June.

Consumer Discretionary had the best return at 11.96%. By definition, these are companies selling products that consumers can cut back on or more easily avoid. The top ten holdings include Starbucks (SBUX), Bookings Holdings (BKNG), and Tesla (TSLA).

What S&P calls the Industrial Select sector finally came to life in June. Its 9.57% return represents almost all of this sector’s performance for the first six months of 2023 (9.73% YTD). Examples of top stocks contained in this index are John Deere (D.E.), General Electric (G.E.), and Union Pacific (UNP).

The third was Materials Select which was negative on the year heading into June. The 9.23% return on the month more than erased the negative 7.67% performance heading into the month.

Each of the top three performers is typically sectors that investors delve into when their economic outlook is more positive.

The three worst-performing sectors also indicate the month was very positive. The Health Care sector was the best of the bottom three at 4.51%. While this did not bring the sector positive on the year, companies like Johnson & Johnson (JNJ), Abbott Labs (ABT), and United Health (UNH), had experienced strong years this decade with growth drivers that have since weakened some.

The second to weakest performer is Utilities Select. Utilities are still negative on the year despite a 2.13% increase in June. Companies like American Electric Power (AEP), Dominion Energy (D), and Consolidated Edison (E.D.) are surrounded by a lot of uncertainty as their costs are driven more than other industries by fuel prices. Additionally, investors in utilities tend to be dividend stock investors. Dividend stocks tend to underperform in a rising interest rate environment as they compete less favorably with bonds.

The worst-performing sector provides further evidence of a rotation during June. Consumer Staples was the second-worst-performing sector at the close of May. While it returned 1.72% in June, the sector, which includes Colgate Palmolive (CL), Walmart (WMT), and Philip Morris (PM), usually gains in popularity when consumer confidence is low, it loses popularity as consumer confidence is high, that’s when, as we saw in June, consumer discretionary stocks get attention.

Looking Forward

The job market is strong, inflation is tapering,  and consumers are more confident. There are even signs that companies that have been waiting for an improved market to go public are considering now a good time for an IPO.

Bitcoin mining stocks and artificial intelligence are still be on fire. The crypto-mining stocks interest is tied to the price of Bitcoin – many of the stocks have actually outperformed the cryptocurrency. Artificial intelligence, as its potential becomes better understood, has inspired many to place bets that this will grow into a technology that is indispensable to many industries. Is the next Apple in this tech segment?

The rotation to small caps and sectors that perform better when the economy improves has a lot of momentum heading into July.

The next FOMC meeting is July 25-26; while market participants already expect further tightening, it has not deterred their positive view on the “risk-on” trade.

Take-Away

The market was jubilant in June. The signing into law of an increased debt ceiling helped kick off a change from the uncertain mood in May.  It unleashed buyers that continued even after it was clear the Federal Reserve was not finished hiking interest rates.

The year 2023 now sits at the halfway point. And within a few months, we will be in a presidential election year. Stocks tend to do well in election years. While the Russia/Ukraine situation is still uncertain, especially in the energy sector, the markets seem to have already priced in negative scenarios and are marching upward confidently.

Paul Hoffman

Managing Editor, Channelchek

The Week Ahead –  FOMC Minutes and Thin Markets Could Mean Fireworks

This Week’s Focus Will be Defining More Precisely What the Fed’s Bias Is

A holiday-shortened week, coupled with the expected lighter trading volume, has the potential to create a situation where markets or individual stocks overreact to news, then stock prices settle back closer to the starting point after a short period. This is a bigger than normal risk on Wednesday, the first regular trading day of the week, as the Federal Reserve releases the FOMC minutes from the  June 13-14 meeting.

Monday 7/03

•             * Abbreviated trading session US markets. NYSE 1 PM close, US bond market 2 PM close.  

•             9:45 AM ET, The final Manufacturing PMI for June is expected to come in at 46.3, unchanged from the mid-month advanced read. This is below 50 and indicates significant contraction.

•             10:00 AM ET, The ISM Manufacturing Index has contracted for the last seven months. June’s consensus is 47.3 which would be a slight increase from May’s 46.9.

•             10:00 AM ET, Construction Spending for May is expected to continue to rise by 0.5 percent. This follows a strong 1.2 percent in April.

Tuesday 7/04

•             * Independence Day USA. Markets and government offices closed.

Wednesday 7/05

•             10:00 AM ET, Factory Orders are expected to rise 0.9 percent in May versus April’s 0.4 percent gain. Factory Orders are a favorite leading indicator of many economists when determining if the activity is likely to pick up or slow.

•             2:00 PM ET, FOMC Minutes from the most recent meeting when the Fed left rates unchanged will be poured over by Fed watchers and market participants to evaluate any bias beyond what is already known.

•             4:00 PM ET,  New York Federal Reserve president John C. Williams is the President will be speaking. Williams serves on the Federal Open Market Committee; his addresses reflect the Fed’s Twelfth District’s perspective on monetary policy.

Thursday 7/06

•             7:30 AM ET, Challenger Job Cut Report was 80,089 in May. The monthly report counts and categorizes announcements of corporate layoffs based on mass layoff data from state labor departments.

•             8:45 AM ET, Lorie Logan is the President of the Dallas Federal Reserve, she will be giving an address pre-market opening.  

•             9:45 AM ET, The PMI Composite Final is expected to confirm advanced reads of the purchasing managers survey.

•             10:00 AM ET, JOLTS, the report on job openings is expected to read 9.9 million for May. The PMI Composite Final is expected to confirm advanced reads of the purchasing managers survey. April’s 10.103 million was much higher than expected and pointed to strong resilience in labor demand.

•             11:00 AM ET, EIA Petroleum Status Report (EIA) provides weekly information on petroleum inventories in the US, whether produced here or abroad. The level of inventories helps determine prices for petroleum products.

Friday 7/07

•             8:30 AM ET, Employment is expected to have risen 213,000 for nonfarm payroll in June versus 339,000 in May, which was much higher than expected. Average hourly earnings in June are expected to rise 0.3 percent for the month with a year-over-year rate of 4.2 percent; these would represent very little change. June’s unemployment rate is expected to hold unchanged at 3.7 percent.

•             11:00 AM ET, EIA Petroleum Status Report (EIA) provides weekly information on petroleum inventories in the US, whether produced here or abroad. The level of inventories helps determine prices for petroleum products.

What Else

This is a popular vacation week among professional traders and investment managers. Any direction that may seem to take shape may not have legs as the month progresses.

Happy Independence Day to the United States; may it have many more.

Paul Hoffman

Managing Editor, Channelchek

Sources

https://www.econoday.com/

Will the AI Revolution Eliminate the Need for Wealth Managers?

Can Investment Advisors and Artificial Intelligence Co-Exist

Are investment advisors going to be replaced by machine learning artificial intelligence?

Over the years, there have been inventions and technological advancements that we’ve been told will make investment advisors obsolete. This includes mutual funds, ETFs, robo-advisors, zero-commission trades, and trading apps that users sometimes play like a video game. Despite these creations designed to help more people successfully manage their finances and invest in the markets, demand for financial advisors has actually grown. Will AI be the technology that kills the profession? We explore this question below.

Increasing Need for Financial Professionals

According to the US Bureau of Labor Statistics (BLS), “Employment of personal financial advisors is projected to grow 15 percent from 2021 to 2031, much faster than the average for all occupations.” Some of the drivers of the increased need include longevity which is expanding the years and needs during retirement, uncertain Social Security, a better appreciation toward investing, and an expected wealth transfer estimated to be as high as $84 trillion to be inherited by younger investors. As birthrates have decreased over the decades in the US, the wealth that will be passed down to younger generations will be shared by fewer siblings, and for many beneficiaries, it may represent a sum far in excess of their current worth.

With more people living into their 90s and beyond, and Social Security being less certain, an understanding of the power of an investment plan, and a lot of newly wealthy young adults to occur over the next two decades, the BLS forecast that the financial advisor profession will grow faster than all other professions, is not surprising.

Will AI Replace Financial Planners?

Being an investment advisor or other financial professional that helps with managing household finances is a service industry. It involves reviewing data, an immense number of options, scenario analysis, projections, and everything that machine learning is expected to excel at within a short time. Does this put the BLS forecast in question and wealth managers at risk of seeing their practice shrink?

For perspective, I reached out, Lucas Noble of Noble Financial Group, LLC (not affiliated with Noble Capital Markets, Inc. or Noble Financial Group, Inc. – creator of Channelchek). Mr. Noble is an Investment Advisor representative (IAR), a Certified Financial Planner (CFP), and holds the designations of Accredited Estate Planner (AEP), and Chartered Financial Consultant (ChFC). Noble believes that AI will change the financial planner’s business, and he has enthusiastically welcomed the technology.

On the business management side of running a successful financial advisory business, Noble says, “New artificial intelligence tools could help with discussions and check-ins so that clients are actually in closer touch with his office, so he becomes aware if they need anything.” He has found that it helps to remind clients of things like if they have a set schedule attached to their plan, he added, “the best plan in the world, if not implemented, leaves you with nothing.” AI as a communications tool could help achieve better results by keeping plans on track.

On the financial management side of his practice, he believes there will never be a replacement for human understanding of a household’s needs. While machine learning may be able to better characterize clients, there is a danger in pigeonholing a person’s financial needs too much, as every single household has different needs, and the dynamics and ongoing need changes, drawn against external economic variations, these nuances are not likely to be accessible to AI.

Additionally, he knows the value of trust to his business. People want to know what is behind the decision-making, and they need to develop a relationship with someone or a team they know is on their side. He knows AI could be a part of decision making and at times trust, but doesn’t expect the role of a human financial planner is going away. Lucas has seen that AI  instead adds a new level of value to the advisor’s services, giving them the power to provide even more insightful and personalized advice to help clients reach their financial goals. Embracing proven technology has only helped him better serve, and better retain clients.

AI Investing for IAs

Will AI ever be able to call the markets? Noble says, it’s “crazy to assume that it is impossible.” In light of the advisors’ role of meeting personally with clients, counseling them on their own finances, and plans, perhaps improving on budgets, and deciding where insurance is a preferred alternative, AI can’t be ignored in the role of a financial planner.

Picking stocks, or forecasting when the market may gain strength or weaken, doesn’t help without the knowledge to apply it to individuals whose situation, expectations, and needs are known to the advisor.

Take Away

Artificial intelligence technology has been finding its way into many professions. Businesses are finding new ways to streamline their work, answer customers’ questions, and even know when best to reach out to clients.

The business of financial planning and wealth management is expected to grow faster than any other profession in the coming decades. Adopting the technology for help in running the communications side of the business, and as new programs are developed, scenario analysis to better gauge possible outcomes of different plans, could make sense to some. But this is not expected to replace one-on-one relationships and the depth of human understanding of a household’s situation.

If you are a financial advisor, or a client of one that has had an experience you’d like to share, write to me by clicking on my name below. I always enjoy reader insight.

Paul Hoffman

Managing Editor, Channelchek

A special Thank you to Lucas J. Noble, CFP®, ChFC®, CASL®, AEP®, Noble Financial Group, Wakefield, MA.

Sources

https://www.bls.gov/ooh/business-and-financial/personal-financial-advisors.htm#:~:text=in%20May%202021.-,Job%20Outlook,on%20average%2C%20over%20the%20decade.

https://money.usnews.com/careers/best-jobs/financial-advisor#:~:text=with%20their%20clients.-,The%20Bureau%20of%20Labor%20Statistics%20projects%2015.4%25%20employment%20growth%20for,50%2C900%20jobs%20should%20open%20up.

https://www.forbes.com/sites/forbesfinancecouncil/2023/03/09/the-great-wealth-transfer-will-radically-change-financial-services/?sh=e7f9e7c53393

https://www.cerulli.com/press-releases/cerulli-anticipates-84-trillion-in-wealth-transfers-through-2045

Melania’s New NFT Collection is Waking Up the NFT Marketplace

“Proclaim Liberty” from Melania Trump’s new NFT releases ($50.00)

NFT Investments Benefit from Increased Activity

Do you remember Beeple? He’s the graphic artist who kicked off the non-fungible token (NFT) frenzy. More important than starting an NFT gold rush, the $69.3 million his piece auctioned for alerted many investors and businesspeople to other uses of tokens and blockchain technology beyond cryptocurrency. While the frenzy has simmered, the blockchain-reliant art form is still finding its place. Melania Trump, who owns an NFT company, released a freedom-themed collection in time for America’s birthday. The Ethereum based tokens will be watched closely, compared in price to previous releases, and may help rejuvenate some lost enthusiasm for NFT art.

Background

Non-fungible tokens are unique digital assets stored on a blockchain. Beyond art, NFTs can represent medical records, shipping records, music, videos, and can be adapted to most transactions that benefit from proof of something occurring. In art, the technology allows creators to monetize their digital creations and provide collectors with a method to own and invest in unique digital assets.

As with most art, value is subjective. As with any investment that is new, wild swings can be expected as a market value will be determined by the few initially involved. And these will include those that are extremely bullish and bid up prices, those that know that new thinly traded markets can be elevated by hype, and those that serve as the opposite of hype, they are openly negative on anything new or different. NFTs are no different – for example, nothing has yet openly sold for as much as Beeple’s piece.

Melania’s Place in the NFT Market

In December 2021, Melania Trump, less than one year out of the White House as First Lady, began her own NFT art provider. The themes have been beauty and patriotism and have been popular among collectors. However, since then, the prices of pieces sold and then resold have fluctuated widely in a market that has lost the world’s attention, and is far from maturity.

The Current NFT Release

Some say Melania Knavs, born in communist Slovenia, has gotten to live “the American Dream,” and can appreciate it more than most. Others say Melania Trump understands how capitalism works and is using it to make a buck off of her famous name. As it relates to NFTs, investors should probably focus most on the truth that Melania has brought attention back to this market and investors in NFTs themselves, or the blockchain technology that supports it, benefit. After all, anytime there is an increase of buyers and sellers in a marketplace, liquidity rises, and prices become more rational.

One week before USA Independence Day on July 4, the former first lady announced she is selling “The 1776 Collection,” a tranche of three thousand digital tokens priced at $50 each. Investors are asked to use their digital wallets or more traditional methods, including a credit card, to purchase digital creations.

Image: On December 16, 2021, @MELANIATRUMP tweeted this announcement.

Previous releases included the “Trump Digital Trading Cards” collection, which featured cartoonish images of the former president in unlikely scenarios, like standing on the moon. Her first edition of her collection generated more than 14,200 ETH ($26.3 million) in trading activity so far in 2023. The second edition has generated about $2.7 million over the same period.

NFT Investor’s Dream

The presence of high profile people are good for the maturation of the NFT market, and Melania Trump’s name certainly has been attached to NFT art. At the release of her third and latest collection, her June 29 announcement proclaimed it gives “collectors the ability to celebrate our nation’s independence while acknowledging America’s Founding Fathers’ vision of life, liberty, and the pursuit of happiness.” The announcement explained that “Each collectible represents an aspect of Americana and was deliberately designed to acknowledge the foundations of American ideals.”

Paul Hoffman

Managing Editor, Channelchek

Exceeding the “Speed Limit” of Semiconductor-Based Transistors

The author’s lab’s ultrafast optical switch in action. Mohammed Hassan, University of Arizona, CC BY-ND

The Digital Future May Rely on Ultrafast Optical Electronics and Computers

If you’ve ever wished for a faster phone, computer or internet connection, you’ve encountered the personal experience of hitting a limit of technology. But there might be help on the way.

Over the past several decades, scientists and engineers have worked to develop faster transistors, the electronic components underlying modern electronic and digital communications technologies. These efforts have been based on a category of materials called semiconductors that have special electrical properties. Silicon is perhaps the best-known example of this type of material.

But about a decade ago, scientific efforts hit the speed limit of semiconductor-based transistors. Researchers simply can’t make electrons move faster through these materials. One way engineers are trying to address the speed limits inherent in moving a current through silicon is to design shorter physical circuits – essentially giving electrons less distance to travel. Increasing the computing power of a chip comes down to increasing the number of transistors. However, even if researchers are able to get transistors to be very small, they won’t be fast enough for the faster processing and data transfer speeds people and businesses will need.

This article was republished with permission from The Conversation, a news site dedicated to sharing ideas from academic experts. It represents the research-based findings and thoughts of Mohammed Hassan, Associate Professor of Physics and Optical Sciences, University of Arizona.

My research group’s work aims to develop faster ways to move data, using ultrafast laser pulses in free space and optical fiber. The laser light travels through optical fiber with almost no loss and with a very low level of noise.

In our most recent study, published in February 2023 in Science Advances, we took a step toward that, demonstrating that it’s possible to use laser-based systems equipped with optical transistors, which depend on photons rather than voltage to move electrons, and to transfer information much more quickly than current systems – and do so more effectively than previously reported optical switches.

Ultrafast Optical Transistors

At their most fundamental level, digital transmissions involve a signal switching on and off to represent ones and zeros. Electronic transistors use voltage to send this signal: When the voltage induces the electrons to flow through the system, they signal a 1; when there are no electrons flowing, that signals a 0. This requires a source to emit the electrons and a receiver to detect them.

Our system of ultrafast optical data transmission is based on light rather than voltage. Our research group is one of many working with optical communication at the transistor level – the building blocks of modern processors – to get around the current limitations with silicon.

Our system controls reflected light to transmit information. When light shines on a piece of glass, most of it passes through, though a little bit might reflect. That is what you experience as glare when driving toward sunlight or looking through a window.

We use two laser beams transmitted from two sources passing through the same piece of glass. One beam is constant, but its transmission through the glass is controlled by the second beam. By using the second beam to shift the properties of the glass from transparent to reflective, we can start and stop the transmission of the constant beam, switching the optical signal from on to off and back again very quickly.

With this method, we can switch the glass properties much more quickly than current systems can send electrons. So we can send many more on and off signals – zeros and ones – in less time.

The author’s research group has developed a way to switch light beams on and off, like those passing through these optical fibers, 1 million billion times a second.

How Fast are We Talking?

Our study took the first step to transmitting data 1 million times faster than if we had used the typical electronics. With electrons, the maximum speed for transmitting data is a nanosecond, one-billionth of a second, which is very fast. But the optical switch we constructed was able to transmit data a million times faster, which took just a few hundred attoseconds.

We were also able to transmit those signals securely so that an attacker who tried to intercept or modify the messages would fail or be detected.

Using a laser beam to carry a signal, and adjusting its signal intensity with glass controlled by another laser beam, means the information can travel not only more quickly but also much greater distances.

For instance, the James Webb Space Telescope recently transmitted stunning images from far out in space. These pictures were transferred as data from the telescope to the base station on Earth at a rate of one “on” or “off” every 35 nanosconds using optical communications.

A laser system like the one we’re developing could speed up the transfer rate a billionfold, allowing faster and clearer exploration of deep space, more quickly revealing the universe’s secrets. And someday computers themselves might run on light.

Signs We May Be Witnessing the End to the Indexed-Fund Stranglehold

Dominance of Indexed Funds May Be Giving Way to a Preference for Diversification

Not many years ago, the most widely followed stock market index was the Dow Jones Industrial Average, or Dow 30 (DJIA). This practice slowly changed and a broader benchmark, the S&P 500, became the new gauge of market moves. Both have the same purpose, to provide a big-picture view of whether stock prices generally are moving up, down, or sideways over a period – and by how much. The DJIA has fallen out of favor as investors grew more sophisticated and came to realize the Dow only tracks 30 stocks. So it was considered not representative of the entire stock market – which includes thousands of different companies. With only 30 stocks impacting its price, it was not disperse enough to be the preferred stock market index. After all, the DJIA’s performance can be significantly influenced by the performance of the 30 stocks, which at times can veer far from indicative of the broad market.

The S&P 500, which is weighted by market capitalization, is beginning to feel the impact of its own loss of diversity. As of June 2023, the top 10 companies in the S&P 500 account for over 25% of the index’s total market capitalization. That is, the weight of 25% of market moves impacting the index comes from just 10 stocks and these can all be considered technology stocks. For portfolios it means that investors who believe the S&P 500 reflects the market, might actually be more accurate if they went back to the index with 30 stocks in a wider array of industries.

I’m not suggesting that we should all start following the Dow. Instead, I am suggesting that there is risk to index investors that are looking to participate in the overall market and are using the S&P 500. Portfolio managers looking to spread risk may want to purposefully add diversity to their holdings.

In contrast to the upper 25%, the lower 25% of the S&P 500 is a diverse group of industries, with no single industry accounting for more than 20% of the weight. This means that the performance of the lower 25% of the S&P 500 is not as dependent on the performance of any single industry. From “stock market 101,” we know that the risk (not necessarily return) is greater in the top 25%. Focusing on risk-adjusted return is how most managing their portfolio do well over time.

Over the past several years, including last year’s down draft, tech has, on average, been the leader. Carrying companies that make up the top 25% in large cap indexes, MSFT, AAPL, META, GOOGL, etc. have been additive to performance. This has helped, as not only has it lifted large-cap indexed funds returns, but it sent more money into these indexed funds, which served to further increase the perfomranc of the funds including ETFs.

Ongoing, above-average growth in one sector, even tech, or a market cap segment (megacap), is as unsustainable as a Ponzi scheme. So while activity is sustaining movement into these stocks, performance is satisfying. But investor money is finite and investor behavior is fickle. So the above average performance must at some point should give way to these stocks being a drag on performance.

Apple’s market capitalization exceeds that of all the publicly traded companies on these stock markets; where would growth in share price come from?

Are We Seeing the End?

According to data from Morningstar Direct through June 20, actively managed stock mutual funds and exchange-traded funds beat their passive peers across categories, except in the large blend category, which is less heavily weighted to one sector. The report data shows that as we reach mid-year 2023, small- and large-cap stock pickers had a strong first half of 2023. As reported by Barron’s, “The next six months may prove favorable for active managers if dispersion—the spread of returns in an index—or market breadth—which reflects how many stocks participate in a rally—increase, allowing other sectors and stocks to catch up to the mega-caps.” Stockpickers are beginning to win, as a wider dispersion of selected investments, on average, beat the “just buy the index” investment style.

Active managers’ improving performance versus index funds is building on 2022, which was the best year for active U.S. equity fund managers since 2009. Anu Ganti, senior director of index investment strategy at S&P Dow Jones Indices, said while S&P doesn’t yet have midyear performance data, one potential tailwind for active managers this year was high dispersion. “If you’re a stockpicker, and if you have skill, and if you make the call right, there’s greater potential to add value from stock selection when dispersion is higher,” she said. “What we saw in May is that the S&P 500 stock level dispersion rose to its highest level since March 2020.” 

The Investment Advisors Association (IAA) Active Managers Council advocates for a more balanced narrative on passive versus active portfolio management among advisors. “Active and passive management are critical and play different roles in a broader portfolio,” said Apurva Schwartz, a member of the Active Managers Council’s research task force and a portfolio specialist at Harding Loevner. “Active management allows investors to navigate complexity, customize portfolios, manage risks, capitalize on specific skills, or try to profit from market inefficiencies. Passive management can help reduce costs and that’s important, especially in efficient market segments.” Over the years, there has been an overriding emphasis on passive funds among advisors, the Council seeks, through statistics and education, to provide a more balanced view.

Take Away

Over any period of time one sector or another may outperform. The one style of management that has provided solid performance is a diversified portfolio with an eye on risk-adjusted return. This style has faded as investors placed money in a large-cap indexed fund, believing the underlying assets were well diversified and had a positive risk/reward potential.

So far in 2023, large-cap indexed funds are underperforming managed funds. This outcome follows on top of late last year when managed money’s comparative performance improved. The underperformance is even highere when one nets out the higher fees associated with managed money.

Obviously there is no way to track non-professional, self-directed stock picker’s performance the way Morningstar ranks funds by category. But it is not a stretch to expect that a carefully selected portfolio with the help of  high-quality research and basic diversification across market-cap and industry characteristics, could do even better than just paying fees and parking assets in a fund.

Paul Hoffman

Managing Editor, Channelchek

Source

https://www.barrons.com/articles/active-managers-outperform-passive-index-funds-23723641?mod=hp_LEAD_1

https://www.cnbc.com/2023/05/10/apple-vs-the-world-apples-bigger-than-entire-overseas-stock-markets-.html

https://investmentadviser.org/active-managers-council/

Goldman’s Model Shows 14% Growth In Small-Caps Coming

On the One Hand, the Russell 2000 Should Outperform, on the Other Hand…

A Goldman Sachs report released Wednesday, June 28 projects that the Russell 2000 should gain 14% over the next 12 months and could outperform the S&P 500 in the coming year. The economic headwinds that companies represented in the index would have to overcome were discussed in the report. Each should come as no surprise. The forecast is based on Goldman’s research using expected economic growth and current valuations.

Based on US economic growth and a model built on initial valuations, the small-cap index should gain 14% over the next 12 months, according to Goldman. This looks even more favorable compared to the reports projection that  the S&P 500 is expected to climb 9% over the same period.

The research note said this would mark a position change as the S&P 500 has been outperforming the Russell 2000 Small Cap index.

Goldman outlined three near-term macro headwinds facing the Russell 2000 Index:

Rising Interest Rates

The index is more sensitive to monetary tightening because listed companies tend to have a higher debt burden than the S&P 500. As interest rates continue to rise, the cost of servicing debt could gradually put pressure on small caps, as about one-third of Russell 2000’s debt is floating rate.

This could become a complication through the remainder of the year, as the Federal Reserve has signaled the possibility of two more hikes. For its part, Goldman expects another hike in July, and predicts a cut for 2024.

Economic Development

Compared to the S&P 500, the Russell 2000 is more sensitive to US economic performance, wrote Goldman. Even if a recession has been avoided, small-cap stocks struggle to outperform in the later stages of the business cycle as investors turn to companies with larger balance sheets.

The note recognized another possible bump in the road suggesting it appears that the market has already priced in the GDP forecasts, and growth looks unlikely to pick up any further as long as the Fed continues to tighten to tame inflation.

Sector Composition

Goldman said the Russell 2000’s high exposure to cyclical stocks, regional banks, real estate and biotech makes it more vulnerable to slowing growth, rising rates and the re-emergence of financial stability fears.

This means there could be further cuts in earnings forecasts. The note recognized that while earnings revisions among S&P 500 companies have mostly been flat, Russell 2000 revisions are continuing.

Take Away

Goldman’s basic analysis shows the propensity for the small cap sector to begin to outperform in a big way. As is the case with market forecasters, the story starts out “on the one hand this could happen,” and then transitions with, “but on the other hand…”. It is standard to look out into the future and see where a sector could be headed, but also recognize where there may be trouble along the way.

The report did not lay out a scenario where the report may have underestimated where the Russell Small Cap index may be in 12 months, but with all the less-than-knowns surrounding this year, and an election year, it is safe to presume that the analyst could also have undershot where actual performance will be 12 months into the future.

Paul Hoffman

Managing Editor, Channelchek

Source

https://www.cnbc.com/2023/06/28/goldman-sees-small-cap-stocks-up-14percent-in-year-ahead-etfs-to-capture-that-return.html

What Can You Learn From the Short Interest in a Stock?

Using Short Interest as an Evaluation Tool

Not everyone involved in the stock market are buying stocks in expectation of them rising. Some market participants are selling, in the expectation that the price will fall. This selling is one of many factors impacting a stocks current price – and could influence future moves. Understanding short interest in a stock that you are active with may provide trading ideas or send warning signs.  Below we define short interest, its impact on stock prices, where to look to find the short interest on a particular company, how the information is used, and of course, risks.

What Short Interest Is

Short interest refers to the total number of shares of a particular stock that have been sold short by investors. In simple terms, when an investor “shorts” a stock, they borrow shares from a broker and sell the borrowed shares in the stock market. If all goes well, they buy the shares back in the future, then return them to the broker along with the interest cost (rebate rate) of the borrowed amount.  

Short interest is expressed as a percentage or a number, indicating the total shorted shares relative to the stock’s total float or outstanding shares.

What it May Do to the Stock Price

There is more than one possible meaning of a stock having high short interest. One is that the high percentage of short stock outstanding could mean that there is a large number of investors betting against the stock’s performance. This suggests a bearish sentiment and potential bearishness regarding the stock’s future price moves. If many market players continue to remain bearish, the high or escalating short interest can put downward pressure on the stock’s price.

Conversely, a low short interest might suggest a positive sentiment among investors or confidence in the stock’s future performance. It shows the stock has limited potential for a short squeeze, where short sellers are forced to cover positions and the buying causes the price to rise.

How to know the Short Interest of a Stock

Investors can find short-interest information through many sources, online brokerage platforms, financial news websites, and some stock market research portals. Notable financial websites often provide this data alongside other relevant stock information. Additionally, the U.S. Securities and Exchange Commission (SEC) requires institutional investors to disclose their short positions in certain cases, making this information publicly available.

Example of Short Interest Reported on a Popular Brokerage Platform

The short interest of GameStop (GME) on this day was 20.78% of outstanding float (Source: TD Ameritrade)

Trading With Short Interest Information

Knowing if the short-interest in a company is trending higher, lower, or is stagnant is more helpful than a snapshot of one day’s percentage.

The short interest data can be traded on in a few ways. High short interest can serve as a contrarian indicator. If an investor believes the company has good prospects and it has a high short interest, a price-moving short squeeze could occur if positive news unfolds or strong financial performance triggers buying. This scenario can push short sellers, that are perhaps faced with margin calls, to cover their positions rapidly, resulting in a sharp upward movement in price.

The use as a gauge in market sentiment toward the company, and which way it is trending, can allow you to understand investor behavior over a period of time toward the stocks. Combine this with other fundamental and technical analysis, and short interest data can aid in improving your probability of either a successful trade or successfully avoiding a potential problem.

Short Interest Not Definitive

While short interest can provide valuable insights, it is crucial to understand the risks involved. Short interest data alone is rarely enough to be the sole basis for an investment decision. It is important to conduct or gather comprehensive research and analysis of the stock’s fundamentals, industry trends, and market conditions. Evaluating short interest comes after higher level filtering of a company’s prospects.

Remember, short interest size and trend might not always accurately reflect the actual market sentiment. Market dynamics can change rapidly, and short sellers might cover their positions quickly, resulting in a shift in the stock’s performance. Therefore, investors should consider short-interest data as just one piece of the puzzle and not solely rely on it for investment decisions.

Take Away

Short-interest statistics hold a role in providing insights into market sentiment and potential investment probabilities. Investors can find short-interest information through various sources, enabling them to assess market sentiment and potential short squeezes. However, it is best to use short-interest data in conjunction with comprehensive research and analysis, as it should not be the sole basis for investment decisions. More informed investment choices, it stands to reason, lead to a higher likelihood of success or avoiding failure. By understanding short interest and its implications, investors can enhance their understanding of either a stock, or even the market in the aggregate.

Paul Hoffman

Managing Editor, Channelchek

IPO Activity Should Pick Up According to Analysts

The Current Environment for IPOs is Best in Over 15 Months

Does the elevated reading of the Consumer Confidence report, along with the extended period of low market volatility, and belief the Federal Reserve is near the end of the tightening cycle, set the climate for more companies going public? Goldman Sachs Research just released readings of its IPO Issuance Barometer. This measures the environment for initial public offerings (IPOs) using many different metrics. There is only one out of more than a dozen factors which does not support the expectation that the IPO climate is improving for companies.

As stock market prices stabilize and corporate executives grow more confident, the economic conditions in the United States are becoming more favorable for IPOs according to Goldman Sachs Research.

The GS IPO Issuance Barometer has risen to 93, a level consistent with steady IPO activity. After hitting a low point of 7 in September 2022, the Issuance Barometer is now at its highest level since March 2022. A reading of 100 represents the historical average number of IPOs realized in a given month.

The measure takes into account several factors including the S&P 500 drawdown (the difference between the index’s current value and its 52-week high), CEO confidence levels, the ISM Manufacturing Index, the six-month change in two-year Treasury note yields, and the S&P 500’s trailing enterprise value/sales ratio.

The most impactful contributor behind the improvement in the IPO Barometer has been the stabilization of stock market prices. Chief U.S. Equity Strategist at GS Research, David Kostin notes in the report that the S&P 500, which represents U.S. stocks, has remained relatively stable due to indications of resilient economic growth and the expected end of interest rate hikes by the Federal Reserve. Kostin also highlights that the drawdown in the S&P 500 has been the most significant factor influencing IPO activity. The largest decline from peak to trough this year was 8%, compared to an average of 13% since 1928. In the second quarter, the maximum drawdown has been only 3%. Additionally, market volatility has decreased, as indicated by the VIX, which measures the implied volatility of the S&P 500, dropping below 15, its lowest level since before the pandemic.

Although the S&P 500 has reached a new 52-week high, it is still 10% below its all-time high in January 2022.

The other components in Goldman’s IPO gauge that have also made large contributions to its current reading include improvements in CEO confidence, despite the fact that the median professional forecaster gives a 65% probability of a recession in the next 12 months. Short-term Treasury yields seem to have reached their peak, suggesting that the Federal Reserve’s tightening cycle is nearing its end. Also positive for companies deciding if now is a good time to go public is that stock valuation multiples remain high compared to historical levels. The only variable in the barometer that has not improved since September 2022 is the ISM Manufacturing Index.

Although the positive macroeconomic conditions have yet to translate into increased IPO activity, follow-on stock offerings, which occur after a company has gone public, have shown greater resilience. This year, there have been eight U.S. IPOs exceeding $25 million in size, excluding special purpose acquisition companies (SPACs) and spin-offs. These deals have raised a total of $2.4 billion in gross proceeds, compared to $3.8 billion for the entirety of 2022.

Forecasts from Goldman Sachs’ economists indicate a 25% chance of a recession in the next 12 months, but they suggest that the environment for IPOs could further improve in the second half of the year. Additionally, analysts at Goldman Sachs Research have recently increased their year-end price target for the S&P 500 to 4500, representing approximately a 2.5% increase from the current level.

If the U.S. economy experiences a “soft landing” characterized by stable equity prices and interest rates, modestly improving CEO confidence, an uptick in the ISM Manufacturing Index, and flat valuation multiples, the IPO Issuance Barometer could reach 119 (compared to 93 as of May 31). This would indicate an even more supportive environment for IPO activity according the research.

What Else?

After having an empty IPO calendar last week, six deals are scheduled this week.  Four of them exceed $100 million. According to Renaissance Capital, a provider of IPO ETFs, there have been 46 U.S. deals so far in 2023. This is a 21% increase over the same period last year, and 89 deals have been filed which is a 16% increase.

Also likely to get the attention of management teams sitting on the fence determining if the timing is right, are returns. According to Renaissance, the ETF ticker symbol IPO, which invests in initial offerings, is up 26% so far this year. The S&P 500 is up only 13%.

Paul S. Hoffman

Managing Editor, Channelchek

Sources

https://www.goldmansachs.com/intelligence/pages/the-economic-backdrop-for-ipos-in-the-us-is-improving.html

https://www.marketwatch.com/story/consumer-confidence-jumps-to-17-month-high-as-inflation-slows-americans-more-optimistic-on-economy-b698f34b?mod=home-page

https://www.renaissancecapital.com/

Bitcoin Versus Bitcoin Cash

Is Bitcoin Cash More Functional as a Currency than Bitcoin?

What cryptocurrency is performing better this year than Bitcoin?  

The other Bitcoin, that’s what.

Recent headlines related to BlackRock’s application for a Bitcoin ETF, followed by Citadel, Schwab, and Fidelity’s plans to create a joint crypto exchange, further legitimized the digital asset class at a time when it seemed under fire from the SEC. The combined news of such big players caused an epic rally in BTC. But it also put BCH (the lesser-known Bitcoin “step-child”) on the radar of crypto investors. Bitcoin Cash (BCH) experienced price gains far greater than BTC.

About Bitcoin Cash

Bitcoin Cash sprang to life in 2017 as the Bitcoin blockchain developers were torn between two directions. The divide was resolved with a split in order to address the disagreement. At issue was the scalability and transaction capacity of Bitcoin “classic”. There were two different schools of thought, the big blockers and the small blockers, each with different solutions. The big blockers felt strongly that larger blocks of transactions were best, in August 2017, a separate ledger for Bitcoin Cash was created, it has its own development team and uses big block design.

The split is often referred to as the Bitcoin Cash fork, it resulted in two separate blockchains, Bitcoin (BTC) and Bitcoin Cash (BCH). The larger block size of BCH allows for more transactions per second.

Recent plans to include Bitcoin Cash on a new platform, owned by big Wall Street firms has ushered in a shift in market perception of the “step-child” cryptocurrency. Despite its being born out of dispute, Bitcoin Cash’s recent performance suggests that it is gaining traction in the eyes of investors.

The ticker symbol is “BCH”. However, some exchanges use the ticker symbol “BCH.X” to distinguish between Bitcoin Cash and other cryptocurrencies with the BCH ticker symbol, similar to “BTC” and “BTC.X” for Bitcoin.

Source: Koyfin

Performance Drivers of BCH

Bitcoin Cash is up 138% so far in 2023, with much of that gain coming since the BlackRock SEC filing for a spot ETF, and the Citadel/Schwab/Fidelity exchange announcement. The exchange, called EDX Markets, backed by financial giants, is not registered with the SEC but carries significant weight due to its powerful partners. The platform lists only four cryptocurrencies: Bitcoin, Ether, Litecoin, and Bitcoin Cash.

This exclusive list has been interpreted by the market as a vote of confidence or an ordaining of sorts of those digital assets that will endure. This confidence has become even more important as the SEC has intensified its scrutiny of other blockchain projects.

BlackRock‘s application to the SEC isn’t the only one. It apparently has set off a wave of Bitcoin spot ETF applications. Bitcoin ETFs will allow greater participation in the asset class. Thus the sudden bullish sentiment across cryptocurrencies

Key Differences

Block size: Bitcoin Cash has a block size of 32 MB, while Bitcoin’s block size is 1 MB. This means that Bitcoin Cash can process more transactions per second than Bitcoin.

Development team: Bitcoin Cash is developed by a different team than Bitcoin. The Bitcoin Cash team is focused on increasing the scalability of the blockchain and making it more user-friendly.

Roadmap: Bitcoin Cash has a different roadmap than Bitcoin. The Bitcoin Cash roadmap includes plans to implement features such as Schnorr signatures and Segregated Witness.

Overall, Bitcoin Cash is a different cryptocurrency than Bitcoin. It has a larger block size, a different development team, and a different roadmap. Whether or not Bitcoin Cash is a better investment than Bitcoin is a matter of opinion and what it is to be used for.

Paul Hoffman

Managing Editor, Channelchek

Sources

https://www.bloomberg.com/news/articles/2023-06-26/bitcoin-offshoot-has-more-than-doubled-over-the-last-week

https://bitcoincash.org/

Traders that Find They No Longer Can Monitor the Markets All Day, Might Try This

Should You Use Stop-Limit Orders?

Would you have better results if you used stop-limit orders in your stock market transactions?

Retail traders are finding there are fewer hours where they can watch stock prices. If you aren’t always monitoring your portfolio, but you have predefined entry and exit scenarios, and you aren’t yet using this order type, you may want to consider it. Novice to advanced investors enter potential trades this way for a number of reasons including to automate trading, locking in profits, and minimizing losses.

Stop-Limit Order Characteristics

 Stop orders become automatically triggered as a live order once a set price has been reached. It is then a market order and is expected to be filled at the current market price. The stop order is filled in its entirety, even if that means there are different prices for various pieces of the order.

Limit orders are orders that are set at a target price. The order is only executed when the stock hits the limit price or at a price that is considered even more preferred than the account holder’s limit price. If price movements cause the price to move against the initial limit price, even after it receives a partial fill, the order will stop executing.

By combining the two orders, stop orders and limit orders, the investor doesn’t place as much control in the market, instead they retain some level of precision to help follow their plan.

Stop-Limit Order Usage

The primary reason a trader will enter a stop-limit order is to have precise control over when the order should be sent out to be filled. A possible downside with all limit orders is that the trade may never get executed if the stock does not reach the stop price during the specified time period.

A stop-limit order requires the setting of two price points, both the stop price and the limit price. This makes sense for those that don’t wish to get filled in a volatile market at a price in the opposite direction of the stop. The trader first sets a stop price, which is the price they want the trade to be triggered. Then, the limit price they want to execute at is set. This price is used to limit the maximum price they will pay or the minimum price they will receive if the trade is executed.

A time frame must also be set during which the stop-limit order is considered executable.

The stop-limit order will be executed at a specified price, or better after a given stop price has been reached. Once the stop price is reached, the stop-limit order becomes a limit order to buy or sell at the limit price or better. This type of order is an available option with nearly every online broker.

Downside

It’s important to note that stop-limit orders do not guarantee that your trade will be executed. If the price of the security drops quickly or there is a gap in trading, the order may not be filled at the desired limit price or at all. This may result in missed opportunities for profit should the appropriate prices not be targeted.

Opportunity cost can be another downside. There is no guarantee that the stock will ever reach the price of execution. In the meantime, you may not be acting on other opportunities as you wait to see if the market will go your way.

And, what does happen from time to time, if the price gaps or moves quickly, the order may not be executed at all. This can be especially problematic in fast-moving markets where prices are volatile.

There are retail and professional traders that know about stop-limit orders, would benefit, yet get lazy, or figure they are watching it trade by trade so they’ll just pull the trigger when need be. This leaves open the chance they may not execute their strategy.  

Upside

With a stop-limit order, you control the price at which you enter or exit a position. This means that you can set a limit price that is higher or lower than the stop price, depending on whether you are buying or selling. This gives investors greater control over the execution price and allows the order to go in before the stock reaches it, which makes it more likely their order will be closer to the front of the line.

You need not watch it. The orders will automatically be sent when the stop price is reached. This means that you don’t have to monitor the market constantly and can let the order execute on its own. This is useful for more passive investors.

More sophisticated strategies can also benefit. Stop-limit orders can be used in a variety of trading strategies, including day trading, swing trading, and position trading. They can be used to enter or exit a trade, and they can be used for both long and short positions. This flexibility makes stop-limit orders a versatile tool for traders regardless of the style of trading that investor wants to adopt.

Take Away

Many self-directed investors found they had ample time to monitor their trade orders during the Covid lockdowns and they now are trying to continue to be active in the markets. The characteristics of the stop-limit order may help them stay active.

Paul Hoffman

Managing Editor, Channelchek

Could Bidenomics Better Build Your Portfolio?

Image: WH.goc

Should You Invest Alongside Washington?

The White House, on Monday, June 26, launched an effort to refresh and even rebrand the administration’s economic policies. “Bidenomics” is the latest name given to the White House initiatives to invest in the country’s future. The unveiling of the latest spending plans includes $42.5 billion that will be spread to benefit all 50 states.

While the largest details of what Bidenomics is expected to entail will be presented in Chicago on Wednesday, some of the plans were unveiled on Monday. Spokespeople, including President Biden and Vice President Harris, laid out an “internet for all” plan in a public address.

The plan is to spend, on average, $750 million in each state in a bidding process for high-speed internet projects where there is none.

The overall thinking is that internet availability is viewed as a utility, much like the electrification of all communities.  

President Biden indicated Made in America would be integral to the plan. Pointing out thousands of miles of fiber optic cable will be built and laid as part of the project.

Other investment areas that may see added demand is commodities such as copper. The metal is a key element in cables, routers, and switches. As a result, the demand for copper could be expected increase as more and more people connect to the internet.

Fiber optic cables were specifically mentioned in the announcement; manufacturers of not just the cable, but connections, and companies that install the cable could potentially benefit from the $42.5 billion being spread, for coast-to-coast high-speed internet.

While the project is to be completed over the next six years, for each new household or business that gains internet access along the way, a potential new customer for many types of businesses goes online. Beneficiaries could include telecommunications, media, education, online retail, and of course big tech. As the internet has more steady users, these industries will all see increased demand for their services.

Take Away

Investing in companies that benefit from changes in government policies or spending is a common strategy that has helped many portfolios.

A big announcement on what to expect from the new Bidenomics was made on June 26; the country is promised an even greater announcement on June 28. Investors should note, the government does not build out these projects themselves; it engages private companies. At times the US government quickly becomes a large customer of these companies’, adding stability of revenue and significant profit to bottom lines. The President promised a Made in America approach to the contract process.

Paul Hoffman

Managing Editor, Channelchek