The Week Ahead – FOMC Minutes, January Effect, Fed Focus

Investors Watching for a Bounce in January

Have you become accustomed to a four-day workweek? Fortunately, we all will be slowly weened off of four days on and three days off. Next week (beginning January 8) is a full five-day trading week; then, we get another three-day weekend for MLK Jr. Day (January 16). This is followed by four weeks until President’s Day, which is a national holiday. So we should all acclimate to reality without shocking the system too much.

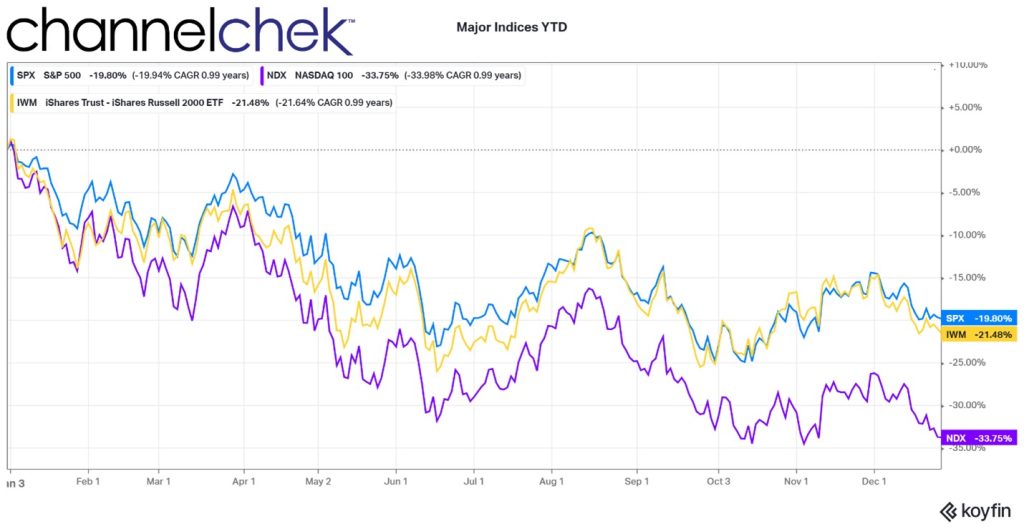
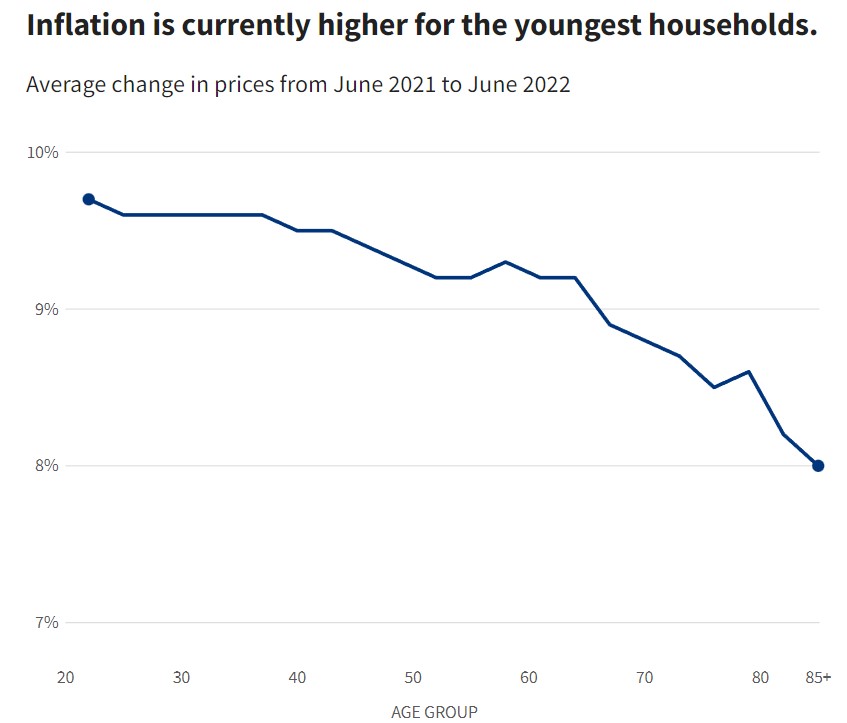
Stocks are far cheaper than they were at the start of last year. The current P/E ratio of the S&P 500 is 18.59. A year ago, that stat stood at 29.33. The last time a year ended with P/Es this low was December 2018.

A popular new year stock market axiom is the January Effect. This suggests there is a tendency for stock prices to rise in the first month of the year following a year-end sell-off. With some light number crunching, it would seem there has actually been a slight upward bias in January, but it is barely higher than that of a coin toss. Market conditions and fundamentals are probably a better focus for traders and investors. On Wednesday, the FOMC minutes for the December FOMC will be released. This may have more impact on the market’s tone to begin the new year than any market axiom.

Monday 1/2

  • Markets and Government Offices closed.
  • The Kuna is out as Croatia’s currency, and the Euro is in. Croatia, which has been an EU member since 2013, becomes part of the eurozone to start 2023. The integration provides open borders within the Schengen visa-free zone and the adoption of the Euro as its national currency.

Tuesday 1/3

  • Treasuries that would have settled on the 31st, settle on this first business day since month end.
  • 9:45 AM, PMI Manufacturing Index for December is expected to come in unchanged from the mid-month report at 46.2. This reading would indicate a contraction in manufacturing.
  • 10:00 AM, Construction Spending is expected to report another weak number. After slipping 0.3 percent in October, construction spending in November is expected to fall 0.4 percent as residential building remains weak.

Wednesday 1/4

  • 10:00 AM, the JOLTS report, an indicator of job openings,  has shown declines since August. It is expected to show a reduction again to 10.1 million in November versus 10.3 million in October.
  • 10:00 AM, the ISM Manufacturing Index is likely to confirm slowing in the sector. After gradually decelerating through the year and then entering a sub-50 contraction in November at 49.0, the ISM manufacturing index for December is expected to print at 48.0, and show a worsening decline.
  • 2:00 PM, Federal Open Market Committee minutes for December. We know how this story ended; they pushed overnight rates up by 0.50%. But, the details of the issues, debates, and how much consensus there was among FOMC members three weeks later lends insight into whether the hawkish stance is fading or likely to increase. The minutes are a possible market mood changer as investors and fed watchers measure each word. The minutes will include the complete economic analysis compiled by Fed officials and opinions at odds with the consensus.

Thursday 1/5

  • 7:30 AM, The Challenger Job-Cut Report is not widely followed as it includes much of the same measures as the weekly Jobless Claims. It counts and categorizes announcements of corporate layoffs based on mass layoff data from state departments of labor. Unlike most economic data, this series is not adjusted for seasonal variations; holiday layoffs could create big changes in the reading. The prior level for November was 76.84.
  • 8:30 AM, Jobless Claims for the week ended December 31st are expected to creep up to 228,000 versus 225,000 the prior week. Any large variation from this expectation could be market moving as the fed closely watches the employment situation.
  • 9:20 AM, the President of the Atlanta Fed, Raphael Bostic, will be speaking. Any time a voting member of the FOMC is speaking publicly, there is the possibility of insight into how that member may have recently changed their leaning on policy. Atlanta Fed events are often broadcast live on this YouTube channel.
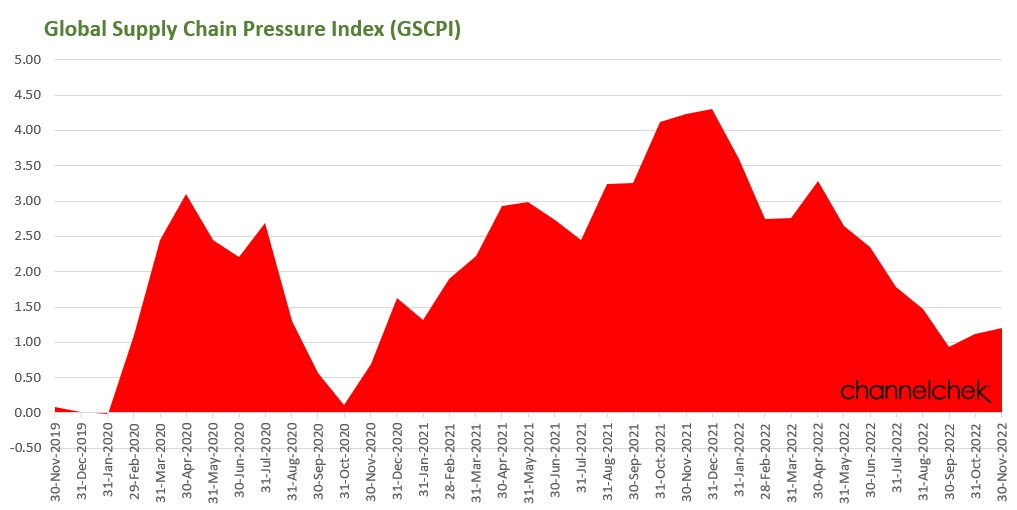
  • 4:30 PM, Fed’s Balance Sheet. This report has, in recent months, garnered more attention. This is because the weekly report of the Fed’s balance sheet provides details as to whether the pace of reductions ($95 billion monthly) is being adhered to. This represents the other tightening (QT) outlined in the current monetary policy. They are securities (treasuries and mortgaged-backed securities) that are maturing off the Fed’s balance sheet and not being replaced. This real money comes out of the economy and represents fewer dollars to hold longer-term interest rates down.

Friday 1/6

  • 8:30 AM, the Employment Situation is a very closely watched economic indicator. It provides measures that both include and exclude government workers. The expected 200,000 rise for nonfarm payroll growth in December is well below the 263,000 reported in November. For each of the last seven months, this report has exceeded the consensus of economists’ projections.
  • 10:00 AM, Factory Orders are a true leading indicator. They are expected to have fallen  0.6% in November.
  • 11:15 AM and 3:30 PM, the President of the Atlanta Fed, Raphael Bostic, will be speaking. Any time a voting member of the FOMC is speaking publicly, there is the possibility of insight into how that member may have changed their leaning on policy. Atlanta Fed events are often broadcast live on this YouTube channel.
  • 12:15 PM, the President of the Richmond Fed, Thomas Barkin, will be speaking. Any time a voting member of the FOMC is speaking publicly, there is the possibility of insight into how that member may have changed their leaning on policy.

What Else

We all have to grow accustomed to writing and typing “2023” this week. The residents of Croatia have a larger challenge, they have to convert all of their payments and transactions into euros.

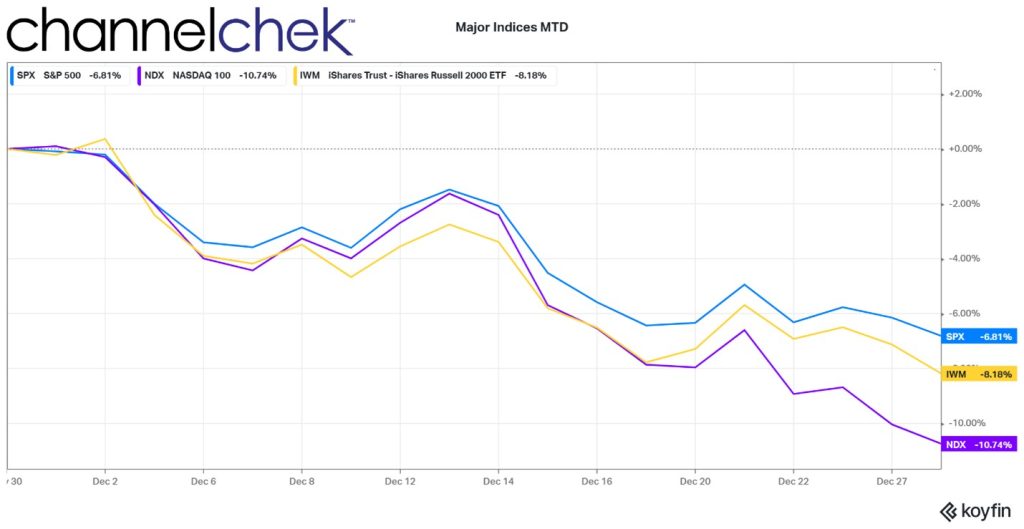
The first half of the year will likely be a test of Fed Chair Jay Powell as all attention is being paid to whether monetary policy can be navigated in a way that provides for the Fed mandate of low inflation while at the same time maintaining an acceptable level of unemployment. Full employment is the Fed’s other mandate. Stock market performance usually hinges on how well the market thinks the Fed is navigating to calmer waters. December’s price action suggests room for improvement.

Paul Hoffman

Managing Editor, Channelchek

Most Interesting Articles on Channelchek in 2022 (Editor’s Choice)

Image Credit: PSH

 The Year 2022 Brought Many Twists and Turns to Share with Readers – the Editor Picks His Favs

All markets are interconnected. In fact, markets are impacted by weather, war, worry, Washington, wages, waste, and that’s just the W’s. So each day, as Channelchek prepares to deliver research, articles, and pertinent video content to subscriber’s inboxes, we plow through a mountain of information and hope to share what is either not being addressed or covered, or present front page news from the point of view of seasoned investors, not rookie news writers.

Below are five articles that were published throughout the year on Channelchek. Although I have favorites not included here, and these are not the most read, I believe the below told a slightly different story than the mainstream narrative. As a content provider to this popular investment research platform, my job is not to call the market, it is to provide thoughts and knowledge to help you make decisions on small and microcap stocks and the overall universe of investment opportunities. Still, the content team is proud when, for example, the entire newswire exploded with the word “pivot” that we then reminded our readers there was nothing indicating a pivot was imminent or even being discussed among FOMC members. As most Channelchek content providers are investors, analysts, and market watchers, we were also proud to serve our readership by being among the first to dig through the $AMC $APE dividend and define the true effects to stakeholders.

I think you’ll find these five articles are still compelling, and if you have not registered for no-cost insights to your inbox each day, here’s your chance to start the New Year from a slightly different investment angle.

Click Here to Register.

#1 More Behind AMC’s APE Dividend than Meets the Eye

“So, ladies and gentlemen, gentlemen and ladies, TODAY WE POUNCE.” This is how the AMC Chairman began his letter to shareholders on August 4. The company announced a unique dividend to be awarded to listed shareholders later in the month. The impact of the dividend is still being felt and discussed among market participants.

#2 The Truth About the Fed Pivot Rumors

In this article explaining the Fed not pivoting but instead doubling down on describing a strong hawkish bias does not necessarily mean bad news for investors in stocks. It’s a follow-up article to  Don’t Fear the Rate Hike, which was widely read and shared on social media. There is information in the above Fed pivot article that I am certain will be as pertinent in 2023 as it was in 2022.

#3 What Investors Haven’t Yet Noticed About the Value in Some Biotechs

If you’re shopping for a wallet and one comes complete with $100 worth of cash inside and is priced at $60, would you think there is value to this purchase? A situation similar to this has evolved in many biotech stocks. The article was written in late May, and although it has only played out for a few companies in the sector, conditions still exist for a feeding frenzy in biotech stocks. Information within the article could also apply to other sectors that have lost popularity post Covid19.

#4 Reading Between Michael Burry’s Lines

The only real contact hedge fund manager Michael Burry has with the outside world is Twitter posts (which, since Musk’s arrival, Burry now promises not to delete), his quarterly SEC filing of holdings, and every four or five years he will allow an interview with Bloomberg via Bloomberg Msg. Investment content providers are all over every tweet and quick to tell the world what it means. There are even YouTube channels that exist only to guess at what Burry’s portfolio at Scion may hold and what Burry (maybe) thinks. They do this because many readers swarm to learn more about what he is preparing for.

Some of the most widely read and long-lived content on Channelchek are articles about this guru. Still we promise to only present his tweets, filings, and thoughts when the information seems useful.

#5 What Sectors Do Best With a Strong Dollar?

Written in late April, this article hit a need that stayed important to readers throughout 2022. While the exact numbers are no longer current, the knowledge of how one market impacts another is always worth tucking away in the back of your brain so that, as an investor or trader, you can be early on building a position rather than later when the trade may have already hit the news and lost the bulk of its move. While there are always moving pieces, especially when it comes to currency strength, this article, most often discovered through Google searches,  is super short but contains useful information.

Happy New Year

Thank you for letting us be a part of 2022. In the coming year, we have plans to continue everything we are now doing and add on some features that we believe will provide users with relevant information not found in too many other places.

If you have not yet signed up, now is a great time to make sure you don’t miss anything. Click Here.

Paul Hoffman

Managing Editor, Channelchek

Why You Should Treat Your Trading Account Like a Used Car Lot

Image Credit: Guilhem Vellut (Flickr)

Smaller Losses and Bigger Gains Come with Mindset

I don’t think I’m a very good businessman. I act too much with the heart. – Pelé

If you treat the holdings in your trading account with any attachment, your ability to sell at the right time will be hindered, and your profit potential will suffer. Ideally, an active trading account accumulates when the selling volume reaches a peak, prices are cheap, and lightens up when prices are sufficiently above the purchase price. Or when there appears to be better used for the account’s capital — including moving to cash equivalents.

The Pelé quote above reminds me of many active traders; they enjoy the rush of playing and know they can only claim a victory when on the field and in play. These traders often stay on the field too long and accumulate losing positions. The markets are not a game where the odds of winning or losing are equal on any given day. Trading the markets is better thought of as a business that, at times should increase inventory and at times scale down.

Think of Your Trading Account as a Business

I struggled this week as I had two positions in the red that, for tax reasons, I should let go of to offset gains and the taxes that go along with those gains. These positions are not acting poorly, but they are negative, and they both are taking longer than I had hoped to pay off. Each easily allows me to immediately purchase a similar position without upsetting the IRS. But I have hesitated to sell all week.

If trading is a business, one does what is believed to net the most profit – always. I’m usually pretty good at this, but these two small positions would represent my first losses of the year in my trading account (hurray for me). I was fortunate enough to spot the market’s relentless one-direction trend in 2022, this allowed me to ride the downward waves. The trend seems to be continuing, so exiting these two holdings and getting back into something with similar attributes makes solid business management sense. But it isn’t that easy, I’m a competitive person. The “sportsman” side of me did not want to take any losses after dozens of wins. Today, the last day of the year, I woke and told myself the intelligent thing is doing what should net more money – not what will net bragging rights over win percentage.   

There are many other reasons people don’t sell when the probabilities indicate they should. One is not pre-determining if the trade is behaving as expected; another is falling in love with a stock and not wanting to part with it. Another is knowing you were once up and not wanting to permanently lock in something that is now red. Another may be “addiction to the game,” this burns money; a good trader should be comfortable sitting with a large cash position for weeks or months if that is what makes the most business sense.

All of these feelings that impact behavior are part of being human. There are plenty of other outlets to act on feelings outside of the markets, but investing requires you to act as though you are running a business. Don’t fall in love with your positions, and if they aren’t treating you well, get rid of them.

Image Credit: Mike W. (Flickr)

 Car Lot Owner Mentality

This may not work for everyone, but I think of my trading account (not retirement savings) as a used car lot. I am the manager and every one of the cars represents something I want to sell. If you look at your account in this way, stocks are just inventory. If times are good and prices are rising on my inventory, I want to slow down the pace of my selling. When times ahead look as though people may not want the kind of inventory on my lot, I can’t sell fast enough, even if at a loss. The cash then raised serves as dry powder that stands ready to be invested in cars/inventory/stocks believed to be more in demand. Inventory that will provide more of a profit.

By thinking of my account as a car lot,  I avoid 95% of the mental, “acting with the heart” trading missteps that I see others get trapped by. I still have a 5% problem that includes wanting a perfect score.

Investors buying and selling on an exchange have a huge advantage over managers of a car lot. For most exchange traded securities, finding someone to close out your position with does not require someone walking in off the street that just happens to want what is on your lot. Investors of securities have sell buttons that alert the investment community that you are unloading. Even thinly traded securities will have someone take the other side of the trade at the right price. There are no other businesses in the world where unwanted inventory is this easy to unload. Traders are like car lot owners with this unique advantage.

Don’t Coddle the HODL Model

While buy and hold may be a good long-term portfolio strategy for retirement money or other long-term assets, holding without reason other than the investment community encourages you to “HODL” forever and not to throw in the towel can get you in trouble. The HODL community encourages investors of certain assets to Hold On for Dear Life; this isn’t trading; it’s a recipe for an ulcer.

When does it make sense to close out a position? In general, there are some marketplace related reasons to unwind a position. These are reasons that are related to the company, changes in the markets, or better opportunity elsewhere. Or non-market-related outside reasons. Perhaps one wishes to use some of the profit to put in a pool, or they wish to stem possible losses while waiting for better clarity. Outsiders encouraging an entire community to hold a position to help push up its price only works until greed kicks in and those sworn to HODL realize the stock is up for unnatural reasons and they should be among the first out.

Kneejerk market reactions to news or events can cause a wave of selling or buying that then settles down and reverses somewhat. This may provide an opportunity to unwind positions into the feeding frenzy and re-enter it when the market settles in at a more level-headed price.

Broaden Investment Base

If you are a used car lot owner during a recession, you may opt to only half-fill your lot and make sure the cars in inventory are affordable to the community you serve. If the economy fires up and money is then widely available, you may want to maximize your inventory and make sure they are cars that will net the  most profit. It is important to know a lot about different classes of cars. This is how you run that business, minivans and crossovers some years, even if you like British sports cars.

For trading, after the pandemic plunge in early 2020, the markets had solid trends. First up with many sectors outpacing the others. Then it trended down, with many sectors outpacing the others. Understanding the sectors and companies within the sectors allows better decisions. If you have spent all your time wondering whether you should get into Apple or Tesla at the exclusion of others, while oil companies or utilities were what had a clear trend, or in Nasdaq 100 stocks because the media always talks about them, when small-caps were making their move, you may wish to broaden your focus.

Take-Away

Internal trouble exiting positions impacts more self-directed investors than will ever admit to it on social media (or actual in-the-flesh interaction). If thought of as inventory and a tool for maximizing return, the trouble is put in a place most can handle, as a “business owner,” you are buying what you feel you can sell. That is the only reason to buy. If you don’t know if you can sell it higher tomorrow, but there is something that you believe you can, then perhaps it is time to evaluate dumping, even at a loss, to pick up something else.

Cash can often be that something else. Earning 4% annually on a short t-bill isn’t sexy, but having that liquid holding when opportunity presents itself, allows you to pounce. There is nothing worse than seeing something very clearly as a winning trade and not having the capital to load up on it.

Paul Hoffman

Managing Editor, Channelchek

Two Non-Wall Street Economists Share Their 2023 Projections

Image Credit: Engin Akyurt (Pexels)

Inflation, Unemployment, the Housing Crisis, and a Possible Recession: Two Economists Forecast What’s Ahead in 2023

With the current U.S. inflation rate at 7.1%, interest rates rising and housing costs up, many Americans are wondering if a recession is looming.

Two economists discussed that and more in a recent wide-ranging and exclusive interview for The Conversation. Brian Blank is a finance professor at Mississippi State University who specializes in the study of corporations and how they respond to economic downturns. Rodney Ramcharan is an economist at the University of Southern California who previously held posts with the Federal Reserve and the International Monetary Fund.

Both were interviewed by Bryan Keogh, deputy managing editor and senior editor of economy and business for The Conversation.

Are we headed for a recession in 2023?

Brian Blank: The consensus view among most forecasters is that there is a recession coming at some point, maybe in the middle of next year. I’m a little bit more optimistic than that consensus.

People have been calling for a recession for months now, and this seems to be the most anticipated recession on record. I think that it could still be a ways off. Consumer balance sheets are still relatively strong, stronger than we’ve seen them for most periods.

I think that the labor market is going to remain hotter than people have expected. Right now, over the last eight months, the labor market has added more jobs than anticipated, which is one of the strongest streaks on record. And I think that until consumer balance sheets weaken considerably, we can expect consumer spending, which is the largest part of the economy, to continue to grow quickly.

[But this] doesn’t mean that a recession is not coming. There’s always a recession somewhere down the road.

Rodney Ramcharan: Indeed, yes, there’s a likelihood that the economy is going to contract in the next nine months. The president of the New York Fed expects the unemployment rate to go up from 3.5% currently to somewhere between 4% to 5% in the next year. And I think that will be consistent with a recession.

In terms of how much worse it can be beyond that, it’s going to depend on a number of things. It could depend on whether the Fed is going to accept a higher inflation rate over the medium term or whether it’s really committed to getting the inflation rate down to the 2% rate. So I think that’s the trade-off.

Will unemployment go up?

Blank: [Unemployment] hasn’t risen much, and maybe it’ll pick up to somewhere close to 4%. Many are expecting something like four and a half percent. And I think that’s certainly possible. And I think that we can see small upticks in the coming months.

But I don’t think it’s going to rise as quickly as some people are expecting, in part because what we’ve seen so far is a lack of labor force participation. Until more people enter the labor market, I think there are going to be plenty of jobs to go around.

What is your outlook on interest rates?

Ramcharan: As people find it more and more difficult to find jobs, or to get jobs as they begin to lose jobs, I think that’s going to dampen spending. And we’re seeing that now as the cost of borrowing has gone up sharply, and the Fed is expecting that.

The expectation is the federal funds rate will go up to 5% by next year. If you tack on another couple of points, because of the risk involved, then the cost to borrow to buy a home could potentially get up to 8% for some people. And that could be very expensive.

And the flip side of this for businesses is there’s potentially going to be a slowdown in cash flow. If consumers are not spending, then the revenues that businesses depend on to make investments might not be there.

The additional piece in this puzzle is what the banks will then do. I think banks are going to begin to curtail the extension of credit. So not only will interest rates go up for the typical consumer and the typical business, it’s also likely that they are more likely to experience denial of credit, and so that should together begin to slow spending quite a bit.

After massive increases in housing prices, what caused them to suddenly drop?

Ramcharan: As the Fed lowered interest rates, there was a massive shift among the population for various reasons. They decided that housing was the right investment or the right thing. And so when 50 million people all collectively decide to buy homes, the supply of homes is reasonably constrained in the short run. And so that led to this massive increase in house prices and in rents.

In the last three months, the housing market has cooled sharply. We’re now seeing house prices beginning to fall. I would imagine, going forward, the housing market cooling is going to be a major driver behind the slowdown in the inflation rate and in real estate investment trusts. So that’s positive.

Our recent election just changed the composition of Congress. How will that affect the economy?

Blank: Certainly, when we have a divided Congress, we’re less likely to see decisions made that involve passing legislation that might support the economy. And I think it’s likely the Republican House is going to become a little bit more conservative with spending.

And so if we do start to see a downturn, I think you’re less likely to see legislation that might help support an economy that could be in need of it. That is going to make the job of the Federal Reserve more important.

How certain are these predictions?

Ramcharan: I just want to be careful here and let your viewers know that we’re making these statements based on theory, because the inflation that we’re experiencing now comes about from a pandemic, and there really is no evidence, there’s no data available, that people can look to to say, “What happens to an economy after a pandemic?” That data does not exist.

So we’re trying to piece together the data we do have with the theories we do have, but there’s a huge band of uncertainty about what’s going to happen.

Watch the full interview here.

The Microstrategy Plan for Bitcoin is to Hold “Forever”

Image Credit: Marco Verch (Flickr)

Bitcoin’s Largest Corporate Owner Sold But Remains a net Buyer

“Bitcoin is the exit strategy,” says Michael Saylor, the Executive Chairman overseeing Microstrategy (MSTR), a company he founded. The comment was to a question in a Twitter Space interview with Eric Weiss of Bitcoin Roundtable. During this insightful interview, it becomes clear that the enterprise analytics company stands behind its commitment to the cryptocurrency and is investing in the ecosystem in other ways. Saylor also addressed his recent sale of 704 bitcoin, explaining it created tax benefits that serve stockholders.

The Company is a Bitcoin Maximalist

Bitcoin owners are “Either traders, technocrats, or maximalists.” Explained Saylor in the podcast-style interview.

Accordingly, Saylor says, traders don’t have any opinion on it long-term other than it’s an asset that moves enough to trade. Holding times may be minutes or months.

Technocrats view bitcoin as a digital monetary network like Google or Facebook. It’s a big tech network to them, so if they are bullish on big tech, they will hold bitcoin. And they may try to time their investments based on economic trends.

Maximalists view bitcoin as an instrument of economic empowerment that is just good for the human race. If you’re a maximalist, you don’t try to time it, and you have a much longer time horizon. While the technocrats are looking out 3-5 years, and they think that’s long, maximalists are looking out 10-100 years. Part of that is believing this is good for the human race.

“We’re maximalists, we think bitcoin is more than a digital monetary network; we think it is the digital monetary network. It’s good for the human race, and anything we can do in order to encourage adoption of bitcoin, and help with the adoption, is going to be good for the world.” Saylor while discussing Microstrategy.

Saylor’s company is the largest owner of bitcoin, costing Microstrategy a little more than $4 billion, the crypto assets are now valued just above $2 billion. Saylor says how we acquire bitcoin is less market-driven, as this is permanent capital that flows into the bitcoin ecosystem. Permanent capital that becomes part of the Microstrategy enterprise. Capital that is ongoing and may be held as a base forever.

In Response to December Selling

Michael Saylor recently took some criticism for selling 704 bitcoin after previously repeating he won’t sell bitcoin. He put the confusion to rest by explaining the benefit to stockholders of tax loss harvesting. With crypto the selling is treated as property so you can take the capital loss, “so we have some capital gains we pay taxes on, and then we have some capital, losses in bitcoin, so by selling the bitcoin, and taking the capital loss, we’re able to use that to offset some capital gains.” He added, it’s very tax efficient for the corporation.” Which is good for shareholders.

Lightning Network

Lightning allows “lightning-fast” blockchain payments without worrying about block confirmation times. Payment speed measured in milliseconds to seconds.Security is enforced by blockchain smart-contracts without creating an on-blockchain transaction for individual payments.

Microstrategy has said they will be offering bitcoin Lightning solutions in the first quarter of 2023. This tech investment in the growth of Microstrategy is another way Saylor and company support the bitcoin ecosystem.“If bitcoin is the underlying base layer, I think that Lightning is money over IP.” He said it’s an open permissionless protocol to let eight million people move money and monetary assets at the speed of light.

“We want to make it possible for any enterprise to spin up Lighting infrastructure in an afternoon” and onboard thousands of employees or customers, Saylor explained. “We want to plug it into enterprise technology and make it a marketing strategy for any forward-thinking CMO.”

Areas that MicroStrategy is exploring for Lightning services include online content monetization, enterprise marketing, web paywalls, and internal corporate controls. Every chief marketing officer should be able give away satoshis –– Bitcoin’s smaller denomination unit –– as incentive for customers

Take Away

Bitcoin still has its perma-bulls. Michael Saylor of Microstrategy is solidly in that category. He is not necessarily bullish on other crypto or digital currencies, bitcoin is the digital currency in his mind, and he intends for the ongoing holding of bitcoin and growth of the company in other ways that support its adoption.

Paul Hoffman

Managing Editor, Channelchek

Sources

https://twitter.com/i/spaces/1mrGmkzmmbDxy?s=20

https://cointelegraph.com/news/microstrategy-bitcoin-purchase-divides-the-crypto-community

https://www.microstrategy.com/en/investor-relations

Investor Opportunities that May Occur Early in 2023

Image Source: Jernej Furman

Will Stocks Snap Back After Tax-Loss Selling?

Offsetting portfolio capital gains by taking losses is permitted by the IRS. Within the tax guidelines, this generally occurs during the last month of the year as individuals and financial advisors strive to minimize money owed to the IRS. The stocks sold, naturally, are underperformers.  This activity has a tendency to set the stage for a late December rally or a January rebound. This is especially true of the sectors or asset classes that were most sold. This is because portfolio managers often wish to keep a similar allocation, which translates to them then waiting 30 days or more before buying something that may be viewed as substantially similar.

With the major indexes like the S&P 500, Nasdaq 100, and Small Cap S&P 600 all down double digits this year, there are stocks that are doing far worse than index averages – just as there are stocks doing far better. Of course, if you own an ETF, you have to treat it like it is one stock and cannot offset a good underlying individual company sold with an underperforming company. In this way, holders of individual company shares can benefit more because they will have more options. And may even find it easier to qualify for the additional $3,000 tax benefit the IRS allows. 

Source: Koyfin

Why Might January Reverse December’s Slide

What happens after the 30-day period? Some investors try to get in, or back in, early with the notion that the most beaten-down stocks from 30 days earlier, could quickly bounce back hard for a time. This would all begin to occur following what could be perceived as the tax loss selling dip, (aged 30 days). The so-called Santa Rally is somewhat attributed to this, but that rally has not occurred during December 2022. The chart above shows a very weak December. So the buying may be postponed until early next year.

Without substantial buying this December, the first month or two of 2023 may bring buying as investors replace holdings for allocation purposes, plus any additional purchases used to bring the beaten-down sectors’ portfolio weightings up to whatever fits the investors’ strategy.  

DoubleLine founder Jeffrey Gundlach told CNBC on Wednesday that risk assets will likely rally in January once retail investors finish tax-loss selling. Strategists at Evercore wrote on Nov. 30 that they were “buyers of stocks whose 2022 tax loss selling pressure will soon abate.”

Take Away

The main drivers of market moves next year are likely economic concerns such as inflation, recession, and monetary policy. But the potential for the most beaten down sectors this year, those that underperformed in December, may represent opportunity. The opportunity may not be long-lived, but for those involved in the markets, it is worth understanding why it may be occurring.

Paul Hoffman

Managing Editor, Channelchek

Sources

https://www.cnbc.com/pro/follow-the-pros/

https://www.reuters.com/markets/us/tax-loss-selling-battered-us-stocks-could-spur-january-snap-back-2022-12-08/

https://www.investopedia.com/terms/t/tax-loss-carryforward.asp#:~:text=What%20Is%20a%20Tax%20Loss,reduce%20any%20future%20tax%20payments.

Investment Entry and Allocation Thoughts for 2023

Image Credit: Elena Penkova (Flickr)

As the Bear Market Melts Down, Where Will the Grass Be Greenest?

Bear Markets and snowmen have one thing in common; they don’t last forever.

The entry point into an investment can have a huge impact on performance. Exits tend to be more critical when the stock has shown that it is not performing as planned. While this kind of exit may result in a loss, it allows the investor to preserve capital, liquid assets they can deploy if another good entry presents itself. The major stock market indices for 2022 are down 20% and more. Has this sell-off provided for performance-producing entry points in some stocks? Let’s look where we are as the countdown to 2023 has already begun.

About this Bear Market

Bear markets end – they always have. Pinpointing an exact bottom is not possible, so trying to be the first in for that great entry point may include a few false starts and some unhoped-for exits. The current slide in the stock market started around January 1, 2022. This was because some doubted whether inflation was transient at the time; by March, most understood the Fed was concerned that price increases were pervasive.

Fed Chair Powell, along with many Fed Presidents, began speaking hawkishly to not unduly surprise and unsettle markets as the central bank unwound the liquidity used in response to the novel coronavirus. What followed was unprecedented. Overnight lending rates went from an effective 0.08% to an effective 4.33% during the course of the year. This is more than 52 times the base lending rate at the start of the year. With these increases, no wonder the bear market continued.

Where Are We Now?

Expectations of overnight rate hikes in 2023 are for another 0.50%-0.75% increase leaving the target at, or just north of, 5%. This increase in the cost of money is small (.17 times) compared to the massive (52 times) rocking the markets in 2022. 

So rate hikes are expected to be much lower as a percentage of current rates next year. And after the last FOMC meeting, markets have seemingly repriced lower with this expectation. If all goes as it is thought it will, the market is already priced for the worst. This is a bullish sign.

Source: Koyfin

Put another way; most believe that with Fed funds beginning 2022 around zero, we’re likely much closer to the end of the Fed Funds tightening than to the beginning.

Inflation (CPI) for December won’t be reported until January 12, 2023. The latest CPI numbers show YoY up 7.1% in November, a slowing from 7.7% in October, which tapered from 8.2% the month before. The November reading of 7.1% taken by itself is a long way away from the Fed’s 2% target. But the trend in the CPI and PCE deflator also suggest the Fed is likely to monitor previous hikes to see if they will have the desired impact.

The Fed Has Been Transparent

The Fed lowered rates in line with what they promised during the pandemic. Then after some transient talk, they raised rates as they expressed they would in 2022. Following the December FOMC meeting, they suggested they were not at the end, but the voting members’ expectations for where they will settle is an average of 5.40%. The forward-looking stock market, if they believe the Fed will again do as promised, should recognize this is a much lower increase. It is perhaps near the time to begin to build on positions. This could be the entry point many investors have been waiting for.

Small Cap Phenomenon

The chart below shows how much small cap stocks outperformed during the 12- months following the pandemic plunge. While small cap outperformance has been experienced during the past century of stocks’ post-sell-off periods, one only has to look back to the pandemic plunge to remember that it was small-caps (depicted below as IWM) that had been beaten down the most and by far outran the other major indices for the next year from the low of 2021.

Source: Koyfin

Could this small cap phenomenon occur again after markets reach the bottom? Data demonstrates that small cap stocks tend to lead following a period of economic dislocation. One reason is US small caps have more of their business within the states and as a bonus, do well with a rising dollar. Current conditions suggest exploring smaller stocks. They have outperformed large caps following nearly every bear market of the last century. And today, the dollar has risen above its six-month high and is trending higher. While past movement comparisons don’t always include all the crosscurrents of the future, a strong argument could be made that a turnaround is near and small caps may again be the leaders by a wide margin.

Some Disclosure

Channelchek, the investment information platform you’re now reding has small cap stocks as its primary focus. The deep platform provides data on over 6000 stocks, with quality research updated regularly on many of them. Channelchek also provides videos and articles that may inspire informed stock selection. Stock selection, rather than just plowing investment dollars into an indexed ETF, may be preferable as indexed ETFs include sectors and stocks that may not be worthy of your portfolio.

Diversification across asset classes, sectors, and market capitalizations is considered prudent for long-term portfolios; individual allocations can be built on depending on where we are in the business and interest rate cycle. This includes an allocation to small cap equities, which perhaps should be expanded if the Fed is near the end of its tightening cycle. It could always be reduced later if the economy is deep into a growth cycle.

Take Away

Although we do not have a crystal ball to know exactly when the best entry point in any company stock is, if a century’s worth of data is any guide, the period following the end of a market downturn has been a good time to increase exposure to the small cap sector.

Register here for daily emails of research and ideas from Channelchek.

Paul Hoffman

Managing Editor, Channelchek

Sources

https://www.bls.gov/news.release/cpi.nr0.htm

https://www.newyorklifeinvestments.com/insights/investing-in-small-caps-following-a-market-downturn

https://tradingeconomics.com/united-states/interest-rate

Should We Tax Robots?

Image credit: Steve Jurvetson (Flickr)

Could a Modest Levy Combat Automation’s Impact on Income Imbalance?

Peter Dizikes | MIT News Office

What if the U.S. placed a tax on robots? The concept has been publicly discussed by policy analysts, scholars, and Bill Gates (who favors the notion). Because robots can replace jobs, the idea goes, a stiff tax on them would give firms incentive to help retain workers, while also compensating for a dropoff in payroll taxes when robots are used. Thus far, South Korea has reduced incentives for firms to deploy robots; European Union policymakers, on the other hand, considered a robot tax but did not enact it. 

Now a study by MIT economists scrutinizes the existing evidence and suggests the optimal policy in this situation would indeed include a tax on robots, but only a modest one. The same applies to taxes on foreign trade that would also reduce U.S. jobs, the research finds.  

“Our finding suggests that taxes on either robots or imported goods should be pretty small,” says Arnaud Costinot, an MIT economist, and co-author of a published paper detailing the findings. “Although robots have an effect on income inequality … they still lead to optimal taxes that are modest.”

Specifically, the study finds that a tax on robots should range from 1 percent to 3.7 percent of their value, while trade taxes would be from 0.03 percent to 0.11 percent, given current U.S. income taxes.

“We came into this not knowing what would happen,” says Iván Werning, an MIT economist and the other co-author of the study. “We had all the potential ingredients for this to be a big tax, so that by stopping technology or trade, you would have less inequality, but … for now, we find a tax in the one-digit range, and for trade, even smaller taxes.”

The paper, “Robots, Trade, and Luddism: A Sufficient Statistic Approach to Optimal Technology Regulation,” appears in the advance online form in The Review of Economic Studies. Costinot is a professor of economics and associate head of the MIT Department of Economics; Werning is the department’s Robert M. Solow Professor of Economics.

A Sufficient Statistic: Wages

A key to the study is that the scholars did not start with an a priori idea about whether or not taxes on robots and trade were merited. Rather, they applied a “sufficient statistic” approach, examining empirical evidence on the subject.

For instance, one study by MIT economist Daron Acemoglu and Boston University economist Pascual Restrepo found that in the U.S. from 1990 to 2007, adding one robot per 1,000 workers reduced the employment-to-population ratio by about 0.2 percent; each robot added in manufacturing replaced about 3.3 workers, while the increase in workplace robots lowered wages about 0.4 percent.

In conducting their policy analysis, Costinot and Werning drew upon that empirical study and others. They built a model to evaluate a few different scenarios, and included levers like income taxes as other means of addressing income inequality.

“We do have these other tools, though they’re not perfect, for dealing with inequality,” Werning says. “We think it’s incorrect to discuss this taxes on robots and trade as if they are our only tools for redistribution.”

Still more specifically, the scholars used wage distribution data across all five income quintiles in the U.S. — the top 20 percent, the next 20 percent, and so on — to evaluate the need for robot and trade taxes. Where empirical data indicates technology and trade have changed that wage distribution, the magnitude of that change helped produce the robot and trade tax estimates Costinot and Werning suggest. This has the benefit of simplicity; the overall wage numbers help the economists avoid making a model with too many assumptions about, say, the exact role automation might play in a workplace.

“I think where we are methodologically breaking ground, we’re able to make that connection between wages and taxes without making super-particular assumptions about technology and about the way production works,” Werning says. “It’s all encoded in that distributional effect. We’re asking a lot from that empirical work. But we’re not making assumptions we cannot test about the rest of the economy.”

Costinot adds: “If you are at peace with some high-level assumptions about the way markets operate, we can tell you that the only objects of interest driving the optimal policy on robots or Chinese goods should be these responses of wages across quantiles of the income distribution, which, luckily for us, people have tried to estimate.”

Beyond Robots, an Approach for Climate and More

Apart from its bottom-line tax numbers, the study contains some additional conclusions about technology and income trends. Perhaps counterintuitively, the research concludes that after many more robots are added to the economy, the impact that each additional robot has on wages may actually decline. At a future point, robot taxes could then be reduced even further.  

“You could have a situation where we deeply care about redistribution, we have more robots, we have more trade, but taxes are actually going down,” Costinot says. If the economy is relatively saturated with robots, he adds, “That marginal robot you are getting in the economy matters less and less for inequality.”

The study’s approach could also be applied to subjects besides automation and trade. There is increasing empirical work on, for instance, the impact of climate change on income inequality, as well as similar studies about how migration, education, and other things affect wages. Given the increasing empirical data in those fields, the kind of modeling Costinot and Werning perform in this paper could be applied to determine, say, the right level for carbon taxes, if the goal is to sustain a reasonable income distribution.

“There are a lot of other applications,” Werning says. “There is a similar logic to those issues, where this methodology would carry through.” That suggests several other future avenues of research related to the current paper.

In the meantime, for people who have envisioned a steep tax on robots, however, they are “qualitatively right, but quantitatively off,” Werning concludes.

Reprinted with permission of MIT News” (http://news.mit.edu/)

How Inflation Clips Age Groups Differently

Image Credit: Rodnae (Pexels)

Inflation for Americans at Each Age

According to the Bureau of Labor Statistics, consumer prices rose 9.1% from June 2021 to June 2022, the highest rate since 1981. That figure is an average of price increases for bananas, electricity, haircuts, and more than 200 other categories of goods and services. But households in different age groups spend money differently, so inflation rates vary by age, too. The diagrams below show average spending for households at different ages, in the categories that make up the inflation index.

25 Year-Olds / Full Interactive Graphic

Young households spend more of their budgets on gasoline, where prices rose 60% in the last year. Gasoline has been the largest single-category driver of inflation since March 2021, accounting for nearly 25% of inflation by itself. Gas has had an outsized impact considering that the category is 4.8% of Consumer Price Index spending. (Gasoline prices began falling in mid-June.)

40 Year-Olds / Full Interactive Graphic

Measured in dollars, gasoline spending peaks around age 40, according to government surveys.

But, as a percentage of spending, gasoline spending is highest for the youngest households.

Sources:
US Bureau of Labor Statistics
Consumer Expenditure Survey
Consumer Price Index

Taking an average of all categories, as the inflation index does, shows that inflation is currently highest for younger households. It is about 2 percentage points higher for households headed by 21-year-olds as it is for octogenarians who live at home. That has not been true for most of the last 40 years. Inflation rates calculated in this way were higher for older households as recently as early 2021, when medical care costs were rising faster than gasoline prices.

Sources:
US Bureau of Labor Statistics
Consumer Expenditure Survey
Consumer Price Index

These estimates are imperfect. The Bureau of Labor Statistics notes in its estimate of inflation for elderly households that different age groups may buy different items within each category or buy them from different types of stores. They may also live in locations with costs of living so dissimilar that national changes in prices are not relevant. Over the past 12 months, inflation was 6.7% in the New York City metropolitan area and 12.3 in the Phoenix metropolitan area, due in part to different housing markets.

The above was adapted from USAFacts and is the intellectual property of USAFacts protected by copyrights and similar rights. USAFacts grants a license to use this Original Content under the Creative Commons Attribution-ShareAlike 4.0 (or higher) International Public License (the “CC BY-SA 4.0 License”).

The Week Ahead – Boxing Day Closes Some Markets on 27th

Investors Watching for a “Santa Rally” the Last Trading Week of 2022

Stocks in the US closed higher Friday after consumer inflation continued to ease modestly, and consumer expectations are for the trend to continue. This could set the stage for the week ahead as some expect the probability of a “Santa rally” as investors may begin using their dry powder to wave in some stocks that have gone down with the crowd but are historically cheap and showing value.

Stock markets in London, Toronto, Sydney, Hong Kong, and Johannesburg are closed. on Tuesday, December 27, since Boxing Day was already a holiday since Christmas fell on a Sunday.  

The four-day trading week ahead includes the latest data on home prices with the S&P CoreLogic Case-Shiller National Home Price Index and Freddie Mac’s House Price Index (October). On Wednesday, the National Association of Realtors (NAR) will issue pending home sales figures (November). The strength of the manufacturing sector on Friday, with the Chicago Purchasing Managers’ Index (PMI) for December, has market-moving potential on the last trading day of the year.

Monday 12/26

  • Markets and Government Offices closed.

Tuesday 12/27

  • Stock markets in London, Toronto, Sydney, Hong Kong, and Johannesburg are closed.  
  • 8:30 AM ET, The US Goods Deficit (Census basis) is expected to narrow to $97.0 billion in November after deepening by more than $6 billion in October to $98.8 billion.
  • 8:30 AM ET, Wholesale Inventories, where buildups have been lessening, are expected to rise 0.4 percent in the advance report for November.
  • 9:00 AM ET, Case-Shiller Home Price Index, forecasters see the adjusted 20-city monthly rate falling 1.2 percent again in October after a decline of 1.2 percent in September for an unadjusted annual rate of 8.1 percent versus September’s 10.4 percent.

Wednesday 12/28

  • 10:AM ET, Richmond Fed Manufacturing Index, the manufacturing composite is expected at minus 6, in December vs. minus 9 in November and minus 10 in October.

Thursday 12/29

  • 8:30 AM ET, Jobless Claims for the December 29 week are expected to come in at 222,000 versus 216,000 in the prior week.

Friday 12/30

• 9:45 AM ET, The Chicago PMI is expected to bounce back in December to 41.0 versus November’s much weaker-than-expected 37.2.

  • The Bond markets are scheduled to close at 2 PM. Stocks have the benefit of a full trading day to close out 2022.

What Else

Replays of the Noble Capital Markets analysts’ discussions of companies they cover on Wall Street Wish List, are now available on Channelchek to help you create your own wish list for 2023. Find them here in Channelchek’s Video Content Library.   And if you haven’t signed up for regular emails from Channelchek now is a good time to sign-up and see how helpful they are

Happy New Year from the entire content team at Channelchek!

Paul Hoffman

Managing Editor, Channelchek

Sources

https://www.barrons.com/articles/stock-market-open-closed-today-hours-boxing-day-christmas-51671801332

https://www.aarp.org/money/investing/info-2022/stock-market-holidays.html#:~:text=The%20bond%20markets%20shut%20down,Friday%2C%20Dec.%2030).

https://us.econoday.com/byweek.asp?cust=us

Delivery Speeds Have Normalized Supply Chain as We Head Into 2023

Image Credit: Jo Zimmy Photos (Flickr)

Improved Delivery Speeds Could Lower Inflation

Delivery speeds of goods worldwide have improved, impacting everything from shipping and freight to retail stores – and it should help provide a lower inflationary balance between demand and supply. Demand is waning, and supply speeds are normalizing. Months-long back-ups of ships are now gone, with shipping rates close to pre-pandemic levels, the post-pandemic era now has to adjust again.

Supply Chain Pressure

A government measure compiled by the Bureau of Labor Statistics (BLS) consisting of transportation and manufacturing pressures, called the Global Supply Chain Pressure Index Pressure (GSCPI), shows significant easing during 2022.

Data Source: BLS via Federal Reserve Bank of New York

Global supply chain pressures are well off the high reached last December, although they have just modestly ticked up.  The largest contributor to this slight reversal is the increase in supply chain pressures from Chinese delivery times, though improvements were shown in U.S. delivery times and Taiwanese purchases.  The GSCPI’s recent movements suggest that developments in Asia are slowing down the return of the index back to historical levels.

Shipping Impact

Goods are moving through the largest U.S. port complex faster than at any time since cargo was backed up for weeks at the Los Angeles-Long Beach docks during the pandemic. The average dwell time for containers is just 2.8 days, according to the Pacific Merchant Shipping Association. Meanwhile, U.S. container imports reached their lowest level in November since the early months of 2020.

The improvements and reduced demand have impacted ocean shipping rates. The daily spot rate to move a shipping container from Asia to the U.S. West coast is near $1,400, down from about $7,500 in July and roughly $15,000 a year ago, according to the Freightos Baltic Index. This current cost represents a slight discount over pre-pandemic rates.

Freight Impact

Maersk is a large logistics company that is involved in many aspects of shipping and tracking. Vincent Vlerc will take over as CEO on January 1. Mr. Clerc said, “You can’t deploy more capacity than what our customers need.” He explained, “we are going through a significant inventory correction in the U.S. and Europe, and we made significant capacity adjustments to our capacity in and out of Asia.” Maersk has indicated it is transporting 30% fewer containers across the Pacific since last year. 

The current chief executive of Maersk, Soren Skou said, “it’s obvious that freight rates peaked and began to normalize, driven by falling demand and an easing supply-chain congestion.”  In November, the shipping company lowered its 2023 forecast for container demand. It now expects a decline from 2% to 4%, from a maximum decline of 1% previously.

Rail Transportation

The major railroads, in addition to having averted a strike, have managed to hire more train and engine crew members during the second half of 2022. Recruiting had been challenging earlier. They reopened some hump yards and took out locomotives from storage to help ease some bottlenecks.

These changes helped to improve rail service from a low in the Spring when dwell time and train speeds were historically low. “We have turned the corner on service,” Norfolk Southern CEO Alan Shaw said during the company’s investor day in early December.

The railroads say they intend to draw more cargo currently on trucks back to rail, as rail service improves.

Parcel Delivery

FedEx and other regional carriers are having an easier time delivering packages. On Tuesday, FedEx reported average daily parcel volumes fell 10.2%, declining for the fourth straight quarter. There is a trend where shoppers are venturing back out; this has reduced online shopping.

There is now a surplus of capacity to deliver packages. In 2020 and 2021, their ability to deliver fell short of daily capacity.

Before the holiday season, parcel carriers noted consumers had reduced online orders. People seemingly have other pent-up demands to meet. They have resumed spending on travel, parties, and entertainment. Also, in-person shopping has increased post-pandemic.

Impact on Retail

After more than a year of paying higher and higher prices for shipped goods, Walmart and other retailers can resist price increases. In fact, they may even be successful negotiating discounts. With significant inventory and, in some cases, excess inventory, retailers have more bargaining power with shippers and suppliers. Dollar General Corp., after years of blaming high transportation costs as a drag on the business, said in December that falling transit prices could begin lifting the company in 2023.

Take Away

A new balance is being found in the shipping and delivery of goods. Where there was once more demand than supply, a more normal balance is surfacing. This balance is a relief to both sellers and buyers as products become available. Even more, it is likely to help bring inflation down. Also working to help this balance is higher interest rates that are intended to slow demand while supply-side channels catch up. The balance is much closer than it was when the Fed began tightening, this helps bring the costs of goods down, and as an added gift to those most hurt by inflation, it also has helped ease tight labor markets.

Paul Hoffman

Managing Editor, Channelchek

Sources

https://www.newyorkfed.org/research/policy/gscpi#/interactive

https://www.maersk.com/

https://www.wsj.com/articles/inventory-pileup-uneasy-shoppers-put-retailers-in-jeopardy-11661690106?mod=article_inline

https://www.wsj.com/articles/supply-chains-upended-by-covid-are-back-to-normal-11671746729?mod=Searchresults_pos2&page=1

https://www.wsj.com/articles/supply-chains-upended-by-covid-are-back-to-normal-11671746729?mod=hp_lead_pos6

https://www.wsj.com/articles/inventory-pileup-uneasy-shoppers-put-retailers-in-jeopardy-11661690106?mod=article_inline

https://www.wsj.com/articles/walmart-is-flexing-its-muscle-again-11668229212?mod=article_inline

Nuclear Fusion Technology Could Be A $40 Trillion Market

Nuclear Fusion’s Potential to Be a Highly Disruptive Breakthrough with Investment Opportunities

Scientists at the Energy Department’s Lawrence Livermore National Laboratory (LLNL) in California announced the first-ever demonstration of fusion “ignition.” This means that more energy was generated from fusion than was needed to operate the high-powered lasers that triggered the reaction. More than 2 megajoules (MJ) of laser light were directed onto a tiny gold-plated capsule, resulting in the production of a little over 3 MJ of energy, the equivalent of three sticks of dynamite.

This important milestone is the culmination of decades’ worth of research and lots of trial and error, and it makes good on the hope that humanity will one day enjoy 100% clean and plentiful energy.

This article was republished with permission from Frank Talk, a CEO Blog by Frank Holmes
of U.S. Global Investors (GROW).
Find more of Frank’s articles here – Originally published December 19, 2022.

Unlike conventional nuclear fission, which produces highly radioactive waste and carries the risk of nuclear proliferation, nuclear fusion has no emissions or risk of cataclysmic disaster. That should please activists who support renewable, non-carbon-emitting energy sources such as wind and solar and yet oppose nuclear power.

75th Anniversary of Another Great American Invention, The Transistor

I think it’s only fitting that this breakthrough occurred not just in the U.S., the most innovative country on earth, but also on the 75th anniversary of the invention of the transistor.

Like fusion energy, the transistor’s importance can’t be overstated. Invented in December 1947 in New Jersey’s storied Bell Labs—also the birthplace of the photovoltaic cell, fiber optic cable, communications satellite, UNIX operating system and C programming language—the transistor made the 20th century possible. Everything we use and enjoy today, from our iPhones to our Teslas, wouldn’t exist without the seminal American invention.  

In 2021, the electric vehicle maker unveiled its proprietary application-specific integrated circuit (ASIC) for artificial intelligence (AI) training. The ASIC chip, believe it or not, boasts an unbelievable 50 billion transistors.

Private Investment in Fusion Technology Has Been Increasing

Getting your electricity from a commercial fusion reactor is still years if not decades away, but that hasn’t stopped money from flowing into the sector. This year, private investment is estimated to top $1 billion, following the record $2.6 billion that went into fusion research in 2021, according to BloombergNEF.  

Private Sector Investment in Nuclear Fusion May Top $1 Billion in 2022

At the moment, there aren’t any publicly traded fusion companies. However, Bloomberg has a Global Nuclear Theme Peers index that tracks listed companies with exposure to the industry, estimated by Bloomberg to one day achieve a jaw-dropping $40 trillion valuation. Some of the more recognizable names include Rolls-Royce, Toshiba, Hitachi and General Electric.

For the five-year period, the index of 64 “nuclear” stocks has advanced approximately 100%, compared to the MSCI World Index, up 38% over the same period.

The number of private firms involved in R&D continues to grow, raising the possibility that some will tap public markets in the coming years.

Among the largest is Commonwealth Fusion Systems, or CFS, which spun out of MIT’s Plasma Science and Fusion Center in 2018. The company raised $1.8 billion in December 2021, on top of the $250 million it had raised previously. Its investors include Bill Gates and Google, along with oil companies, venture capital firms and sovereign wealth funds. CFS claims to have the fastest, lowest cost solution to commercial fusion energy and is in the process of building a prototype that is set to demonstrate net energy gain by 2025.

Another major player is TAE Technologies. Located in California, the company has raised a total of $1.2 billion as of December 2022, from investors such as the late Paul Allen, Goldman Sachs, Google and the family office of Charles Schwab. TAE says it is developing a fusion reactor, scheduled to be unveiled in the early 2030s, that will generate electricity from a proton-boron reaction at an incredible temperature of 1 billion degrees.

Other contenders in the field include Washington State-based Helion Energy, Canada’s General Fusion and the United Kingdom’s Tokamak Energy. In February 2022, Tokamak broke a longstanding record by generating 59 MJ of energy, the highest sustained energy pulse ever.

As an investor, I would keep an eye on this space!

Solar Accounted For 45% Of All New Energy Capacity Growth In The U.S.

In the meantime, energy investors with an eye on the future still have renewable energy stocks to consider.

2022 has been a challenging year for the industry, with much of it facing supply constraints. According to Wood Mackenzie, total new solar installations in the U.S. were 18.6 gigawatts (GW), a 23% decrease from 2021.

Even so, solar accounted for 45% of all new electricity-generation capacity added this year through the end of the third quarter. That’s greater than any other energy source. Wind was in second place, representing a quarter of all new energy power, followed by natural gas at 21% and coal at 10%, its best year since 2013.

WoodMac expresses optimism in the next two years. Solar projects that were delayed this year due to supply issues may finally come online in 2023, and by 2024, the real effects of President Biden’s Inflation Reduction Act (IRA) should be felt. The U.K.-based research firm forecasts 21% average annual growth from 2023 through 2027, so now may be an opportune time to start participating.

One of our favorite plays right now is Canadian Solar, up more than 11% for the year. On Thursday of this week, the Ontario-based company announced that it would begin mass-producing high efficiency solar modules in the first quarter of 2023. Canadian Solar shares were up more than 1% last week, despite experiencing two down days on this week’s news of continued rate hikes into 2023.

US Global Investors Disclaimer

All opinions expressed and data provided are subject to change without notice. Some of these opinions may not be appropriate to every investor. By clicking the link(s) above, you will be directed to a third-party website(s). U.S. Global Investors does not endorse all information supplied by this/these website(s) and is not responsible for its/their content.

The BI Global Nuclear Theme Peers is an index not for use as a financial benchmark that tracks 64 companies exposed to nuclear energy research and production. The MSCI World Index is a free-float weighted equity index which includes developed world markets and does not include emerging markets.

Holdings may change daily. Holdings are reported as of the most recent quarter-end. The following securities mentioned in the article were held by one or more accounts managed by U.S. Global Investors as of (09/30/22): Tesla Inc., Canadian Solar Inc.

Retail Switches Tesla Stock Ownership Into Plaid Mode

Image Credit: Steve Jurvetson (Flickr)

Tesla Stock Attracts Retail Bottom Fishing

Cathie Wood isn’t the only one favoring Tesla (TSLA) at recent valuations. Retail accounts have just made it their favorite stock in 2022 as transactions outpace the old favorite, Apple (AAPL). Money from retail trading accounts flowing into the company founded by Elon Musk increased by 424% to $15.41 billion, versus $2.94 billion in 2021. To be fair, the iPhone maker isn’t too far behind, as retail made $15.21 billion in cumulative purchases during the same period.

Vanda is a global independent research company that provides tactical macro and strategic investment analysis to institutional investors. In the firm’s, last research note of 2022, Marco Iachini, senior vice president of research at Vanda, shed some light and data on retail’s current favorite as institutional traders are placing more and more importance on money flows from self-directed investors.

Tesla’s share price has been moving lower in recent weeks as investors and analysts have been critical of the steps the billionaire has taken at his social media company, including the level of focus he has given to his new acquisition.  They also show concern of the interrelationship between Musk’s wealth, Twitter’s financial needs, and any tie-in with how Tesla may trade.

Source: Koyfin

Tesla shares are headed for a 60% decline in 2022, which is the worst sell-off since its 2010 public offering. Tesla’s year-to-date loss outpaces the S&P 500’s decline of 18% and the Nasdaq 100’s drop of 31%. The old favorite, Apple stock, has given up 23% during the year.

On a wider scale, investors in Tesla, Apple, and other large-cap tech companies have been slammed this year after two years of above-average returns. Vanda underscored Tesla’s popularity, saying the stock makes up about 11% of the average retail portfolio.

On the Robinhood platform, Tesla is the ninth most popular stock of the year, with Microsoft filling the top position.

Many institutional investors have, over the years, used retail interest as a sign of what to stay away from or even short. “Given its growing importance, we view retail activity around it as a crucial signpost for what may be an eventual full-fledged capitulation in 2023,” said Iachini, who wrote the research note. This flies in the face of institutional chief investment officer and founder of ARK Invest Cathie Wood, who has purchased slightly more than 445,000 shares of the EV manufacturer since October. Over the previous year and a half, Wood has been a net seller of Tesla.

Paul Hoffman

Managing Editor, Channelchek

Sources

https://finance.yahoo.com/news/cathie-wood-loads-tesla-amid-063957962.html

https://markets.businessinsider.com/news/stocks/tesla-tsla-apple-stock-price-investors-popular-favorite-retail-markets-2022-12