Proven Finance Executives Amy Schioldager and Evan Levitt to Join the Board
Wendy Schoppert Appointed Board Chair
BOCA RATON, Fla.–(BUSINESS WIRE)–Jun. 3, 2024– The ODP Corporation (“ODP” or the “Company”) (NASDAQ:ODP), a leading provider of business services, products and digital workplace technology solutions to businesses and consumers, today announced the appointment of financial executives Amy Schioldager and Evan Levitt to its Board of Directors.
The Company also announced that Wendy Schoppert, ODP Board member since 2020, will assume the role of independent Board Chair as Joseph Vassalluzzo steps down from the Board after 11 years of service.
These changes will be effective on June 10, 2024. ODP’s Board size will be increased from seven members to eight, with directors having an average tenure of approximately five years.
“We are thrilled to welcome Amy and Evan to the ODP Board at this juncture, as we continue to evolve our business and position our Company to drive future profitable growth,” said Wendy Schoppert, Chair-Elect of the Board. “They bring valuable perspectives to further enhance the diverse skills of our Board, advance our value creation initiatives, and champion the continued growth of our strong 5C Culture.”
“Both Amy and Evan are proven financial executives with decades of leadership experience at Fortune 500 companies,” Schoppert continued. “With 25 years of experience at BlackRock, Amy brings technical and strategic expertise, having led investment teams across markets and segments, and has deep shareholder and public company governance experience. Evan has extensive financial and audit expertise across industries, as well as a strong understanding of distribution and consumer businesses. We look forward to leveraging their unique backgrounds as we continue to focus on driving long-term profitable growth and shareholder value.
“We would also like to thank Joe for his Board service, including as independent Chairman for the past seven years. His leadership and insight have been instrumental through ODP’s evolution. We wish him all the best in the future,” Schoppert concluded.
About Amy Schioldager
Amy has over 25 years of experience in various leadership positions at BlackRock, Inc., where she led investment teams across global equity markets and client segments. Most recently, Amy served as Senior Managing Director and Global Head of Beta Strategies. In this role, she oversaw $2.5 trillion in assets under management across seven global offices. She also served on BlackRock’s Global Executive Committee, which oversaw $11 billion in profit and loss and 13,000 employees across 30 countries. In addition to her investment and business leadership experience, Amy has strong board experience: she currently serves on the public company boards of Intermediate Capital Group plc and Corebridge Financial Inc, as well as the private organization boards of Boardspan Inc and California State University – East Bay. She previously served on the board of American International Group Inc.
About Evan Levitt
Evan brings over 30 years of experience in finance and accounting and has served in numerous leadership positions across industries. Most recently, Evan was Interim Executive Vice President and Chief Financial Officer at BrandSafway, a leading construction company providing solutions to the industrial, commercial and infrastructure markets. Prior to that, he held various leadership roles at The Home Depot, Inc. / HD Supply Holdings over the course of 17 years, during which time he played a pivotal role in negotiating the sale of HD Supply to The Home Depot, Inc. His most recent role at the company was as Senior Vice President, Chief Financial Officer, Chief Administrative Officer of HD Supply Holdings Inc. He currently serves on the private company boards of Artera Services, where he is a member of the Audit Committee, and WASH, where he serves as the Chairman of the Audit and Risk Committee.
About The ODP Corporation
The ODP Corporation (NASDAQ:ODP) is a leading provider of products, services, and technology solutions through an integrated business-to-business (B2B) distribution platform and omni-channel presence, which includes supply chain and distribution operations, dedicated sales professionals, a B2B digital procurement solution, online presence, and a network of Office Depot and OfficeMax retail stores. Through its operating companies ODP Business Solutions, LLC; Office Depot, LLC; Veyer, LLC; and Varis, Inc, The ODP Corporation empowers every business, professional, and consumer to achieve more every day. For more information, visit theodpcorp.com.
Transformational acquisition expected to accelerate EBITDA margin expansion
MRP to continue delivering services through existing operating companies and brands
Kelly management to host live webcast on June 18 to provide more details about the rationale for the acquisition and insights into MRP’s financial profile
TROY, Mich., June 03, 2024 (GLOBE NEWSWIRE) — Kelly (Nasdaq: KELYA, KELYB) (“the Company”), a leading global specialty talent solutions provider, today announced it has completed the acquisition of Motion Recruitment Partners, LLC (“MRP”), from Littlejohn & Co., LLC (“Littlejohn”), a private investment firm based in Greenwich, Connecticut. Kelly previously announced on May 3, 2024, that it had entered into a definitive agreement to acquire MRP from Littlejohn.
The acquisition of MRP strengthens the scale and capabilities of Kelly’s staffing and consulting solutions across technology, telecommunications, and government specialties in North America, and recruitment process outsourcing (RPO) solutions globally. With a margin profile commensurate with a highly specialized technology talent solutions provider, MRP fits exceptionally well with Kelly’s strategy to enhance the revenue growth potential of the company and drive continued EBITDA margin expansion.
“Today marks a transformational step forward on our journey to sharpen Kelly’s focus on higher-margin, higher-growth specialty outcome-based and staffing services in North America, and global RPO and MSP solutions,” said Peter Quigley, president and chief executive officer, Kelly. “I’m excited to welcome MRP to the Kelly team and look forward to the significant growth and value creation we will deliver together.”
“MRP’s capabilities are excellent complements to Kelly SET as we continue our journey to become a leading technology staffing and consulting solutions provider in North America,” said Hugo Malan, president, Kelly SET. “They bring extensive expertise in enterprise technology staffing, as well as robust telecommunications and government specialties that align exceptionally well with our strong offerings in these segments.”
“Sevenstep’s RPO and MSP offerings align exceptionally well with KellyOCG and we believe the combined entities create a powerful story to bring to the market,” said Tammy Browning, president, KellyOCG. “We look forward to authoring this story together with the Sevenstep team and unlocking new opportunities for growth over the long term.”
Kelly acquired MRP for a purchase price of $425 million. Additional cash consideration of up to $60 million may be due in the second quarter of 2025 if certain conditions are satisfied during an earn-out period ending on March 31, 2025. The earn-out payment is based on a multiple of gross profit in excess of an agreed-upon amount during the earn-out period. The Company funded the transaction through debt and available capital, including the rapid redeployment of more than $100 million from the sale of Kelly’s European staffing operations in January 2024.
Kelly will host a live webcast of a conference call with financial analysts on June 18, 2024, at 9 a.m. ET to provide more details about the acquisition of MRP. Quigley and Olivier Thirot, executive vice president and chief financial officer, will present the rationale for the acquisition and insights into MRP’s financial profile, including recent revenue, gross margin, and net margin trends. Following the presentation, Quigley and Thirot will address questions from financial analysts. The live webcast will be accessible on the Investor Relations section of Kelly’s public website. A recording of the webcast will be available after 1:30 p.m. ET on June 18, 2024.
About Kelly®
Kelly Services, Inc. (Nasdaq: KELYA, KELYB) helps companies recruit and manage skilled workers and helps job seekers find great work. Since inventing the staffing industry in 1946, we have become experts in the many industries and local and global markets we serve. With a network of suppliers and partners around the world, we connect more than 500,000 people with work every year. Our suite of outsourcing and consulting services ensures companies have the people they need, when and where they are needed most. Headquartered in Troy, Michigan, we empower businesses and individuals to access limitless opportunities in industries such as science, engineering, technology, education, manufacturing, retail, finance, and energy. Revenue in 2023 was $4.8 billion. Learn more at kellyservices.com.
About Motion Recruitment Partners, LLC
Established in 1989 and headquartered in Boston, Massachusetts, Motion Recruitment Partners, LLC, is parent company to a group of leading global talent solution providers to include Motion Recruitment (IT Staffing & Managed Solutions), Motion Consulting Group (IT Consulting), Motion Telco (IT & Telecom Solutions), Tech in Motion (Tech Networking & Events program), TG Federal (Government IT Subcontracting), and Sevenstep® (RPO, MSP & TA Advisory/Consulting). Learn more at www.motionrecruitment.com, www.sevensteptalent.com, and www.tgfederal.com.
About Littlejohn & Co., LLC
Littlejohn & Co., LLC, is a Greenwich, Connecticut-based investment firm focused on private equity and debt investments primarily in growing middle-market industrial and services companies that can benefit from Littlejohn’s 25+ years of operational and sector expertise. With approximately $8 billion in regulatory assets under management, the firm seeks to build sustainable success for its portfolio companies through a disciplined approach to engineering change. For more information about Littlejohn, visit www.littlejohnllc.com.
Forward-Looking Statements
This release contains statements that are forward looking in nature and, accordingly, are subject to risks and uncertainties. These statements are made under the “safe harbor” provisions of the U.S. Private Securities Litigation Reform Act of 1995. Statements that are not historical facts, including statements about Kelly’s financial expectations, are forward-looking statements. Factors that could cause actual results to differ materially from those contained in this release include, but are not limited to, (i) changing market and economic conditions, (ii) disruption in the labor market and weakened demand for human capital resulting from technological advances, loss of large corporate customers and government contractor requirements, (iii) the impact of laws and regulations (including federal, state and international tax laws), (iv) unexpected changes in claim trends on workers’ compensation, unemployment, disability and medical benefit plans, (v) litigation and other legal liabilities (including tax liabilities) in excess of our estimates, (vi) our ability to achieve our business’s anticipated growth strategies, (vi) our future business development, results of operations and financial condition, (vii) damage to our brands, (viii) dependency on third parties for the execution of critical functions, (ix) conducting business in foreign countries, including foreign currency fluctuations, (x) availability of temporary workers with appropriate skills required by customers, (xi) cyberattacks or other breaches of network or information technology security, and (xii) other risks, uncertainties and factors discussed in this release and in the Company’s filings with the Securities and Exchange Commission. In some cases, forward-looking statements can be identified by words or phrases such as “may,” “will,” “expect,” “anticipate,” “target,” “aim,” “estimate,” “intend,” “plan,” “believe,” “potential,” “continue,” “is/are likely to” or other similar expressions. All information provided in this press release is as of the date of this press release and we undertake no duty to update any forward-looking statement to conform the statement to actual results or changes in the Company’s expectations.
MCLEAN, Va., June 3, 2024 /PRNewswire/ — V2X, Inc. (NYSE: VVX) announces it has successfully repriced and extended its $907 million First Lien Term Loan.
Under the repricing, the annual interest margin was reduced by 50 basis points to 2.75%. Additionally, the 10-basis point Credit Spread Adjustment was eliminated from the company’s Secured Overnight Financing Rate, further improving the anticipated savings from the repricing. The company also extended the maturity of the loan by two years to December 2030.
“I’m pleased to report the successful repricing of our first lien term loan, which is another positive step in our efforts to increase shareholder value and enhance the company’s capital structure,” said Shawn Mural, Senior Vice President and Chief Financial Officer at V2X. “The repricing is expected to yield notable interest expense savings and lower the overall cost of capital, while extending those benefits for another two years. This outcome is a testament to the strength in our business, supported by V2X’s robust backlog, strong cash flow generation capabilities, and progress deleveraging the balance sheet.”
About V2X
V2X builds smart solutions designed to integrate physical and digital infrastructure – by aligning people, actions, and outputs. Our lifecycle solutions improve security, streamline logistics, and enhance readiness.
The Company delivers a comprehensive suite of integrated solutions across the operations and logistics, aerospace, training, and technology markets to national security, defense, civilian and international clients. Our global team of approximately 16,000 employees brings innovation to every point in the mission lifecycle, from preparation to operations, to sustainment, as it tackles the most complex challenges with agility, grit, and dedication.
Safe Harbor Statement Safe Harbor Statement under the Private Securities Litigation Reform Act of 1995 (the “Act”): Certain material presented herein includes forward-looking statements intended to qualify for the safe harbor from liability established by the Act. These forward-looking statements include, but are not limited to, all the statements in this release that are not historical, including, without limitation, interest expense savings, cost of capital, strength in our business, long-term contracts, cash flow generation capabilities, backlog, and progress deleveraging the balance sheet.
Forward-looking statements generally can be identified by the use of forward-looking terminology such as “may,” “will,” “expect,” “intent,” “estimate,” “anticipate,” “believe,” “could,” “potential,” “continue,” “can,” “goal,” “long-term,” “drive,” “next,” and variations of such words and or similar expressions and terminology. These statements are based on the beliefs and assumptions of the management of the Company based on information currently available to management.
These forward-looking statements are not guarantees of future performance, conditions, or results, and involve a number of known and unknown risks, uncertainties, assumptions, and other important factors, many of which are outside our management’s control, which could cause actual results to differ materially from the results discussed in the forward-looking statements. In addition, forward-looking statements are subject to certain risks and uncertainties that could cause actual results to differ materially from the Company’s historical experience and our present expectations or projections. For a discussion of some of the risks and uncertainties that could cause actual results to differ from such forward-looking statements, see the risks and other factors detailed from time to time in our Annual Report on Form 10-K, Quarterly Reports on Form 10-Q, and other filings with the SEC.
We do not undertake, and expressly disclaim, any duty or obligation to update publicly any forward-looking statement after the date of this release, whether as a result of new information, future events or otherwise, except as required by law.
Investor Contact Mike Smith, CFA Vice President, Treasury, Corporate Development and Investor Relations IR@goV2X.com 719-637-5773
Media Contact Angelica Spanos Deoudes Director, Corporate Communications Angelica.Deoudes@goV2X.com 571-338-5195
BATAVIA, N.Y.–(BUSINESS WIRE)– Graham Corporation (NYSE: GHM), a global leader in the design and manufacture of mission critical fluid, power, heat transfer and vacuum technologies for the defense, space, energy and process industries, announced that it will release its fourth quarter and fiscal year 2024 financial results before financial markets open on Friday, June 7, 2024.
The Company will host a conference call and webcast to review its financial and operating results, strategy, and outlook. A question-and-answer session will follow.
Fourth Quarter and Fiscal Year 2024 Financial Results Conference Call
Friday, June 7, 2024 11:00 a.m. Eastern Time Phone: (201) 689-8560 Internet webcast link and accompanying slide presentation: ir.grahamcorp.com
A telephonic replay will be available from 3:00 p.m. ET on the day of the teleconference through Friday, June 14, 2024. To listen to the archived call, dial (412) 317-6671 and enter conference ID number 13745902 or access the webcast replay via the Company’s website at ir.grahamcorp.com, where a transcript will also be posted once available.
ABOUT GRAHAM CORPORATION
Graham is a global leader in the design and manufacture of mission critical fluid, power, heat transfer and vacuum technologies for the defense, space, energy and process industries. The Graham Manufacturing and Barber-Nichols’ global brands are built upon world-renowned engineering expertise in vacuum and heat transfer, cryogenic pumps and turbomachinery technologies, as well as its responsive and flexible service and the unsurpassed quality customers have come to expect from the Company’s products and systems.
Graham routinely posts news and other important information on its website, grahamcorp.com, where additional information on Graham Corporation and its businesses can be found.
Vancouver, British Columbia–(Newsfile Corp. – May 29, 2024) – Hemisphere Energy Corporation (TSXV: HME) (OTCQX: HMENF) (“Hemisphere” or the “Company”) provides its financial and operating results for the first quarter ended March 31, 2024, declares a quarterly dividend payment to shareholders, renews credit facility, and provides operations update.
Q1 2024 Highlights
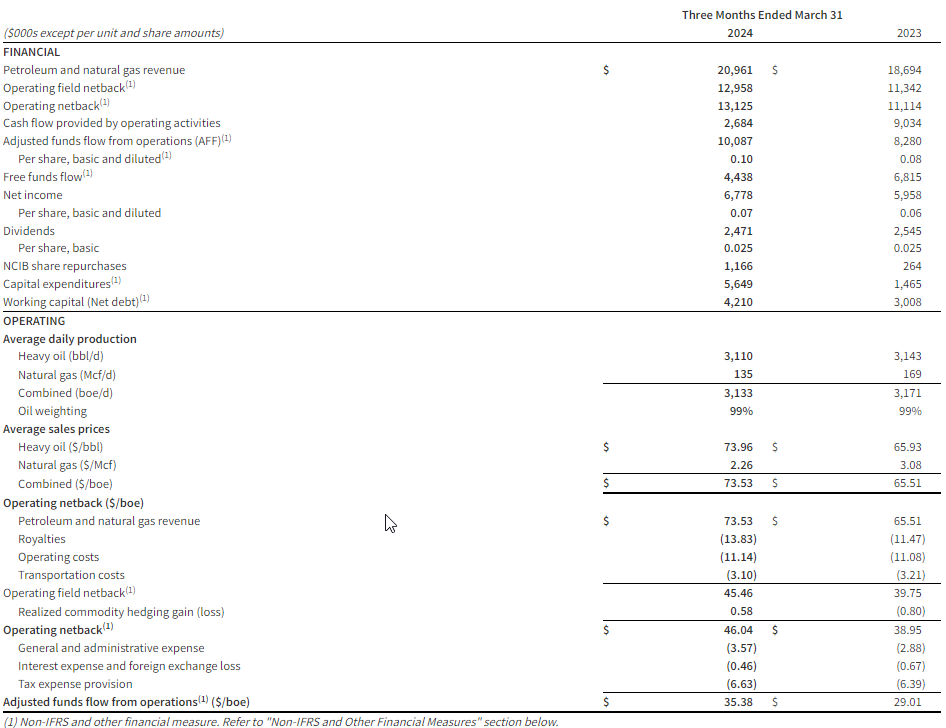
Produced a quarterly average of 3,133 boe/d (99% heavy oil), including significant downtime in January and early February due to extreme cold weather.
Attained quarterly revenue of $21.0 million.
Maintained low operating and transportation costs of $14.24/boe despite reduced quarterly production.
Delivered an operating netback1 of $13.1 million, or $46.04/boe.
Realized quarterly adjusted funds flow from operations (“AFF”)1 of $10.1 million, or $35.38/boe.
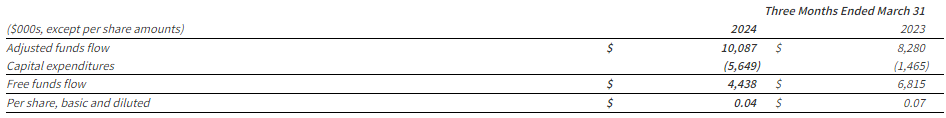
Achieved free funds flow1 of $4.4 million, or $0.04 per share.
Executed a $5.6 million capital expenditure1 program, including drilling five horizontal wells (three producers, two injectors) in the Company’s new Marsden, Saskatchewan oil play.
Received Enhanced Oil Recovery (“EOR”) project approval from the Ministry of Energy and Resources for a pilot polymer flood in Marsden.
Distributed $2.5 million, or $0.025 per share, in dividends to shareholders during the quarter.
Purchased and cancelled 869,100 shares for $1.2 million under the Company’s Normal Course Issuer Bid (“NCIB”).
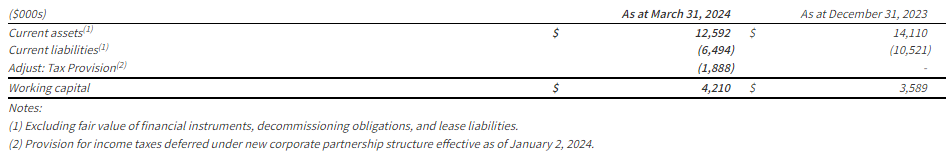
Exited the first quarter with positive working capital1 of $4.2 million, compared to $3.0 million at the end of March 2023.
(1) Operating netback, adjusted funds flow from operations (AFF), free funds flow, capital expenditure, and working capital are non-IFRS measures, or when expressed on a per share or boe basis, non-IFRS ratio, that do not have any standardized meaning under IFRS and therefore may not be comparable to similar measures presented by other entities. Non-IFRS financial measures and ratios are not standardized financial measures under IFRS and may not be comparable to similar financial measures disclosed by other issuers. Refer to the section “Non-IFRS and Other Specified Financial Measures”.
Selected financial and operational highlights should be read in conjunction with Hemisphere’s unaudited consolidated interim financial statements and related notes, and the Management’s Discussion and Analysis for the three months ended March 31, 2024 which are available on SEDAR+ at www.sedarplus.ca and on Hemisphere’s website at www.hemisphereenergy.ca. All amounts are expressed in Canadian dollars unless otherwise noted.
Financial and Operating Summary
Quarterly Dividend
Hemisphere is pleased to announce that its Board of Directors has approved a quarterly cash dividend of $0.025 per common share in accordance with the Company’s dividend policy. The dividend will be paid on June 28, 2024 to shareholders of record as of the close of business on June 20, 2024. The dividend is designated as an eligible dividend for income tax purposes.
Credit Facility
The Company has completed its annual bank review and renewed its $35.0 million two-year extendible credit facility, with the next annual review date set for May 31, 2025.
Operations Update
Hemisphere’s Atlee Buffalo polymer injection projects both continue to perform well, contributing to slight overall corporate production growth. Current production is approximately 3,500 boe/d (99% heavy oil, field estimates between April 1 – May 25, 2024), 3% higher than the fourth quarter of 2023 despite no new wells having been brought online since last September.
In the first quarter of 2024, the Company received EOR project approval from the Ministry of Energy and Resources for a polymer flood pilot in its recently acquired Marsden acreage in Saskatchewan. Subsequently, Hemisphere executed a $5.6 million capital expenditure program, which included drilling five Marsden wells (three producers and two injectors). The Company has recently brought one well on primary production to a single well battery in order to gather initial test data required for EOR project planning. Hemisphere expects to commission a new polymer injection skid and oil treating battery for its Marsden project during the third quarter.
Preparation is also underway for the remainder of Hemisphere’s 2024 capital expenditure program, which includes up to nine new wells in the Atlee Buffalo area being drilled and brought on production to existing facilities later this summer.
Annual General and Special Meeting of Shareholders
Hemisphere’s Annual General and Special Meeting of Shareholders will be held at 10:00 am (Pacific Daylight Time) on May 30, 2024 in the Walker Room of the Terminal City Club located at 837 West Hastings Street, Vancouver, British Columbia.
About Hemisphere Energy Corporation
Hemisphere is a dividend-paying Canadian oil company focused on maximizing value-per-share growth with the sustainable development of its high netback, low decline conventional heavy oil assets through polymer flood enhanced recovery methods. Hemisphere trades on the TSX Venture Exchange as a Tier 1 issuer under the symbol “HME” and on the OTCQX Venture Marketplace under the symbol “HMENF”.
For further information, please visit the Company’s website at www.hemisphereenergy.ca to view its corporate presentation or contact:
Don Simmons, President & Chief Executive Officer Telephone: (604) 685-9255 Email: info@hemisphereenergy.ca
Certain statements included in this news release constitute forward-looking statements or forward-looking information (collectively, “forward-looking statements”) within the meaning of applicable securities legislation. Forward-looking statements are typically identified by words such as “anticipate”, “continue”, “estimate”, “expect”, “forecast”, “may”, “will”, “project”, “could”, “plan”, “intend”, “should”, “believe”, “outlook”, “potential”, “target” and similar words suggesting future events or future performance. In particular, but without limiting the generality of the foregoing, this news release includes forward-looking statements including that the Company expects to commission a new polymer injection skid and oil treating battery for its Saskatchewan production during the third quarter; the timing and execution of Hemisphere’s 2024 capital expenditure program, which includes up to nine new wells in the Atlee Buffalo area being drilled and brought on production to existing facilities later this summer; and that a dividend will be paid June 28, 2024 to shareholders of record as of the close of business on June 20, 2024.
Forward‐looking statements are based on a number of material factors, expectations or assumptions of Hemisphere which have been used to develop such statements and information but which may prove to be incorrect. Although Hemisphere believes that the expectations reflected in such forward‐looking statements or information are reasonable, undue reliance should not be placed on forward‐looking statements because Hemisphere can give no assurance that such expectations will prove to be correct. In addition to other factors and assumptions which may be identified herein, assumptions have been made regarding, among other things: the length of time that oil and gas operations will be impaired by the outbreak of Covid-19; the current and go-forward oil price environment; that Hemisphere will continue to conduct its operations in a manner consistent with past operations; that results from drilling and development activities are consistent with past operations; the quality of the reservoirs in which Hemisphere operates and continued performance from existing wells; the continued and timely development of infrastructure in areas of new production; the accuracy of the estimates of Hemisphere’s reserve volumes; certain commodity price and other cost assumptions; continued availability of debt and equity financing and cash flow to fund Hemisphere’s current and future plans and expenditures; the impact of increasing competition; the general stability of the economic and political environment in which Hemisphere operates; the general continuance of current industry conditions; the timely receipt of any required regulatory approvals; the ability of Hemisphere to obtain qualified staff, equipment and services in a timely and cost efficient manner; drilling results; the ability of the operator of the projects in which Hemisphere has an interest in to operate the field in a safe, efficient and effective manner; the ability of Hemisphere to obtain financing on acceptable terms; field production rates and decline rates; the ability to replace and expand oil and natural gas reserves through acquisition, development and exploration; the timing and cost of pipeline, storage and facility construction and expansion and the ability of Hemisphere to secure adequate product transportation; future commodity prices; currency, exchange and interest rates; regulatory framework regarding royalties, taxes and environmental matters in the jurisdictions in which Hemisphere operates; and the ability of Hemisphere to successfully market its oil and natural gas products.
The forward‐looking statements included in this news release are not guarantees of future performance and should not be unduly relied upon. Such information and statements, including the assumptions made in respect thereof, involve known and unknown risks, uncertainties and other factors that may cause actual results or events to defer materially from those anticipated in such forward‐looking statements including, without limitation: changes in commodity prices; changes in the demand for or supply of Hemisphere’s products, the early stage of development of some of the evaluated areas and zones; unanticipated operating results or production declines; changes in tax or environmental laws, royalty rates or other regulatory matters; changes in development plans of Hemisphere or by third party operators of Hemisphere’s properties, increased debt levels or debt service requirements; inaccurate estimation of Hemisphere’s oil and gas reserve volumes; limited, unfavourable or a lack of access to capital markets; increased costs; a lack of adequate insurance coverage; the impact of competitors; and certain other risks detailed from time‐to‐time in Hemisphere’s public disclosure documents, (including, without limitation, those risks identified in this news release and in Hemisphere’s Annual Information Form).
The forward‐looking statements contained in this news release speak only as of the date of this news release, and Hemisphere does not assume any obligation to publicly update or revise any of the included forward‐looking statements, whether as a result of new information, future events or otherwise, except as may be required by applicable securities laws.
Non-IFRS and Other Financial Measures
This news release contains the terms adjusted funds flow from operations, free funds flow, capital expenditures, operating field netback, operating netback, and working capital/net debt, which are considered “non-IFRS financial measures” and any of these measures calculated on a per boe basis, which are considered “non-IFRS financial ratios”. These terms do not have a standardized meaning prescribed by IFRS. Accordingly, the Company’s use of these terms may not be comparable to similarly defined measures presented by other companies. Investors are cautioned that these measures should not be construed as an alternative to net income (loss) or cashflow from operations determined in accordance with IFRS and these measures should not be considered more meaningful than IFRS measures in evaluating the Company’s performance.
a)Adjusted funds flow from operations (“AFF”) (Non-IFRS Financial Measure and Ratio if calculated on a per share or boe basis): The Company considers AFF to be a key measure that indicates the Company’s ability to generate the funds necessary to support future growth through capital investment and to repay any debt. AFF is a measure that represents cash flow generated by operating activities, before changes in non-cash working capital and adjusted for decommissioning expenditures and may not be comparable to measures used by other companies. The most directly comparable IFRS measure for AFF is cash provided by operating activities. AFF per share is calculated using the same weighted-average number of shares outstanding as in the case of the earnings per share calculation for the period.
A reconciliation of AFF to cash provided by operating activities is presented as follows:
b)Free funds flow (“FFF”) (Non-IFRS Financial Measure): Calculated by taking adjusted funds flow and subtracting capital expenditures, excluding acquisitions and dispositions. Management believes that free funds flow provides a useful measure to determine Hemisphere’s ability to improve returns and to manage the long-term value of the business.
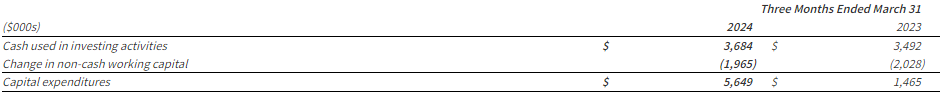
c)Capital Expenditures (Non-IFRS Financial Measure): Management uses the term “capital expenditures” as a measure of capital investment in exploration and production assets, and such spending is compared to the Company’s annual budgeted capital expenditures. The most directly comparable IFRS measure for capital expenditures is cash flow used in investing activities. A summary of the reconciliation of cash flow used in investing activities to capital expenditures is set forth below:
d)Operating field netback (Non-IFRS Financial Measure and Ratio if calculated on a per boe basis): A benchmark used in the oil and natural gas industry and a key indicator of profitability relative to current commodity prices. Operating field netback is calculated as oil and gas sales, less royalties, operating expenses, and transportation costs on an absolute and per barrel of oil equivalent basis. These terms should not be considered an alternative to, or more meaningful than, cash flow from operating activities or net income or loss as determined in accordance with IFRS as an indicator of the Company’s performance.
e)Operating netback (Non-IFRS Financial Measure and Ratio if calculated on a per boe basis): calculated as the operating field netback plus the Company’s realized gain (loss) on derivative financial instruments on an absolute and per barrel of oil equivalent basis.
f)Working Capital/Net debt (Non-IFRS Financial Measure): Closely monitored by the Company to ensure that its capital structure is maintained by a strong balance sheet to fund the future growth of the Company. Working capital/Net debt is used in this document in the context of liquidity and is calculated as the total of the Company’s current assets, less current liabilities, excluding derivative financial instruments, decommissioning obligations, lease liabilities, and tax provisions, and including any bank debt. There is no IFRS measure that is reasonably comparable to working capital/net debt.
The following table outlines the Company calculation of working capital/net debt:
g)Supplementary Financial Measures and Non-IFRS Ratios
“Adjusted Funds Flow from operations per basic share” is comprised of funds from operations divided by basic weighted average common shares. “Adjusted Funds Flow from operations per diluted share” is comprised of funds from operations divided by diluted weighted average common shares. “Annual Free Funds Flow” is comprised of free funds flow from the current three-month period multiplied by four. “Operating expense per boe” is comprised of operating expense, as determined in accordance with IFRS, divided by the Company’s total production. “Realized heavy oil price” is comprised of heavy crude oil commodity sales from production, as determined in accordance with IFRS, divided by the Company’s crude oil production. “Realized natural gas price” is comprised of natural gas commodity sales from production, as determined in accordance with IFRS, divided by the Company’s natural gas production. “Realized combined price” is comprised of total commodity sales from production, as determined in accordance with IFRS, divided by the Company’s total production. “Royalties per boe” is comprised of royalties, as determined in accordance with IFRS, divided by the Company’s total production. “Transportation costs per boe” is comprised of transportation expense, as determined in accordance with IFRS, divided by the Company’s total production.
The Company has provided additional information on how these measures are calculated in the Management’s Discussion and Analysis for the year ended December 31, 2023 and the interim period ended March 31, 2024, which are available under the Company’s SEDAR+ profile at www.sedarplus.ca.
Oil and Gas Advisories
Any references in this news release to initial production rates (including as a result of recent water or polymer flood activities) are useful in confirming the presence of hydrocarbons; however, such rates are not determinative of the rates at which such wells will continue production and decline thereafter and are not necessarily indicative of long-term performance or ultimate recovery. While encouraging, readers are cautioned not to place reliance on such rates in calculating the aggregate production for the Company. Such rates are based on field estimates and may be based on limited data available at this time.
A barrel of oil equivalent (“boe”) may be misleading, particularly if used in isolation. A boe conversion ratio of 6 Mcf:1 Bbl is based on an energy equivalency conversion method primarily applicable at the burner tip and does not represent a value equivalency at the wellhead. In addition, given that the value ratio based on the current price of crude oil as compared to natural gas is significantly different from the energy equivalency of 6:1, utilizing a conversion on a 6:1 basis may be misleading as an indication of value.
Definitions and Abbreviations
bbl
Barrel
Mcf
thousand cubic feet
bbl/d
barrels per day
Mcf/d
thousand cubic feet per day
$/bbl
dollar per barrel
$/Mcf
dollar per thousand cubic feet
boe
barrel of oil equivalent
IFRS
International Financial Reporting Standards
boe/d
barrel of oil equivalent per day
$/boe
dollar per barrel of oil equivalent
US$
United States Dollar
Neither the TSX Venture Exchange nor its Regulation Services Provider (as that term is defined in the policies of the TSX Venture Exchange) accepts responsibility for the adequacy or accuracy of this news release.
CAMARILLO, Calif.–(BUSINESS WIRE)– Salem Media Group, Inc. (OTCQX: SALM) announced Christian Kligora as the new West Region Digital Sales Director on its digital marketing firm, Salem Surround.
Christian brings a wealth of digital marketing and operational experience to Salem with his work for Marketron where he served in an executive leadership position driving business development. Prior to that, Christian had over a decade of building teams and driving revenue and operational growth for Gannett’s Local IQ and its predecessor, ReachLocal where he oversaw the growth and management of many local and regional offices.
Jon Latzer, Vice President, General Manager of Salem Surround, said, “Christian Kligora is a generational find and will help Salem Surround achieve both revenue growth and help with operational efficiencies. We are excited to have him join our expanding team while leading our Western Region to new heights of success.”
“I’m excited to join the fantastic team at Salem Media,” said Christian Kligora. “Joining Salem represents a unique opportunity to contribute to a media landscape that values integrity, innovation, and impact. I am eager to partner with our linear/digital sales teams to explore innovative ways to connect with our audience.”
Christian is based in Denver where he lives with his wife Angela.
ABOUT SALEM MEDIA GROUP:
Salem Media Group is America’s leading multimedia company specializing in Christian and conservative content, with media properties comprising radio, digital media and book and newsletter publishing. Each day Salem serves a loyal and dedicated audience of listeners and readers numbering in the millions nationally. With its unique programming focus, Salem provides compelling content, fresh commentary and relevant information from some of the most respected figures across the Christian and conservative media landscape. Learn more about Salem Media Group, Inc. at www.salemmedia.com.
HOUSTON, May 28, 2024 (GLOBE NEWSWIRE) — Orion Group Holdings, Inc. (NYSE: ORN) (the “Company”), a leading specialty construction company, today announced that it is set to join the broad-market Russell 3000® Index at the conclusion of the 2024 Russell indexes annual reconstitution, effective after the US market opens on July 1, 2024, according to a preliminary list of additions posted May 24, 2024.
Annual Russell indexes reconstitution captures the 4,000 largest US stocks as of April 30, ranking them by total market capitalization. Membership in the US all-cap Russell 3000® Index, which remains in place for one year, means automatic inclusion in the large-cap Russell 1000® Index or small-cap Russell 2000® Index as well as the appropriate growth and value style indexes. FTSE Russell determines membership for its Russell indexes primarily by objective, market-capitalization rankings and style attributes.
“Being included in the Russell Index is an important milestone for Orion and reflects the significant progress we have made transforming the business throughout 2023. Our inclusion in the Russell Index should help expand investor awareness, increase institutional ownership, and provide additional liquidity in our stock,” said Travis Boone, Chief Executive Officer of Orion Group Holdings, Inc. “This milestone was achieved during an exciting time for Orion. With a strong foundation of operational discipline, a vastly improved business development team and a healthy balance sheet, we have set the Company up for success and are focused on driving growth for the remainder of 2024 and beyond.”
Russell indexes are widely used by investment managers and institutional investors for index funds and as benchmarks for active investment strategies. According to the data as of the end of December 2023, about $10.5 trillion in assets are benchmarked against Russell’s US indexes, which belong to FTSE Russell, a prominent global index provider.
About Orion Group Holdings
Orion Group Holdings, Inc., a leading specialty construction company serving the infrastructure, industrial and building sectors, provides services both on and off the water in the continental United States, Alaska, Hawaii, Canada and the Caribbean Basin through its marine segment and its concrete segment. The Company’s marine segment provides construction and dredging services relating to marine transportation facility construction, marine pipeline construction, marine environmental structures, dredging of waterways, channels and ports, environmental dredging, design and specialty services. Its concrete segment provides turnkey concrete construction services including place and finish, site prep, layout, forming, and rebar placement for large commercial, structural and other associated business areas. The Company is headquartered in Houston, Texas with regional offices throughout its operating areas. The Company’s website is located at: https://www.oriongroupholdingsinc.com.
Forward-Looking Statements
The matters discussed in this press release may constitute or include projections or other forward-looking statements within the meaning of the “safe harbor” provisions of Section 27A of the Securities Exchange Act of 1933, as amended, and Section 21E of the Securities Exchange Act of 1934, as amended, of which provisions the Company is availing itself. Certain forward-looking statements can be identified by the use of forward-looking terminology, such as ‘believes’, ‘expects’, ‘may’, ‘will’, ‘could’, ‘should’, ‘seeks’, ‘approximately’, ‘intends’, ‘plans’, ‘estimates’, or ‘anticipates’, or the negative thereof or other comparable terminology, or by discussions of strategy, plans, objectives, intentions, estimates, forecasts, outlook, assumptions, or goals. In particular, statements regarding future operations or results, including those set forth in this press release, and any other statement, express or implied, concerning future operating results or the future generation of or ability to generate revenues, income, net income, gross profit, EBITDA, Adjusted EBITDA, Adjusted EBITDA margin, or cash flow, including to service debt or maintain compliance with debt covenants, and including any estimates, forecasts or assumptions regarding future revenues or revenue growth, are forward-looking statements. Forward-looking statements also include project award announcements, estimated project start dates, anticipated revenues, and contract options which may or may not be awarded in the future. Forward-looking statements involve risks, including those associated with the Company’s fixed price contracts that impacts profits, unforeseen productivity delays that may alter the final profitability of the contract, cancellation of the contract by the customer for unforeseen reasons, delays or decreases in funding by the customer, levels and predictability of government funding or other governmental budgetary constraints, and any potential contract options which may or may not be awarded in the future, and are at the sole discretion of award by the customer. Past performance is not necessarily an indicator of future results. Considering these and other uncertainties, the inclusion of forward-looking statements in this press release should not be regarded as a representation by the Company that the Company’s plans, estimates, forecasts, goals, intentions, or objectives will be achieved or realized. Readers are cautioned not to place undue reliance on these forward-looking statements, which speak only as of the date hereof. The Company assumes no obligation to update information contained in this press release whether as a result of new developments or otherwise, except as required by law.
Please refer to the Company’s 2023 Annual Report on Form 10-K, filed on March 1, 2024 which is available on its website at www.oriongroupholdingsinc.com or at the SEC’s website at www.sec.gov, for additional and more detailed discussion of risk factors that could cause actual results to differ materially from our current expectations, estimates or forecasts.
Contacts: Financial Profiles, Inc. Margaret Boyce 310-622-8247 orn@finprofiles.com
Report Presents the Company’s Environmental, Social and Governance (ESG) Practices and Goals
BOCA RATON, Fla.–(BUSINESS WIRE)–May 22, 2024– The ODP Corporation (“ODP,” or the “Company”) (NASDAQ:ODP), a leading provider of products and services through an integrated business-to-business (B2B) distribution platform and omnichannel presence, today announced the release of its 2024 Corporate Sustainability Report, providing information on the Company’s sustainability practices and goals.
“I am excited to share our accomplishments and vision in our latest report for our People, Planet, and Prosperity—our triple bottom line approach to sustainability—with a strong focus on our 5C Culture,” said Gerry Smith, chief executive officer for The ODP Corporation. “We’re proud of our progress toward our sustainability commitments and goals and we will continue working toward creating a sustainable future for our company, our communities, and our planet.”
The 2024 Corporate Sustainability Report presents the Company’s notable achievements from 2023 and ongoing commitment to achieving its sustainability goals, supporting customers in meeting their sustainability commitments and making positive contributions to local communities. Accomplishments highlighted in the 2024 report include:
Achieved a 36% reduction in greenhouse gas (GHG) emissions from 2019 (MT CO2e Scopes 1 and 2)
Calculated our full scope of GHG inventory for the second year, which helped us set science-based targets and have them validated by SBTi
Delivered a 6.7% blended absolute plastic reduction in private label packaging and e-commerce shipping operations in 2023 from a 2022 baseline
Diverted 92% of waste from landfills across our distribution center network
Raised $5.6 million through in-store and online donations, powered by Round It Up America®,to support Title I public schools
To view the complete 2024 Corporate Sustainability Report or for more information about sustainability at The ODP Corporation, please visit theodpcorp.com/corporate-sustainability.
About The ODP Corporation The ODP Corporation (NASDAQ:ODP) is a leading provider of products, services, and technology solutions through an integrated business-to-business (B2B) distribution platform and omnichannel presence, which includes world-class supply chain and distribution operations, dedicated sales professionals, a B2B digital procurement solution, online presence and a network of Office Depot and OfficeMax retail stores. Through its operating companies Office Depot, LLC; ODP Business Solutions, LLC; Veyer, LLC; and Varis, Inc., The ODP Corporation empowers every business, professional, and consumer to achieve more every day. For more information, visit theodpcorp.com.
MCLEAN, Va., May 20, 2024 /PRNewswire/ — V2X, Inc. (NYSE: VVX) is proud to announce that multiple sites under its operations within the Department of Defense Information Network have been named Facility of the Year by the Defense Information Systems Agency (DISA). These awards recognize exceptional performance across all aspects of the programs.
The DISA Defense Information Systems Network (DISN) Facility of the Year recognizes outstanding DISN facilities for exemplary accomplishments, performance, and contributions made to enhance the effectiveness in which the Department of Defense Information Network is operated, secured, and managed.
Three V2X locations emerged as winners with an additional four earning recognition as runners-up. The three V2X locations were chosen as winners support the Operations, Maintenance and Supply-Europe (OPMAS-E) program, the Enterprise Legacy Voice and Information System (ELVIS) program and the Operations, Maintenance and Defense of Army Communications (OMDAC) program.
“We are deeply honored by the recognition of multiple V2X locations and remain committed to our ongoing commitment to provide enhanced reliability and protection of vital DoD networks across the globe,” said Ken Shreves, Senior Vice President of Global Mission Solutions and Chief Service Delivery and Growth Officer at V2X. “The contributions of OPMAS, OMDAC, and ELVIS to the DISA mission are paramount, and we take great pride in their steadfast dedication to delivering around the clock mission critical IT and communications support in over 10 countries.”
The Facility of the Year winners include:
Europe Red Switch (ELVIS)
Europe Facility Control Office (OPMAS-E)
DISA CENT Large Transmission (OMDAC)
The Facility of Year Runners-Up are:
Europe Small Ankara (ELVIS)
Europe Medium Mildenhall (ELVIS)
Europe Large Landstuhl (OPMAS-E)
Europe Red Switch Patch Barracks (OPMAS-E)
DISA is a combat support agency of the Department of Defense (DoD) and provides, operates, and assures command and control and information-sharing capabilities and a globally accessible enterprise information infrastructure in direct support to joint warfighters, national level leaders, and other mission and coalition partners across the full spectrum of military operations.
About V2X
V2X builds smart solutions designed to integrate physical and digital infrastructure – by aligning people, actions, and outputs. Our lifecycle solutions improve security, streamline logistics, and enhance readiness. The Company delivers a comprehensive suite of integrated solutions across the operations and logistics, aerospace, training, and technology markets to national security, defense, civilian and international clients. Our global team of approximately 16,000 employees brings innovation to every point in the mission lifecycle, from preparation to operations, to sustainment, as it tackles the most complex challenges with agility, grit, and dedication.
Media Contact Angelica Spanos Deoudes Director, Corporate Communications Angelica.Deoudes@goV2X.com 571-338-5195
Investor Contact Mike Smith, CFA Vice President, Treasury, Corporate Development and Investor Relations IR@goV2X.com 719-637-5773
BOCA RATON, Fla.–(BUSINESS WIRE)–May 20, 2024– The GEO Group (NYSE: GEO) (“GEO”) announced today that U.S. Immigration and Customs Enforcement (“ICE”) announced that it plans to issue a task order for the GEO-owned 1,940-bed Adelanto ICE Processing Center in California (the “Adelanto Center”), which provides for continued funding through September 30, 2024.
GEO previously filed motions, on January 4, 2024, with the U.S. District Court, Central District of California, in the case of Roman v. Wolf, to Intervene and to Vacate several injunction orders (collectively the “Orders”) including an intake prohibition order issued more than three years ago, limiting the use of the Adelanto Center based on then-prevailing COVID-19 conditions. GEO was joined in its filings by three unions (collectively the “Unions”) representing over 350 employees at the Adelanto Center. Subsequently, on April 22, 2024, GEO and the Unions filed a renewed motion with the U.S. Court of Appeals for the Ninth Circuit to intervene in the case of Roman v. Wolf, with a proposed motion to stay the Orders. GEO and the Unions will continue to pursue legal action to protect GEO’s and the Unions’ interests, which include the Adelanto Center contract’s annualized revenues and the potential loss of jobs by 350-plus employees.
ICE and GEO entered into a 15-year contract on December 19, 2019, for the provision of secure residential housing and care at the Adelanto Center, consisting of a 5-year base period, ending on December 19, 2024, followed by two 5-year option periods. The Adelanto Center contract generates approximately $85 million in annualized revenues for GEO.
About The GEO Group
The GEO Group, Inc. (NYSE: GEO) is a leading diversified government service provider, specializing in design, financing, development, and support services for secure facilities, processing centers, and community reentry centers in the United States, Australia, South Africa, and the United Kingdom. GEO’s diversified services include enhanced in-custody rehabilitation and post-release support through the award-winning GEO Continuum of Care®, secure transportation, electronic monitoring, community-based programs, and correctional health and mental health care. GEO’s worldwide operations include the ownership and/or delivery of support services for 100 facilities totaling approximately 81,000 beds, including idle facilities and projects under development, with a workforce of up to approximately 18,000 employees.
Use of forward-looking statements
This news release may contain “forward-looking statements” within the meaning of Section 21E of the Securities Exchange Act of 1934, as amended, and the U.S. Private Securities Litigation Reform Act of 1995. Readers are cautioned not to place undue reliance on these forward-looking statements and any such forward-looking statements are qualified in their entirety by reference to the following cautionary statements. All forward-looking statements speak only as of the date of this news release and are based on current expectations and involve a number of assumptions, risks and uncertainties that could cause the actual results to differ materially from such forward-looking statements, including statements regarding GEO’s filings in the case of Roman v. Wolf,statements regarding the Orders, and statements regarding the Adelanto Center contract. Risks and uncertainties that could cause actual results to vary from current expectations and forward-looking statements contained in this press release include, but are not limited to, risk factors contained in GEO’s filings with the U.S. Securities and Exchange Commission, including its Form 10-K, 10-Q, and 8-K reports. GEO disclaims any obligation to update or revise any forward-looking statements.
NEW YORK, May 15, 2024 /PRNewswire/ — Bit Digital, Inc. (Nasdaq: BTBT) (the “Company”), a sustainable platform for digital assets and artificial intelligence (“AI”) infrastructure headquartered in New York City, today announced its unaudited financial results for the First Quarter ended March 31, 2024.
Financial Highlights for the First Quarter of 2024
Total revenue was $30.3 million for the First Quarter of 2024, a 266% increase compared to the First Quarter of 2023. The increase was primarily driven by the commencement of our Bit Digital AI business and by a higher realized bitcoin price.
Revenue from bitcoin mining was $21.9 million for the First Quarter of 2024, a 166% increase compared to the prior year’s quarter. The Company’s Bit Digital AI business, referred to as High performance computing services (“HPC”), began generating revenue in January 2024, and recognized $8.1 million of revenue during the quarter. The Company issued a one-time service credit of $1.3 million to its HPC customer as compensation for decreased utilization during the initial deployment period, which included testing and optimization phases. Illustratively, adding back this credit would yield pro forma gross margins of approximately 72% on a net basis compared to reported gross margins of 61% for the segment. Revenue from ETH staking was approximately $0.3 million.
The Company had cash, cash equivalents and restricted cash of $35.5 million, and total liquidity (defined as cash equivalents and restricted cash, USDC, and the fair market value of digital assets) of approximately $163.21 million, as of March 31, 2024.
Total assets were $291.1 million and Shareholders’ Equity amounted to $265.2 million as of March 31, 2024.
Adjusted EBITDA2 was $58.5 million for the First Quarter of 2024 compared to $1.5 million for the First Quarter of 2023.
GAAP earnings per share was $0.43 on a fully-diluted basis for the First Quarter of 2024 compared to a loss of $0.03 for the First Quarter of 2023.
Operational Highlights for the First Quarter 2024
The Company earned 410.7 bitcoins during the First Quarter of 2024, a 13% increase from the prior year. Growth was primarily driven by a higher active hash rate and partially offset by an increase in network difficulty.
The Company paid approximately $0.05 per kilowatt hour to its hosting partners for electricity consumed during the First Quarter of 2024.
The average fleet efficiency for the active fleet was approximately 28.3 J/TH as of March 31, 2024.
The Company earned 111.1 ETH in native staking and 1.3 ETH in liquid staking, respectively, in the First Quarter of 2024.
Treasury holdings of BTC and ETH were 956.4 and 16,031.43, respectively, with a fair market value of approximately $68.2 million and $58.5 million on March 31, 2024, respectively.
The BTC equivalent4 of our digital asset holdings as of March 31, 2024 (defined as if all ETH and USDC holdings were converted into BTC as of that date) was approximately 1,790.0 BTC5, or approximately $127.7 million.
As of March 31, 2024, we had 48,898 miners owned or operating (in Iceland) for bitcoin mining with a total maximum hash rate of 4.2 EH/S.
The Company’s active hash rate of its bitcoin mining fleet was approximately 2.76 EH/s as of March 31, 2024.
The Company purchased approximately 2,350 bitcoin mining units during the First Quarter of 2024.
Approximately 85% of our fleet’s run-rate electricity consumption was generated from carbon-free energy sources as of March 31, 2024. These figures are based on data provided by our hosts, publicly available sources, and internal estimates, demonstrating our commitment to sustainable practices in the digital asset mining industry.
The Company had approximately 3,008 ETH actively staked in native staking protocols as of March 31, 2024. The decrease relative to the prior quarter was due to the Company changing its provider for native staking solutions. As of April 30, 2024, the Company had approximately 17,184 ETH actively staked in native staking protocols.
On January 22, 2024, approximately 192 servers (1,536 GPUs) began generating revenue from the Company’s AI customer contract. Subsequently, approximately 64 additional servers (512 GPUs) commenced revenue generation on February 2, 2024.
On January 26, 2024, the Company finalized an agreement with Coinmint for up to 6 MW of additional mining capacity at Coinmint’s hosting facility in Massena, New York. This new agreement brings the Company’s total contracted hosting capacity with Coinmint to approximately 46 MW.
Management Commentary
“Our First Quarter 2024 results represent a strong start to the year with revenue growing by more than 250% and GAAP Net Income in excess of $50 million. The primary drivers for the improved performance were the commencement of our Bit Digital AI business and a higher realized bitcoin price.
We were well prepared for the halving which occurred in April 2024. Our balance sheet remains a core strength with over $160 million of total liquidity as of March 31, 2024, zero debt, and a growing revenue stream that is not correlated to the economics of bitcoin mining. While we continue to evaluate the post-halving bitcoin mining landscape, our goal of reaching 6.0 EH/s this year remains intact. We are actively engaged in discussions for both incremental hosting opportunities and potential acquisitions.
We continue to believe that capital allocation optionality provided by our complementary business lines is a key differentiator for our Company. We are actively evaluating a number of growth opportunities, both organic and inorganic, across each of our business lines. We are in the late stages of finalizing an agreement to double the size of the GPU fleet for our anchor client and our negotiations with prospective clients are progressing well. Our target of reaching a $100 million annualized revenue run-rate by year-end for this segment remains intact.”
About Bit Digital
Bit Digital, Inc. is a sustainable platform for digital assets and artificial intelligence (“AI”) infrastructure headquartered in New York City. Our bitcoin mining operations are located in the US, Canada, and Iceland. The Company has established a business line, Bit Digital AI, that offers infrastructure services for artificial intelligence applications. For additional information, please contact ir@bit-digital.com or visit our website at www.bit-digital.com.
Investor Notice
Investing in our securities involves a high degree of risk. Before making an investment decision, you should carefully consider the risks, uncertainties and forward-looking statements described under “Risk Factors” in Item 3.D of our Annual Report on Form 20-F for the fiscal year ended December 31, 2023. If any material risk was to occur, our business, financial condition or results of operations would likely suffer. In that event, the value of our securities could decline and you could lose part or all of your investment. The risks and uncertainties we describe are not the only ones facing us. Additional risks not presently known to us or that we currently deem immaterial may also impair our business operations. In addition, our past financial performance may not be a reliable indicator of future performance, and historical trends should not be used to anticipate results in the future. Future changes in the network-wide mining difficulty rate or bitcoin hash rate may also materially affect the future performance of Bit Digital’s production of bitcoin. Actual operating results will vary depending on many factors including network difficulty rate, total hash rate of the network, the operations of our facilities, the status of our miners, and other factors. See “Safe Harbor Statement” below.
Safe Harbor Statement
This press release may contain certain “forward-looking statements” relating to the business of Bit Digital, Inc., and its subsidiary companies. All statements, other than statements of historical fact included herein are “forward-looking statements.” These forward-looking statements are often identified by the use of forward-looking terminology such as “believes,” “expects,” or similar expressions, involving known and unknown risks and uncertainties. Although the Company believes that the expectations reflected in these forward-looking statements are reasonable, they do involve assumptions, risks and uncertainties, and these expectations may prove to be incorrect. Investors should not place undue reliance on these forward-looking statements, which speak only as of the date of this press release. The Company’s actual results could differ materially from those anticipated in these forward-looking statements as a result of a variety of factors, including those discussed in the Company’s periodic reports that are filed with the Securities and Exchange Commission and available on its website at http://www.sec.gov. All forward-looking statements attributable to the Company or persons acting on its behalf are expressly qualified in their entirety by these factors. Other than as required under the securities laws, the Company does not assume a duty to update these forward-looking statements.
Footnotes:
1 This figure excludes approximately 2,701 ETH that were transferred to an internally managed fund.
2 Adjusted EBITDA refers to earnings before interest expense, income tax expense and depreciation and amortization expense (“EBITDA”) adjusted to eliminate the effects of certain non-cash and / or non-recurring items.
3 This figure excludes approximately 2,701 ETH that were transferred to an internally managed fund.
4 “BTC equivalent” is a hypothetical illustration of the value of our digital asset portfolio in bitcoin terms. BTC equivalent is defined as if all non-BTC digital assets, comprised of ETH and USDC, were converted into BTC as of March 31, 2024, and added to our existing BTC balance. Conversion values are found using the closing price on coinmarketcap.com.
5 This figure excludes approximately 2,701 ETH that were transferred to an internally managed fund.
DENVER, May 15, 2024 /CNW/ – Medicine Man Technologies, Inc., operating as Schwazze, (OTCQX: SHWZ) (Cboe CA: SHWZ) (“Schwazze” or the “Company”), today announced financial and operational results for the first quarter ended March 31, 2024.
“We delivered another period of revenue growth in Q1 as we further refined our retail strategy while contending with the prolonged competitive challenges in Colorado and New Mexico,” said Forrest Hoffmaster, Interim CEO of Schwazze. “Throughout the quarter, we continued to sharpen our pricing and promotional efforts while enhancing the in-store experience, widening assortment, improving in-stock position, and advancing our loyalty program to attract and retain new customers. We also strengthened our wholesale business with quarter-over-quarter growth, while surpassing 30% total door penetration across both states.”
“The Colorado market remains highly competitive with more than 680 active recreational licenses, underscoring the importance of delivering an exceptional customer experience and fully integrated retail support program. Although retail pricing has recently stabilized, Colorado sales in Q1 were down 10% year-over-year due to lower volumes. Nonetheless, we significantly outpaced the market as our sales were up 9%, demonstrating the effectiveness of our operating playbook to compete in challenging environments. We expect to continue driving improvements in customer acquisition, retention, and loyalty as we further increase market share in the state.”
“In New Mexico, the proliferation of new licenses continued to outpace state cannabis sales as store count in Q1 increased 31% year-over-year while the market grew only 13%. In addition to pricing and promotional efforts, we’ve focused on driving traffic into our stores by expanding assortment with high quality flower and delivering an elevated customer experience. The New Mexico regulatory body has also increased its license enforcement efforts in recent months, contributing to more than 70 store closures and a 33% sequential decrease in net new store openings in the first quarter. We will continue to support the New Mexico Cannabis Control Division as it develops its regulatory framework.”
“Over the past four years we have rapidly scaled our footprint through 13 acquisitions, building a leading retail presence in both Colorado and New Mexico. We are beginning to see positive momentum from our pricing and promotional strategy and will remain focused on driving operating efficiencies while further optimizing our assets as we consolidate cultivation facilities and eliminate underperforming stores that do not meet our high-margin thresholds. We believe these initiatives, coupled with our operating playbook and strict cost controls, will enable us to return to stronger levels of profitability moving forward.”
First Quarter 2024 Financial Summary
Announced the grand opening of a medical and recreational dispensary in March under the Everest Apothecary banner in Las Cruces, New Mexico, increasing the Company’s retail footprint to 34 stores across the state.
Increased wholesale penetration in the first quarter to more than 30% of total doors in Colorado and New Mexico.
Lowell Herb Co. pre-roll sales increased more than 3x quarter-over-quarter in Colorado, where it continues to be the #1 pre-roll in the state.
Wana gummy sales up more than 2x quarter-over-quarter in New Mexico.
First Quarter 2024 Financial Results
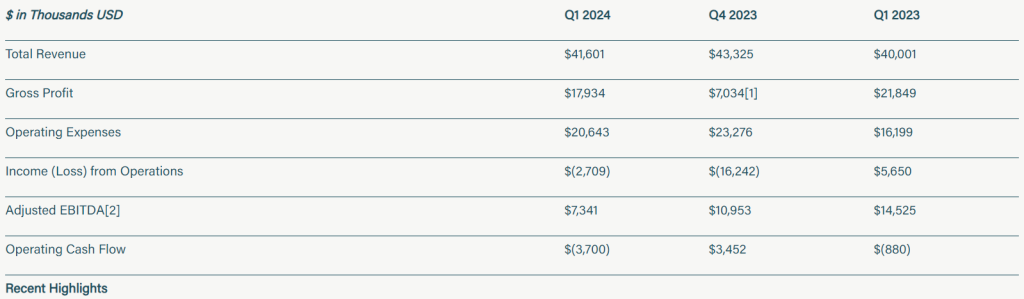
Total revenue in the first quarter of 2024 increased 4% to $41.6 million compared to $40.0 million for the same quarter last year. The increase was primarily due to growth from new stores compared to the prior year period, partially offset by continued pricing pressure and the proliferation of new licenses in New Mexico.
Gross profit for the first quarter of 2024 was $17.9 million or 43.1% of total revenue, compared to $21.8 million or 54.6% of total revenue for the same quarter last year. The decrease in gross margin was primarily driven by the aforementioned pricing pressure in New Mexico, as well as higher medical sales mix in Colorado.
____________________________
1 Q4 2023 Gross Profit includes one-time, non-cash inventory adjustments of approximately $13.1 million comprised of $3.1 million of product consolidation, obsolescence, and shrinkage expenses, $4.3 million of net realizable value adjustments, and $5.8 million of fair value adjustments on acquired inventory in New Mexico in 2023. 2 Adjusted EBITDA is a non-GAAP measure as defined by the SEC, and represents earnings before interest, taxes, depreciation, and amortization, adjusted for other income, non-cash share-based compensation, one-time transaction related expenses, or other non-operating costs. The Company uses Adjusted EBITDA as it believes it better explains the results of its core business. See “ADJUSTED EBITDA RECONCILIATION (NON-GAAP)” section herein for an explanation and reconciliations of non-GAAP measure used throughout this release.
Operating expenses for the first quarter of 2024 were $20.6 million compared to $16.2 million for the same quarter last year. The year-ago period benefitted from a payroll tax credit of $3.9M. The remaining increase was primarily driven by personnel expenses and four-wall SG&A costs associated with 21 additional stores in Colorado and New Mexico that are still ramping.
Loss from operations for the first quarter of 2024 was $2.7 million compared to income from operations of $5.6 million in the same quarter last year. Net loss was $16.1 million for the first quarter of 2024 compared to net income of $1.7 million for the same quarter last year.
Adjusted EBITDA for the first quarter of 2024 was $7.3 million compared to $14.5 million for the same quarter last year. The decrease in Adjusted EBITDA was primarily driven by lower gross margin and higher operating expenses associated with the 21 additional stores that are still ramping.
As of March 31, 2024, cash and cash equivalents were $13.2 million compared to $19.2 million on December 31, 2023. Total debt as of March 31, 2024, was $159.7 million compared to $156.8 million on December 31, 2023.
Conference Call
The Company will conduct a conference call today, May 15, 2024, at 5:00 p.m. Eastern time to discuss its results for the first quarter ended March 31, 2024.
Schwazze management will host the conference call, followed by a question-and-answer period. Interested parties may submit questions to the Company prior to the call by emailing ir@schwazze.com.
Date: Wednesday, May 15, 2024 Time: 5:00 p.m. Eastern time Toll-free dial-in: (888) 664-6383 International dial-in: (416) 764-8650 Conference ID: 84167910 Webcast: SHWZ Q1 2024 Earnings Call
The conference call will also be broadcast live and available for replay on the investor relations section of the Company’s website at https://ir.schwazze.com.
If you have any difficulty registering or connecting with the conference call, please contact Elevate IR at (720) 330-2829.
About Schwazze
Schwazze (OTCQX: SHWZ) (Cboe CA: SHWZ) is building a premier vertically integrated regional cannabis company with assets in Colorado and New Mexico and will continue to explore taking its operating system to other states where it can develop a differentiated regional leadership position. Schwazze is the parent company of a portfolio of leading cannabis businesses and brands spanning seed to sale.
Schwazze is anchored by a high-performance culture that combines customer-centric thinking and data science to test, measure, and drive decisions and outcomes. The Company’s leadership team has deep expertise in retailing, wholesaling, and building consumer brands at Fortune 500 companies as well as in the cannabis sector.
Medicine Man Technologies, Inc. was Schwazze’s former operating trade name. The corporate entity continues to be named Medicine Man Technologies, Inc. Schwazze derives its name from the pruning technique of a cannabis plant to enhance plant structure and promote healthy growth. To learn more about Schwazze, visit https://schwazze.com/.
Forward-Looking Statements
This press release contains “forward-looking statements” within the meaning of the U.S. Private Securities Litigation Reform Act of 1995, Section 27A of the Securities Act of 1933, as amended, and Section 21E of the Securities Exchange Act of 1934, as amended. These forward-looking statements include financial outlooks; any projections of net sales, earnings, or other financial items; any statements of the strategies, plans and objectives of our management team for future operations; expectations in connection with the Company’s previously announced business plans; any statements regarding future economic conditions or performance; and statements regarding the intent, belief or current expectations of our management team. Such statements may be preceded by the words “may,” “will,” “could,” “would,” “should,” “expect,” “intends,” “plans,” “strategy,” “prospects,” “anticipate,” “believe,” “approximately,” “estimate,” “predict,” “project,” “potential,” “continue,” “ongoing,” or the negative of these terms or other words of similar meaning in connection with a discussion of future events or future operating or financial performance, although the absence of these words does not necessarily mean that a statement is not forward-looking. We have based our forward-looking statements on management’s current expectations and assumptions about future events and trends affecting our business and industry. Although we do not make forward-looking statements unless we believe we have a reasonable basis for doing so, we cannot guarantee their accuracy. Therefore, forward-looking statements are not guarantees of future events or performance, are based on certain assumptions, and are subject to various known and unknown risks and uncertainties, many of which are beyond the Company’s control and cannot be predicted or quantified. Consequently, actual events and results may differ materially from those expressed or implied by such forward-looking statements. Such risks and uncertainties include, without limitation, risks and uncertainties associated with (i) regulatory limitations on our products and services and the uncertainty in the application of federal, state, and local laws to our business, and any changes in such laws; (ii) our ability to manufacture our products and product candidates on a commercial scale on our own or in collaboration with third parties; (iii) our ability to identify, consummate, and integrate anticipated acquisitions; (iv) general industry and economic conditions; (v) our ability to access adequate capital upon terms and conditions that are acceptable to us; (vi) our ability to pay interest and principal on outstanding debt when due; (vii) volatility in credit and market conditions; (viii) the loss of one or more key executives or other key employees; and (ix) other risks and uncertainties related to the cannabis market and our business strategy. More detailed information about the Company and the risk factors that may affect the realization of forward-looking statements is set forth in the Company’s filings with the Securities and Exchange Commission (SEC), including the Company’s Annual Report on Form 10-K and its Quarterly Reports on Form 10-Q. Investors and security holders are urged to read these documents free of charge on the SEC’s website at http://www.sec.gov. The Company assumes no obligation to publicly update or revise its forward-looking statements as a result of new information, future events or otherwise except as required by law.
Investor Relations Contact Sean Mansouri, CFA or Aaron D’Souza Elevate IR (720) 330-2829 ir@schwazze.com
MEDICINE MAN TECHNOLOGIES, INC. CONDENSED CONSOLIDATED BALANCE SHEETS For the Periods Ended March 31, 2024 and December 31, 2023 Expressed in U.S. Dollars
Cash dividends of $0.15 per share consisting of a quarterly cash dividend of $0.025 per share for Q1 2024 and a special cash dividend of $0.125 per share
Total cash dividends of $1.60 per share, or $29.6 million, declared since March 2022
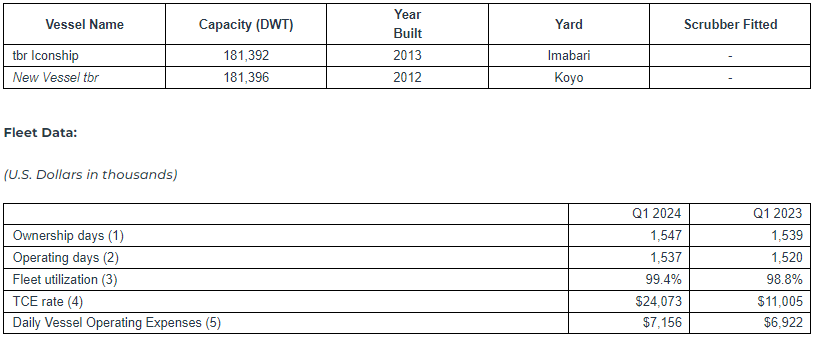
Acquisition of two Japanese Capesize vessels, built in 2013 and 2012, with estimated deliveries in Q2 and H2 2024, respectively
New financing and refinancing transactions of $58.3 million
ATHENS, Greece, May 15, 2024 (GLOBE NEWSWIRE) — Seanergy Maritime Holdings Corp. (“Seanergy” or the “Company”) (NASDAQ: SHIP), announced today its financial results for the first quarter ended March 31, 2024. The Company also declared a quarterly cash dividend of $0.025 per common share and a special cash dividend of $0.125 per common share for the first quarter of 2024.
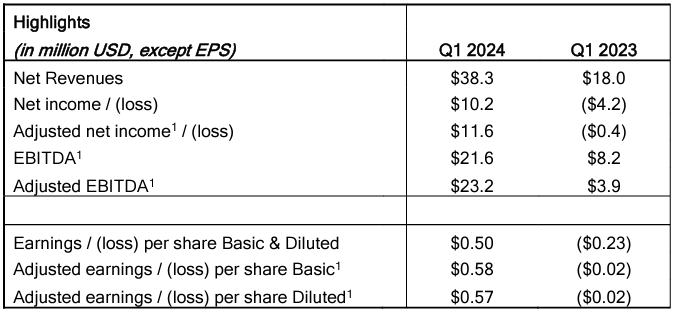
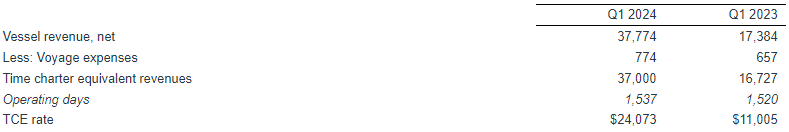
For the quarter ended March 31, 2024, the Company generated Net Revenues of $38.3 million, compared to $18.0 million in the first quarter of 2023. Net Income and Adjusted Net Income for the quarter were $10.2 million and $11.6 million, respectively, compared to Net Loss of $4.2 million and Adjusted Net Loss of $0.4 million in the first quarter of 2023. EBITDA and Adjusted EBITDA for the quarter were $21.6 million and $23.2 million, respectively, compared to $8.2 million and $3.9 million, respectively, for the same period of 2023. The daily Time Charter Equivalent (“TCE”2) of the fleet for the first quarter of 2024 was $24,073, compared to $11,005 in the same period of 2023.
Cash and cash-equivalents and restricted cash, as of March 31, 2024, stood at $24.2 million. Stockholders’ equity at the end of the first quarter was $240.6 million. Long-term debt (senior loans, finance lease liability and other financial liabilities) net of deferred charges stood at $223.2 million, while the book value of the fleet, including a chartered-in vessel and the advances for vessels acquisitions, was $442.0 million.
__________________________ 1 Adjusted earnings / (loss) per share, Adjusted Net Income / (loss), EBITDA and Adjusted EBITDA are non-GAAP measures. Please see the reconciliation below of Adjusted earnings / (loss) per share, Adjusted Net Income / (loss), EBITDA and Adjusted EBITDA to net income, the most directly comparable U.S. GAAP measure. 2 TCE rate is a non-GAAP measure. Please see the reconciliation below of TCE rate to net revenues from vessels, the most directly comparable U.S. GAAP measure.
Stamatis Tsantanis, the Company’s Chairman & Chief Executive Officer, stated:
“We are pleased to report that in the first quarter of 2024 we achieved record profits on the back of the continuing positive momentum in the Capesize market. This was mainly driven by higher iron ore exports, healthy coal volumes, as well as certain geopolitical events.
“Seanergy generated a net income of $10.2 million, compared to a net loss of $4.2 million in the same period of 2023, as our fleet performed in line with the market with a daily time charter equivalent of approximately $24,000.
“In light of our strong performance and consistent with our commitment to rewarding our shareholders, our Board authorized paying a quarterly and special cash dividend of $0.15 per share. With these dividends, we have declared total cash dividends of $1.60 per share, or $29.6 million, since March 2022. Given the strong Capesize outlook, we are optimistic that we are well-positioned to continue executing on our clear corporate strategy, which entails rewarding our shareholders generously while growing and renewing our fleet.
“With regard to our guidance for the second quarter of 2024, based on current FFA levels, we expect our daily TCE to be equal to approximately $26,400, likely outperforming the Capesize market thanks to our proactive hedging strategy. Looking beyond that, for the second half of the year we have converted about 33% of our ownership days to a fixed daily rate of approximately $30,000. We remain vigilant on market developments and are keen to secure attractive daily rates that offer high returns on capital.
“Moving on to fleet developments since our last quarterly update, in March we agreed to acquire an additional Capesize vessel built in 2012 in Japan for a price of $35.6 million that we expect to fund through a combination of cash on hand and debt. Delivery is expected to take place in the second half of 2024, while we continue to evaluate opportunities to add high-performing ships to our fleet. Furthermore, we recently obtained credit committee approval from one of our close lending partners for a new sale and leaseback agreement to finance the previously announced acquisition of the M/V Iconship along with the refinancing of an existing facility at a considerably lower interest margin.
“To conclude with a brief market update, contrary to regular seasonality, the first quarter of 2024 was the strongest of the past decade for Capesize earnings. Brazilian iron ore exports rose about 12% year on year and were the highest since 2019, while coal seaborne trade remained at very high levels. The limited vessel orderbook of the past years seems to be contributing to a gradually improving supply and demand balance, while the geopolitical uncertainty related to the Red Sea crisis has also been marginally constructive for Capesize earnings. On a forward-looking note, the current orderbook suggests fleet growth of about 2% per year for 2025 and 2026, which will likely be surpassed by vessel demand growth according to most industry sources. Longer term, the commitment of major miners to future growth projects as well as the limits on fleet growth brought about by stricter environmental regulations are expected to lead to strong market conditions.
“Seanergy has proven its ability to execute on its fleet growth plan and with its high-quality vessels, strong balance sheet and successful commercial strategy, is well positioned to continue creating shareholder value.”
Company Fleet:
(1) The Company has the option to convert the index-linked rate to fixed for periods ranging between 1 and 12 months, based on the prevailing Capesize FFA Rate for the selected period.
(2) The latest redelivery date does not include any additional optional periods.
(3) The vessel is operated by the Company on the basis of a 12-month bareboat charter-in contract with the owners of the vessel, including a purchase option at the end of the bareboat charter.
Vessels to be delivered:
(1) Ownership days are the total number of calendar days in a period during which the vessels in a fleet have been owned or chartered in. Ownership days are an indicator of the size of the Company’s fleet over a period and affect both the amount of revenues and the amount of expenses that the Company recorded during a period.
(2) Operating days are the number of available days in a period less the aggregate number of days that the vessels are off-hire due to unforeseen circumstances. Available days are the number of ownership days less the aggregate number of days that our vessels are off-hire due to major repairs, dry-dockings, lay-up or special or intermediate surveys. Operating days include the days that our vessels are in ballast voyages without having finalized agreements for their next employment. The Company’s calculation of operating days may not be comparable to that reported by other companies.
(3) Fleet utilization is determined by dividing operating days by ownership days for the relevant period. Fleet Utilization is used to measure a company’s ability to efficiently find suitable employment for its vessels and minimize the number of days that its vessels are off-hire for unforeseen events. We believe it provides additional meaningful information and assists management in making decisions regarding areas where we may be able to improve efficiency and increase revenue and because we believe that it provides useful information to investors regarding the efficiency of our operations.
(4) TCE rate is defined as the Company’s net revenue less voyage expenses during a period divided by the number of the Company’s operating days during the period. Voyage expenses include port charges, bunker (fuel oil and diesel oil) expenses, canal charges and other commissions. The Company includes the TCE rate, which is not a recognized measure under U.S. GAAP, as it believes it provides additional meaningful information in conjunction with net revenues from vessels, the most directly comparable U.S. GAAP measure, and because it assists the Company’s management in making decisions regarding the deployment and use of our vessels and because the Company believes that it provides useful information to investors regarding our financial performance. The Company’s calculation of TCE rate may not be comparable to that reported by other companies. The following table reconciles the Company’s net revenues from vessels to the TCE rate.
(In thousands of U.S. Dollars, except operating days and TCE rate)
(5) Vessel operating expenses include crew costs, provisions, deck and engine stores, lubricants, insurance, maintenance and repairs. Daily Vessel Operating Expenses are calculated by dividing vessel operating expenses, excluding pre delivery costs, by ownership days for the relevant time periods. The Company’s calculation of daily vessel operating expenses may not be comparable to that reported by other companies. The following table reconciles the Company’s vessel operating expenses to daily vessel operating expenses.
(In thousands of U.S. Dollars, except ownership days and Daily Vessel Operating Expenses)
Earnings Before Interest, Taxes, Depreciation and Amortization (“EBITDA”) represents the sum of net income / (loss), Interest and finance costs, net, depreciation and amortization and income taxes, if any, during a period. EBITDA is not a recognized measurement under U.S. GAAP. Adjusted EBITDA represents EBITDA adjusted to exclude stock-based compensation, loss on forward freight agreements, net, loss on extinguishment of debt, and the gain on sale of vessel, which the Company believes are not indicative of the ongoing performance of its core operations.
EBITDA and adjusted EBITDA are presented as we believe that these measures are useful to investors as a widely used means of evaluating operating profitability. Management also uses these non-GAAP financial measures in making financial, operating and planning decisions and in evaluating the Company’s performance. EBITDA and adjusted EBITDA as presented here may not be comparable to similarly titled measures presented by other companies. These non-GAAP measures should not be considered in isolation from, as a substitute for, or superior to, financial measures prepared in accordance with U.S. GAAP.
Adjusted Net income / (loss) Reconciliation and calculation of Adjusted Earnings / (loss) Per Share
(In thousands of U.S. Dollars, except for share and per share data)
To derive Adjusted Net Income / (loss) and Adjusted Earnings / (loss) Per Share, both non-GAAP financial measures, from Net Income / (loss), we exclude non-cash items, as provided in the table above. We believe that Adjusted Net Income / (loss) and Adjusted Earnings / (loss) Per Share assist our management and investors by increasing the comparability of our performance from period to period since each such measure eliminates the effects of such non-cash items as stock based compensation, loss on extinguishment of debt and other items which may vary from year to year, for reasons unrelated to overall operating performance. In addition, we believe that the presentation of the respective measure provides investors with supplemental data relating to our results of operations, and therefore, with a more complete understanding of factors affecting our business than with GAAP measures alone. Our method of computing Adjusted Net Income / (loss) and Adjusted Earnings / (loss) Per Share may not necessarily be comparable to other similarly titled captions of other companies due to differences in methods of calculation.
Second Quarter 2024 TCE Guidance:
As of the date hereof, approximately 79% of the Company fleet’s expected operating days in the second quarter of 2024 have been fixed at an estimated TCE of approximately $27,115. Assuming that for the remaining operating days of our index-linked T/Cs, the respective vessels’ TCE will be equal to the average Forward Freight Agreement (“FFA”) rate of $24,200 per day (based on the FFA curve of April 29, 2024), our estimated TCE for the second quarter of 2024 will be approximately $26,4083. The following table provides the break-down of index-linked charter and fixed-rate charters in the second quarter of 2024:
3 This guidance is based on certain assumptions and there can be no assurance that these TCE estimates, or projected utilization will be realized. TCE estimates include certain floating (index) to fixed rate conversions concluded in previous periods. For vessels on index-linked T/Cs, the TCE realized will vary with the underlying index, and for the purposes of this guidance, the TCE assumed for the remaining operating days of the quarter for an index-linked T/C is equal to the average FFA rate of $24,200 based on the curve of April 29, 2024. Spot estimates are provided using the load-to-discharge method of accounting. The rates quoted are for days currently contracted. Increased ballast days at the end of the quarter will reduce the additional revenues that can be booked based on the accounting cut-offs and therefore the resulting TCE will be reduced accordingly.
First Quarter and Recent Developments:
Distribution of Q4 2023 Dividend and Declaration of Q1 2024 Dividends
On April 10, 2024, the Company paid a quarterly dividend of $0.025 per share and a special dividend of $0.075 per share, for the fourth quarter of 2023, to all shareholders of record as of March 25, 2024.
Continuing its quarterly dividend payments, the Company has declared a quarterly cash dividend of $0.025 per common share for the first quarter of 2024 payable on or about July 10, 2024 to all shareholders of record as of June 25, 2024. In addition, the Company has declared a special dividend of $0.125 per common share to all shareholders of record as of June 25, 2024 which will be paid on or about July 10, 2024.
At-The-Market Offering Program
Since the filing of the Company’s annual report, the Company has issued and sold 267,585 common shares at an average price of $9.67 per share, resulting in gross proceeds of $2.6 million under the up to $30.0 million “at-the-market” equity offering program initiated in December 2023 with B. Riley as sales agent.
As of May 13, 2024, the Company had 20,779,660 common shares issued and outstanding.
Vessel Transactions and Commercial Updates
Vessel Acquisitions
On February 5, 2024, the Company agreed to acquire a 181,392 dwt Capesize bulk carrier, built in 2013 in Japan, which will be renamed M/V Iconship. The purchase price of $33.7 million is expected to be funded through cash on hand and the AVIC Sale & leaseback agreement. The M/V Iconship is expected to be delivered to the Company within June 2024.
On March 18, 2024, the Company agreed to acquire a 181,396 dwt Capesize bulk carrier, built in 2012 in Japan. The purchase price of $35.6 million is expected to be funded through a combination of cash on hand and debt financing. The vessel is expected to be delivered to the Company between July and October 2024.
M/V Knightship – Time charter extension
In May 2024, the charterer of the M/V Knightship exercised the second optional period extending the time charter which will commence in December 2024. The extension period is for a minimum of 11 months to a maximum of 13 months, while all other main terms of the time charter remain the same.
Financing Updates
AVIC Sale & leaseback agreement
The Company obtained credit committee approval from one of its close lending partners for three separate sale and leaseback agreements of $58.3 million in aggregate to refinance the sale and leaseback agreements with CMBFL, secured by the M/Vs Hellasship and Patriotship, and to partially finance the acquisition of the M/V Iconship. The vessels will be sold and chartered back on a bareboat basis for a five-year period commencing on each delivery date. The Company will have continuous options to repurchase the vessels at predetermined prices at any time of the bareboat charter. At the end of the bareboat period, Seanergy will have the obligation to purchase the vessels for an aggregate amount of approximately $31.5 million. Each financing will bear interest of 3-month term SOFR plus 2.55% per annum. The new interest rate will be approximately 120 bps lower than the rate of the refinanced sale and leaseback agreements. In aggregate for the three vessels, the charterhire principals will amortize over twenty consecutive quarterly installments, averaging approximately $1.3 million per quarter. The agreements are subject to the completion of definitive documentation.
Conference Call:
The Company’s management will host a conference call to discuss financial results on May 15, 2024 at 10:00 a.m. Eastern Time.
Audio Webcast:
There will be a live, and then archived, webcast of the conference call available through the Company’s website. To listen to the archived audio file, visit our website, following the Webcasts & Presentations section under our Investor Relations page. Participants to the live webcast should register on the Seanergy website approximately 10 minutes prior to the start of the webcast, following this link.
Conference Call Details:
Participants have the option to register for the call using the following link. You can use any number from the list or add your phone number and let the system call you right away.