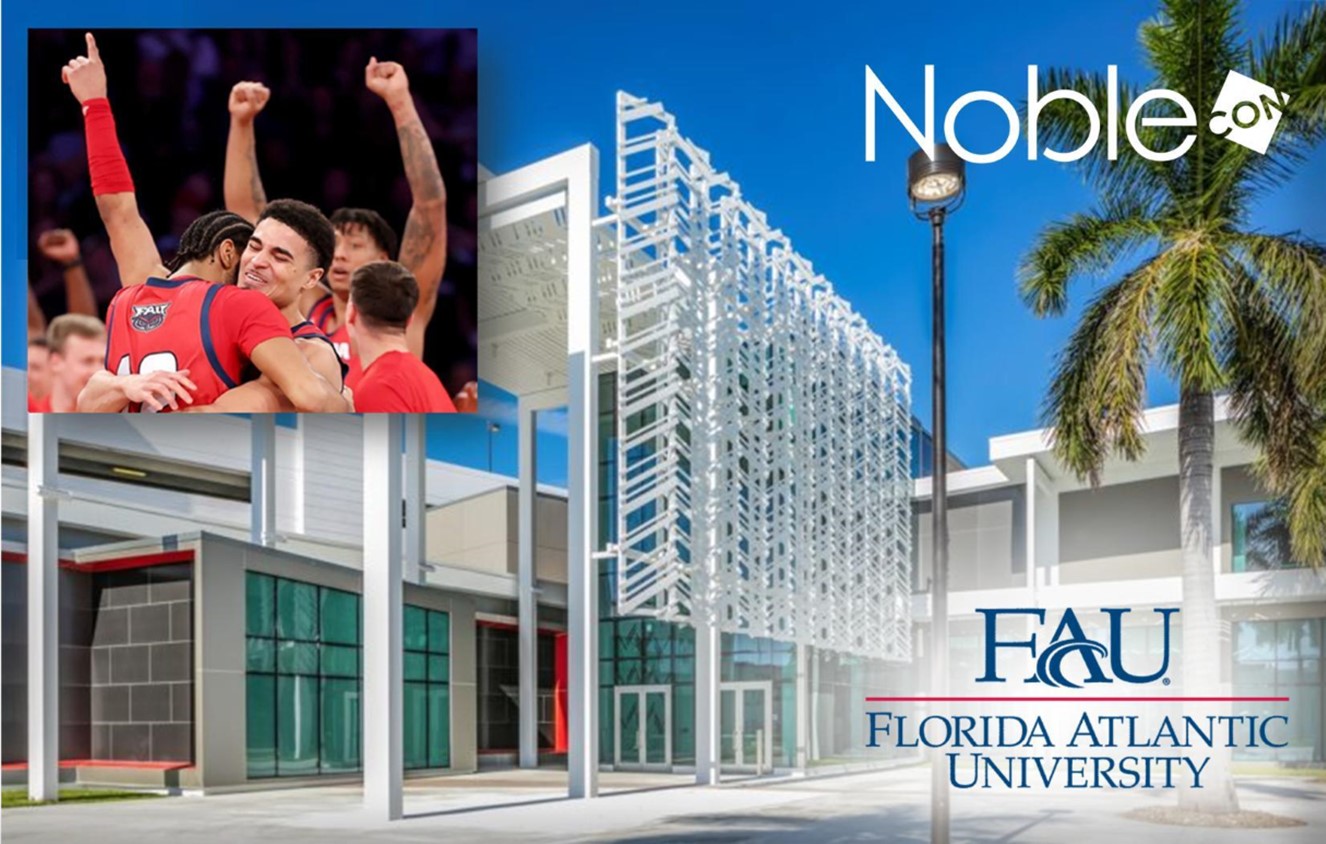
Pictured: The FAU Owls celebrating their trip to the Final Four | The College of Business, Executive Education at Florida Atlantic University
When Noble Capital Markets (Noble) released the December dates for its 19th Annual Investor Conference to be held at Florida Atlantic University, many had the question, “FAU, who?” Well, that’s all changed, big time. The unlikely trek of the FAU Owls to the NCAA men’s basketball Final Four has just about everyone talking. NBA icon Magic Johnson tweeted “When the 64 teams were announced, nobody could have picked Florida Atlantic to go to the Final Four. I think this has been the most unbelievable NCAA Tournament I’ve ever seen.” Former Miami Heat star Dwayne Wade told ESPN, “No one believed in them… they’re playing with so much toughness, so much focus, so much confidence.” Even their heartbreaking loss to San Diego State, by one point at the buzzer, has not stopped the accolades. And the team remains proud of their accomplishments on and off the court. FAU guard Nick Boyd told reporters, “I’m happy for our team. I mean, we put FAU on the map. That’s most important to me.”
While that map of awareness certainly has been broadened by the Owls Final Four run, FAU is far from unknown, at least in Florida. Since opening its doors in 1964, enrollment has steadily grown, now with more than 30,000 undergraduate and graduate students (and more that 184,000 alumni) across six campuses, with its main campus in the heart of Boca Raton, FL. FAU has nationally ranked programs in business, engineering, computer science, nursing, and online education. It is ranked as a top university by U.S. News and World Report. It’s number one in Florida for ethnic diversity. FAU is home to the FAU Stiles-Nicholson Brain Institute on the Jupiter campus, a hub of neuroscience activity. And, it has partnered with the world renowned Max Planck Florida Institute for Neuroscience on the FAU High School – Jupiter Campus, the FAU Max Planck Honors Program, the Integrative Biology-Neuroscience program, and the International Max Planck Research School for Synapses & Circuits to offer high school, undergraduate and graduate students transformational experiences not found anywhere else in the world.
The accomplishments of Florida Atlantic are nothing new to Noble. They have worked with the university for more than a decade and were instrumental in the development of the Equity Research Analyst program. Noble has employed several FAU graduates and sponsored enrolled students through intern programs. It was always the goal of Noble to hold its annual investor conference at FAU, but until recently it was logistically impossible. That’s where the College of Business, Executive Education, newly christened, 52,000 square foot complex comes in. It propels NobleCon to the most technically superior conference experience on the circuit. “World Class” is an understatement, particularly when compared to traditional hotel-based conferences. Each presentation room is equipped with multi-screen viewing options, complete soundproofing, full recording, and worldwide webcasting capabilities, even memory foam seating. Add to that the university’s centralized South Florida location is right next to the Boca Raton Airport and less than a mile from Interstate 95. The complex’s 800 (free) covered parking spots complete the picture.
The presentation rooms at the College of Business, Executive Education at Florida Atlantic University
Because of Channelchek’s affiliation with Noble, we’ll be updating guests on all developments leading up to NobleCon19, December 3-5, including keynotes, participating companies, sponsors, and entertainment. Anyone who is registered for Channelchek can attend. So, while there may be many more questions to be answered about NobleCon, we don’t think that “FAU, who?” will be one of them. The Owls have established a new definition for FAU: Fantastic, Awesome, Unbelievable. Congratulations on your remarkable run!
Michael Heim, CFA, Senior Research Analyst, Noble Capital Markets, Inc.
Refer to the bottom of the report for important disclosures
OPEC cut boosts oil prices and energy stocks, offsetting last quarter’s underperformance in one day. OPEC announced a 1 million bbls./day voluntary production cut causing oil prices to rise 6.3% to a level near $80/bbl. and the XLE Energy Index to rise 4.5% the day after the announcement.
If domestic producers had the ability to expand production, they would have already. In the past, domestic production has risen in response to higher oil prices. In recent years, however, rig count has not increase as much as one would expect given the rise in oil prices. We believe the low rig count reflects a decrease in the number of economically feasible drilling locations. We would note that producers are generally able to produce oil at a cost of $30-$40/bbl. well below oil prices. If producers had the ability to ramp up drilling, we would have thought they would have done so even at $60/bbl. prices.
Horizontal drilling and fracking have increased production decline curves putting companies on a treadmill just to maintain production. More than half of domestic production comes from wells drilled in the last 24 months. The implication is that domestic oil producers are hard pressed to drill enough wells to offset production declines, let alone increase overall production to counter production declines by OPEC. As a result, we believe oil prices could remain high for many years.
Small producers and companies with a large drilling portfolio are best positioned. Larger producers continue to be constrained from expanding oil operations given political and shareholder pressures to move away from carbon-based energy. Smaller producers face less pressure. Companies with ample acreage and drilling prospects are best positioned to take advantage of a prolonged oil price upcycle.
Look for an increased focus on returning capital to shareholders. After several years of high energy prices, many companies have paid down debt and invested in infrastructure. With drilling prospects limited, we believe management will increasing look to raise dividends or repurchase shares.
Energy Stocks
Energy stocks, as measured by the XLE Energy Index, declined 5.3% in the 2023 first quarter. The decline was a sharp contrast to the 7.0% increase in the S&P 500 Index. The decline comes after several years of strong performances for energy stocks and reflects a 5.7% decrease in oil prices and a 50.5% decrease in natural gas prices. Worthy of note, as we are writing this report on April 3rd, oil prices have risen 6.3% and the XLE Energy Index is up 4.5% in response to an announcement by OPEC+ to reduce production by more than 1 million barrels per day. Following the announcement, oil prices settled above $80/bbl. almost reaching the price at the end of 2022.
Figure #1
If the cuts are adhered to, it will represent a significant increase in the excess production capacity of OPEC+. The surplus has grown steadily since the pandemic surpassing 5 million bbls./day according to the U.S. Energy Information Administration. That surplus had begun to decrease as the pandemic eased and global oil demand returned to normal levels. A reduction in production levels would return surplus capacity to pandemic levels.
Figure #2
With OPEC+ reducing production and oil prices rising, it will be interesting to see if producers in North America will respond by increasing production. In the past, when oil prices rose sharply, producers responded by drilling more wells. The advent of horizontal drilling and fracking over the last 15 years has greatly improved the economics of drilling in the basin by increasing the initial flow rates of oil and gas wells. As the chart below indicates, almost all wells drilled in North America are horizontal wells.
Figure #3
Unfortunately, one of the impacts of increased oil and gas flow is that production will decline at a higher rate after the initial production. That means more and more wells need to be drilled just to offset the drop in production. The chart below, while somewhat dated, shows Permian Basin oil production separated by the year wells came on-line. The chart shows that in 2022, more than half of all oil production came from wells drilled in 2021 or 2022. The implication is that domestic oil producers are hard pressed to drill enough wells to offset production declines, let alone increase overall production to counter production declines by OPEC+.
Figure #4
Source: Novi Labs
Without a rise in domestic production, it is likely that oil prices will remain at elevated levels. This is good news for producers who can produce oil at $30-$40 per barrel. The high netbacks (prices less royalties and operating costs) mean increased profits and cash flow for energy companies. And, if an energy company is fortunate enough to have a large acreage position with an abundance of potential drilling sites, growth rates will accelerate.
Natural Gas Prices
The outlook for natural gas, however, is not as rosy. Natural gas prices fell sharply this winter in response to warm weather and weak economic conditions.
Figure #5
Source: Natural Gas Intelligence
Storage levels, which were running below historical levels, are now at five-year highs for this time of year. With the winter heating season now coming to an end, storage levels are unlikely to reverse. As a result, natural gas prices could remain depressed until the fall heating season.
Figure #6
Outlook
A dismal quarter for the energy sector got a shot in the arm on the first day of the new quarter with a surprise OPEC+ production cut announcement. The announcement was welcomed news for producers that were already seeing profitable production margins and high returns on drilling investments. Cash flow levels are high and companies have been expanding operations and returning capital to shareholders. As investment opportunities become sparse and debt levels become low (or completely eliminated), we believe management will increase the focus on raising dividend levels and repurchasing shares. Share repurchases should support energy stock prices increases and an increased dividend yield should protect against any potential share price weakness.
We believe the case for smaller cap energy stocks is especially strong. Major oil companies are facing increasing pressure to focus on renewable energy instead of producing more carbon-based fuel. Smaller cap energy companies are less tethered and often able to acquire and exploit properties being ignored by the majors. If our belief that a world-wide recession is already factored into energy prices is correct, small cap energy companies will be in the best position to take advantage of any energy price increase resulting from OPEC+ production cuts.
GENERAL DISCLAIMERS
All statements or opinions contained herein that include the words “we”, “us”, or “our” are solely the responsibility of Noble Capital Markets, Inc.(“Noble”) and do not necessarily reflect statements or opinions expressed by any person or party affiliated with the company mentioned in this report. Any opinions expressed herein are subject to change without notice. All information provided herein is based on public and non-public information believed to be accurate and reliable, but is not necessarily complete and cannot be guaranteed. No judgment is hereby expressed or should be implied as to the suitability of any security described herein for any specific investor or any specific investment portfolio. The decision to undertake any investment regarding the security mentioned herein should be made by each reader of this publication based on its own appraisal of the implications and risks of such decision.
This publication is intended for information purposes only and shall not constitute an offer to buy/sell or the solicitation of an offer to buy/sell any security mentioned in this report, nor shall there be any sale of the security herein in any state or domicile in which said offer, solicitation or sale would be unlawful prior to registration or qualification under the securities laws of any such state or domicile. This publication and all information, comments, statements or opinions contained or expressed herein are applicable only as of the date of this publication and subject to change without prior notice. Past performance is not indicative of future results. Noble accepts no liability for loss arising from the use of the material in this report, except that this exclusion of liability does not apply to the extent that such liability arises under specific statutes or regulations applicable to Noble. This report is not to be relied upon as a substitute for the exercising of independent judgement. Noble may have published, and may in the future publish, other research reports that are inconsistent with, and reach different conclusions from, the information provided in this report. Noble is under no obligation to bring to the attention of any recipient of this report, any past or future reports. Investors should only consider this report as single factor in making an investment decision.
IMPORTANT DISCLOSURES
This publication is confidential for the information of the addressee only and may not be reproduced in whole or in part, copies circulated, or discussed to another party, without the written consent of Noble Capital Markets, Inc. (“Noble”). Noble seeks to update its research as appropriate, but may be unable to do so based upon various regulatory constraints. Research reports are not published at regular intervals; publication times and dates are based upon the analyst’s judgement. Noble professionals including traders, salespeople and investment bankers may provide written or oral market commentary, or discuss trading strategies to Noble clients and the Noble proprietary trading desk that reflect opinions that are contrary to the opinions expressed in this research report. The majority of companies that Noble follows are emerging growth companies. Securities in these companies involve a higher degree of risk and more volatility than the securities of more established companies. The securities discussed in Noble research reports may not be suitable for some investors and as such, investors must take extra care and make their own determination of the appropriateness of an investment based upon risk tolerance, investment objectives and financial status.
Company Specific Disclosures
The following disclosures relate to relationships between Noble and the company (the “Company”) covered by the Noble Research Division and referred to in this research report. Noble is not a market maker in any of the companies mentioned in this report. Noble intends to seek compensation for investment banking services and non-investment banking services (securities and non-securities related) with any or all of the companies mentioned in this report within the next 3 months
ANALYST CREDENTIALS, PROFESSIONAL DESIGNATIONS, AND EXPERIENCE
Senior Equity Analyst focusing on Basic Materials & Mining. 20 years of experience in equity research. BA in Business Administration from Westminster College. MBA with a Finance concentration from the University of Missouri. MA in International Affairs from Washington University in St. Louis. Named WSJ ‘Best on the Street’ Analyst and Forbes/StarMine’s “Best Brokerage Analyst.” FINRA licenses 7, 24, 63, 87
WARNING
This report is intended to provide general securities advice, and does not purport to make any recommendation that any securities transaction is appropriate for any recipient particular investment objectives, financial situation or particular needs. Prior to making any investment decision, recipients should assess, or seek advice from their advisors, on whether any relevant part of this report is appropriate to their individual circumstances. If a recipient was referred to Noble Capital Markets, Inc. by an investment advisor, that advisor may receive a benefit in respect of transactions effected on the recipients behalf, details of which will be available on request in regard to a transaction that involves a personalized securities recommendation. Additional risks associated with the security mentioned in this report that might impede achievement of the target can be found in its initial report issued by Noble Capital Markets, Inc.. This report may not be reproduced, distributed or published for any purpose unless authorized by Noble Capital Markets, Inc..
RESEARCH ANALYST CERTIFICATION
Independence Of View All views expressed in this report accurately reflect my personal views about the subject securities or issuers.
Receipt of Compensation No part of my compensation was, is, or will be directly or indirectly related to any specific recommendations or views expressed in the public appearance and/or research report.
Ownership and Material Conflicts of Interest Neither I nor anybody in my household has a financial interest in the securities of the subject company or any other company mentioned in this report.
Mark Reichman, Senior Research Analyst, Natural Resources, Noble Capital Markets, Inc.
Refer to the bottom of the report for important disclosures
Gold shined during the first quarter. During the first quarter, mining companies (as measured by the XME) appreciated 6.7% compared to a gain of 7.0% for the S&P 500 index. The VanEck Vectors Gold Miners (GDX) and Junior Gold Miners (GDXJ) ETFs were up 12.9% and 10.8%, respectively. Gold, silver, and copper futures prices gained 7.8%, 0.5%, and 7.4%, respectively, while lead and zinc declined 3.6% and 4.3%, respectively. Despite continuing rate hikes by the Federal Reserve, turmoil in the banking sector, along with the market’s speculation of its potential impact on Federal Reserve monetary policy, enhanced gold’s appeal. Weakness in base metals, with the exception of copper, may be attributed to slowing economic growth and the potential for an economic downturn. In 2022, the price of copper declined 13.2% and so it was likely due for a rebound.
Further upside to the gold price? Assuming worries about the U.S. banking system abate, we think gold could give up some of its recent gains although we remain constructive on precious metals. After peaking in early March, the yield on the 10-year treasury note and the U.S. Dollar Index reversed course with the yield on the treasury ending at 3.49% compared to 3.88% at the end of 2022 and the U.S. dollar Index down 1% during the quarter. Most of this was the result of the recent banking turmoil. While we continue to believe interest rates could peak by mid-year, the big question is how long before they begin easing rates. This will obviously depend on economic conditions, the inflation rate, and employment.
Outlook for industrial metals. While the long-term investment case for owning industrial metals mining companies remains favorable, it may be too early to offer a bullish call due to near-term concerns about economic growth in the U.S. and abroad. During the recent Prospectors & Developers Association of Canada (PDAC) convention, key themes in the keynote presentations were electrification and growing demand for critical minerals and battery metals, including cobalt, copper, lithium, magnesium, and nickel, critical to securing a decarbonized future with broad applications in electric vehicles, charging infrastructure, solar power, and wind turbines.
Conclusion. We think precious metals mining companies, notably juniors, continue to offer attractive return potential. While the near-term outlook for industrial metals could be negatively impacted by near-term macroeconomic factors, an eventual return to economic growth could result in strong prices due to potential supply and demand imbalances.
GENERAL DISCLAIMERS
All statements or opinions contained herein that include the words “we”, “us”, or “our” are solely the responsibility of Noble Capital Markets, Inc.(“Noble”) and do not necessarily reflect statements or opinions expressed by any person or party affiliated with the company mentioned in this report. Any opinions expressed herein are subject to change without notice. All information provided herein is based on public and non-public information believed to be accurate and reliable, but is not necessarily complete and cannot be guaranteed. No judgment is hereby expressed or should be implied as to the suitability of any security described herein for any specific investor or any specific investment portfolio. The decision to undertake any investment regarding the security mentioned herein should be made by each reader of this publication based on its own appraisal of the implications and risks of such decision.
This publication is intended for information purposes only and shall not constitute an offer to buy/sell or the solicitation of an offer to buy/sell any security mentioned in this report, nor shall there be any sale of the security herein in any state or domicile in which said offer, solicitation or sale would be unlawful prior to registration or qualification under the securities laws of any such state or domicile. This publication and all information, comments, statements or opinions contained or expressed herein are applicable only as of the date of this publication and subject to change without prior notice. Past performance is not indicative of future results. Noble accepts no liability for loss arising from the use of the material in this report, except that this exclusion of liability does not apply to the extent that such liability arises under specific statutes or regulations applicable to Noble. This report is not to be relied upon as a substitute for the exercising of independent judgement. Noble may have published, and may in the future publish, other research reports that are inconsistent with, and reach different conclusions from, the information provided in this report. Noble is under no obligation to bring to the attention of any recipient of this report, any past or future reports. Investors should only consider this report as single factor in making an investment decision.
IMPORTANT DISCLOSURES
This publication is confidential for the information of the addressee only and may not be reproduced in whole or in part, copies circulated, or discussed to another party, without the written consent of Noble Capital Markets, Inc. (“Noble”). Noble seeks to update its research as appropriate, but may be unable to do so based upon various regulatory constraints. Research reports are not published at regular intervals; publication times and dates are based upon the analyst’s judgement. Noble professionals including traders, salespeople and investment bankers may provide written or oral market commentary, or discuss trading strategies to Noble clients and the Noble proprietary trading desk that reflect opinions that are contrary to the opinions expressed in this research report. The majority of companies that Noble follows are emerging growth companies. Securities in these companies involve a higher degree of risk and more volatility than the securities of more established companies. The securities discussed in Noble research reports may not be suitable for some investors and as such, investors must take extra care and make their own determination of the appropriateness of an investment based upon risk tolerance, investment objectives and financial status.
Company Specific Disclosures
The following disclosures relate to relationships between Noble and the company (the “Company”) covered by the Noble Research Division and referred to in this research report. Noble is not a market maker in any of the companies mentioned in this report. Noble intends to seek compensation for investment banking services and non-investment banking services (securities and non-securities related) with any or all of the companies mentioned in this report within the next 3 months
ANALYST CREDENTIALS, PROFESSIONAL DESIGNATIONS, AND EXPERIENCE
Senior Equity Analyst focusing on Basic Materials & Mining. 20 years of experience in equity research. BA in Business Administration from Westminster College. MBA with a Finance concentration from the University of Missouri. MA in International Affairs from Washington University in St. Louis. Named WSJ ‘Best on the Street’ Analyst and Forbes/StarMine’s “Best Brokerage Analyst.” FINRA licenses 7, 24, 63, 87
WARNING
This report is intended to provide general securities advice, and does not purport to make any recommendation that any securities transaction is appropriate for any recipient particular investment objectives, financial situation or particular needs. Prior to making any investment decision, recipients should assess, or seek advice from their advisors, on whether any relevant part of this report is appropriate to their individual circumstances. If a recipient was referred to Noble Capital Markets, Inc. by an investment advisor, that advisor may receive a benefit in respect of transactions effected on the recipients behalf, details of which will be available on request in regard to a transaction that involves a personalized securities recommendation. Additional risks associated with the security mentioned in this report that might impede achievement of the target can be found in its initial report issued by Noble Capital Markets, Inc.. This report may not be reproduced, distributed or published for any purpose unless authorized by Noble Capital Markets, Inc..
RESEARCH ANALYST CERTIFICATION
Independence Of View All views expressed in this report accurately reflect my personal views about the subject securities or issuers.
Receipt of Compensation No part of my compensation was, is, or will be directly or indirectly related to any specific recommendations or views expressed in the public appearance and/or research report.
Ownership and Material Conflicts of Interest Neither I nor anybody in my household has a financial interest in the securities of the subject company or any other company mentioned in this report.
Noble Capital Markets Annual Investor Conference – NobleCon – to be held at Florida Atlantic University December 3-5
Boca Raton, FL, March 1, 2023 (GLOBE NEWSWIRE) — In a joint statement, Noble Capital Markets, Inc. (“Noble”) and Florida Atlantic University announced today that NobleCon19 – Noble’s 19th Annual Small Cap Investor Conference – will be held at the University’s College of Business Executive Education facility, Dec. 3-5, 2023, in Boca Raton, Florida. The 52,000 square foot, state-of-the-art facility was opened August 2020.
Noble has worked with the University for over a decade and was instrumental in the development of their Financial Analyst Program, and Noble’s Intern Program has generated great assets with graduates from the University. “We are extremely proud of our long-standing relationship with Florida Atlantic University,” said Nico Pronk, Noble’s President & CEO. “This new collaboration certainly elevates it to a whole new level.”
Vegar Wiik, Executive Director of the College of Business, Executive Education agrees, stating “Our vision for the College and this magnificent structure is to effectively integrate our curriculum with established businesses. Daniel Gropper, dean of FAU’s College of Business, said the financial industry is an important, integral part of the economy. “I can’t think of a better way to expose our students to the importance of emerging growth companies than to have 100 plus executive teams in the halls of our campus,” he said.
The entire College of Business Executive Education facility will transform into NobleCon19. Each presentation room will accommodate investors, in tiered seating with personal monitors. High-definition cameras, full-room microphones (to capture audience questions), three large screens, and full webcasting capabilities will offer the most technologically advanced conference environment on the circuit. Attendees will also experience similarly equipped rooms for panel presentations, private breakouts, and meetings, and in large gathering spaces, both indoors and out, as well as 800 free covered parking spaces. Florida Atlantic University is centrally located in Boca Raton, off I-95, only minutes from the Boca Raton Airport, and less than half an hour from Fort Lauderdale International Airport. Privaira, located at Boca Raton Airport is the official private air charter company for NobleCon19. A wide range of hotel accommodations are available within a five-mile radius, from economy to the ultra-luxurious “The Boca Raton.” Noble will be working with several properties to offer NobleCon19 attendees discounted rates.
The format of NobleCon will include company presentations followed by fire-side chats with Noble analysts, and select one-on-one meetings for qualified investors only, as well as several industry panel presentations. On the networking side, Noble is planning for informative keynote speakers and live entertainment, in an effort expand the business day in a more casual, conversational environment. All company presentations and panel discussions will be digitally streamed and made available exclusively on www.channelchek.com – Noble’s proprietary investment community portal.
Who should attend? Public companies from any business sector with market capitalizations of below $3-4 billion. Private companies planning a capital raise, considering becoming public, or an M&A event. NobleCon19 will suit every level of investor; high net worth individuals, family offices, self-directed investors, private equity, RIAs, financial advisors, equity analysts, and institutional investors. www.NobleCon19.com
About Florida Atlantic University
Florida Atlantic University, established in 1961, officially opened its doors in 1964 as the fifth public university in Florida. Today, the University serves more than 30,000 undergraduate and graduate students across six campuses located along the southeast Florida coast. In recent years, the University has doubled its research expenditures and outpaced its peers in student achievement rates. Through the coexistence of access and excellence, FAU embodies an innovative model where traditional achievement gaps vanish. FAU is designated a Hispanic-serving institution, ranked as a top public university by U.S. News & World Report and a High Research Activity institution by the Carnegie Foundation for the Advancement of Teaching. For more information, visit www.fau.edu.
About Noble Capital Markets
Noble Capital Markets, Inc. was incorporated in 1984 as a full-service SEC / FINRA registered broker-dealer, dedicated exclusively to serving underfollowed emerging growth companies through investment banking, wealth management, trading & execution, and equity research activities. Over the past 39 years, Noble has raised billions of dollars for companies and published more than 45,000 equity research reports. www.noblecapitalmarkets.comcontact@noblecapitalmarkets.com
Bowlero Corp. is the worldwide leader in bowling entertainment, media, and events. With more than 300 bowling centers across North America, Bowlero Corp. serves more than 26 million guests each year through a family of brands that includes Bowlero, Bowlmor Lanes, and AMF. In 2019, Bowlero Corp. acquired the Professional Bowlers Association, the major league of bowling, which boasts thousands of members and millions of fans across the globe. For more information on Bowlero Corp., please visit BowleroCorp.com.
Michael Kupinski, Director of Research, Noble Capital Markets, Inc.
Jacob Mutchler, Research Associate, Noble Capital Markets, Inc.
Refer to the full report for the price target, fundamental analysis, and rating.
Exercised the earn-out. In 2021, Bowlero issued 11.4 million “earn-out” shares exercisable should the shares trade at or above $15 for a 10 day period. Given the recent price movement, the “earn-out” was achieved, and, as a result, Atairos Group and Thomas Shannon each received 4.9 million earn-out shares. Atairos subsequently sold the shares.
Increasing float. Atairos acquired the “earn-out” shares as part of the business combination agreement when Bowlero went public in 2021. Atairos could have sold up to 9 million shares under 144a, but only sold the exact number of “earn-out” shares. Atairos cannot sell additional shares until Bowlero’s next earnings date in mid-May. The sale of the 4.9 million earnout shares increased Bowlero’s public share float from 17.9% to 20.7% of total shares outstanding.
Equity Research is available at no cost to Registered users of Channelchek. Not a Member? Click ‘Join’ to join the Channelchek Community. There is no cost to register, and we never collect credit card information.
This Company Sponsored Research is provided by Noble Capital Markets, Inc., a FINRA and S.E.C. registered broker-dealer (B/D).
*Analyst certification and important disclosures included in the full report. NOTE: investment decisions should not be based upon the content of this research summary. Proper due diligence is required before making any investment decision.
Schwazze (OTCQX:SHWZ, NEO:SHWZ) is building a premier vertically integrated regional cannabis company with assets in Colorado and New Mexico and will continue to take its operating system to other states where it can develop a differentiated regional leadership position. Schwazze is the parent company of a portfolio of leading cannabis businesses and brands spanning seed to sale. The Company is committed to unlocking the full potential of the cannabis plant to improve the human condition. Schwazze is anchored by a high-performance culture that combines customer-centric thinking and data science to test, measure, and drive decisions and outcomes. The Company’s leadership team has deep expertise in retailing, wholesaling, and building consumer brands at Fortune 500 companies as well as in the cannabis sector. Schwazze is passionate about making a difference in our communities, promoting diversity and inclusion, and doing our part to incorporate climate-conscious best practices.
Joe Gomes, Managing Director – Generalist Analyst, Noble Capital Markets, Inc.
Joshua Zoepfel, Research Associate, Noble Capital Markets, Inc.
Refer to the full report for the price target, fundamental analysis, and rating.
A New Store. Schwazze recently announced the opening of a new R. Greenleaf store in New Mexico. The new store will be located at 800 W. Pierce Street in Carlsbad and will have a grand opening date of March 25, 2023. The opening makes it eight new dispensaries in New Mexico since Schwazze acquired R. Greenleaf in February 2022.
City Details. Carlsbad has an overall population of 29,278 with a median household income of approximately $70,000 as of 2020 from Data USA. The town is somewhat competitive, as it contains 14 other dispensaries according to the New Mexico Regulation and Licensing Department. Carlsbad is located in the southeast portion of New Mexico as well, near the border of Texas, which is an area of focus for Schwazze as local dispensaries can benefit from out-of-state customers.
Equity Research is available at no cost to Registered users of Channelchek. Not a Member? Click ‘Join’ to join the Channelchek Community. There is no cost to register, and we never collect credit card information.
This Company Sponsored Research is provided by Noble Capital Markets, Inc., a FINRA and S.E.C. registered broker-dealer (B/D).
*Analyst certification and important disclosures included in the full report. NOTE: investment decisions should not be based upon the content of this research summary. Proper due diligence is required before making any investment decision.
Takeaways from PDAC Minerals and Mining Convention
Replays Now Available on Channelchek!
This annual event in Toronto, Canada is known for attracting up to 30,000 attendees from over 130+ countries for its educational programming, networking events, and outstanding business opportunities. Since it began in 1932, the PDAC Convention has grown in size, stature and influence. Today, it is the event of choice for the world’s mineral industry hosting more than 1,100 exhibitors and 2,500 investors.
The Noble team attended meetings, networking events and interviewed c-suite executives. We captured it all on video and featured their collective takeaway exclusively on Channelchek. The next best thing to being there. And at no cost. Replays coming to Channelchek March 28, exclusively for registered members.
Replays are available exclusively to Channelchek members. It’s totally free to join the community, just click the join button at the top of the page.
Noble Capital Markets Senior Research Analyst Mark Reichman provides his takeaways from the PDAC Metals and Mining Convention.
Joe Gomes, Managing Director – Generalist Analyst, Noble Capital Markets, Inc.
Joshua Zoepfel, Research Associate, Noble Capital Markets, Inc.
Refer to the full report for the price target, fundamental analysis, and rating.
A New Strategic Plan. After being at the Company for six months, CEO Travis Boone and CFO Scott Thanisch released a strategic plan designed to unlock Orion’s full potential for long-term, sustainable growth. While ambitious, we believe the ingredients are in place for a successful outcome.
End Markets Remain Positive. The Marine sector and the Concrete segment both continue to enjoy positive tailwinds. Government money continues to pour into the Marine space, although the associated agencies need to actual award contracts, while population growth in Texas is driving demand for concrete services.
Equity Research is available at no cost to Registered users of Channelchek. Not a Member? Click ‘Join’ to join the Channelchek Community. There is no cost to register, and we never collect credit card information.
This Company Sponsored Research is provided by Noble Capital Markets, Inc., a FINRA and S.E.C. registered broker-dealer (B/D).
*Analyst certification and important disclosures included in the full report. NOTE: investment decisions should not be based upon the content of this research summary. Proper due diligence is required before making any investment decision.
Comstock (NYSE: LODE) innovates technologies that contribute to global decarbonization and circularity by efficiently converting under-utilized natural resources into renewable fuels and electrification products that contribute to balancing global uses and emissions of carbon. The Company intends to achieve exponential growth and extraordinary financial, natural, and social gains by building, owning, and operating a fleet of advanced carbon neutral extraction and refining facilities, by selling an array of complimentary process solutions and related services, and by licensing selected technologies to qualified strategic partners. To learn more, please visit www.comstock.inc.
Mark Reichman, Senior Research Analyst, Natural Resources, Noble Capital Markets, Inc.
Refer to the full report for the price target, fundamental analysis, and rating.
A look back at 2022. Last year was a productive year for Comstock. Most importantly, Comstock’s Cellulosic Fuels business commenced production and shipping of bio-intermediate product samples to prospective customers and is advancing licensing agreement discussions with multiple renewable fuel producers. Comstock expanded the leadership of its metals recycling business and received a conditional use permit to operate a universal waste storage facility. Within its mining segment, the company reconsolidated its properties which host measured and indicated resources containing 605,000 and 5,880,000 ounces of gold and silver, respectively, and inferred resources containing 297,000 ounces of gold and 2,572,000 ounces of silver.
Goals for 2023. Executing one or more license agreements associated with its biorefining technologies and commencing development of commercial scale projects remains the most significant revenue opportunity in 2023. Within its mining segment, Comstock expects to publish preliminary economic assessments for the Lucerne and Dayton resource areas. Within its lithium-ion battery recycling segment, the company expects to advance the technology readiness for broader material recycling, including photovoltaics.
Equity Research is available at no cost to Registered users of Channelchek. Not a Member? Click ‘Join’ to join the Channelchek Community. There is no cost to register, and we never collect credit card information.
This Company Sponsored Research is provided by Noble Capital Markets, Inc., a FINRA and S.E.C. registered broker-dealer (B/D).
*Analyst certification and important disclosures included in the full report. NOTE: investment decisions should not be based upon the content of this research summary. Proper due diligence is required before making any investment decision.
For more than 45 years, 1-800-Flowers.com has offered truly original floral arrangements, plants and unique gifts to celebrate birthdays, anniversaries, everyday occasions, and seasonal holidays, and to deliver comfort during times of grief. Backed by a caring team obsessed with service, 1-800-Flowers.com provides customers thoughtful ways to express themselves and connect with the most important people in their lives. 1-800-Flowers.com is part of the 1-800-FLOWERS.COM, Inc. family of brands. Shares in 1-800-FLOWERS.COM, Inc. are traded on the NASDAQ Global Select Market, ticker symbol: FLWS.
Michael Kupinski, Director of Research, Noble Capital Markets, Inc.
Jacob Mutchler, Research Associate, Noble Capital Markets, Inc.
Refer to the full report for the price target, fundamental analysis, and rating.
Highlights from recent NDR. This report highlights investor meetings hosted in Southern Florida last week by Chris McCann, CEO; Tom Hartnett, President; Bill Shea, CFO; and Andy Milevoj, Sr. VP Investor Relations.
On the hunt for acquisitions. The company has made successful acquisitions during uncertain economic times, such as the acquisition of Harry & David in 2014, a year of sluggish economic growth. Management indicated that acquisitions is the best use of cash at this time, which may position the company for enhanced revenue and cash flow growth. Notably, the company indicated that it has always acquired for cash.
Equity Research is available at no cost to Registered users of Channelchek. Not a Member? Click ‘Join’ to join the Channelchek Community. There is no cost to register, and we never collect credit card information.
This Company Sponsored Research is provided by Noble Capital Markets, Inc., a FINRA and S.E.C. registered broker-dealer (B/D).
*Analyst certification and important disclosures included in the full report. NOTE: investment decisions should not be based upon the content of this research summary. Proper due diligence is required before making any investment decision.
Noble Capital Markets SPACtrac Report Thursday, March 02, 2023
Joe Gomes, Managing Director – Generalist Analyst, Noble Capital Markets, Inc.
Joshua Zoepfel, Research Associate, Noble Capital Markets, Inc.
Refer to the full report for the price target, fundamental analysis, and rating.
The Deal. Better World Acquisition Corp. will be merging with Heritage Distilling Company, Inc. in a deal that will bring Heritage Distilling public. The deal, which values Heritage Distilling at an enterprise value of $122.2 million, provides growth capital to achieve Heritage Distilling’s aim to become the leading national craft spirits company.
The Target. Founded in 2012, Heritage Distilling is a leading, fast-growing distiller of innovative premium brands, with a history of award winning, innovative products. The Company is expanding its wholesale footprint nationwide in conjunction with RNDC, the second largest spirits distributor in the U.S., while its proprietary Tribal Beverage Network provides the potential of developing a “local” presence across the nation that will generate high margin, tax advantaged recurring revenue license streams.
Equity Research is available at no cost to Registered users of Channelchek. Not a Member? Click ‘Join’ to join the Channelchek Community. There is no cost to register, and we never collect credit card information.
This Research is provided by Noble Capital Markets, Inc., a FINRA and S.E.C. registered broker-dealer (B/D).
*Analyst certification and important disclosures included in the full report. NOTE: investment decisions should not be based upon the content of this research summary. Proper due diligence is required before making any investment decision.
Boca Raton, FL, March 1, 2023 (GLOBE NEWSWIRE) — In a joint statement, Noble Capital Markets, Inc. (“Noble”) and Florida Atlantic University announced today that NobleCon19 – Noble’s 19th Annual Small Cap Investor Conference – will be held at the University’s College of Business Executive Education facility, Dec. 3-5, 2023, in Boca Raton, Florida. The 52,000 square foot, state-of-the-art facility was opened August 2020.
Noble has worked with the University for over a decade and was instrumental in the development of their Financial Analyst Program, and Noble’s Intern Program has generated great assets with graduates from the University. “We are extremely proud of our long-standing relationship with Florida Atlantic University,” said Nico Pronk, Noble’s President & CEO. “This new collaboration certainly elevates it to a whole new level.”
Vegar Wiik, Executive Director of the College of Business, Executive Education agrees, stating “Our vision for the College and this magnificent structure is to effectively integrate our curriculum with established businesses. Daniel Gropper, dean of FAU’s College of Business, said the financial industry is an important, integral part of the economy. “I can’t think of a better way to expose our students to the importance of emerging growth companies than to have 100 plus executive teams in the halls of our campus,” he said.
The entire College of Business Executive Education facility will transform into NobleCon19. Each presentation room will accommodate investors, in tiered seating with personal monitors. High-definition cameras, full-room microphones (to capture audience questions), three large screens, and full webcasting capabilities will offer the most technologically advanced conference environment on the circuit. Attendees will also experience similarly equipped rooms for panel presentations, private breakouts, and meetings, and in large gathering spaces, both indoors and out, as well as 800 free covered parking spaces. Florida Atlantic University is centrally located in Boca Raton, off I-95, only minutes from the Boca Raton Airport, and less than half an hour from Fort Lauderdale International Airport. Privaira, located at Boca Raton Airport is the official private air charter company for NobleCon19. A wide range of hotel accommodations are available within a five-mile radius, from economy to the ultra-luxurious “The Boca Raton.” Noble will be working with several properties to offer NobleCon19 attendees discounted rates.
The format of NobleCon will include company presentations followed by fire-side chats with Noble analysts, and select one-on-one meetings for qualified investors only, as well as several industry panel presentations. On the networking side, Noble is planning for informative keynote speakers and live entertainment, in an effort expand the business day in a more casual, conversational environment. All company presentations and panel discussions will be digitally streamed and made available exclusively on www.channelchek.com – Noble’s proprietary investment community portal.
Who should attend? Public companies from any business sector with market capitalizations of below $3-4 billion. Private companies planning a capital raise, considering becoming public, or an M&A event. NobleCon19 will suit every level of investor; high net worth individuals, family offices, self-directed investors, private equity, RIAs, financial advisors, equity analysts, and institutional investors. www.NobleCon19.com
About Florida Atlantic University
Florida Atlantic University, established in 1961, officially opened its doors in 1964 as the fifth public university in Florida. Today, the University serves more than 30,000 undergraduate and graduate students across six campuses located along the southeast Florida coast. In recent years, the University has doubled its research expenditures and outpaced its peers in student achievement rates. Through the coexistence of access and excellence, FAU embodies an innovative model where traditional achievement gaps vanish. FAU is designated a Hispanic-serving institution, ranked as a top public university by U.S. News & World Report and a High Research Activity institution by the Carnegie Foundation for the Advancement of Teaching. For more information, visit www.fau.edu.
About Noble Capital Markets
Noble Capital Markets, Inc. was incorporated in 1984 as a full-service SEC / FINRA registered broker-dealer, dedicated exclusively to serving underfollowed emerging growth companies through investment banking, wealth management, trading & execution, and equity research activities. Over the past 39 years, Noble has raised billions of dollars for companies and published more than 45,000 equity research reports. www.noblecapitalmarkets.comcontact@noblecapitalmarkets.com
Robert LeBoyer, Vice President, Research Analyst, Life Sciences , Noble Capital Markets, Inc.
Refer to the bottom of the report for important disclosures
Webinar. BIO (Biotechnology Innovation Organization, an industry group) sponsored a webinar titled, “Long COVID: What Will It Take To Accelerate Therapeutic Progress?” Speakers included officials from government, academia, and drug development companies to discuss the scientific basis of the condition, its public health implications, and its potential treatments. Presenting companies included Axcella Health (AXLA) and Tonix Pharmaceuticals (TNXP).
Long COVID Symptoms and Prevalence. The program began with how Long COVID became recognized as a condition, its incidence, and its patient population. Scientific presentations showed the biological effects of the SARS-CoV-2 virus on cells in the body, including the connection between Long COVID and other chronic conditions such as CFS/ME (chronic fatigue syndrome/myalgic encephalomyelitis). Symptoms and their duration can vary widely, including inflammation, fatigue, organ dysfunction, and reactivation of latent viral reservoirs. The presenters agreed that the range of symptoms and their variability will require numerous drugs.
Axcella Health Presented AXA1125. Chief Scientific Officer at Axcella Health, Dr. Margaret Koziel, presented the scientific basis for the use of AXA1125 in Long COVID, including its effects on inflammation, mitochondrial dysfunction, and fatigue. Data from the Phase 2a trial was presented, showing improvements in function, and biomarkers that correlate with reductions in inflammation and mitochondrial dysfunction. The design of the Phase 2b/3 trial was also presented.
Tonix Pharmaceuticals Presented Data From TNX-102 SL. Tonix is currently enrolling patients in its Phase 2 PREVAIL trial testing TNX-102 SL, sublingual cyclobenzaprine, in Long COVID. This trial is based on common symptoms with fibromyalgia and chronic fatigue syndrome, such as pain, fatigue, and insomnia. Projected enrollment is about 470 patients with a primary endpoint of change in daily pain score from baseline over the 14-week treatment period.
Conclusion. The BIO webinar speakers agreed that the high variability and large population would require several drugs to adequately treat patients. For Axcella, we believe the presentation could raise awareness of AXA1125 and its “Phase 2b/3 Ready” status, allowing it obtain trial funding through partnerships, government funding, or from investors. Tonix was able to present how TNX-102 SL overlaps with other pain syndromes and how it could treat symptoms, as well as to highlight its clinical milestones in the coming year.
Summary. BIO (Biotechnology Innovation Organization, and industry group) sponsored a webinar titled, “Long COVID: What Will It Take To Accelerate Therapeutic Progress?” Speakers included officials from government, academia, and drug development companies to discuss the scientific basis of the condition, its public health implications, and its potential treatments. Presenting companies included Axcella Health (AXLS) and Tonix Pharmaceuticals (TNXP).
The program began with the history of Long COVID, how it became recognized as a condition, and its prevalence. Scientific presentations discussed the SARS-CoV-2 viral infection and its effects on different organs, as well as the mechanisms of infection that lead to fatigue, cerebral effects (brain fog), and chronic pain. The speakers pointed out that the range and severity of symptoms can vary widely, making it likely that numerous drugs will be needed.
The overlap between Long COVID and other chronic conditions, such as CFS/ME (chronic fatigue syndrome/myalgic encephalomyelitis), was also discussed. The common features in these conditions were cited in the “National Research Action Plan on Long COVID”, published by the Department of Health and Human Services in August 2022.
Axcella Health Spoke About AXA1125. Chief Scientific Officer at Axcella Health, Dr. Margaret Koziel, presented the scientific basis for the use of AXA1125 in Long COVID, including its effect on inflammation, mitochondrial dysfunction, epithelial dysfunction, and fatigue. Data from the Phase 2a trial was presented, showing improvements in physical and mental function. These data included biomarkers that correlate with improvements in inflammation and mitochondrial function. The design of the Phase 2b/3 trial was also presented.
Tonix Pharmaceuticals Presented Data From TNX-102 SL. Tonix is currently enrolling patients in its Phase 2 PREVAIL trial testing TNX-102 SL, sublingual cyclobenzaprine, in Long COVID. This trial is based on common symptoms with fibromyalgia and chronic fatigue syndrome, such as pain, fatigue, and insomnia. Projected enrollment is about 470 patients with a primary endpoint of change in daily pain score from baseline over the 14-week treatment period.
TNX-102 SL showed positive results in its Phase 3 RELIEF study in fibromyalgia, although the confirmatory Phase 3 RALLY missed its primary endpoint. After analyzing the RALLY trial, the Phase 3 RESILIENT trial began. An interim analysis from the RESILIENT trial is expected in 2Q23.
Conclusion. The BIO webinar gave different perspectives on Long COVID and discussed different approaches to treatment. For Axcella, we believe the presentation could raise awareness of AXA1125 data and its “Phase 2b/3” ready status, allowing it obtain trial funding through partnerships, government funding, or from investors. For Tonix, presentations on the common features of Long COVID and chronic pain syndromes support the use of Tonix’s TNX-102 SL, and show how its Phase 2 PREVAIL clinical trial design could become an effective treatment.
All statements or opinions contained herein that include the words “we”, “us”, or “our” are solely the responsibility of Noble Capital Markets, Inc.(“Noble”) and do not necessarily reflect statements or opinions expressed by any person or party affiliated with the company mentioned in this report. Any opinions expressed herein are subject to change without notice. All information provided herein is based on public and non-public information believed to be accurate and reliable, but is not necessarily complete and cannot be guaranteed. No judgment is hereby expressed or should be implied as to the suitability of any security described herein for any specific investor or any specific investment portfolio. The decision to undertake any investment regarding the security mentioned herein should be made by each reader of this publication based on its own appraisal of the implications and risks of such decision.
This publication is intended for information purposes only and shall not constitute an offer to buy/sell or the solicitation of an offer to buy/sell any security mentioned in this report, nor shall there be any sale of the security herein in any state or domicile in which said offer, solicitation or sale would be unlawful prior to registration or qualification under the securities laws of any such state or domicile. This publication and all information, comments, statements or opinions contained or expressed herein are applicable only as of the date of this publication and subject to change without prior notice. Past performance is not indicative of future results. Noble accepts no liability for loss arising from the use of the material in this report, except that this exclusion of liability does not apply to the extent that such liability arises under specific statutes or regulations applicable to Noble. This report is not to be relied upon as a substitute for the exercising of independent judgement. Noble may have published, and may in the future publish, other research reports that are inconsistent with, and reach different conclusions from, the information provided in this report. Noble is under no obligation to bring to the attention of any recipient of this report, any past or future reports. Investors should only consider this report as single factor in making an investment decision.
IMPORTANT DISCLOSURES
This publication is confidential for the information of the addressee only and may not be reproduced in whole or in part, copies circulated, or discussed to another party, without the written consent of Noble Capital Markets, Inc. (“Noble”). Noble seeks to update its research as appropriate, but may be unable to do so based upon various regulatory constraints. Research reports are not published at regular intervals; publication times and dates are based upon the analyst’s judgement. Noble professionals including traders, salespeople and investment bankers may provide written or oral market commentary, or discuss trading strategies to Noble clients and the Noble proprietary trading desk that reflect opinions that are contrary to the opinions expressed in this research report. The majority of companies that Noble follows are emerging growth companies. Securities in these companies involve a higher degree of risk and more volatility than the securities of more established companies. The securities discussed in Noble research reports may not be suitable for some investors and as such, investors must take extra care and make their own determination of the appropriateness of an investment based upon risk tolerance, investment objectives and financial status.
Company Specific Disclosures
The following disclosures relate to relationships between Noble and the company (the “Company”) covered by the Noble Research Division and referred to in this research report. Noble is not a market maker in any of the companies mentioned in this report. Noble intends to seek compensation for investment banking services and non-investment banking services (securities and non-securities related) with any or all of the companies mentioned in this report within the next 3 months
ANALYST CREDENTIALS, PROFESSIONAL DESIGNATIONS, AND EXPERIENCE
Senior Equity Analyst focusing on Basic Materials & Mining. 20 years of experience in equity research. BA in Business Administration from Westminster College. MBA with a Finance concentration from the University of Missouri. MA in International Affairs from Washington University in St. Louis. Named WSJ ‘Best on the Street’ Analyst and Forbes/StarMine’s “Best Brokerage Analyst.” FINRA licenses 7, 24, 63, 87
WARNING
This report is intended to provide general securities advice, and does not purport to make any recommendation that any securities transaction is appropriate for any recipient particular investment objectives, financial situation or particular needs. Prior to making any investment decision, recipients should assess, or seek advice from their advisors, on whether any relevant part of this report is appropriate to their individual circumstances. If a recipient was referred to Noble Capital Markets, Inc. by an investment advisor, that advisor may receive a benefit in respect of transactions effected on the recipients behalf, details of which will be available on request in regard to a transaction that involves a personalized securities recommendation. Additional risks associated with the security mentioned in this report that might impede achievement of the target can be found in its initial report issued by Noble Capital Markets, Inc.. This report may not be reproduced, distributed or published for any purpose unless authorized by Noble Capital Markets, Inc..
RESEARCH ANALYST CERTIFICATION
Independence Of View All views expressed in this report accurately reflect my personal views about the subject securities or issuers.
Receipt of Compensation No part of my compensation was, is, or will be directly or indirectly related to any specific recommendations or views expressed in the public appearance and/or research report.
Ownership and Material Conflicts of Interest Neither I nor anybody in my household has a financial interest in the securities of the subject company or any other company mentioned in this report.