CALGARY, AB, May 8, 2025 /CNW/ – InPlay Oil Corp. (TSX: IPO) (OTCQX: IPOOF) (“InPlay” or the “Company“) announces its financial and operating results for the three months ended March 31, 2025 and an updated 2025 capital budget following the successful completion of the strategic acquisition of Cardium light oil focused assets (the “Acquired Assets“) in the Pembina area of Alberta (the “Acquisition“) from Obsidian Energy Ltd. And certain of its affiliates (collectively “Obsidian“). InPlay’s condensed unaudited interim financial statements and notes, as well as Management’s Discussion and Analysis (“MD&A”) for the three months ended March 31, 2025 will be available at “www.sedarplus.ca” and on our website at “www.inplayoil.com“. All figures presented herein reflect the Company’s six (6) to one (1) share consolidation, which was effective April 14, 2025. An updated corporate presentation will be available on our website shortly.
First Quarter 2025 Highlights
Achieved average quarterly production of 9,076 boe/d(1) (55% light crude oil and NGLs), a 5% increase over Q1 2024 and ahead of internal forecasts.
Generated strong quarterly Adjusted Funds Flow (“AFF”)(2) of $16.8 million ($1.10 per basic share(3)).
Returned $4.1 million to shareholders by way of monthly dividends, equating to a 16% yield relative to the current share price. Since November 2022 InPlay has distributed $44 million in dividends including dividends declared to date.
Maintained a strong operating income profit margin(3) of 54%.
Improved field operating netbacks(3) to $25.71/boe, an increase of 3% compared to Q4 2024.
First quarter results exceeded expectations, driven in part by the outperformance of newly drilled wells at Pembina Cardium Unit #7 (PCU#7). A two well pad delivered average initial production (“IP”) rates of 677 boe/d (75% light oil and NGLs) over the first 30 days and 492 boe/d (66% light oil and NGLs) over the first 60 days, both significantly above expectations. Over the initial two-month period, production from these wells was more than 100% above our type curve. These wells ranked in the top-ten for production rates for all Cardium wells in the basin for the month of March.
Complementing InPlay’s strong operational momentum, Obsidian drilled four (4.0 net) wells on the Acquired Assets in the first quarter. The first two (2.0 net) wells, which started production mid quarter, are outperforming our internal type curve by approximately 50% with average IP rates of 304 boe/d (91% light oil and NGLs) over the first 30 days and 295 boe/d (85% light oil and NGLs) over the first 60 days. The remaining two wells, brought online in the final days of the first quarter, are performing more than 350% above our internal type curve, with average IP rates per well of 887 boe/d (88% light oil and NGLs) over their initial 30 day period.
The Company is very excited about the highly accretive Pembina Acquisition announced February 19, 2025 and had anticipated strong results from the combined assets. The exceptional results from the first quarter drilling program, combined with the outperformance of base production, have driven current field estimated production to approximately 21,500 boe/d (64% light oil and NGLs) significantly exceeding what we had initially forecasted at the announcement of the Acquisition. Given the current volatility in commodity prices, this material outperformance provides the Company with significant flexibility to scale back our capital program, providing “more for less” while maintaining our production forecasts, allowing for more aggressive debt repayment even in a lower pricing environment.
2025 Capital Budget and Associated Guidance
Following the closing of the highly accretive Acquisition on April 7, 2025, InPlay is pleased to provide initial pro forma guidance inclusive of the Acquired Assets. This guidance reflects the exceptional operational performance across the Company’s expanded asset base, while taking into account the current volatile commodity price environment. It also underscores InPlay’s continued commitment to maximizing free cash flow to support ongoing debt reduction, while positioning the Company to support its return to shareholder strategy.
InPlay’s Board has approved an updated capital program of $53 – $60 million for 2025. InPlay plans to drill approximately 5.5 – 7.5 net Extended Reach Horizontal (“ERH”) Cardium wells over the remainder of the year. A significant portion of the remaining 2025 capital budget is expected to be directed toward the Acquired Assets, which (as outlined above) continue to materially outperform internally modelled type curves. Cost efficiencies realized through InPlay’s recent drilling program, combined with the application of InPlay’s drilling and completion techniques to the Acquired Assets, are expected to further enhance well economics. Capital will also be spent tying in certain InPlay assets into the newly acquired facilities, eliminating significant trucking costs, and marks the first step in our synergy cost savings strategy. Due to the outperformance of production across our asset base, InPlay has reduced total capital spending for the remainder of 2025 by approximately 30% (relative to initial expectations) without reducing production estimates.
Key highlights of the updated 2025 capital program include:
Production per Share Growth:
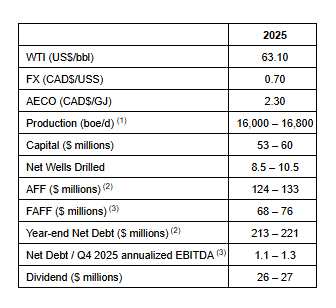
Forecasted average annual production of 16,000 – 16,800 boe/d(1) (60% – 62% light oil and NGLs), a 15% increase (based on mid-point) in production per weighted average share compared to 2024 despite 30% less capital spending than initially expected, driven by:
Lower corporate base decline rate of 24% due to the favorable decline profile of the Acquired Assets;
Improved corporate netbacks driven by the higher oil and liquids weighting of the Acquired Assets; and
Enhanced capital efficiencies from high graded drilling inventory of the pro forma assets.
FAFF Generation and Dividend Sustainability:
AFF(2) per weighted average share(4) of $5.00 – $5.35, a 13% increase (based on mid-point) compared to 2024.
Free adjusted funds flow (“FAFF”)(3) of $68 – $76 million equating to a 35% – 40% FAFF Yield(3), a 10x increase (based on mid-point) in FAFF per share compared to 2024 despite a 17% year over year reduction in forecasted WTI price.
Top Tier Returns:
Total return of 50% – 55% after combining FAFF Yield and production per share growth(4), which is expected to be at the high end of our peer group.
Debt Reduction:
Excess FAFF(3) is planned to be used to reduce debt.
Projected year-end Net Debt(2) of $213 – $221 million equating to a $31 – $39 million reduction from closing of the Acquisition.
Year-end Net Debt to Q4 2025 annualized EBITDA(3) ratio of 1.1x – 1.3x.
InPlay continues to monitor global trade and commodity dynamics, including United States tariffs on Canada. Capital spending will be weighted towards the back end of the year with drilling expected to resume again in August, providing ample time to finalize capital spending allocation depending on commodity pricing and continued asset performance. As a result of minimal capital spending in the second quarter, InPlay anticipates generating significant FAFF which will be directed to reducing debt. InPlay will remain flexible and will make decisions based on our core strategy of disciplined capital allocation, maintaining financial strength to ensure the long term sustainability of our strategy and return to shareholder program.
Updated 2025 Guidance Summary:
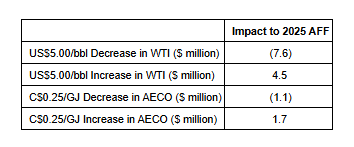
Following closing of the Acquisition, a significant hedging program was undertaken to help provide downside commodity price protection. As further detailed in the hedging summary section in this press release, InPlay has hedged approximately 75% of its net after royalty oil production and 67% of its net after royalty production on a BOE basis for the remainder of 2025. InPlay’s strong hedge book provides insulation to the current commodity price volatility which is highlighted in the sensitivity table below.
With low decline high netback assets, a flexible budget, a resilient balance sheet, and becoming a larger company, InPlay remains well positioned to sustainably navigate future commodity price cycles. Adhering to this disciplined strategy has allowed the Company to navigate previous commodity price cycles including the COVID-19 pandemic price environment.
Financial and Operating Results:
First Quarter 2025 Financial & Operations Overview:
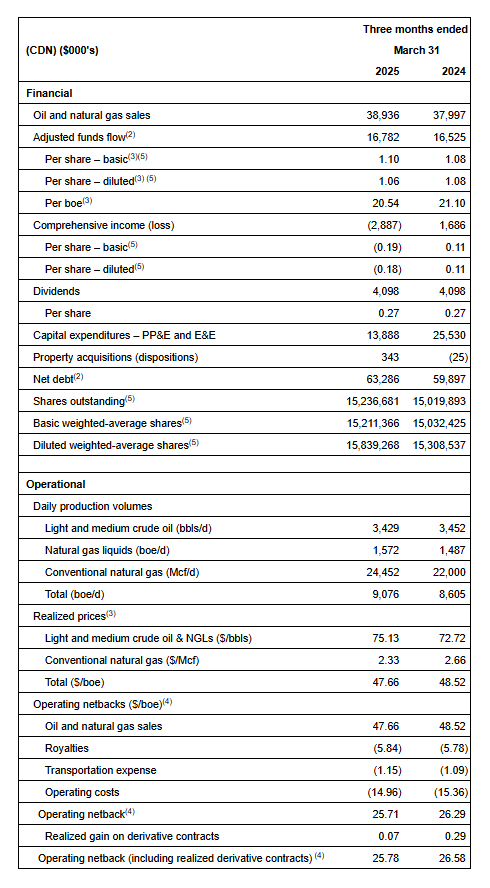
The year has begun with strong momentum as production for the quarter exceeded internal forecasts, largely due to the outperformance of new ERH wells in PCU#7. Three (3.0 net) ERH wells were brought online at the end of February as part of a $13.9 million capital program, inclusive of $1.4 million invested in well optimization initiatives which continues to lower corporate declines. Production averaged 9,076 boe/d(1) (55% light crude oil and NGLs) in the quarter, a 5% increase from 8,605 boe/d(1) in the first quarter of 2024.
Notably, a two well pad drilled in PCU#7 exceeded expectations, delivering average IP rates of 677 boe/d (75% light oil and NGLs) and 492 boe/d (66% light oil and NGLs) per well over their first 30 and 60 days, respectively, which is over 100% above our internally modeled type curve for these wells.
Obsidian drilled four (4.0 net) wells on the Acquired Assets in the first quarter. The first two (2.0 net) wells, which came on production mid quarter, are outperforming the internal type curve with IP rates averaging 304 boe/d (91% light oil and NGLs) and 295 boe/d (85% light oil and NGLs) over the first 30 and 60 days, respectively (approximately 50% above our internally modelled type curve). The last two wells were brought online in the final days of the quarter and are performing significantly above internal forecasts with IP rates averaging 887 boe/d (88% light oil and NGLs) per well over their first 30 days (more than 350% above our type curve).
AFF for the quarter was $16.8 million. In addition, the Company returned $4.1 million ($0.09 per share) in base dividends to shareholders which equates to a yield of 16% based on the current share price. Net debt at quarter-end totaled $63 million, with a net debt to EBITDA ratio(3) of 0.8x, reflecting a healthy financial position.
On behalf of the entire InPlay team and the Board of Directors, we thank our shareholders for their continued support as we advance our strategy of disciplined growth, returns, and long-term value creation. We are excited to report our progress with respect to the strategic Acquisition.
For further information please contact:
Doug Bartole President and Chief Executive Officer InPlay Oil Corp. Telephone: (587) 955-0632
Leadership appointment strengthens strategic and development capabilities
FDA Type D Meeting provides additional guidance for advancing the clinical development of tecarfarin
Collaboration Agreement with Abbott (NYSE: ABT) validates the need for new anticoagulation options
PONTE VEDRA, Fla. – Cadrenal Therapeutics, Inc. (Nasdaq: CVKD), a biopharmaceutical company developing therapeutics for patients with cardiovascular disease, today reported its financial results for the first quarter ended March 31, 2025, and provided an update on the strategic focus of the company and clinical development of tecarfarin.
“In the first quarter of 2025, Cadrenal continued to build on the momentum we achieved during 2024,” said Quang X. Pham, Chairman & CEO. “The appointment of James Ferguson, M.D., FACC, FAHA, as our Chief Medical Officer positions us for success in reviewing potential assets to add to our portfolio and designing and executing our clinical program for tecarfarin. The finalized Collaboration Agreement with Abbott validates the critical need in the market for a new anticoagulant for patients with left ventricular assist devices (LVADs). And our meeting with the FDA provided additional guidance in the design of a pivotal trial.”
Highlights from the Quarter Ended March 31, 2025, and Other Recent Events:
Leadership Advances
In February 2025, Cadrenal appointed James J. Ferguson, M.D., FACC, FAHA, as Chief Medical Officer to lead the review of business development opportunities to expand the Company’s pipeline and drive the late-stage clinical development of tecarfarin for conditions requiring chronic anticoagulation therapy.
Regulatory Update
In February 2025, Cadrenal met with the U.S. Food and Drug Administration (FDA) for a Type D meeting. The FDA provided additional guidance on the appropriate design for a Phase 3 tecarfarin trial and welcomed submission of a final study design for review.
Collaboration Agreement with Abbott
In March 2025, we announced a Collaboration Agreement with Abbott (NYSE: ABT) to support our pivotal TECarfarin Anticoagulation and Hemocompatibility with Left Ventricular Assist Devices (TECH-LVAD) trial. Under the agreement, Abbott will share insights from recent HeartMate 3™ clinical trials and will support Cadrenal with trial design, site identification, trial awareness, and HeartMate 3™ expertise.
Operational Milestones
During the quarter, Cadrenal successfully completed the technical transfer and manufacturing of its tecarfarin drug substance (API) from a CDMO site located in Asia to a CDMO site in the United States. This initiative was done to support the company’s clinical and regulatory development strategy for tecarfarin and to improve supply chain security.
Cadrenal also conducted strategic market opportunity research for multiple indications, including patients with left ventricular assist devices. This research indicates that tecarfarin is uniquely positioned to provide clinical value to patients in the rapidly growing LVAD market, which is projected to nearly double by 2032. This research also showed that tecarfarin has the potential to provide clinical benefit in additional high-need cardiovascular, renal, and mechanical heart valve indications, reinforcing tecarfarin’s potential value proposition for patients.
Participation in Key Investor, Medical, and Business Development Conferences
Cadrenal was active during the first quarter in several significant conferences to build corporate visibility and underscore its commitment to advancing innovation in anticoagulation therapy. Investor interactions included participation at the 43rd Annual J.P. Morgan Healthcare Conference in San Francisco, a Company presentation at the BIO CEO and Investor Conference in New York, and, after the close of the quarter, a Company presentation at the Centri Capital Conference at Nasdaq headquarters in New York. Shortly after the quarter’s close, Cadrenal participated in the 18th National Conference on Anticoagulation Therapy in Washington, D.C.
Strategic Development Collaborations
Cadrenal continues to explore opportunities to add to the Company’s clinical pipeline and collaborate with potential development partners to advance the development of tecarfarin for patients with LVADs and for other indications requiring chronic anticoagulation.
First Quarter 2025 Financial Highlights
Research and development expenses for the quarter ended March 31, 2025, were $1.7 million compared to $0.6 million for the same period in 2024. General and administrative expenses for the quarter ended March 31, 2025, were $2.3 million compared to $1.1 million for the same period in 2024. Cadrenal reported a net loss of $3.8 million for the quarter ending March 31, 2025, compared to $1.7 million for the same period in 2024.
On March 31, 2025, Cadrenal had cash and cash equivalents of $7.3 million, compared to $10.0 million as of December 31, 2024. The Company had approximately 1.9 million shares of common stock outstanding as of March 31, 2025.
About Cadrenal Therapeutics, Inc.
Cadrenal Therapeutics, Inc. is a biopharmaceutical company developing therapeutics for patients with cardiovascular disease. Cadrenal’s lead investigational product is tecarfarin, a novel oral vitamin K antagonist anticoagulant that addresses unmet needs in anticoagulation therapy. Tecarfarin is a reversible anticoagulant (blood thinner) designed to prevent heart attacks, strokes, and deaths due to blood clots in patients requiring chronic anticoagulation. Although warfarin is widely used off-label for a number of indications, extensive clinical and real-world data have shown it can have significant, serious side effects. With tecarfarin, Cadrenal is advancing an innovative solution to address the unmet needs in anticoagulation therapy, aiming to reduce the clinical complexities of warfarin and capture value in a market with high demand for safer, more manageable treatment options.
Cadrenal is pursuing a pipeline-in-a-product approach with tecarfarin. Tecarfarin received Orphan Drug designation (ODD) for advanced heart failure patients with implanted mechanical circulatory support devices, including Left Ventricular Assisted Devices (LVADs). The Company also received ODD and fast-track status for tecarfarin in end-stage kidney disease and atrial fibrillation (ESKD+AFib).
Cadrenal is opportunistically pursuing business development initiatives with a longer-term focus on creating a pipeline of cardiovascular therapeutics. For more information, visit https://www.cadrenal.com/ and connect with us on LinkedIn.
Safe Harbor
Any statements in this press release about future expectations, plans, and prospects, as well as any other statements regarding matters that are not historical facts, may constitute “forward-looking statements.” The words “anticipate,” “believe,” “continue,” “could,” “estimate,” “expect,” “intend,” “may,” “plan,” “potentially,” “predict,” “project,” “should,” “target,” “will,” “would” and similar expressions are intended to identify forward-looking statements, although not all forward-looking statements contain these identifying words. These statements include statements regarding the appointment of James Ferguson, M.D., FACC, FAHA, as the Company’s Chief Medical Officer positioning the Company for success in reviewing potential assets to add to its portfolio and designing and executing its clinical program for tecarfarin; the finalized Collaboration Agreement with Abbott validating the critical need in the market for a new anticoagulant for patients with left ventricular assist devices (LVADs); Abbott sharing insights from recent HeartMate 3™ clinical trials and supporting Cadrenal with trial design, site identification, trial awareness, and HeartMate 3™ expertise; the LVAD market projected to nearly double by 2032; and tecarfarin having the potential to provide clinical benefit in additional high-need cardiovascular, renal, and mechanical heart valve indications, reinforcing tecarfarin’s potential value proposition for patients. Actual results may differ materially from those indicated by such forward-looking statements as a result of various important factors, including the ability to utilize Abbott’s expertise to advance tecarfarin, the ability to successfully collaborate with Abbott, the initiation of the pivotal clinical trial for tecarfarin in LVAD patients by Cadrenal; for tecarfarin to provide clinical benefit in additional high-need cardiovascular, renal, and mechanical heart valve indications, reinforcing tecarfarin’s potential value proposition for patients; the ability of Cadrenal to build a pipeline of specialized cardiovascular therapeutics and other assets and the other risk factors described in the Company’s Annual Report on Form 10-K for the year ended December 31, 2024, and the Company’s subsequent filings with the Securities and Exchange Commission, including subsequent periodic reports on Quarterly Reports on Form 10-Q and Current Reports on Form 8-K. Any forward-looking statements contained in this press release speak only as of the date hereof and, except as required by federal securities laws, the Company specifically disclaims any obligation to update any forward-looking statement, whether as a result of new information, future events, or otherwise.
RICHMOND, Va.–(BUSINESS WIRE)– Lucky Strike Entertainment (NYSE: LUCK), one of the world’s premier operators of location-based entertainment, today provided financial results for the third quarter of the 2025 Fiscal Year, which ended on March 30, 2025.
Quarter Highlights:
Total revenue increased 0.7% to $339.9 million from $337.7 million in the previous year
Same Store Revenue decreased 5.6% versus the prior year
Net income of $13.3 million versus prior year net income of $23.8 million
Adjusted EBITDA of $117.3 million versus $122.8 million in the prior year
From December 30, 2024 through May 8, 2025, we acquired one family entertainment center and one water park. Total locations in operation as of May 8, 2025 is 367
Continued progress on Lucky Strike rebrand initiative with 34 current Lucky Strike locations
“In the quarter, our Retail and Leagues businesses remained stable, Food sales grew by high single digits, while our Corporate Events business declined as we navigate a period of corporate austerity. The softness in Corporate Events was most pronounced in tech-aligned markets, with California and Seattle accounting for the majority of the underperformance. We have seen encouraging signs of strength, with the Boston, New Jersey and Miami markets recently posting positive comps.,” said Founder, Chairman, and CEO Thomas Shannon.
“As we head into summer, we are energized by the momentum of our Summer Season Pass program, which will drive increased traffic to our locations. Sales of the pass are already over 200% higher than this time last year, reflecting the consumers’ desire for high-value entertainment in their local markets. We’re also entering the season with three water parks, including our recent acquisition of Shipwreck Island in Panama City Beach, Florida. Together with the contributions from the seven family entertainment centers we acquired this year, we expect to benefit from greater scale during the typically slower summer months.”
“In light of ongoing macroeconomic uncertainty, we are maintaining a disciplined approach to expense management and continuing to prioritize only high-return capital investments. Capital expenditures are down 20% year-to-date, and we anticipate this trend will continue into next year,” said Bobby Lavan, Chief Financial Officer.
Share Repurchase and Capital Return Program Update
From December 30, 2024 through May 5, 2025, the Company repurchased 4.5 million shares of Class A common stock for approximately $47 million. The Company has $92 million currently remaining under the share repurchase program.
The Board of Directors declared a quarterly cash dividend of $0.055 per share of common stock for the fourth quarter of fiscal year 2025. The dividend will be payable on June 6, 2025, to stockholders of record on May 23, 2025.
Guidance
Due to increasing economic uncertainty, the Company will not be issuing guidance at this time. We intend to reassess our approach to forward-looking guidance later in the year.
“Although the outlook remains uncertain, we are confident in the Company’s resiliency and our ability to drive revenue growth through strategic initiatives, targeted capital investments, and selective acquisitions,” said Bobby Lavan.
Investor Webcast Information
Listeners may access an investor webcast hosted by Lucky Strike Entertainment. The webcast and results presentation will be accessible at 9:00 AM ET on May 8, 2025 in the Events & Presentations section of the Lucky Strike Entertainment Investor Relations website at https://ir.luckystrikeent.com/overview/default.aspx
About Lucky Strike Entertainment
Lucky Strike Entertainment is one of the world’s premier location-based entertainment platforms. With over 360 locations across North America, Lucky Strike Entertainment provides experiential offerings in bowling, amusements, water parks, and family entertainment centers. The Company also owns the Professional Bowlers Association, the major league of bowling and a growing media property that boasts millions of fans around the globe. For more information on Lucky Strike Entertainment, please visit IR.LuckyStrikeEnt.com.
Forward Looking Statements
Some of the statements contained in this press release are forward-looking statements within the meaning of Section 27A of the Securities Act of 1933, as amended, and Section 21E of the Securities Exchange Act of 1934, as amended, that involve risk, assumptions and uncertainties, such as statements of our plans, objectives, expectations, intentions and forecasts. These forward-looking statements are generally identified by the use of forward-looking terminology, including the terms “anticipate,” “believe,” “confident,” “continue,” “could,” “estimate,” “expect,” “intend,” “likely,” “may,” “plan,” “possible,” “potential,” “predict,” “project,” “should,” “target,” “will,” “would” and, in each case, their negative or other various or comparable terminology. These forward-looking statements reflect our views with respect to future events as of the date of this release and are based on our management’s current expectations, estimates, forecasts, projections, assumptions, beliefs and information. Although management believes that the expectations reflected in these forward-looking statements are reasonable, it can give no assurance that these expectations will prove to have been correct. All such forward-looking statements are subject to risks and uncertainties, many of which are outside of our control, and could cause future events or results to be materially different from those stated or implied in this document. It is not possible to predict or identify all such risks. These risks include, but are not limited to: our ability to design and execute our business strategy; changes in consumer preferences and buying patterns; our ability to compete in our markets; the occurrence of unfavorable publicity; risks associated with long-term non-cancellable leases for our locations; our ability to retain key managers; risks associated with our substantial indebtedness and limitations on future sources of liquidity; our ability to carry out our expansion plans; our ability to successfully defend litigation brought against us; our ability to adequately obtain, maintain, protect and enforce our intellectual property and proprietary rights and claims of intellectual property and proprietary right infringement, misappropriation or other violation by competitors and third parties; failure to hire and retain qualified employees and personnel; the cost and availability of commodities and other products we need to operate our business; cybersecurity breaches, cyber-attacks and other interruptions to our and our third-party service providers’ technological and physical infrastructures; catastrophic events, including war, terrorism and other conflicts; public health emergencies and pandemics, such as the COVID-19 pandemic, or natural catastrophes and accidents; changes in the regulatory atmosphere and related private sector initiatives; fluctuations in our operating results; economic conditions, including the impact of increasing interest rates, inflation and recession; and other factors described under the section titled “Risk Factors” in the Company’s Annual Report on Form 10-K filed with the U.S. Securities and Exchange Commission (the “SEC”) by the Company on September 5, 2024, as well as other filings that the Company will make, or has made, with the SEC, such as Quarterly Reports on Form 10-Q and Current Reports on Form 8-K. These factors should not be construed as exhaustive and should be read in conjunction with the other cautionary statements that are included in this press release and in other filings. We expressly disclaim any obligation to publicly update or review any forward-looking statements, whether as a result of new information, future developments or otherwise, except as required by applicable law.
Non-GAAP Financial Measures
To provide investors with information in addition to our results as determined under Generally Accepted Accounting Principles (“GAAP”), we disclose Revenue Excluding Service Fee Revenue, Total Location Revenue, Same Store Revenue and Adjusted EBITDA as “non-GAAP measures”, which management believes provide useful information to investors because each measure assists both investors and management in analyzing and benchmarking the performance and value of our business. Accordingly, management believes that these measurements are useful for comparing general operating performance from period to period, and management relies on these measures for planning and forecasting of future periods. Additionally, these measures allow management to compare our results with those of other companies that have different financing and capital structures. These measures are not financial measures calculated in accordance with GAAP and should not be considered as a substitute for revenue, net income, or any other operating performance or liquidity measure calculated in accordance with GAAP, and may not be comparable to a similarly titled measure reported by other companies. Our fiscal year 2025 guidance measures (other than revenue) are provided on a non-GAAP basis without a reconciliation to the most directly comparable GAAP measure because the Company is unable to predict with a reasonable degree of certainty certain items contained in the GAAP measures without unreasonable efforts. For the same reasons, the Company is unable to address the probable significance of the unavailable information. Such items include, but are not limited to, acquisition related expenses, share-based compensation and other items not reflective of the Company’s ongoing operations.
Revenue Excluding Service Fee Revenue represents total Revenue less Service Fee Revenue. Total Location Revenue represents total Revenue less Non-Location Related Revenue, Revenue from Closed Locations, and Service Fee Revenue, if applicable. Same Store Revenue represents total Revenue less Non-Location Related Revenue, Revenue from Closed Locations, Service Fee Revenue, if applicable, and Acquired Revenue. Adjusted EBITDA represents Net Income (Loss) before Interest Expense, Income Taxes, Depreciation and Amortization, Impairment and Other Charges, Share-based Compensation, EBITDA from Closed Locations, Foreign Currency Exchange Loss (Gain), Asset Disposition Loss (Gain), Transactional and other advisory costs, changes in the value of earnouts, and other.
The Company considers Revenue Excluding Service Fee Revenue as an important financial measure because it provides a financial measure of revenue directly associated with consumer discretionary spending and Total Location Revenue as an important financial measure because it provides a financial measure of revenue directly associated with location operations. The Company also considers Same Store Revenue as an important financial measure because it provides comparable revenue for locations open for the entire duration of both the current and comparable measurement periods.
The Company considers Adjusted EBITDA as an important financial measure because it provides a financial measure of the quality of the Company’s earnings. Other companies may calculate Adjusted EBITDA differently than we do, which might limit its usefulness as a comparative measure. Adjusted EBITDA is used by management in addition to and in conjunction with the results presented in accordance with GAAP. We have presented Adjusted EBITDA solely as a supplemental disclosure because we believe it allows for a more complete analysis of results of operations and assists investors and analysts in comparing our operating performance across reporting periods on a consistent basis by excluding items that we do not believe are indicative of our core operating performance. Adjusted EBITDA has limitations as an analytical tool, and you should not consider it in isolation or as a substitute for analysis of our results as reported under GAAP. Some of these limitations are that Adjusted EBITDA:
do not reflect every expenditure, future requirements for capital expenditures or contractual commitments;
do not reflect changes in our working capital needs;
do not reflect the interest expense, or the amounts necessary to service interest or principal payments, on our outstanding debt;
do not reflect income tax (benefit) expense, and because the payment of taxes is part of our operations, tax expense is a necessary element of our costs and ability to operate;
do not reflect non-cash equity compensation, which will remain a key element of our overall equity based compensation package; and
do not reflect the impact of earnings or charges resulting from matters we consider not to be indicative of our ongoing operations.
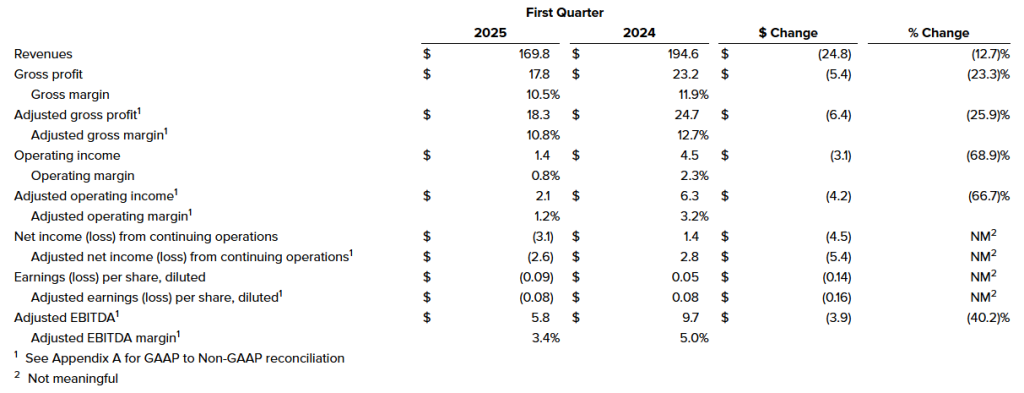
First Quarter 2025 Revenues of $302.6 Million Reflect 9.2 Percent Growth and 7.4 Percent Organic Growth Over First Quarter 2024 Revenues of $277.2 Million
First Quarter 2025 Consolidated Book to Bill Ratio of 1.2 to 1 and Bookings of $365.6 Million
Last Twelve Months Ended March 30, 2025 Consolidated Book to Bill Ratio of 1.2 to 1 and Bookings of $1.401 Billion
SAN DIEGO, May 07, 2025 (GLOBE NEWSWIRE) — Kratos Defense & Security Solutions, Inc. (Nasdaq: KTOS), a Technology Company in the Defense, National Security and Commercial Markets, today reported its first quarter 2025 financial results, including Revenues of $302.6 million, Operating Income of $6.6 million, Net Income attributable to Kratos of $4.5 million, Adjusted EBITDA of $26.7 million and a consolidated book to bill ratio of 1.2 to 1.0.
First quarter 2025 Net Income and Operating Income includes non-cash stock compensation expense of $8.7 million, and Company-funded Research and Development (R&D) expense of $10.0 million, including efforts in our Space, Satellite, Unmanned Systems and Microwave Electronic businesses.
Kratos reported first quarter 2025 GAAP Net Income attributable to Kratos of $4.5 million and GAAP Net Income per share of $0.03, compared to GAAP Net Income attributable to Kratos of $1.3 million and GAAP Net Income per share of $0.01, for the first quarter of 2024. Adjusted earnings per share (EPS) was $0.12 for the first quarter of 2025, compared to $0.11 for the first quarter of 2024.
First quarter 2025 Revenues of $302.6 million increased $25.4 million, reflecting 7.4 percent organic growth from first quarter 2024 Revenues of $277.2 million. Organic revenue growth was reported in our Unmanned Systems of 6.2 percent and KGS segment of 7.8 percent. The most notable growth in our KGS segment was in our Defense Rocket Systems, Microwave Products, and C5ISR businesses, with organic revenue growth rates ranging from 13.1 percent and 18.7 percent compared to the first quarter of 2024.
First quarter 2025 Cash Flow Used in Operations was $29.2 million, primarily reflecting the working capital requirements related to the revenue growth impacting our receivables, increases in inventories for anticipated future deliveries and ramps in production and investments we are making related to certain development initiatives in our Unmanned Systems (KUS) segment. Free Cash Flow Used in Operations for the first quarter of 2025 was $51.8 million after funding of $22.6 million of capital expenditures.
For the first quarter of 2025, KUS generated Revenues of $63.1 million and organic revenue growth of 6.2 percent, as compared to $59.4 million in the first quarter of 2024, primarily reflecting increased target drone sales. KUS’s Operating Loss was $1.7 million in the first quarter of 2025, compared to an Operating Loss of $0.4 million in the first quarter of 2024. KUS’s Adjusted EBITDA for the first quarter of 2025 was $1.7 million, compared to $2.9 million for the first quarter of 2024, reflecting the continued impact of increased material and subcontractor and labor costs on multi-year fixed price production contracts under terms which were negotiated in 2020 and 2021 that we are unable to seek recovery and which we are unable to renegotiate until the next multi-year production lot.
KUS’s book-to-bill ratio for the first quarter of 2025 was 1.8 to 1.0 and 1.3 to 1.0 for the twelve months ended March 30, 2025, with bookings of $115.0 million for the three months ended March 30, 2025, and bookings of $359.5 million for the twelve months ended March 30, 2025. Total backlog for KUS at the end of the first quarter of 2025 was $347.1 million, compared to $295.2 million at the end of the fourth quarter of 2024.
For the first quarter of 2025, Kratos’ Government Solutions (KGS) segment Revenues of $239.5 million increased from Revenues of $217.8 million in the first quarter of 2024, reflecting a 7.8 percent organic growth rate, excluding the impact of the recent acquisition of certain assets of Norden Millimeter, Inc. The increased Revenues includes organic revenue growth across all KGS businesses, with the most notable growth in our C5ISR, Defense Rocket Support and Microwave Products businesses with organic revenue growth rates ranging from 13.1 percent to 18.7 percent across such businesses over the first quarter of 2024.
KGS reported Operating Income of $17.0 million in the first quarter of 2025 compared to $16.6 million in the first quarter of 2024, primarily reflecting the volume and mix in revenues. First quarter 2025 KGS Adjusted EBITDA was $25.0 million, compared to first quarter 2024 KGS Adjusted EBITDA of $23.1 million, primarily reflecting the mix in revenues and resources.
KGS reported a book-to-bill ratio of 1.0 to 1.0 for the first quarter of 2025, a book to bill ratio of 1.2 to 1.0 for the last twelve months ended March 30, 2025 and bookings of $250.6 million and $1.041 billion for the three and last twelve months ended March 30, 2025, respectively. KGS’s total backlog was $1.161 billion at the end of the first quarter of 2025, up from $1.150 billion at the end of the fourth quarter of 2024.
Kratos reported consolidated bookings of $365.6 million and a book-to-bill ratio of 1.2 to 1.0 for the first quarter of 2025, and consolidated bookings of $1.401 billion and a book-to-bill ratio of 1.2 to 1.0 for the last twelve months ended March 30, 2025. Consolidated backlog was $1.508 billion on March 30, 2025, as compared to $1.445 billion on December 29, 2024. Kratos’ bid and proposal pipeline was $12.6 billion at March 30, 2025, as compared to $12.4 billion at December 29, 2024. Backlog at March 30, 2025 included funded backlog of $1.174 billion and unfunded backlog of $334.5 million.
Mr. DeMarco said, “Since our last report to you, the Defense and National Security Funding and priorities environment for the industry and for Kratos has become clearer, including a government full year fiscal 2025 CRA and funding now being put in place, a potential additional $150 billion defense related 2025 Reconciliation Bill progressing and the potential for a $1 trillion fiscal 2026 U.S. National Security Budget, all increasing our confidence in Kratos’ 2025 and 2026 full year financial forecasts, including approximately 10 percent and 14 percent year over year, organic revenue growth, respectively. With funding, programmatic, contractual and schedule clarity also now in place, and a 1.2 to 1.0 Q125 and last twelve months book to bill ratio, Kratos’ 2025 Q3 and Q4 are forecasted to be particularly strong, as customer related predictability is expected to return. Also, importantly, Kratos being a military quality hardware and software company, with substantially all of our vendor base and supply chain being U.S. located and sourced, we expect little impact from existing or any currently contemplated tariffs.”
Mr. DeMarco went on, “Kratos’ Israel-based microwave electronics business is one of our Company’s fastest growing, with some of the highest book to bill ratios and EBITDA margins. As planned, we are on schedule to move our production operations into our new and expanded facilities in late June to support large new programs, including air defense, missile, radar and space-related programs, we have received and expect to be successful on. The move will take a couple of weeks, and we have coordinated closely with our customers so that no contractual disruptions as a result of the move are expected. We have accounted for the potential impact to our manufacturing productivity and related financial impact of the move in our second quarter financial guidance provided today, with forecasted June revenues and EBITDA expected to be lower, and July and August higher, as we return to normal operations in July 2025.”
Mr. DeMarco continued, “Important future growth areas for Kratos include, our hypersonic franchise, jet drones, jet engines and propulsion systems for missiles, drones and spacecraft, microwave electronics and C5ISR systems for air defense, missile, radar, counter UAS and other systems. Also, Kratos’ National Security-focused Space and Satellite Business continues to receive increased funding and contract awards, adding to our confidence for higher expected EBITDA margins in 2026, as we begin executing on these new programs, and as our higher margin microwave and propulsion businesses continue to scale.”
Mr. DeMarco concluded, “The recapitalization of strategic weapon systems and the U.S. Defense Industrial Base is providing significant, generational strategic business opportunities for Kratos. We are focused on making investments in our core business areas, in coordination with our customers and partners, to increase our market share, drive revenue growth, and increase our margins. With Kratos’ unique Mil-Spec hardware and software offerings, capabilities and positioning, now is the time to build our Company and create long term, sustainable value for United States National Security and our stakeholders.”
Financial Guidance
We are providing our initial 2025 second quarter guidance and reaffirming our full year 2025 financial guidance range, which includes our assumptions, including as related to: current forecasted business mix, employee sourcing, hiring and retention; manufacturing, production and supply chain disruptions; parts shortages and related continued significant cost and price increases in each of these areas, that are impacting the industry and Kratos.
Kratos’ 2025 financial forecast and guidance includes elevated investments for capital expenditures for property, plant and equipment, including the expansion of our manufacturing and production facilities and related inventory builds in our Rocket Systems and Hypersonic businesses, primarily related to the recent MACH-TB 2.0 contract award, the continued manufacture of two production lots of Valkyries prior to contract award, to meet anticipated customer orders and requirements, the expansion and build-out of the Company’s Microwave Products production facilities, the expansion and build-out of our small jet engine production and test cell facilities, and the build-out of additional secure facilities for our federal secured space communications business, in accordance with contract and customer requirements. Kratos’ operating cash flow guidance also assumes consummation of certain investments in our rocket systems and unmanned systems businesses.
Our second quarter and full year 2025 guidance ranges are as follows:
Current Guidance Range
$M
Q225
FY25
Revenues
$300 – $310
$1,260 – $1,285
R&D
$9 – $10
$40 – $42
Operating Income
$3 – $5
$34 – $39
Depreciation
$8 – $9
$35 – $37
Amortization
$3 – $4
$12 – $13
Stock Based Compensation
$7 – $8
$31 – $32
Adjusted EBITDA
$21 – $25
$112 – $118
Operating Cash Flow
$50 – $60
Capital Expenditures
$125 – $135
Free Cash Flow Use
($75 – $85)
Management will discuss the Company’s financial results on a conference call beginning at 2:00 p.m. Pacific (5:00 p.m. Eastern) today. The call will be available at www.kratosdefense.com. Participants may register for the call using this Online Form. Upon registration, all telephone participants will receive the dial-in number along with a unique PIN that can be used to access the call. For those who cannot access the live broadcast, a replay will be available on Kratos’ website.
About Kratos Defense & Security Solutions
Kratos Defense & Security Solutions, Inc. (NASDAQ: KTOS) is a technology, products, system and software company addressing the defense, national security, and commercial markets. Kratos makes true internally funded research, development, capital and other investments, to rapidly develop, produce and field solutions that address our customers’ mission critical needs and requirements. At Kratos, affordability is a technology, and we seek to utilize proven, leading edge approaches and technology, not unproven bleeding edge approaches or technology, with Kratos’ approach designed to reduce cost, schedule and risk, enabling us to be first to market with cost effective solutions. We believe that Kratos is known as an innovative disruptive change agent in the industry, a company that is an expert in designing products and systems up front for successful rapid, large quantity, low cost future manufacturing which is a value add competitive differentiator for our large traditional prime system integrator partners and also to our government and commercial customers. Kratos intends to pursue program and contract opportunities as the prime or lead contractor when we believe that our probability of win (PWin) is high and any investment required by Kratos is within our capital resource comfort level. We intend to partner and team with a large, traditional system integrator when our assessment of PWin is greater or required investment is beyond Kratos’ comfort level. Kratos’ primary business areas include virtualized ground systems for satellites and space vehicles including software for command & control (C2) and telemetry, tracking and control (TT&C), jet powered unmanned aerial drone systems, hypersonic vehicles and rocket systems, propulsion systems for drones, missiles, loitering munitions, supersonic systems, space craft and launch systems, C5ISR and microwave electronic products for missile, radar, missile defense, space, satellite, counter UAS, directed energy, communication and other systems, and virtual & augmented reality training systems for the warfighter. For more information, visit www.KratosDefense.com
Notice RegardingForward–LookingStatements This news release contains certain forward-looking statements that involve risks and uncertainties, including, without limitation, express or implied statements concerning the Company’s expectations regarding its future financial performance, including the Company’s expectations for its second quarter and full year 2025 revenues, 2025 and 2026 revenue growth rates and expected contributors to 2026 projected revenue growth, organic revenue growth rates, R&D, operating income (loss), depreciation, amortization, stock based compensation expense, and Adjusted EBITDA, and full year 2025 operating cash flow, capital expenditures and other investments, and free cash flow, the Company’s future growth trajectory and ability to achieve improved revenue mix and profit in certain of its business segments and the expected timing of such improved revenue mix and profit, including the Company’s ability to achieve sustained year over year increasing revenues, profitability and cash flow, the Company’s expectation of ramp on projects and that investments in its business, including Company funded R&D expenses and ongoing development efforts, will result in an increase in the Company’s market share and total addressable market and position the Company for significant future organic growth, profitability, cash flow and an increase in shareholder value, the Company’s bid and proposal pipeline and backlog, including the Company’s ability to timely execute on its backlog, demand for its products and services, including the Company’s alignment with today’s National Security requirements and the positioning of its C5ISR and other businesses, planned 2025 investments, including in the tactical drone and satellite areas, and the related potential for additional growth in 2025 and beyond, ability to successfully compete and expected new customer awards, including the magnitude and timing of funding and the future opportunity associated with such awards, including in the target and tactical drone and satellite communication areas, performance of key contracts and programs, including the timing of production and demonstration related to certain of the Company’s contracts and control (TT&C) product offerings, the impact of the Company’s restructuring efforts and cost reduction measures, including its ability to improve profitability and cash flow in certain business units as a result of these actions and to achieve financial leverage on fixed administrative costs, the ability of the Company’s advanced purchases of inventory to mitigate supply chain disruptions and the timing of converting these investments to cash through the sales process, benefits to be realized from the Company’s net operating loss carry forwards, the availability and timing of government funding for the Company’s offerings, including the strength of the future funding environment, the short-term delays that may occur as a result of Continuing Resolutions or delays in U.S. Department of Defense (DoD) budget approvals, timing of LRIP and full rate production related to the Company’s unmanned aerial target system offerings, as well as the level of recurring revenues expected to be generated by these programs once they achieve full rate production, market and industry developments, and any unforeseen risks associated with any supply chain disruptions, availability of an experienced skilled workforce, inflation and increased costs, risks related to potential cybersecurity events or disruptions of our information technology systems, and delays in our financial projections, industry, business and operations, including projected growth. Such statements are only predictions, and the Company’s actual results may differ materially from the results expressed or implied by these statements. Investors are cautioned not to place undue reliance on any such forward-looking statements. All such forward-looking statements speak only as of the date they are made, and the Company undertakes no obligation to update or revise these statements, whether as a result of new information, future events or otherwise. Factors that may cause the Company’s results to differ include, but are not limited to: risks to our business and financial results related to the reductions and other spending constraints imposed on the U.S. Government and our other customers, including as a result of sequestration and extended continuing resolutions, the Federal budget deficit and Federal government shut-downs; risks of adverse regulatory action or litigation; risks associated with debt leverage; risks that our cost-cutting initiatives will not provide the anticipated benefits; risks that changes, cutbacks or delays in spending by the DoD may occur, which could cause delays or cancellations of key government contracts; risks of delays to or the cancellation of our projects as a result of protest actions submitted by our competitors; risks that changes may occur in Federal government (or other applicable) procurement laws, regulations, policies and budgets; risks of the availability of government funding for the Company’s products and services due to performance, cost growth, or other factors, changes in government and customer priorities and requirements (including cost-cutting initiatives, the potential deferral of awards, terminations or reduction of expenditures to respond to the priorities of Congress and the Administration, or budgetary cuts resulting from Congressional committee recommendations or automatic sequestration under the Budget Control Act of 2011, as amended); risks that the unmanned aerial systems and unmanned ground sensor markets do not experience significant growth; risks that products we have developed or will develop will not become programs of record; risks that we cannot expand our customer base or that our products do not achieve broad acceptance which could impact our ability to achieve our anticipated level of growth; risks of increases in the Federal government initiatives related to in-sourcing; risks related to security breaches, including cyber security attacks and threats or other significant disruptions of our information systems, facilities and infrastructures; risks related to our compliance with applicable contracting and procurement laws, regulations and standards; risks related to the new DoD Cybersecurity Maturity Model Certification; risks relating to the ongoing conflict in Ukraine and the Israeli-Palestinian military conflict; risks to our business in Israel; risks related to contract performance; risks related to failure of our products or services; risks associated with our subcontractors’ or suppliers’ failure to perform their contractual obligations, including the appearance of counterfeit or corrupt parts in our products; changes in the competitive environment (including as a result of bid protests); failure to successfully integrate acquired operations and compete in the marketplace, which could reduce revenues and profit margins; risks that potential future goodwill impairments will adversely affect our operating results; risks that anticipated tax benefits will not be realized in accordance with our expectations; risks that a change in ownership of our stock could cause further limitation to the future utilization of our net operating losses; risks that we may be required to record valuation allowances on our net operating losses which could adversely impact our profitability and financial condition; risks that the current economic environment will adversely impact our business, including with respect to our ability to recruit and retain sufficient numbers of qualified personnel to execute on our programs and contracts, as well as expected contract awards and risks related to increasing interest rates and risks related to the interest rate swap contract to hedge Term SOFR associated with the Company’s Term Loan A; currently unforeseen risks associated with any public health crisis, and risks related to natural disasters or severe weather. These and other risk factors are more fully discussed in the Company’s Annual Report on Form 10-K for the period ended December 29, 2024, and in our other filings made with the Securities and Exchange Commission.
Note Regarding Use of Non-GAAP Financial Measures and Other Performance Metrics This news release contains non-GAAP financial measures, including organic revenue growth rates, Adjusted EPS (computed using income from continuing operations before income taxes, excluding income (loss) from discontinued operations, excluding income (loss) attributable to non-controlling interest, excluding depreciation, amortization of intangible assets, amortization of capitalized contract and development costs, stock-based compensation expense, acquisition and restructuring related items and other, which includes, but is not limited to, legal related items, non-recoverable rates and costs, and foreign transaction gains and losses, less the estimated impact to income taxes) and Adjusted EBITDA (which includes net income (loss) attributable to noncontrolling interest and excludes, among other things, losses and gains from discontinued operations, acquisition and restructuring related items, stock compensation expense, foreign transaction gains and losses, and the associated margin rates). Additional non-GAAP financial measures include Free Cash Flow from Operations computed as Cash Flow from Operations less Capital Expenditures plus proceeds from sale of assets and Adjusted EBITDA related to our KUS and KGS businesses. Kratos believes this information is useful to investors because it provides a basis for measuring the Company’s available capital resources, the actual and forecasted operating performance of the Company’s business and the Company’s cash flow, excluding non-recurring items and non-cash items that would normally be included in the most directly comparable measures calculated and presented in accordance with GAAP. The Company’s management uses these non-GAAP financial measures, along with the most directly comparable GAAP financial measures, in evaluating the Company’s actual and forecasted operating performance, capital resources and cash flow. Non-GAAP financial measures should not be considered in isolation from, or as a substitute for, financial information presented in compliance with GAAP, and investors should carefully evaluate the Company’s financial results calculated in accordance with GAAP and reconciliations to those financial results. In addition, non-GAAP financial measures as reported by the Company may not be comparable to similarly titled amounts reported by other companies. As appropriate, the most directly comparable GAAP financial measures and information reconciling these non-GAAP financial measures to the Company’s financial results prepared in accordance with GAAP are included in this news release.
Another Performance Metric the Company believes is a key performance indicator in our industry is our Book to Bill Ratio as it provides investors with a measure of the amount of bookings or contract awards as compared to the amount of revenues that have been recorded during the period and provides an indicator of how much of the Company’s backlog is being burned or utilized in a certain period. The Book to Bill Ratio is computed as the number of bookings or contract awards in the period divided by the revenues recorded for the same period. The Company believes that the rolling or last twelve months’ Book to Bill Ratio is meaningful since the timing of quarter-to-quarter bookings can vary.
Revenues Increased 148.4% to $211.1 Million Benihana Same Store Sales Increased 0.7% and STK Transactions Increased 4.1%
DENVER–(BUSINESS WIRE)– The ONE Group Hospitality, Inc. (“The ONE Group” or the “Company”) (Nasdaq: STKS) today reported its financial results for the first quarter ended March 30, 2025.
Highlights for the first quarter 2025 compared to the same quarter in 2024 are as follows (the prior year quarter excludes any contribution from the acquisition of Benihana Inc. which closed in May 2024):
Total GAAP revenues increased 148.4% to $211.1 million from $85.0 million;
Consolidated comparable sales*decreased 3.2%;
Operating income increased$11.3 million to $10.7 million from an operating loss of $0.6 million;
Restaurant EBITDA**increased 162.7% to $34.0 million from $12.9 million;
GAAP net loss available to common stockholders was $6.6 million, or $0.21 net loss per share ($0.14 adjusted net income per share)***, compared to GAAP net loss available to common stockholders of $2.1 million, or $0.07 net loss per share ($0.02 adjusted net loss per share)***
Adjusted EBITDA**** attributable to The ONE Group Hospitality, Inc. increased 233% to $25.2 million from $7.6 million.
“We were pleased that revenues, comparable sales and adjusted EBITDA reached or exceeded the higher end of our guided ranges. These accomplishments were driven by another quarter of sequential improvement in our comparable sales trend, positive comparable sales at our Benihana restaurants and strong positive transaction growth of 4.1% at our flagship STK brand. Notably, adjusted EBITDA grew 233% to $25.2 million, significantly exceeding our top-line growth and demonstrating our ability to increase profitability through the execution of our initiatives, tight cost management and our growing economies of scale. We are reiterating our full year guidance for 2025 and remain on track to deliver at least $20 million in acquisition synergies by 2026,” said Emanuel “Manny” Hilario, President and CEO of The ONE Group.
“In 2025, we plan to open five to seven new venues. Over the long term, we aim to balance our significant unit growth opportunities between company-owned and asset-light development, driving shareholder returns while maintaining flexibility in our balance sheet,” Hilario concluded.
Restaurant Development
The Company plans to open five to seven new venues in 2025.
Date
Brand
Location
Type
Status
March 2025
Benihana
San Mateo, California
Owned
Open
April 2025
STK
Topanga, California
Owned
Open
May 2025
STK
Los Angeles, California
Owned
Under Construction (re-location)
Upcoming
Kona Grill
Seattle, Washington
Owned
Under Construction
Liquidity and Share Repurchase Program
As of March 30, 2025, we held $34.1 million in cash and short-term credit card receivables and had $33.6 million available under our revolving credit facility. Under the current conditions, our credit facility does not have any financial covenants.
In March 2024, our Board of Directors authorized a $5 million share repurchase program. During the first quarter ended March 30, 2025, the Company purchased 0.1 million shares for aggregate consideration of $0.3 million
2025 Targets
As of January 1, 2025, we will report financial information on a fiscal quarter basis using four 13-week quarters with the addition of a 53rd week when necessary. For 2025, our fiscal calendar begins on January 1, 2025 and ends on December 28, 2025 and our first quarter had 89 days.
Financial Results and Other Select Data US$s in millions
Q2 2025 Guidance June 29, 2025
2025 Guidance December 28, 2025
Total GAAP revenues
$205 to $210
$835 to $870
Consolidated comparable sales
-5.5% to -4%
-3% to 1%
Managed, license and franchise fee revenues
$3 to $4
$15 to $16
Total owned operating expenses as a percentage of owned restaurant net revenue
Approx. 83%
83.5% to 82.2%
Consolidated total G&A, excluding stock-based compensation
Approx. $11
Approx. $47
Consolidated Adjusted EBITDA*
$23 to $25
$95 to $115
Consolidated restaurant pre-opening expenses
$1.5 to $2
$7 to $8
Consolidated effective income tax rate
Approx. 7.5%
Consolidated total capital expenditures, net of allowances received by landlords
$45 to $50
Consolidated number of new system-wide venues
2 new venues
5-7 new venues
*We have not reconciled guidance for Consolidated Adjusted EBITDA to the corresponding GAAP financial measure because we do not provide guidance for the various reconciling items. We are unable to provide guidance for these reconciling items because we cannot determine their probable significance, as certain items are outside of our control and cannot be reasonably predicted since these items could vary significantly from period to period. Accordingly, reconciliations to the corresponding GAAP financial measure are not available without unreasonable effort.
Conference Call and Webcast
Emanuel “Manny” Hilario, President and Chief Executive Officer, and Tyler Loy, Chief Financial Officer, will host a conference call and webcast today at 4:30 PM Eastern Time.
The conference call can be accessed live over the phone by dialing 412-542-4186. A replay will be available after the call and can be accessed by dialing 412-317-6671; the passcode is 10198138. The replay will be available until Thursday, May 22, 2025.
The webcast can be accessed from the Investor Relations tab of The ONE Group’s website at www.togrp.com under “News / Events.”
About The ONE Group
The ONE Group Hospitality, Inc. (Nasdaq: STKS) is an international restaurant company that develops and operates upscale and polished casual, high-energy restaurants and lounges and provides hospitality management services for hotels, casinos and other high-end venues both in the U.S. and internationally. The ONE Group’s focus is to be the global leader in Vibe Dining, and its primary restaurant brands and operations are:
STK, a modern twist on the American steakhouse concept with restaurants in major metropolitan cities in the U.S., Europe and the Middle East, featuring premium steaks, seafood and specialty cocktails in an energetic upscale atmosphere.
Benihana, an interactive dining destination with highly skilled chefs preparing food right in front of guests and served in an energetic atmosphere alongside fresh sushi and innovative cocktails. The Company franchises Benihanas in the U.S., Caribbean, Central America, and South America.
Kona Grill, a polished casual, bar-centric grill concept with restaurants in the U.S., featuring American favorites, award-winning sushi, and specialty cocktails in an upscale casual atmosphere.
RA Sushi, a Japanese cuisine concept that offers a fun-filled, bar-forward, upbeat, and vibrant dining atmosphere with restaurants in the U.S. anchored by creative sushi, inventive drinks, and outstanding service.
Salt Water Social is your gateway to the seven seas, featuring an array of signature and unique fresh seafood items, complemented by the highest quality beef dishes and elegant, delicious cocktails.
Samurai, an interactive dining experience located in sunny Miami, FL and soon to be in Westwood, CA, provides a distinctive dining experience where skilled personal chefs masterfully perform the ancient art of teppanyaki, anywhere from two to twenty tables, right before your eyes along with a robust selection of steak offerings.
ONE Hospitality, The ONE Group’s food and beverage hospitality services business develops, manages and operates premier restaurants and turnkey food and beverage services within high-end hotels and casinos currently operating venues in the U.S. and Europe.
Additional information about The ONE Group can be found at www.togrp.com.
Non-GAAP Definitions
We have evolved our definition of non-GAAP financial measures starting in Q3 2024 and Q1 2025. We use certain non-GAAP measures in analyzing operating performance and believe that the presentation of these measures provides investors and analysts with information that is beneficial to gaining an understanding of the Company’s financial results. Non-GAAP disclosures should not be viewed as a substitute for financial results determined in accordance with GAAP.
We exclude items management does not consider in the evaluation of its ongoing core operating performance from adjusted net income, adjusted net income / (loss) per share, and Adjusted EBITDA. Starting in Q3 2024, we no longer deduct pre-opening expenses from Adjusted EBITDA. Starting in Q1 2025, we are deducting Series A Preferred Stock paid in kind dividend and accretion from adjusted net income / (loss). Reconciliations of these non-GAAP measures are included under “Reconciliation of Non-GAAP Measures” in this press release.
*Comparable sales represent total U.S. food and beverage sales at owned and managed units, a non-GAAP financial measure, opened for at least a full 24-months. This measure includes total revenue from our owned and managed locations. The Company monitors sales growth at its established restaurant base in addition to growth that results from restaurant acquisitions and new restaurant openings. Refer to the reconciliation of GAAP revenue to total food and beverage sales at owned and managed units in this press release.
**We define Restaurant EBITDA as owned restaurant net revenue minus owned restaurant cost of sales and owned restaurant operating expenses before non-cash rent. Restaurant EBITDA has been presented in this press release and is a supplemental measure of financial performance that is not required by, or presented in accordance with, GAAP. Refer to the reconciliation of Operating income to Restaurant EBITDA in this press release.
***We define adjusted net income / (loss) as net income / (loss) available to common stockholders before Series A Preferred Stock paid-in-kinddividend andaccretion, transaction and exit expenses, transition and integration expenses, non-cash rent during the pre-opening period, other non-recurring costs and the income tax effect of any adjustments. Adjusted net income / (loss) has been presented in this press release and is a supplemental measure of financial performance that is not required by, or presented in accordance with, GAAP. Refer to the reconciliation of net (loss) / income to adjusted net income / (loss) available to common stockholders in this press release.
****We define Adjusted EBITDA as net income before interest expense, provision for income taxes, depreciation and amortization, non-cash impairment loss, non-cash rent expense, non-recurring gains and losses, stock-based compensation, transaction and exit costs and transition and integration expenses. Starting in Q3 2024, pre-opening expenses are no longer deducted from Adjusted EBITDA. Adjusted EBITDA has been presented in this press release and is a supplemental measure of financial performance that is not required by, or presented in accordance with, GAAP. Refer to the reconciliation of Net Income to Adjusted EBITDA in this press release.
Cautionary Statement on Forward-Looking Statements
This press release includes “forward-looking statements” within the meaning of the “safe harbor” provisions of the United States Private Securities Litigation Reform Act of 1995, including with respect to the impact of the Benihana Inc. acquisition, restaurant openings and 2025 financial targets. Forward-looking statements may be identified by the use of words such as “target,” “intend,” “anticipate,” “believe,” “expect,” “estimate,” “plan,” “outlook,” and “project” and other similar expressions that predict or indicate future events or trends or that are not statements of historical matters. A number of factors could cause actual results or outcomes to differ materially from those indicated by such forward-looking statements, including but not limited to: (1) our ability to integrate the new or acquired restaurants into our operations without disruptions to operations; (2) our ability to capture anticipated synergies; (3) our ability to open new restaurants and food and beverage locations in current and additional markets, grow and manage growth profitably, maintain relationships with suppliers and obtain adequate supply of products and retain employees; (4 )factors beyond our control that affect the number and timing of new restaurant openings, including weather conditions and factors under the control of landlords, contractors and regulatory and/or licensing authorities; (5) our ability to successfully improve performance and cost, realize the benefits of our marketing efforts and achieve improved results as we focus on developing new management and license deals; (6) changes in applicable laws or regulations; (7) the possibility that The ONE Group may be adversely affected by other economic, business, and/or competitive factors, including economic downturns; (8) the impact of actual and potential changes in immigration policies and the imposition of tariffs, including increases in food prices and inflation and potential labor shortages and any resulting negative impacts on the macro-economic environment; and (9) other risks and uncertainties indicated from time to time in our filings with the Securities and Exchange Commission, including our Annual Report on Form 10-K filed for the year ended December 31, 2024 and Quarterly Reports on Form 10-Q.
Investors are referred to the most recent reports filed with the Securities and Exchange Commission by The ONE Group Hospitality, Inc. Investors are cautioned not to place undue reliance upon any forward-looking statements, which speak only as of the date made, and we undertake no obligation to update or revise the forward-looking statements, whether as a result of new information, future events or otherwise.
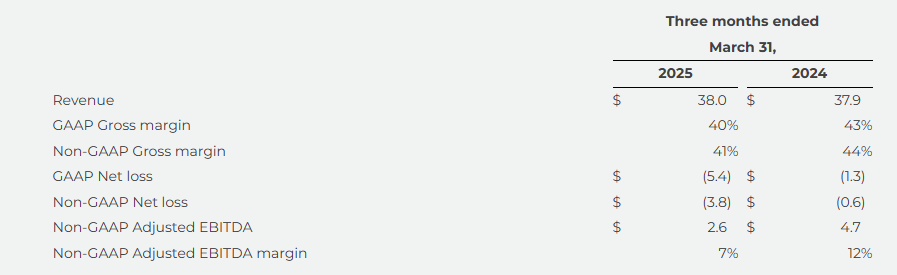
NORWOOD, Mass., May 07, 2025 (GLOBE NEWSWIRE) — MariMed Inc. (“MariMed” or the “Company”) (CSE: MRMD) (OTCQX: MRMD), a leading multi-state cannabis operator focused on improving lives every day, today announced its financial results for the first quarter ended March 31, 2025.
Management Commentary
“We are executing on our vision to build the best consumer packaged goods company in cannabis, and over the past quarter we continued to penetrate more storefronts and capture more market share for our innovative, high-quality portfolio of brands,” said Jon Levine, MariMed Chief Executive Officer. “Our Betty’s Eddies™ cannabis chews remained the top-selling edible in Massachusetts, Maryland, and Delaware, and moved up to the #5 position in Illinois after its launch there just over a year ago. Our other core brands also achieved strong market share growth as we sold our products into 70 new storefronts. Wholesale sales now account for 44 percent of our revenue mix, an upward trend that we anticipate will continue as we further leverage our brands as the primary growth engine for the Company.”
“We are pleased to report sequential revenue growth in the first quarter of 2025, driven by continued strength in wholesale performance,” said Mario Pinho, MariMed Chief Financial Officer. “Wholesale sales helped to offset the financial impact of a soft quarter at retail as well as ramp-up costs associated with our new assets in Illinois and Missouri. We remain confident in delivering enhanced shareholder value through expanded brand distribution into new storefronts; the pursuit of new revenue streams, including through M&A, brand licensing, and potential entry into the hemp space; and a continued focus on disciplined cost management, operational efficiencies, and improved execution.”
Financial Highlights1
The following table summarizes the Company’s consolidated financial highlights (in millions, except percentage amounts):
1 See the reconciliations of non-GAAP financial measures to the most directly comparable GAAP measures and additional information about non-GAAP measures in the section entitled “Discussion of Non-GAAP Financial Measures” below and in the financials information included herewith.
CONFERENCE CALL
MariMed management will host a conference call on Thursday, May 8, 2025 at 8:00 a.m. Eastern time, to discuss these results. The conference call may be accessed through MariMed’s Investor Relations website, or by clicking the following link: Q125 MRMD Earnings Call.
FIRST QUARTER 2025 OPERATIONAL HIGHLIGHTS
During the first quarter, the Company announced the following development in the implementation of its strategic growth plan:
February 28: Completed its acquisition of First State Compassion Center (“FSCC”), the leading cannabis operator in Delaware, in accordance with the terms of the previously announced Omnibus Agreement entered into with FSCC in July 2023. The acquisition integrates FSCC’s cultivation and processing facilities and two dispensaries into MariMed’s fully vertical operations, further enhancing the Company’s revenue and profitability.
OTHER DEVELOPMENTS
Subsequent to the end of the first quarter, the Company announced the following further developments:
April 1: Commenced distribution of its Nature’s Heritage™-branded cannabis flower, pre-rolls, and vapes in Illinois, marking the first time the brand’s premium products are available in the state.
April 3: Expanded the line-up of its top-selling Betty’s Eddies™-branded cannabis chews with the introduction of a new caramel chew, Betty’s Caramelt Away.
April 8: Promoted Ryan Crandall to Chief Commercial Officer to lead the Company’s commercial strategy and activities, including Sales, Marketing, Product Development, and Retail Operations. He had served as the Company’s Chief Revenue Officer since July 2022, and prior was its Chief Products Officer and SVP, Sales for four years.
DISCUSSION OF NON-GAAP FINANCIAL MEASURES
MariMed’s management uses several different financial measures, both GAAP and non-GAAP, in analyzing and assessing the overall performance of its business, making operating decisions, and planning and forecasting future periods. The Company has provided in this release several non-GAAP financial measures: Non-GAAP Adjusted EBITDA and non-GAAP Adjusted EBITDA margin, Non-GAAP Gross margin, Non-GAAP Operating expenses and Non-GAAP Net income (loss), as supplements to Revenue, Gross margin, Operating expenses, Income (loss) from operations, Net income (loss) and other financial measures prepared in accordance with GAAP.
Management believes these non-GAAP financial measures are useful in reviewing and assessing the performance of the Company, and when planning and forecasting future periods, as they provide meaningful operating results by excluding the effects of expenses that are not reflective of its operating business performance. In addition, the Company’s management uses these non-GAAP financial measures to understand and compare operating results across accounting periods and for financial and operational decision-making. The presentation of these non-GAAP measures is not intended to be considered in isolation or as a substitute for the financial information prepared in accordance with GAAP.
Management believes that investors and analysts benefit from considering non-GAAP financial measures in assessing the Company’s financial results and its ongoing business, as it allows for meaningful comparisons and analysis of trends in the business. In particular, non-GAAP adjusted EBITDA is used by many investors and analysts themselves, along with other metrics, to compare financial results across accounting periods and to those of peer companies.
As there are no standardized methods of calculating non-GAAP financial measures, the Company’s calculations may differ from those used by analysts, investors and other companies, even those within the cannabis industry, and therefore may not be directly comparable to similarly titled measures used by others.
Management defines non-GAAP Adjusted EBITDA as income (loss) from operations, determined in accordance with GAAP, excluding the following items:
depreciation and amortization of property and equipment;
amortization of acquired intangible assets;
impairment or write-downs of acquired intangible assets;
inventory revaluation;
stock-based compensation;
severance;
legal settlements; and
acquisition-related and other expenses.
For further information, please refer to the publicly available financial filings available on MariMed’s Investor Relations website, as filed with the U.S. Securities and Exchange Commission, or as filed with the Canadian securities regulatory authorities on the SEDAR website.
ABOUT MARIMED
MariMed Inc. is a leading multi-state cannabis operator, known for developing and managing state-of-the-art cultivation, production, and retail facilities. Our award-winning portfolio of cannabis brands, including Betty’s Eddies™, Bubby’s Baked™, Vibations™, InHouse™, and Nature’s Heritage™, sets us apart as an industry leader. These trusted brands, crafted with quality and innovation, are recognized and loved by consumers across the country. With a commitment to excellence, MariMed continues to drive growth and set new standards in the cannabis industry. For additional information, visit www.marimedinc.com.
IMPORTANT CAUTION REGARDING FORWARD-LOOKING STATEMENTS:
The information in this release contains “forward-looking” statements within the meaning of the U.S. Private Securities Litigation Reform Act of 1995, which are subject to several risks and uncertainties. All statements other than statements of historical facts contained in this release, including without limitation statements regarding projected financial results for 2025, including anticipated openings of dispensaries and facilities, timing of regulatory approvals, plans and objectives of management for future operations, are forward-looking statements. Without limiting the foregoing, the words “anticipates”, “believes”, “estimates”, “expects”, “expectations”, “intends”, “may”, “plans”, and other similar language, whether in the negative or affirmative, are intended to identify forward-looking statements, although not all forward-looking statements contain these identifying words.
Forward-looking statements are based on our current beliefs and assumptions regarding our business, timing of regulatory approvals, the ability to obtain new licenses, business prospects and strategic growth plan, and other future conditions. Because forward-looking statements relate to the future, they are subject to inherent uncertainties, risks and changes in circumstances that are difficult to predict. Our actual results may differ materially from those contemplated in these forward-looking statements due to various risks, uncertainties, and other important factors, including, among others, reductions in customer spending, our ability to recruit and retain key personnel, and disruptions from the integration efforts of acquired companies.
These factors are not intended to be an all-encompassing list of risks and uncertainties that may affect our business and results of operations. These statements are not a guarantee of future performance and involve risk and uncertainties that are difficult to predict, including, among other factors, changes in demand for the Company’s services and products, changes in the law and its enforcement, and changes in the economic environment. Additional information regarding these and other factors can be found in our reports filed with the U.S. Securities and Exchange Commission. In providing these forward-looking statements, the Company expressly disclaims any obligation to update these statements publicly or otherwise, whether as a result of new information, future events or otherwise, except as required by law.
All trademarks and service marks are the property of their respective owners.
For More Information Contact:
Howard Schacter, Chief Communications Officer Email: hschacter@marimedinc.com Phone: (781) 277-0007
SAN DIEGO, May 07, 2025 (GLOBE NEWSWIRE) — Kratos Defense & Security Solutions, Inc. (NASDAQ: KTOS), a Technology Company in the Defense, National Security and Global Markets, today announced it will webcast a special presentation from President and CEO Eric DeMarco as part of its 2025 Annual Meeting of Shareholders. The webcast will be open to the public and will take place on Wednesday, May 14, 2025, at 9:00 a.m. PDT.
During the webcast, Mr. DeMarco will provide a comprehensive business-wide update covering Kratos’ strategic priorities, operational highlights, technology initiatives, and market outlook across all divisions. The presentation will also highlight the company’s progress in hypersonic systems, unmanned platforms, propulsion, space-based capabilities, and dual-use technologies.
Shareholders who have logged into the meeting with their 16-digit Control Number will have the opportunity to submit questions relevant to the matters properly addressed during the meeting after the formal business of the meeting has been conducted. Instructions for submitting questions will be provided to shareholders once logged into the meeting. The Annual Meeting is open to shareholders of record as of March 17, 2025 (Record Date) and/or their designated representatives. Interested persons who were not shareholders as of the close of business on the Record Date may view, but not participate in, the Annual Meeting at www.virtualshareholdermeeting.com/KTOS2025.
About Kratos Defense & Security Solutions Kratos Defense & Security Solutions, Inc. (NASDAQ: KTOS) is a technology, products, system and software company addressing the defense, national security, and commercial markets. Kratos makes true internally funded research, development, capital and other investments, to rapidly develop, produce and field solutions that address our customers’ mission critical needs and requirements. At Kratos, affordability is a technology, and we seek to utilize proven, leading edge approaches and technology, not unproven bleeding edge approaches or technology, with Kratos’ approach designed to reduce cost, schedule and risk, enabling us to be first to market with cost effective solutions. We believe that Kratos is known as an innovative disruptive change agent in the industry, a company that is an expert in designing products and systems up front for successful rapid, large quantity, low cost future manufacturing which is a value add competitive differentiator for our large traditional prime system integrator partners and also to our government and commercial customers. Kratos intends to pursue program and contract opportunities as the prime or lead contractor when we believe that our probability of win (PWin) is high and any investment required by Kratos is within our capital resource comfort level. We intend to partner and team with a large, traditional system integrator when our assessment of PWin is greater or required investment is beyond Kratos’ comfort level. Kratos’ primary business areas include virtualized ground systems for satellites and space vehicles including software for command & control (C2) and telemetry, tracking and control (TT&C), jet powered unmanned aerial drone systems, hypersonic vehicles and rocket systems, propulsion systems for drones, missiles, loitering munitions, supersonic systems, space craft and launch systems, C5ISR and microwave electronic products for missile, radar, missile defense, space, satellite, counter UAS, directed energy, communication and other systems, and virtual & augmented reality training systems for the warfighter. For more information, visit www.KratosDefense.com.
LOS ANGELES, May 07, 2025 (GLOBE NEWSWIRE) — FAT(Fresh. Authentic. Tasty.) Brands Inc. (NASDAQ: FAT) (“FAT Brands” or the “Company”), a leading global franchising company and parent company of iconic brands including Round Table Pizza, Fatburger, Johnny Rockets, Twin Peaks, Fazoli’s and 13 other restaurant concepts, today announced that the Company will host a conference call to review its first quarter 2025 financial results on Thursday, May 8, 2025 at 5:30 PM ET. A press release with first quarter 2025 financial results will be issued prior to the conference call that day.
The conference call can be accessed live over the phone by dialing 1-877-704-4453 from the U.S. or 1-201-389-0920 internationally. A replay will be available after the call until Thursday, May 29, 2025, and can be accessed by dialing 1-844-512-2921 from the U.S. or 1-412-317-6671 internationally. The passcode is 13752592. Hosting the call will be Andy Wiederhorn, Chairman, and Ken Kuick, Co-Chief Executive Officer and Chief Financial Officer.
The conference call will also be webcast live from the corporate website at www.fatbrands.com, under the “Investors” section. A replay of the webcast will be available through the corporate website shortly after the call has concluded.
About FAT (Fresh. Authentic. Tasty.) Brands
FAT Brands (NASDAQ: FAT) is a leading global franchising company that strategically acquires, markets, and develops fast casual, quick-service, casual dining, and polished casual dining concepts around the world. The Company currently owns 18 restaurant brands: Round Table Pizza, Fatburger, Marble Slab Creamery, Johnny Rockets, Fazoli’s, Twin Peaks, Great American Cookies, Smokey Bones, Hot Dog on a Stick, Buffalo’s Cafe & Express, Hurricane Grill & Wings, Pretzelmaker, Elevation Burger, Native Grill & Wings, Yalla Mediterranean and Ponderosa and Bonanza Steakhouses, and franchises and owns over 2,300 units worldwide. For more information on FAT Brands, please visit www.fatbrands.com.
Allowed Patent Claims Cover the Synergistic Combination of Gedeptin® Therapy with Radiation As a Targeted Approach for Solid Tumors
Atlanta, GA – May 7, 2025 – GeoVax Labs, Inc. (Nasdaq: GOVX), a clinical-stage biotechnology company developing immunotherapies and vaccines against solid tumors and infectious diseases, announced today that the U.S. Patent and Trademark Office has issued a Notice of Allowance related to U.S. patent application 17/502,101 entitled “Enhanced Therapeutic Usage of a Purine Nucleoside Phosphorylase or Nucleoside Hydrolase Prodrug”. The allowed claims further strengthen GeoVax’s intellectual property position in the oncology space.
The allowed claims describe a method for treating solid tumors—including glioblastoma, breast, prostate, head and neck, glioma, and lung cancers—through the direct intratumoral administration of an adenoviral vector encoding purine nucleoside phosphorylase (Ad/PNP), followed by local administration of the prodrug fludarabine phosphate (F-araAMP), and subsequent radiation therapy. This triple-combination strategy is designed to generate local, targeted cytotoxic activity within the tumor microenvironment while minimizing systemic toxicity.
The allowed patent joins the growing Gedeptin intellectual property portfolio, which was exclusively licensed to GeoVax through a prior agreement with PNP Therapeutics, Inc. and the University of Alabama at Birmingham (UAB)/Southern Research. Under the agreement, GeoVax has assumed all licensing rights and IP prosecution responsibilities for the Gedeptin platform.
David Dodd, Chairman and CEO of GeoVax, commented, “This allowed patent underscores the clinical and commercial promise of our Gedeptin platform and demonstrates our commitment to expanding therapeutic options for patients with difficult-to-treat cancers. While the claims do not directly mirror our ongoing clinical programs, they establish a critical foundation for future directions, including potential integration with advanced delivery systems for tumors that are challenging to access.”
Dodd continued, “The USPTO’s recognition of this therapeutic method further validates our approach and underscores the growing value of our wholly owned, co-owned, and in-licensed intellectual property estate, now standing at over 135 granted or pending patent applications spread across 23 distinct patent families”.
Having successfully completed a Phase 1/2a study, as monotherapy in advanced head and Neck cancer patients, Gedeptin is scheduled to begin a Phase 2 trial in combination with an Immune Check Inhibitor (ICI) for patients with first recurrence of head and neck cancer. The newly allowed claims provide further protection as GeoVax explores expanded applications, including novel device-based delivery approaches in potential partnership with interventional oncology companies.
About Gedeptin
Gedeptin is a viral-vectored gene therapy that employs a non-replicating adenoviral vector encoding the E. coli enzyme purine nucleoside phosphorylase (PNP). When injected directly into a tumor and followed by systemic administration of the prodrug fludarabine phosphate, PNP enzymatically converts the prodrug into a cytotoxic metabolite (fluoroadenine), resulting in selective killing of tumor cells by disrupting RNA and protein synthesis.
This tumor-targeted approach offers several key advantages:
Localized cytotoxicity with reduced systemic side effects,
Potential synergy with immune checkpoint inhibitors (ICIs),
Applicability across multiple solid tumor types, particularly those accessible for intratumoral injection.
Gedeptin will soon be evaluated in a Phase 2 clinical trial for patients with first recurrence of head and neck cancer in combination with an approved ICI. It has been granted Orphan Drug Designation by the U.S. FDA for intratumoral treatment of oral and pharyngeal cancers.
About GeoVax
GeoVax Labs, Inc. is a clinical-stage biotechnology company developing novel vaccines against infectious diseases and therapies for solid tumor cancers. The Company’s lead clinical program is GEO-CM04S1, a next-generation COVID-19 vaccine currently in three Phase 2 clinical trials, being evaluated as (1) a primary vaccine for immunocompromised patients such as those suffering from hematologic cancers and other patient populations for whom the current authorized COVID-19 vaccines are insufficient, (2) a booster vaccine in patients with chronic lymphocytic leukemia (CLL) and (3) a more robust, durable COVID-19 booster among healthy patients who previously received the mRNA vaccines. In oncology the lead clinical program is evaluating a novel oncolytic solid tumor gene-directed therapy, Gedeptin®, having recently completed a multicenter Phase 1/2 clinical trial for advanced head and neck cancers. The Company is also developing GEO-MVA, a vaccine targeting Mpox and smallpox. GeoVax has a strong IP portfolio in support of its technologies and product candidates, holding worldwide rights for its technologies and products. For more information about the current status of our clinical trials and other updates, visit our website: www.geovax.com.
Forward-Looking Statements
This release contains forward-looking statements regarding GeoVax’s business plans. The words “believe,” “look forward to,” “may,” “estimate,” “continue,” “anticipate,” “intend,” “should,” “plan,” “could,” “target,” “potential,” “is likely,” “will,” “expect” and similar expressions, as they relate to us, are intended to identify forward-looking statements. We have based these forward-looking statements largely on our current expectations and projections about future events and financial trends that we believe may affect our financial condition, results of operations, business strategy and financial needs. Actual results may differ materially from those included in these statements due to a variety of factors, including whether: GeoVax is able to obtain acceptable results from ongoing or future clinical trials of its investigational products, GeoVax’s immuno-oncology products and preventative vaccines can provoke the desired responses, and those products or vaccines can be used effectively, GeoVax’s viral vector technology adequately amplifies immune responses to cancer antigens, GeoVax can develop and manufacture its immuno-oncology products and preventative vaccines with the desired characteristics in a timely manner, GeoVax’s immuno-oncology products and preventative vaccines will be safe for human use, GeoVax’s vaccines will effectively prevent targeted infections in humans, GeoVax’s immuno-oncology products and preventative vaccines will receive regulatory approvals necessary to be licensed and marketed, GeoVax raises required capital to complete development, there is development of competitive products that may be more effective or easier to use than GeoVax’s products, GeoVax will be able to enter into favorable manufacturing and distribution agreements, and other factors, over which GeoVax has no control.
Further information on our risk factors is contained in our periodic reports on Form 10-Q and Form 10-K that we have filed and will file with the SEC. Any forward-looking statement made by us herein speaks only as of the date on which it is made. Factors or events that could cause our actual results to differ may emerge from time to time, and it is not possible for us to predict all of them. We undertake no obligation to publicly update any forward-looking statement, whether as a result of new information, future developments or otherwise, except as may be required by law.
FLORHAM PARK, NJ, May 7, 2025 – Conduent Incorporated (Nasdaq: CNDT), a global technology-led business process solutions and services company, today announced its first quarter 2025 financial results.
Cliff Skelton, Conduent President and Chief Executive Officer stated, “Conduent had a good start to 2025, especially amidst the broad uncertainty in the macro-economic landscape. Our results are in line with internal expectations and consistent with our 2025 outlook with respect to Adjusted Revenue, and
Adjusted EBITDA margins exceeded expectations. New business signings and our Net ARR Activity Metric, both signals of future growth, improved on a year-over-year basis. Operating cash flow comparison was negatively influenced by several one-time events in 2024 which when normalized, was better versus Q1 2024. Fortunately, while macro-economic and geopolitical environments affect everyone, most of our business segments are somewhat insulated from trade and government efficiency challenges, and in some cases, may benefit from opportunities. Our portfolio rationalization efforts are being reinvigorated with additional opportunities and are on track toward achieving more than $1B in deployable capital. Finally, we remain confident in achieving our previously stated 2025 exit rate targets we outlined two years ago.”
Key Financial Q1 2025 Results
($ in millions, except margin and per share data)
Q1 2025
Q1 2024
CurrentQuarterY/Y B/(W)
Revenue
$751
$921
(18.5)%
Adjusted Revenue(1)
$751
$821
(8.5)%
GAAP Net Income (Loss)
$(51)
$99
n/m
Adjusted EBITDA(1)
$37
$36
2.8%
Adjusted EBITDA Margin (1)
4.9%
4.4%
50 bps
GAAP Income (Loss) Before Income Tax
$(56)
$127
n/m
GAAP Diluted EPS
$(0.33)
$0.46
n/m
Adjusted Diluted EPS(1)
$(0.13)
$(0.09)
(44.4)%
Cash Flow from Operating Activities
$(58)
$(37)
(56.8)%
Adjusted Free Cash Flow(1)
$(74)
$(60)
(23.3)%
Performance Commentary
Conduent’s liquidity position at the end of the quarter remained strong with $293 million of cash and our $550 million revolving credit facility largely undrawn.
Pre-tax income (loss) for the first quarter of 2025 was $(56) million versus $127 million in the prior year period. This decrease is primarily driven by the gain on the transfer of the BenefitWallet portfolio in the prior year period.
Q1 2025 Adjusted EBITDA of $37 million and Adjusted EBITDA Margin of 4.9% both increased versus the prior year period and were ahead of our expectations.
Cash Flow from Operating Activities and Adjusted Free Cash Flow, while down year-over-year, are significantly better in Q1 2025 versus Q1 2024 when adjusting for the positive impacts of the tax refund and contributions from divested assets in the prior year period.
Additional Q1 2025 Performance Highlights
Conduent achieved several milestones in technology-led solutions, operational excellence and helping organizations achieve operating efficiencies:
As part of its efficiency and cost reduction initiatives, selected by a leading global logistics company to expand its digital customer experience based on proven outcomes, building on a trusted relationship spanning more than three decades;
Played an integral role in implementing a Congestion Relief Zone in New York City, the first of its kind in the United States, by facilitating the toll transactions and payment processing, helping to reduce traffic and improve air quality for the New York Metropolitan Area;
Launched fraud prevention tool that leverages traditional rules-based AI combined with GenAI to help prevent account take-over fraud in government benefits, initially being used in production for our payment card solutions to prevent fraud;
Awarded a contract by NJ TRANSIT to install state-of-the-art 3D fare gates at two New Jersey stations to modernize and enhance its fare collections and infrastructure;
Launched Conni, an innovative GenAI virtual assistant, designed to strengthen quality of inquiry results and improve customer experience across Conduent platforms for companies and government agencies;
Announced the selections by the Oklahoma State Department of Health and the Republic of Ireland’s Health Service Executive to deploy the company’s Maven system;
Announced a $92 million contract by the Alaska Department of Health, Division of Health Care Services to operate, manage and modernize the state’s MMIS;
For the fourth time, a leading healthcare provider recognized the Company’s for quality, ensuring efficient and effective call handling and delivering top performance through the use of analytics and insights; and
Secured a contract with the Urban Transport Authority for Lima and Callao (ATU) to implement a new transit fare collection system that enables interoperability across all transit options in the city of Lima and allows for new forms of payments including EMV and digital wallets.
FY 2025 Outlook(3)
FY 2024 Actuals
FY 2025 Outlook(3)
Adj. Revenue(1)
$3,176M
$3,100M – $3,250M
Adj. EBITDA(1) / Adj. EBITDA Margin(1)
$124M / 3.9%
4.5% – 5.5%
(1) Refer to Appendix for definition and complete non-GAAP reconciliations of Adjusted Revenue, Adjusted EBITDA, Adjusted EBITDA Margin, Adjusted Diluted EPS and Adjusted Free Cash Flow. (2) Refer to Appendix for definition. (3) Refer to Appendix for additional information regarding non-GAAP outlook.
Conference Call
Management will present the results during a conference call and webcast on May 7, 2025 at 9:00 a.m. ET.
The call will be available by live audio webcast along with the news release and online presentation slides at https://investor.conduent.com/.
The conference call will also be available by calling 877-407-4019 toll-free. If requested, the conference ID for this call is 13752430.
The international dial-in is 1-201-689-8337. The international conference ID is also 13752430.
A recording of the conference call will be available by calling 1-877-660-6853 three hours after the conference call concludes. The replay ID is 13752430.
The telephone recording will be available until May 20, 2025.
About Conduent
Conduent delivers digital business solutions and services spanning the commercial, government and transportation spectrum – creating valuable outcomes for its clients and the millions of people who count on them. The Company leverages cloud computing, artificial intelligence, machine learning, automation and advanced analytics to deliver mission-critical solutions. Through a dedicated global team of approximately 53,000 associates, process expertise and advanced technologies, Conduent’s solutions and services digitally transform its clients’ operations to enhance customer experiences, improve performance, increase efficiencies and reduce costs. Conduent adds momentum to its clients’ missions in many ways including disbursing approximately $85 billion in government payments annually, enabling approximately 2.3 billion customer service interactions annually, empowering millions of employees through HR services every year and processing over 13 million tolling transactions every day. Learn more at www.conduent.com.
Non-GAAP Financial Measures
We have reported our financial results in accordance with accounting principles generally accepted in the U.S. (U.S. GAAP). In addition, we have discussed our financial results using non-GAAP measures. We believe these non-GAAP measures allow investors to better understand the trends in our business and to better understand and compare our results. Accordingly, we believe it is necessary to adjust several reported amounts, determined in accordance with U.S. GAAP, to exclude the effects of certain items as well as their related tax effects. Management believes that these non-GAAP financial measures provide an additional means of analyzing the results of the current period against the corresponding prior period. However, these non-GAAP financial measures should be viewed in addition to, and not as a substitute for, our reported results prepared in accordance with U.S. GAAP. Our non-GAAP financial measures are not meant to be considered in isolation or as a substitute for comparable U.S. GAAP measures and should be read only in conjunction with our Consolidated Financial Statements prepared in accordance with U.S. GAAP. Our management regularly uses our non-GAAP financial measures internally to understand, manage and evaluate our business and make operating decisions. Providing such nonGAAP financial measures to investors allows for a further level of transparency as to how management reviews and evaluates our business results and trends. These non-GAAP measures are among the primary factors management uses in planning for and forecasting future periods. Compensation of our executives is based in part on the performance of our business based on certain of these non-GAAP measures. Refer to the “Non-GAAP Financial Measures” section attached to this release for a discussion of these non-GAAP measures and their reconciliation to the reported U.S. GAAP measures.
Forward-Looking Statements
This press release, any exhibits or attachments to this release, and other public statements we make may contain “forward-looking statements” as defined in the Private Securities Litigation Reform Act of 1995. The words “anticipate,” “believe,” “estimate,” “expect,” “expectations,” “in front of us,” “plan,” “intend,” “will,” “aim,” “should,” “could,” “forecast,” “target,” “may,” “continue to,” “looking to continue,” “endeavor,” “if,” “growing,”
“projected,” “potential,” “likely,” “see,” “ahead,” “further,” “going forward,” “on the horizon,” “as we progress,” “going to,” “path from here forward,” “think,” “path to deliver,” “from here,” “on track,” “remain” and similar expressions (including the negative and plural forms of such words and phrases), as they relate to us, are intended to identify forward-looking statements, but the absence of these words does not mean that a statement is not forward-looking. All statements other than statements of historical fact included in this press release or any attachment to this press release are forward-looking statements, including, but not limited to, statements regarding our financial results, condition and outlook; changes in our operating results; general market and economic conditions; and our projected financial performance, including all statements made under the section captioned “FY 2025 Outlook” within this release. These statements reflect our current views with respect to future events and are subject to certain risks, uncertainties and assumptions, many of which are outside of our control, that could cause actual results to differ materially from those expected or implied by such forward-looking statements contained in this press release, any exhibits to this press release and other public statements we make.
Important factors and uncertainties that could cause our actual results to differ materially from those in our forward-looking statements include, but are not limited to: government appropriations and termination rights contained in our government contracts, the competitiveness of the markets in which we operate and our ability to renew commercial and government contracts, including contracts awarded through competitive bidding processes; our ability to recover capital and other investments in connection with our contracts; our reliance on third-party providers; risk and impact of geopolitical events and increasing geopolitical tensions (such as the war in the Ukraine and conflict in the Middle East), macroeconomic conditions, natural disasters and other factors in a particular country or region on our workforce, customers and vendors; our ability to deliver on our contractual obligations properly and on time; changes in interest in outsourced business process services; claims of infringement of third-party intellectual property rights; our ability to estimate the scope of work or the costs of performance in our contracts; the loss of key senior management and our ability to attract and retain necessary technical personnel and qualified subcontractors; our failure to develop new service offerings and protect our intellectual property rights; our ability to modernize our information technology infrastructure and consolidate data centers; expectations relating to environmental, social and governance considerations; utilization of our stock repurchase program; risks related to our use of artificial intelligence; the failure to comply with laws relating to individually identifiable information and personal health information; the failure to comply with laws relating to processing certain financial transactions, including payment card transactions and debit or credit card transactions; breaches of our information systems or security systems or any service interruptions; risks related to hacking or other cybersecurity threats to our data systems, information systems and network infrastructure and other service interruptions, including relating to the cyber event that took place in January 2025, including Conduent’s investigation of such incident and mitigation and remediation efforts, the nature and extent of such incident, the potential disruption to our business or operations, the potential impact on Conduent’s reputation, and Conduent’s assessments of the likely financial and operational impacts of such incident; our ability to comply with data security standards; developments in various contingent liabilities that are not reflected on our balance sheet, including those arising as a result of being involved in a variety of claims, lawsuits, investigations and proceedings; risks related to recently completed divestitures including (i) the transfer of the Company’s BenefitWallet’s health savings account, medical savings account and flexible spending account portfolio, (ii) the sale of the Company’s Curbside Management and Public Safety Solutions businesses and (iii) the sale of the Company’s Casualty Claims Solutions business, including but not limited to the Company’s ability to realize the benefits anticipated from such transactions, unexpected costs, liabilities or delays in connection with such transactions, and the significant transaction costs associated with such transactions; risk and impact of potential goodwill and other asset impairments; our significant indebtedness and the terms of such indebtedness; our failure to obtain or maintain a satisfactory credit rating and financial performance; our ability to obtain adequate pricing for our services and to improve our cost structure; our ability to collect our receivables, including those for unbilled services; a decline in revenues from, or a loss of, or a reduction in business from or failure of significant clients; fluctuations in our non-recurring revenue; increases in the cost of voice and data services or significant interruptions in such services; our ability to receive dividends or other payments from our subsidiaries; and other factors that are set forth in the “Risk Factors” section, the “Legal Proceedings” section, the “Management’s Discussion and Analysis of
Financial Condition and Results of Operations” section and other sections in our 2024 Annual Report on Form 10-K, as well as in our Quarterly Reports on Form 10-Q and Current Reports on Form 8-K filed with or furnished to the Securities and Exchange Commission. Any forward-looking statements made by us in this release speak only as of the date on which they are made. We are under no obligation to, and expressly disclaim any obligation to, update or alter our forward-looking statements, whether because of new information, subsequent events or otherwise, except as required by law.
First Quarter Revenue of $1.7 Billion with GAAP EPS of $(0.97); Adjusted EPS of $1.06
GAAP Operating Loss of $32 Million; Net Loss of $29 Million; Operating Cash Flow of $57 Million
Adjusted EBITDA of $76 Million; Adjusted Free Cash Flow of $45 Million
Announced Key Supplier Partnerships in Hospitality Industry Enhancing Foundation for Growth
Announced New B2B Customers During Quarter
BOCA RATON, Fla.–(BUSINESS WIRE)–May 7, 2025– The ODP Corporation (“ODP,” or the “Company”) (NASDAQ:ODP), a leading provider of products, services, and technology solutions to businesses and consumers, today announced results for the first quarter ended March 29, 2025.
Consolidated (in millions, except per share amounts)
1Q25
1Q24
Selected GAAP and Non-GAAP measures:
Sales
$1,699
$1,869
Sales change from prior year period
(9)%
Operating income (loss)
$(32)
$41
Adjusted operating income (1)
$54
$66
Net income (loss) from continuing operations
$(29)
$31
Diluted earnings (loss) per share from continuing operations
$(0.97)
$0.83
Adjusted net income from continuing operations (1)
$32
$50
Adjusted earnings per share from continuing operations (fully diluted) (1)
$1.06
$1.31
Adjusted EBITDA (1)
$76
$91
Operating Cash Flow from continuing operations
$57
$44
Free Cash Flow (2)
$36
$13
Adjusted Free Cash Flow (3)
$45
$17
First Quarter 2025 Summary(1)(3)
Total reported sales of $1.7 billion, down 9% versus the prior year period on a reported basis. The decrease in reported sales is largely related to lower sales in its Office Depot Division, primarily due to 46 fewer retail locations in service compared to the previous year and reduced retail and online consumer traffic, as well as lower sales in its ODP Business Solutions Division
GAAP operating loss of $32 million and net loss from continuing operations of $29 million, or $(0.97) per diluted share, versus GAAP operating income of $41 million and net income from continuing operations of $31 million, or $0.83 per diluted share, in the prior year period. GAAP operating results in the first quarter of 2025 included $86 million of charges of which $48 million is related to the Company’s Optimize for Growth restructuring plan
Adjusted operating income of $54 million, compared to $66 million in the first quarter of 2024; adjusted EBITDA of $76 million, compared to $91 million in the first quarter of 2024
Adjusted net income from continuing operations of $32 million, or adjusted diluted earnings per share from continuing operations of $1.06, versus $50 million or $1.31, respectively, in the prior year period
Operating cash flow from continuing operations of $57 million and adjusted free cash flow of $45 million, versus $44 million and $17 million, respectively, in the prior year period
$653 million of total available liquidity including $185 million in cash and cash equivalents at quarter end
“We are off to a better start to the year, with our overall performance reflecting positive momentum and improving trends in the first quarter,” said Gerry Smith, Chief Executive Officer of The ODP Corporation. “We delivered solid operational results as we continued to maintain laser focus on the core business, resulting in EBITDA improving sequentially and free cash flow increasing meaningfully over last year. Our consumer division was a key contributor, driving stronger top-line trends, achieving sequential margin improvements, and continuing to deliver solid cash flow.”
“In our B2B distribution business, while the market remained soft, we’re making significant strides beneath the surface. We’ve recently secured some of the most meaningful new business contracts in our history, including our recently announced agreement with CoreTrust, and the pace of customer onboarding is beginning to accelerate, positioning us to drive stronger monthly performance trends.”
“Additionally, we’re making significant underlying progress on our efforts to serve the hospitality industry, including forging key supplier relationships, preparing our inventory and sales force, and actively engaging with potential new customers. Through our recently announced partnership with a leading hospitality management company, we’re laying the foundation to serve the over 15,000 members within this buying group, and we are having positive discussions with other major industry participants. We believe our progress has us on track to begin driving more meaningful results in the hospitality segment beginning in the second half of this year.”
“In our supply chain business, Veyer continued to deliver exceptional results, achieving over 85% revenue growth from third-party customers and adding significant new accounts to its portfolio.”
“Overall, while there is still substantial work ahead, we are encouraged by the progress we’re making,” added Smith. “We’re also closely monitoring the tariff environment, and while we are not immune to shifts in policy, we have taken actions to help mitigate potential impacts. As we move forward, we remain focused on executing the foundational strategies required to drive success and are confident in our ability to capitalize on the opportunities before us, positioning ODP for sustained, profitable growth in the future. And considering our strong balance sheet, valuable asset base, supply chain and distribution capabilities, and cash flow profile, we believe ODP offers a unique and compelling value proposition for shareholders.”
Consolidated Results
Reported (GAAP) Results Total reported sales for the first quarter of 2025 were $1.7 billion, a decrease of 9% compared with the same period last year, driven primarily by lower sales in both its consumer and business-to-business (“B2B”) divisions. Lower sales in its consumer division, Office Depot, was primarily due to lower retail and online consumer traffic as well as 46 fewer stores in service compared to last year related to planned store closures. Sales at ODP Business Solutions Division were lower compared to last year, largely due to lower demand related to reduced spending, macroeconomic conditions, fewer customers, and severe weather challenges. Meanwhile, Veyer continued to provide strong logistics support for the ODP Business Solutions and Office Depot Divisions on lower internal sales volume, and continued to execute across its growth strategy, delivering supply chain and procurement solutions to third-party customers and driving increases in external revenue.
The Company reported GAAP operating loss of $32 million in the first quarter of 2025, down compared to GAAP operating income of $41 million in the prior year period. Operating results in the first quarter of 2025 included $86 million of charges primarily related to $48 million in restructuring expenses associated with the Optimize for Growth restructuring plan, and $28 million in non-cash asset impairments of operating lease right-of-use (“ROU”) assets associated with the Company’s retail store locations. Additionally, the Company incurred $2 million related to the impairment of operating lease ROU assets associated with the Company’s supply chain facilities, $5 million related to impairment of software, and $3 million related to the impairment of fixed assets. Net loss from continuing operations was $29 million, or $(0.97) per diluted share in the first quarter of 2025, down compared to net income from continuing operations of $31 million, or $0.83 per diluted share in the first quarter of 2024.
Adjusted (non-GAAP) Results(1) Adjusted results for the first quarter of 2025 exclude charges and credits totaling $86 million as described above and the associated tax impacts.
First quarter 2025 adjusted EBITDA was $76 million compared to $91 million in the prior year period. This included adjusted depreciation and amortization of $25 million in both the first quarter of 2025 and 2024
First quarter 2025 adjusted operating income was $54 million, down compared to $66 million in the first quarter of 2024
First quarter 2025 adjusted net income from continuing operations was $32 million, or $1.06 per diluted share, compared to $50 million, or $1.31 per diluted share, in the first quarter of 2024, a decrease of 19% on a per share basis
Division Results
ODP Business Solutions Division Leading B2B distribution solutions provider serving small, medium and enterprise level companies with an annual trailing-twelve-month revenue of $3.5 billion.
Reported sales were $852 million in the first quarter of 2025, down 8% compared to the same period last year. The decrease in sales was related primarily to weaker macroeconomic conditions causing a more cautious business spending environment, lower demand, fewer customers, and severe weather impacts. Severe weather impacts are estimated to account for 80 basis points of the decline in sales
Total adjacency category sales, including cleaning and breakroom, furniture, technology, and copy and print, were 44% of total ODP Business Solutions’ sales
Executed initiatives to convert strong pipeline of potential new business in traditional office supply segments and implemented several initiatives to regain top-line traction, including progress on initiating service for one of the largest contracts in Company history, and winning key new business including its agreement with CoreTrust — a 3,500+ business member purchasing collective serving major industries in manufacturing, retail, hospitality and finance
Made significant progress on establishing presence in new industry segments. Since becoming a key supplier and distribution partner for one of the leading hospitality management companies that includes over 15,000 addressable members, ODP Business Solutions signed agreements with major suppliers in the hospitality industry, including Sobel Westex for premium linens and towels, and Hunter Amenities for a wide range of hotel and guest amenities including liquid beauty products, soaps, dry goods and more. The Company is also engaging in discussions with other major market participants and is making significant progress on its service launch in the $16 billion hospitality industry and expects these efforts to begin to contribute more meaningfully beginning in the second half of the year
Made progress on customer onboarding efforts and expect revenue generation from recent new business wins to ramp up in future quarters
Operating income was $21 million in the first quarter of 2025, down compared to $31 million in the same period last year on a reported basis. EBITDA was $27 million, or 3% on a percentage of sales basis
Office Depot Division Leading provider of retail consumer and small business products and services distributed via Office Depot and OfficeMax retail locations and eCommerce presence.
Reported sales were $838 million in the first quarter of 2025, down 11% compared to the prior year reflecting an improvement over recent prior quarterly trends, as targeted profitable sales strategies gained traction. Overall sales were impacted by 46 fewer retail locations in service associated with planned store closures, as well as lower demand relative to last year in the majority of our product categories, and lower online sales, partially offset by higher average order volumes and the impact of targeted sales promotions. The Company closed 12 retail stores in the quarter and had 857 stores at quarter end. Sales were down 5% on a comparable store basis, representing a meaningful improvement over the 10% decrease in the prior year period
Store and online traffic were lower year over year due to macroeconomic factors causing continued weak consumer activity. Targeted sales promotions resulted in higher average order volumes and sales per shopper, strengthening top-line results and margins
Operating income was $45 million in the first quarter of 2025, compared to operating income of $50 million during the same period last year on a reported basis, driven primarily by the flow through impact from lower sales. On a percentage of sales, operating income remained flat compared to the same period last year
Veyer Division Nationwide supply chain, distribution, procurement and global sourcing operation supporting Office Depot and ODP Business Solutions, as well as third-party customers. Veyer’s assets and capabilities include 8 million square feet of infrastructure through a network of distribution centers, cross-docks, and other facilities throughout the United States; a global sourcing presence in Asia; a large private fleet of vehicles; and business next-day delivery capabilities to 98.5% of U.S. population.
In the first quarter of 2025, Veyer provided support for its internal customers, ODP Business Solutions and Office Depot, as well as its third-party customers, generating reported sales of $1.2 billion
Reported operating income was $8 million in the first quarter of 2025, compared to operating income of $9 million in the prior year period driven by the flow through impact of lower sales to internal customers, partially offset by services to third-party customers
Executed supply chain services for one of the world’s largest social media-focused e-commerce companies to deliver warehousing and fulfillment services for their online sales. Focused on converting strong pipeline of new business and adding key new customers to its portfolio
In the first quarter of 2025, sales generated from third-party customers increased by 89% compared to the same period last year, resulting in sales of $17 million. EBITDA generated from third-party customers was $3 million in the quarter, flat with the prior year period
Balance Sheet and Cash Flow
As of March 29, 2025, ODP had total available liquidity of $653 million, consisting of $185 million in cash and cash equivalents and $468 million of available credit under the Fourth Amended Credit Agreement. Total debt was $262 million.
For the first quarter of 2025, cash provided by operating activities of continuing operations increased to $57 million, which included $10 million in restructuring spend, compared to cash provided by operating activities of continuing operations of $44 million in the first quarter of the prior year, which included $4 million in restructuring spend. The year-over-year increase in operating cash flow is primarily related to operational discipline including strong cash conversion, as well as prudent working capital management helping to offset the impact of lower sales.
Capital expenditures were $21 million in the first quarter of 2025 versus $31 million in the prior year period, as the Company continued to prioritize capital investments towards B2B growth opportunities supporting its supply chain operations, distribution network, and digital capabilities. Adjusted Free Cash Flow(3) was $45 million in the first quarter of 2025, up compared to $17 million in the prior year period.
“Our team’s unwavering commitment to operational discipline drove a significant improvement in cash conversion, resulting in $45 million in adjusted free cash flow for the quarter—a 165% increase compared to the same period last year,” said Adam Haggard, co-CFO of The ODP Corporation. “Looking ahead, we remain focused on prioritizing capital allocation to strategically invest in our core business. This approach positions us to capture opportunities in both our traditional business segments and emerging higher-growth industries, such as hospitality, positioning ODP to pursue sustainable growth and long-term value creation.”
Hospitality Industry Progress
In the first quarter of 2025, ODP Business Solutions announced a strategic partnership with one of the world’s largest hotel management organizations, becoming a preferred provider for Operating Supplies & Equipment (“OS&E”). This agreement positions ODP as a reliable distribution partner, supporting the recurring in-room hotel supply needs of its over 15,000 members. By ensuring seamless operations, efficient room resets, and exceptional guest experiences, this partnership underscores ODP’s evolution beyond office supplies and highlights its ability to deliver tailored solutions to businesses in the hospitality, healthcare, and adjacent sectors.
Building on this momentum, ODP Business Solutions has established key agreements with leading suppliers in the hospitality industry, including Sobel Westex and Hunter Amenities, providing access to high quality products to allow ODP to better serve the hospitality industry. Sobel Westex, a global leader in hospitality and retail textiles, will provide to ODP premium products such as pillows, plush terry towels, high-quality linens, blankets, pool towels, and spa-like robes—creating a luxurious and inviting atmosphere for guests. Similarly, Hunter Amenities, a pioneer in personal care and hospitality manufacturing for over four decades, will offer to ODP its portfolio of high-end personal care products, elevating guest experiences.
“We are making significant progress in expanding our presence in the hospitality industry,” said Gerry Smith, CEO of The ODP Corporation. “By building critical relationships with top-tier suppliers, procuring in-demand inventory, and engaging with additional key market participants, we are laying the foundation for meaningful growth in the future. We are excited about the opportunities ahead and expect these efforts to begin contributing more meaningfully to our results starting in the second half of 2025.”
“Optimize for Growth” B2B Revenue Acceleration Plan
The Company made progress on its “Optimize for Growth” restructuring plan. This initiative focuses on capitalizing on ODP’s core strengths — including its supply chain and procurement expertise, robust distribution network, and strong B2B customer base — to accelerate growth in the B2B distribution and third-party logistics (3PL) market segments, while reducing retail exposure and associated liabilities. The plan strategically realigns the Company’s organizational structure, product offerings, and go-to-market strategies to target high-growth opportunities in the B2B market, while also expanding into new enterprise segments, including hospitality, healthcare, and adjacent sectors.
As part of the plan, ODP is prioritizing investments in resources and infrastructure critical to its growth in the B2B sector, while reducing fixed costs associated with retail operations, including store and distribution center leases. Concurrently, the Company has suspended growth investments in its consumer business as it continues to optimize its retail store footprint. Despite reduced retail growth investments, ODP remains firmly committed to supporting and providing an exceptional service experience at its active retail locations, ensuring that customers continue to receive the top-tier care they expect.
In connection with this plan in the first quarter of 2025, the Company recognized $48 million of restructuring expense primarily related to severance costs and the closure of 9 retail stores. In total for multi-year life of the plan, the Company expects to incur costs in the range of $185 million to $230 million, which we anticipate will generate approximately $380 million in EBITDA improvement and generate over $1.3 billion in total value over the multi-year life of the plan.
The ODP Corporation will webcast a call with financial analysts and investors on May 7, 2025, at 9:00 am Eastern Time, which will be accessible to the media and the general public. To listen to the conference call via webcast, please visit The ODP Corporation’s Investor Relations website at investor.theodpcorp.com. A replay of the webcast will be available approximately two hours following the event.
(1)
As presented throughout this release, adjusted results represent non-GAAP financial measures and exclude charges or credits not indicative of core operations and the tax effect of these items, which may include but not be limited to merger integration, restructuring, acquisition costs, and asset impairments. Reconciliations from GAAP to non-GAAP financial measures can be found in this release as well as on the Company’s Investor Relations website at investor.theodpcorp.com.
(2)
As used in this release, Free Cash Flow is defined as cash flows from operating activities less capital expenditures and changes in restricted cash. Free Cash Flow is a non-GAAP financial measure and reconciliations from GAAP financial measures can be found in this release as well as on the Company’s Investor Relations website at investor.theodpcorp.com.
(3)
As used in this release, Adjusted Free Cash Flow is defined as Free Cash Flow excluding cash charges associated with the Company’s restructuring programs, and related expenses. Adjusted Free Cash Flow is a non-GAAP financial measure and reconciliations from GAAP financial measures can be found in this release as well as on the Company’s Investor Relations website at investor.theodpcorp.com.
About The ODP Corporation
The ODP Corporation (NASDAQ:ODP) is a leading provider of products, services and technology solutions through an integrated business-to-business (B2B) distribution platform and omni-channel presence, which includes supply chain and distribution operations, dedicated sales professionals, online presence, and a network of Office Depot and OfficeMax retail stores. Through its operating companies ODP Business Solutions, LLC; Office Depot, LLC; and Veyer, LLC, The ODP Corporation empowers every business, professional, and consumer to achieve more every day. For more information, visit theodpcorp.com.
This communication may contain forward-looking statements within the meaning of the Private Securities Litigation Reform Act of 1995. These statements or disclosures may discuss goals, intentions and expectations as to future trends, plans, events, results of operations, cash flow or financial condition, or state other information relating to, among other things, the Company, based on current beliefs and assumptions made by, and information currently available to, management. Forward-looking statements generally will be accompanied by words such as “anticipate,” “believe,” “plan,” “could,” “estimate,” “expect,” “forecast,” “guidance,” “expectations”, “outlook,” “intend,” “may,” “possible,” “potential,” “predict,” “project,” “propose” or other similar words, phrases or expressions, or other variations of such words. These forward-looking statements are subject to various risks and uncertainties, many of which are outside of the Company’s control. There can be no assurances that the Company will realize these expectations or that these beliefs will prove correct, and therefore investors and stakeholders should not place undue reliance on such statements. Factors that could cause actual results to differ materially from those in the forward-looking statements include, among other things, highly competitive office products market and failure to differentiate the Company from other office supply resellers or respond to decline in general office supplies sales or to shifting consumer demands; competitive pressures on the Company’s sales and pricing; the risk that the Company is unable to transform the business into a service-driven, B2B platform or that such a strategy will not result in the benefits anticipated; the risk that the Company will not be able to achieve the expected benefits of its strategic plans, including charges and benefits related to Optimize for Growth, Project Core and other strategic restructurings or initiatives; the risk that the Company may not be able to realize the anticipated benefits of acquisitions due to unforeseen liabilities, future capital expenditures, expenses, indebtedness and the unanticipated loss of key customers or the inability to achieve expected revenues, synergies, cost savings or financial performance; failure to effectively manage the Company’s real estate portfolio; loss of business with government entities, purchasing consortiums, and sole- or limited- source distribution arrangements; failure to attract and retain qualified personnel, including employees in stores, service centers, distribution centers, field and corporate offices and executive management, and the inability to keep supply of skills and resources in balance with customer demand; failure to execute effective advertising efforts and maintain the Company’s reputation and brand at a high level; disruptions in computer systems, including delivery of technology services; breach of information technology systems affecting reputation, business partner and customer relationships and operations and resulting in high costs and lost revenue; unanticipated downturns in business relationships with customers or terms with the suppliers, third-party vendors and business partners; disruption of global sourcing activities, evolving foreign trade policy (including tariffs imposed on certain foreign made goods); exclusive Office Depot branded products are subject to additional product, supply chain and legal risks; product safety and quality concerns of manufacturers’ branded products and services and Office Depot private branded products; covenants in the credit facility; general disruption in the credit markets; incurrence of significant impairment charges; retained responsibility for liabilities of acquired companies; fluctuation in quarterly operating results due to seasonality of the Company’s business; changes in tax laws in jurisdictions where the Company operates; increases in wage and benefit costs and changes in labor regulations; changes in the regulatory environment, legal compliance risks and violations of the U.S. Foreign Corrupt Practices Act and other worldwide anti-bribery laws; volatility in the Company’s common stock price; changes in or the elimination of the payment of cash dividends on Company common stock; macroeconomic conditions such as higher interest rates and future declines in business or consumer spending; increases in fuel and other commodity prices and the cost of material, energy and other production costs, or unexpected costs that cannot be recouped in product pricing; unexpected claims, charges, litigation, dispute resolutions or settlement expenses; catastrophic events, including the impact of weather events on the Company’s business; the discouragement of lawsuits by shareholders against the Company and its directors and officers as a result of the exclusive forum selection of the Court of Chancery, the federal district court for the District of Delaware or other Delaware state courts by the Company as the sole and exclusive forum for such lawsuits; and the impact of the COVID-19 pandemic on the Company’s business. The foregoing list of factors is not exhaustive. Investors and shareholders should carefully consider the foregoing factors and the other risks and uncertainties described in the Company’s Annual Reports on Form 10-K, Quarterly Reports on Form 10-Q, and Current Reports on Form 8-K filed with the U.S. Securities and Exchange Commission. The Company does not assume any obligation to update or revise any forward-looking statements.
BOCA RATON, Fla.–(BUSINESS WIRE)–May 7, 2025– The GEO Group, Inc. (NYSE: GEO) (“GEO”), a leading provider of contracted support services for secure facilities, processing centers, and reentry centers, as well as enhanced in-custody rehabilitation, post-release support, and electronic monitoring programs, reported today its financial results for the first quarter of 2025.
First Quarter 2025 Highlights
Total revenues of $604.6 million
Net Income of $19.6 million
Net Income Attributable to GEO of $0.14 per diluted share
Adjusted EBITDA of $99.8 million
For the first quarter 2025, we reported net income attributable to GEO of $19.6 million, or $0.14 per diluted share, compared to net income attributable to GEO of $22.7 million, or $0.14 per diluted share, for the first quarter 2024. We reported total revenues for the first quarter 2025 of $604.6 million compared to $605.7 million for the first quarter 2024. We reported first quarter 2025 Adjusted EBITDA of $99.8 million, compared to $117.6 million for the first quarter 2024.
Our first quarter of 2025 results reflect an increase of approximately $5 million in general and administrative expenses compared to the first quarter of 2024, which was partly the result of the previously announced reorganization of our management team in anticipation of future growth projects and related operational activity during 2025. Compared to the fourth quarter of 2024, our first quarter 2025 results also reflect approximately $6 million in higher payroll taxes, which are front loaded in the first quarter of each year.
George C. Zoley, Executive Chairman of GEO, said, “We are pleased with the progress we have made towards meeting our growth and capital allocation objectives. During the first quarter of 2025, we announced two important contract awards for the reactivation of two company-owned facilities totaling 2,800 beds and representing in excess of $130 million in annualized revenues. We believe we have an unprecedented opportunity to assist the federal government in meeting its expanded immigration enforcement priorities. We have taken several important steps to be prepared to meet that opportunity, including making a significant investment commitment of $70 million to strengthen our capabilities to deliver expanded detention capacity, secure transportation, and electronic monitoring services to ICE and the federal government. We also recently completed a reorganization of our senior management team to oversee the operational execution of this expected future growth activity.”
“As a result of these steps, our financial guidance for 2025 reflects a tale of two halves of the year. The first half of the year is expected to be impacted by higher overhead and operating expenses as well as increased capital expenditures to position our company for future growth, which is expected to begin to layer in during the second half of 2025 and normalize in 2026. We also remain focused on reducing our net debt, deleveraging our balance sheet, and positioning our company to explore opportunities to return capital to shareholders in the future. In 2025, we expect to reduce our total net debt by approximately $150 million to $175 million, bringing our total net debt to approximately $1.54 billion,” Zoley added.
Financial Guidance
Today, we updated our initial financial guidance for 2025. Consistent with our long-standing practice, our updated guidance does not include the impact of any new contract awards that have not been previously announced.
The first half of 2025 reflects higher overhead and operating expenses as well as higher capital expenditures to position our company for anticipated future revenue growth without corresponding revenues, with growth beginning to layer in during the second half of 2025.
For the full year 2025, we expect Net Income Attributable to GEO to be in a range of $0.77 to $0.89 per diluted share, on revenues of approximately $2.53 billion and based on an effective tax rate of approximately 27 percent, inclusive of known discrete items. We expect our full year 2025 Adjusted EBITDA to be between $465 million and $490 million.
For the second quarter of 2025, we expect Net Income Attributable to GEO to be in a range of $0.15 to $0.17 per diluted share, on quarterly revenues of $615 million to $625 million. We expect our second quarter 2025 Adjusted EBITDA to be between $110 million and $114 million.
While our guidance does not include an assumption for new contract awards that have not been previously announced, we anticipate several opportunities to materialize during the year with additional contracts awards expected to be announced during the second quarter of 2025. As we progress through the year and these growth opportunities materialize, we will continue to adjust our financial guidance accordingly.
We expect total Capital Expenditures for the full year 2025 to be between $120 million and $135 million, including the impact of the $70 million investment we announced in December of 2024 to strengthen our capabilities to deliver expanded detention capacity, secure transportation, and electronic monitoring services to ICE and the federal government.
Recent Developments
On February 27, 2025, we announced a 15-year contract with ICE to provide support services for the establishment of a federal immigration processing center at the company-owned, 1,000-bed Delaney Hall Facility in Newark, New Jersey. GEO’s support services include the exclusive use of the Delaney Hall Facility by ICE, along with security, maintenance, and food services, as well as access to recreational amenities, medical care, and legal counsel. The new support services contract is expected to generate in excess of $60 million in annualized revenues for GEO in the first full year of operations, with margins consistent with GEO’s company-owned Secure Services facilities.
On March 10, 2025, we announced a contract modification of the current intergovernmental service agreement for the GEO-owned, 1,328-bed Karnes ICE Processing Center in Karnes City, Texas to transition the Karnes ICE Processing Center from housing single adults to housing mixed populations. Subsequently, ICE decided to continue to house single adults at the Karnes ICE Processing Center based on an assessment of the agency’s current needs.
On March 20, 2025, we announced a contract with ICE for the immediate activation of a federal immigration processing center at the GEO-owned, 1,800-bed North Lake Facility in Baldwin, Michigan. GEO and ICE expect to finalize a multi-year contract for GEO to provide support services for ICE at the North Lake Facility that would be expected to generate in excess of $70 million in annualized revenues in the first full year of operations, with margins consistent with GEO’s company-owned Secure Services facilities. GEO’s support services are expected to include the exclusive use of the North Lake Facility by ICE, along with security, maintenance, and food services, as well as access to recreational amenities, medical care, and legal counsel.
Balance Sheet
At the end of the first quarter of 2025, our net debt totaled approximately $1.68 billion, and our net leverage was approximately 3.78 times Adjusted EBITDA. We ended the first quarter of 2025 with approximately $65 million in cash and cash equivalents and approximately $235 million in total available liquidity.
Conference Call Information
We have scheduled a conference call and webcast for today at 11:00 AM (Eastern Time) to discuss our first quarter 2025 financial results as well as our outlook. The call-in number for the U.S. is 1-877-250-1553 and the international call-in number is 1-412-542-4145. In addition, a live audio webcast of the conference call may be accessed on the Webcasts section under the News, Events and Reports tab of GEO’s investor relations webpage at investors.geogroup.com. A replay of the webcast will be available on the website for one year. A telephonic replay of the conference call will be available through May 14, 2025, at 1-877-344-7529 (U.S.) and 1-412-317-0088 (International). The participant passcode for the telephonic replay is 7721870.
About The GEO Group
The GEO Group, Inc. (NYSE: GEO) is a leading diversified government service provider, specializing in design, financing, development, and support services for secure facilities, processing centers, and community reentry centers in the United States, Australia, South Africa, and the United Kingdom. GEO’s diversified services include enhanced in-custody rehabilitation and post-release support through the award-winning GEO Continuum of Care®, secure transportation, electronic monitoring, community-based programs, and correctional health and mental health care. GEO’s worldwide operations include the ownership and/or delivery of support services for 98 facilities totaling approximately 77,000 beds, including idle facilities and projects under development, with a workforce of up to approximately 18,000 employees.
Reconciliation Tables and Supplemental Information
GEO has made available Supplemental Information which contains reconciliation tables of Net Income Attributable to GEO to Adjusted Net Income, and Net Income to EBITDA and Adjusted EBITDA, along with supplemental financial and operational information on GEO’s business and other important operating metrics. The reconciliation tables are also presented herein. Please see the section below titled “Note to Reconciliation Tables and Supplemental Disclosure – Important Information on GEO’s Non-GAAP Financial Measures” for information on how GEO defines these supplemental Non-GAAP financial measures and reconciles them to the most directly comparable GAAP measures. GEO’s Reconciliation Tables can be found herein and in GEO’s Supplemental Information available on GEO’s investor webpage at investors.geogroup.com.
Note to Reconciliation Tables and Supplemental Disclosure – Important Information on GEO’s Non-GAAP Financial Measures
Adjusted Net Income, EBITDA, and Adjusted EBITDA are non-GAAP financial measures that are presented as supplemental disclosures. GEO has presented herein certain forward-looking statements about GEO’s future financial performance that include non-GAAP financial measures, including Net Debt, Net Leverage, and Adjusted EBITDA. The determination of the amounts that are included or excluded from these non-GAAP financial measures is a matter of management judgment and depends upon, among other factors, the nature of the underlying expense or income amounts recognized in a given period.
While we have provided a high level reconciliation for the guidance ranges for full year 2025, we are unable to present a more detailed quantitative reconciliation of the forward-looking non-GAAP financial measures to their most directly comparable forward-looking GAAP financial measures because management cannot reliably predict all of the necessary components of such GAAP measures. The quantitative reconciliation of the forward-looking non-GAAP financial measures will be provided for completed annual and quarterly periods, as applicable, calculated in a consistent manner with the quantitative reconciliation of non-GAAP financial measures previously reported for completed annual and quarterly periods.
Net Debt is defined as gross principal debt less cash from restricted subsidiaries. Net Leverage is defined as Net Debt divided by Adjusted EBITDA.
EBITDA is defined as net income adjusted by adding provisions for income tax, interest expense, net of interest income, and depreciation and amortization. Adjusted EBITDA is defined as EBITDA adjusted for net loss attributable to non-controlling interests, stock-based compensation expenses, pre-tax, start-up expenses, pre-tax, transaction fees, pre-tax, ATM equity program expenses, pre-tax, close-out expenses, pre-tax, other non-cash revenue and expenses, pre-tax, and certain other adjustments as defined from time to time.
Given the nature of our business as a real estate owner and operator, we believe that EBITDA and Adjusted EBITDA are helpful to investors as measures of our operational performance because they provide an indication of our ability to incur and service debt, to satisfy general operating expenses, to make capital expenditures, and to fund other cash needs or reinvest cash into our business.
We believe that by removing the impact of our asset base (primarily depreciation and amortization) and excluding certain non-cash charges, amounts spent on interest and taxes, and certain other charges that are highly variable from year to year, EBITDA and Adjusted EBITDA provide our investors with performance measures that reflect the impact to operations from trends in occupancy rates, per diem rates and operating costs, providing a perspective not immediately apparent from net income.
The adjustments we make to derive the non-GAAP measures of EBITDA and Adjusted EBITDA exclude items which may cause short-term fluctuations in income from continuing operations and which we do not consider to be the fundamental attributes or primary drivers of our business plan and they do not affect our overall long-term operating performance.
EBITDA and Adjusted EBITDA provide disclosure on the same basis as that used by our management and provide consistency in our financial reporting, facilitate internal and external comparisons of our historical operating performance and our business units and provide continuity to investors for comparability purposes.
Adjusted Net Income is defined as net income attributable to GEO adjusted for certain items which by their nature are not comparable from period to period or that tend to obscure GEO’s actual operating performance, including for the periods presented loss on the extinguishment of debt, pre-tax, start-up expenses, pre-tax, transaction fees, pre-tax, ATM equity program expenses, pre-tax, close-out expenses, pre-tax, and tax effect of adjustments to net income attributable to GEO.
Safe-Harbor Statement
This press release contains forward-looking statements regarding future events and future performance of GEO that involve risks and uncertainties that could materially and adversely affect actual results, including statements regarding GEO’s financial guidance for second quarter and the full year of 2025, statements regarding GEO’s focus on reducing net debt, deleveraging its balance sheet, positioning itself to explore options to return capital to shareholders in the future, making investments to strengthen GEO’s capabilities and deliver expanded detention capacity, secure transportation, and electronic monitoring services, pursuing unprecedented future growth opportunities and significant operational activity, and the upside this could have on GEO’s future financial results and financial guidance, and GEO’s ability to scale up the delivery of diversified services to support the future needs of its government agency partners. Forward-looking statements generally can be identified by the use of forward-looking terminology such as “may,” “will,” “expect,” “anticipate,” “intend,” “plan,” “believe,” “seek,” “estimate,” or “continue” or the negative of such words and similar expressions. Risks and uncertainties that could cause actual results to vary from current expectations and forward-looking statements contained in this press release include, but are not limited to: (1) GEO’s ability to meet its financial guidance for second quarter and full year 2025 given the various risks to which its business is exposed; (2) GEO’s ability to deleverage and repay, refinance or otherwise address its debt maturities in an amount and on terms commercially acceptable to GEO, and on the timeline it expects or at all; (3) GEO’s ability to identify and successfully complete any potential sales of company-owned assets and businesses or potential acquisitions of assets or businesses on commercially advantageous terms on a timely basis, or at all; (4) changes in federal and state government policy, orders, directives, legislation and regulations that affect public-private partnerships with respect to secure, correctional and detention facilities, processing centers and reentry centers; (5) changes in federal immigration policy; (6) public and political opposition to the use of public-private partnerships with respect to secure correctional and detention facilities, processing centers and reentry centers; (7) any continuing impact of the COVID-19 global pandemic on GEO and GEO’s ability to mitigate the risks associated with COVID-19; (8) GEO’s ability to sustain or improve company-wide occupancy rates at its facilities; (9) fluctuations in GEO’s operating results, including as a result of contract activations, contract terminations, contract renegotiations, changes in occupancy levels and increases in GEO’s operating costs; (10) general economic and market conditions, including changes to governmental budgets and its impact on new contract terms, contract renewals, renegotiations, per diem rates, fixed payment provisions, and occupancy levels; (11) GEO’s ability to address inflationary pressures related to labor related expenses and other operating costs; (12) GEO’s ability to timely open facilities as planned, profitably manage such facilities and successfully integrate such facilities into GEO’s operations without substantial costs; (13) GEO’s ability to win management contracts for which it has submitted proposals and to retain existing management contracts; (14) risks associated with GEO’s ability to control operating costs associated with contract start-ups; (15) GEO’s ability to successfully pursue growth opportunities and continue to create shareholder value; (16) GEO’s ability to obtain financing or access the capital markets in the future on acceptable terms or at all; and (17) other factors contained in GEO’s Securities and Exchange Commission periodic filings, including its Form 10-K, 10-Q and 8-K reports, many of which are difficult to predict and outside of GEO’s control.
First quarter sales of $170 million, EPS of $(0.09), Adjusted EBITDA of $5.8 million Significantly improved free cash flow enables further debt paydown Updates guidance for full year 2025
NEW ALBANY, Ohio, May 06, 2025 (GLOBE NEWSWIRE) — CVG (NASDAQ: CVGI), a diversified industrial products and services company, today announced financial results for its first quarter ended March 31, 2025.
During the quarter, the Company completed a strategic reorganization of its operations into three segments: Global Seating, Global Electrical Systems, and Trim Systems and Components. The results and comparisons presented below reflect continuing operations unless otherwise noted.
First Quarter 2025 Highlights(Results from Continuing Operations; compared with prior year, where comparisons are noted)
Revenues of $169.8 million, down 12.7%, primarily due to softening in global Construction and Agriculture markets and North America Class 8 truck demand.
Operating income of $1.4 million, adjusted operating income of $2.1 million, down compared to operating income of $4.5 million and adjusted operating income of $6.3 million. The decrease in operating income was driven primarily by lower sales volumes offset by reductions in SG&A expense.
Net loss from continuing operations of $3.1 million, or $(0.09) per diluted share and adjusted net loss of $2.6 million, or $(0.08) per diluted share, compared to net income from continuing operations of $1.4 million, or $0.05 per diluted share and adjusted net income of $2.8 million, or $0.08 per diluted share.
Adjusted EBITDA of $5.8 million, down 40.2%, with an adjusted EBITDA margin of 3.4%, down from 5.0%.
Free cash flow of $11.2 million, up $17.7 million, due to better working capital management. Net debt decreased $11.7 million compared to the year end 2024 level.
Gross margin expansion of 250 basis points versus Q4 2024 due to operational efficiency improvements and conclusion of one-time cost drivers from 2024.
James Ray, President and Chief Executive Officer, said, “Our first quarter results demonstrate sequential improvement in margins and free cash flow. Cash generation and debt paydown remain key priorities for CVG, as we look to build on our strong free cash performance in the first quarter through further margin improvement, working capital reduction, and reduced capital expenditures. We are beginning to see the benefits of efforts made in 2024, including strategic divestments of non-core businesses, to transform CVG. These divestitures, as well as our priority on improving operational efficiency, have allowed us to streamline operations, lower our cost structure, and drive cash generation to pay down debt. Despite industry-wide and global macroeconomic headwinds, we are prioritizing strong execution from the top down within CVG focused on cost mitigation, margin improvement, and operational efficiency.”
Mr. Ray continued, “The actions we took last year position us well for the future. Change management is always difficult, and I would personally like to thank the entire CVG team for their efforts throughout the process. I would like to thank Bob Griffin, our current Chairman, for his contributions to CVG’s strategic goals and priorities over the years. I am also excited to continue working with Bill Johnson, a current board member who is expected to become the Chairman of the Board following Mr. Griffin’s retirement, effective May 15, 2025. While we acknowledge the current macroeconomic uncertainties and geopolitical environment, the transformation undertaken in 2024 makes CVG a lower cost, more nimble company, better positioned to navigate these challenges. We are committed to execution, delivery, and driving operational efficiency, while managing the potential impact of trade policy.”
Andy Cheung, Chief Financial Officer, added, “We are encouraged by the quarter-over-quarter improvement in our financial performance, as we start to see the benefits of our strategic portfolio realignment and operational efficiency efforts. However, given the economic environment and policy concerns, we are adjusting our outlook to reflect current market conditions. Our focused portfolio, now more closely aligned with our customers through our re-segmentation, positions us for improved value capture as end markets recover.”
First Quarter Financial Results from Continuing Operations (amounts in millions except per share data and percentages)
Consolidated Results from Continuing Operations
First Quarter 2025 Results
First quarter 2025 revenues were $169.8 million, compared to $194.6 million in the prior year period, a decrease of 12.7%. The overall decrease in revenues was due to lower sales as a result of a softening in customer demand across all segments.
Operating income in the first quarter 2025 was $1.4 million compared to $4.5 million in the prior year period. The decrease in operating income was attributable to the impact of lower sales volumes. First quarter 2025 adjusted operating income was $2.1 million, compared to $6.3 million in the prior year period.
Interest associated with debt and other expenses was $2.5 million and $2.2 million for the first quarter 2025 and 2024, respectively.
Net loss from continuing operations was $3.1 million, or $(0.09) per diluted share, for the first quarter 2025 compared to net income of $1.4 million, or $0.05 per diluted share, in the prior year period. First quarter 2025 adjusted net loss from continuing operations was $2.6 million, or $(0.08) per diluted share, compared to adjusted net income of $2.8 million, or $0.08 per diluted share.
On March 31, 2025, the Company had $32.4 million of outstanding borrowings on its U.S. revolving credit facility and no outstanding borrowings on its China credit facility, $20.2 million of cash and $102.5 million of availability from the credit facilities (subject to covenant limitations), resulting in total liquidity of $122.7 million.
First Quarter 2025 Segment Results
Global Seating Segment
Revenues were $73.4 million compared to $80.8 million for the prior year period, a decrease of 9.1%, due to lower sales volume as a result of decreased customer demand.
Operating income was $2.7 million, compared $2.8 million in the prior year period, a decrease of 3.0%, primarily attributable to lower sales volume and increased freight costs. First quarter 2025 adjusted operating income was $2.7 million compared to $2.8 million in the prior year period.
Global Electrical Systems Segment
Revenues were $50.5 million compared to $58.7 million in the prior year period, a decrease of 14.1%, primarily as a result of decreased customer demand.
Operating loss was $0.3 million compared to operating income of $0.4 million in the prior year period. The decrease in operating income was primarily attributable to lower sales volumes and unfavorable foreign exchange impacts. First quarter 2025 adjusted operating income was $0.2 million compared to $1.5 million in the prior year period.
Trim Systems and Components Segment
Revenues were $45.9 million compared to $55.1 million in the prior year period, a decrease of 16.6%, primarily as a result of decreased customer demand.
Operating income was $1.5 million compared to $4.2 million in the prior year period, a decrease of 63.5%. The decrease in operating income was primarily attributable to lower sales volume and increased freight costs. First quarter 2025 adjusted operating income was $1.6 million compared to $4.7 million in the prior year period.
Outlook
CVG updated the Company’s outlook for the full year 2025, based on current market conditions:
This outlook reflects, among others, current industry forecasts for North America Class 8 truck builds. According to ACT Research, 2025 North American Class 8 truck production levels are expected to be at 255,000 units. The 2024 actual Class 8 truck builds according to the ACT Research was 332,372 units.
Construction and Agriculture end markets are projected to decline approximately 5-15% in 2025. However, we expect the contribution from new business wins outside of Construction and Agriculture end markets in Electrical Systems to soften this decline.
GAAP to Non-GAAP Reconciliation
A reconciliation of GAAP to non-GAAP financial measures referenced in this release is included as Appendix A to this release.
Conference Call
A conference call to discuss this press release is scheduled for Wednesday, May 7, 2025, at 8:30 a.m. ET. Management intends to reference the Q1 2025 Earnings Call Presentation during the conference call. To participate, dial (800) 549-8228 using conference code 57416. International participants dial (289) 819-1520 using conference code 57416.
This call is being webcast and can be accessed through the “Investors” section of CVG’s website at ir.cvgrp.com, where it will be archived for one year.
A telephonic replay of the conference call will be available for a period of two weeks following the call. To access the replay, dial (888) 660-6264 using access code 57416#.
Company Contact Andy Cheung Chief Financial Officer CVG IR@cvgrp.com
Investor Relations Contact Ross Collins or Stephen Poe Alpha IR Group CVGI@alpha-ir.com
About CVG
CVG is a global provider of systems, assemblies and components to the global commercial vehicle market and the electric vehicle market. We deliver real solutions to complex design, engineering and manufacturing problems while creating positive change for our customers, industries and communities we serve. Information about the Company and its products is available on the internet at www.cvgrp.com.
Forward-Looking Statements
This press release contains forward-looking statements that are subject to risks and uncertainties. These statements often include words such as “believe”, “anticipate”, “plan”, “expect”, “intend”, “will”, “should”, “could”, “would”, “project”, “continue”, “likely”, and similar expressions. In particular, this press release may contain forward-looking statements about the Company’s expectations for future periods with respect to its plans to improve financial results, the future of the Company’s end markets, changes in the Class 8 and Class 5-7 North America truck build rates, performance of the global construction and agricultural equipment business, the Company’s prospects in the wire harness, and electric vehicle markets, the Company’s initiatives to address customer needs, organic growth, the Company’s strategic plans and plans to focus on certain segments, competition faced by the Company, volatility in and disruption to the global economic environment and the Company’s financial position or other financial information. These statements are based on certain assumptions that the Company has made in light of its experience as well as its perspective on historical trends, current conditions, expected future developments and other factors it believes are appropriate under the circumstances. Actual results may differ materially from the anticipated results because of certain risks and uncertainties, including those included in the Company’s filings with the SEC. There can be no assurance that statements made in this press release relating to future events will be achieved. The Company undertakes no obligation to update or revise forward-looking statements to reflect changed assumptions, the occurrence of unanticipated events or changes to future operating results over time. All subsequent written and oral forward-looking statements attributable to the Company or persons acting on behalf of the Company are expressly qualified in their entirety by such cautionary statements.
Other Information
Throughout this document, certain numbers in the tables or elsewhere may not sum due to rounding. Rounding may have also impacted the presentation of certain year-on-year percentage changes.

")